Effect of Heat Wave Conditions on Aerosol Optical Properties Derived from Satellite and Ground-Based Remote Sensing over Poland


Abstract
:
1. Introduction
2. Methodology
2.1. Retrieval of Optical Properties from Raman Lidar Data
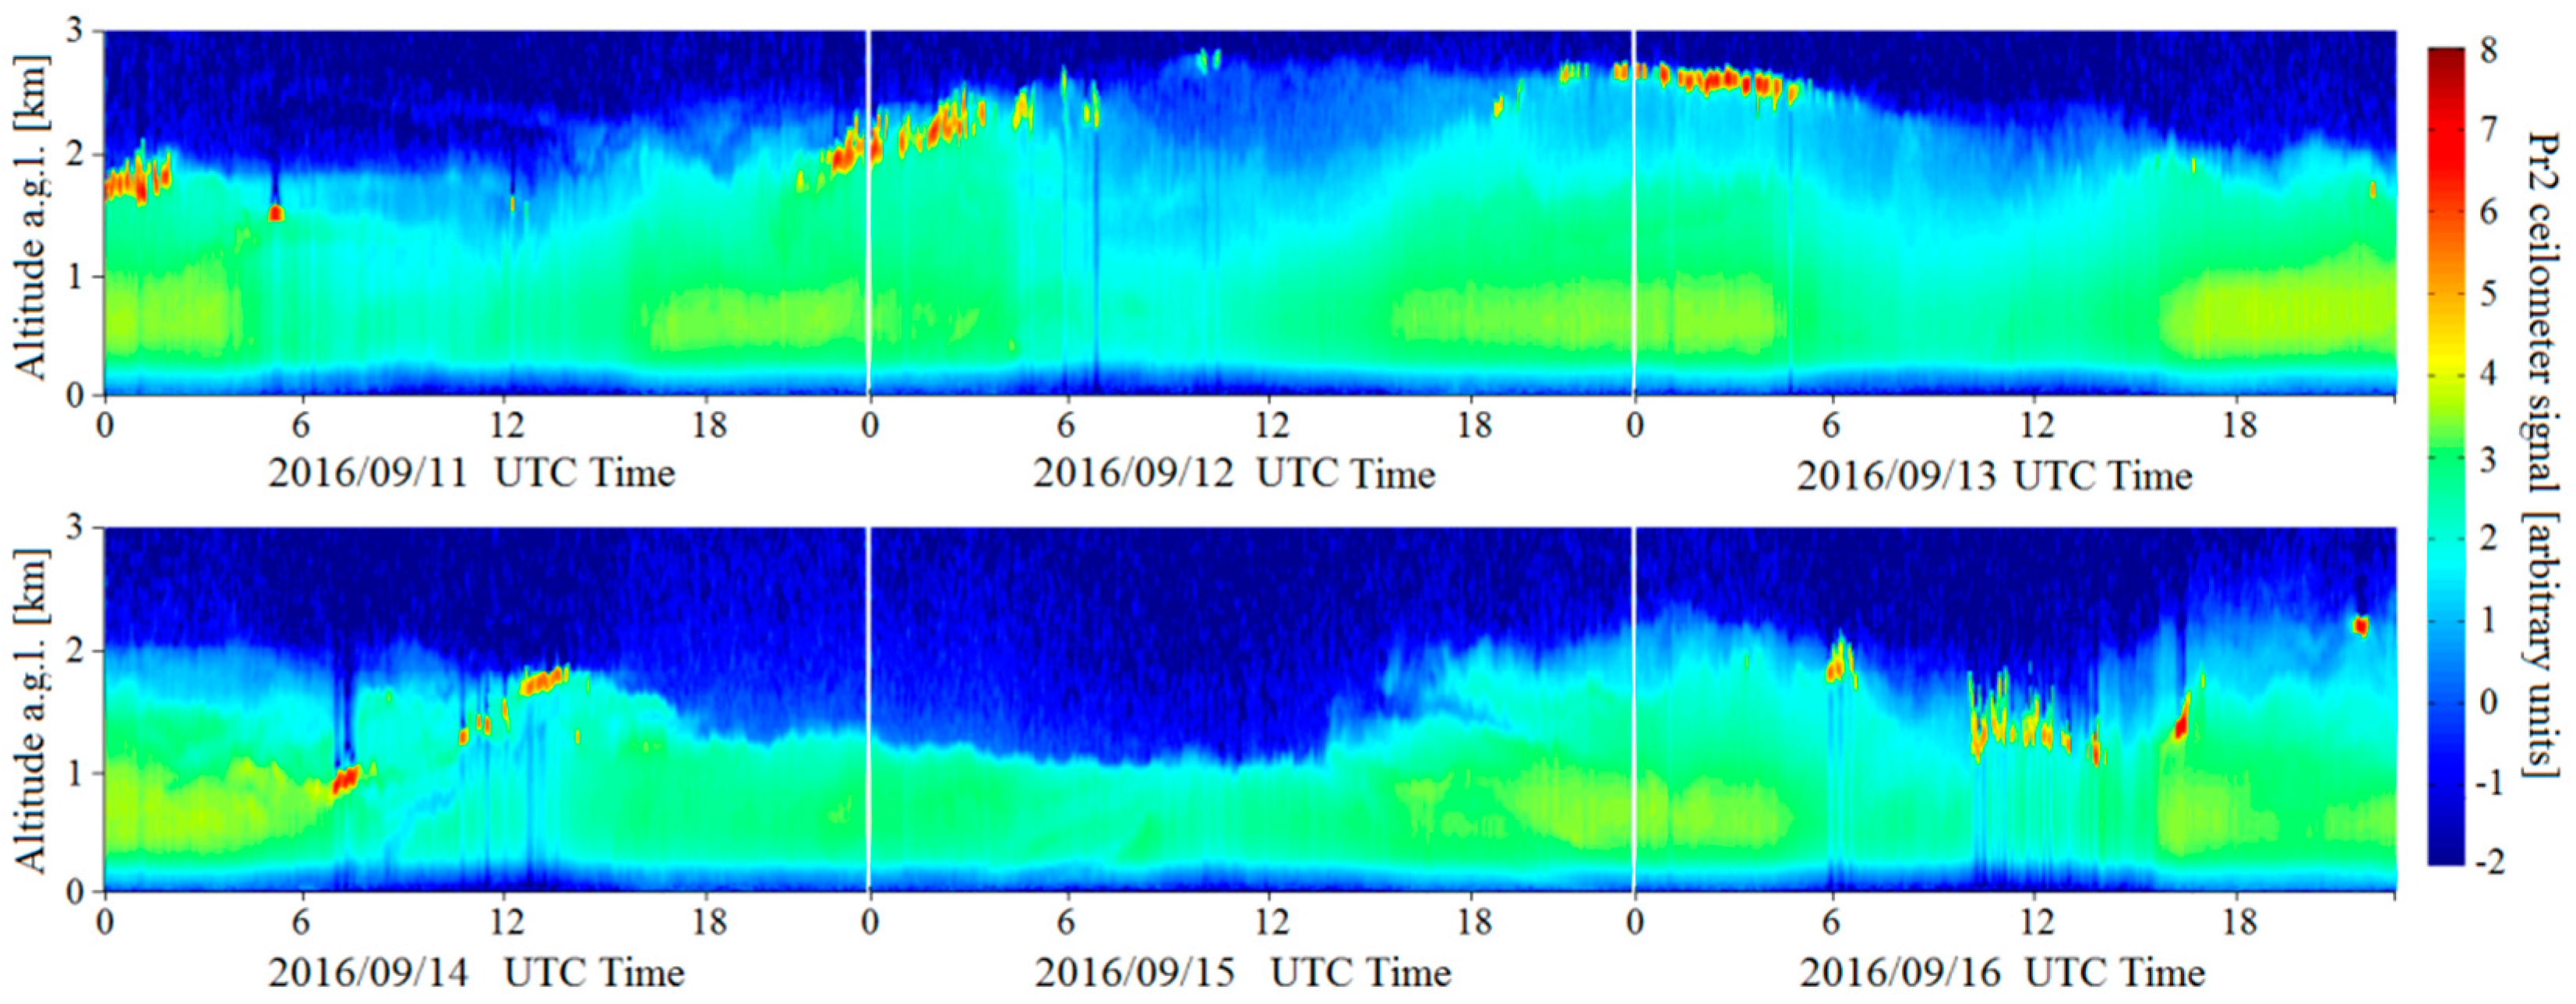
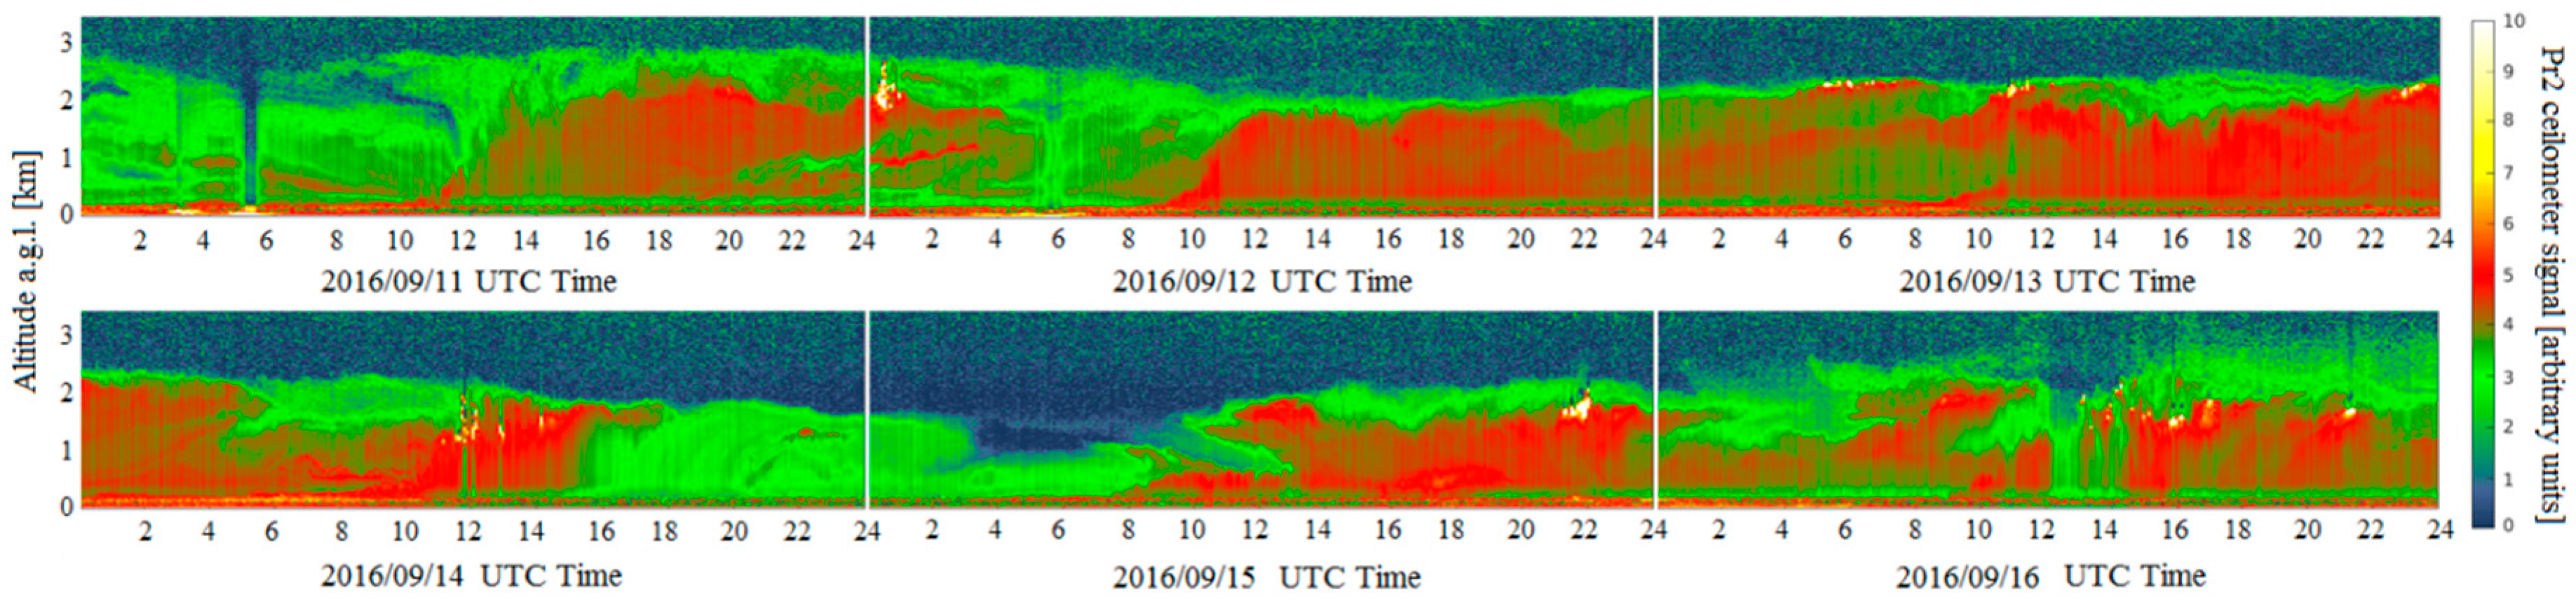
2.2. Observations of Aerosols with Ceilometers
2.3. Measurements of Aerosol Optical Depth Using Radiometers
2.4. Retrieval of SEVIRI Aerosol Optical Depth
3. Results and Discussion
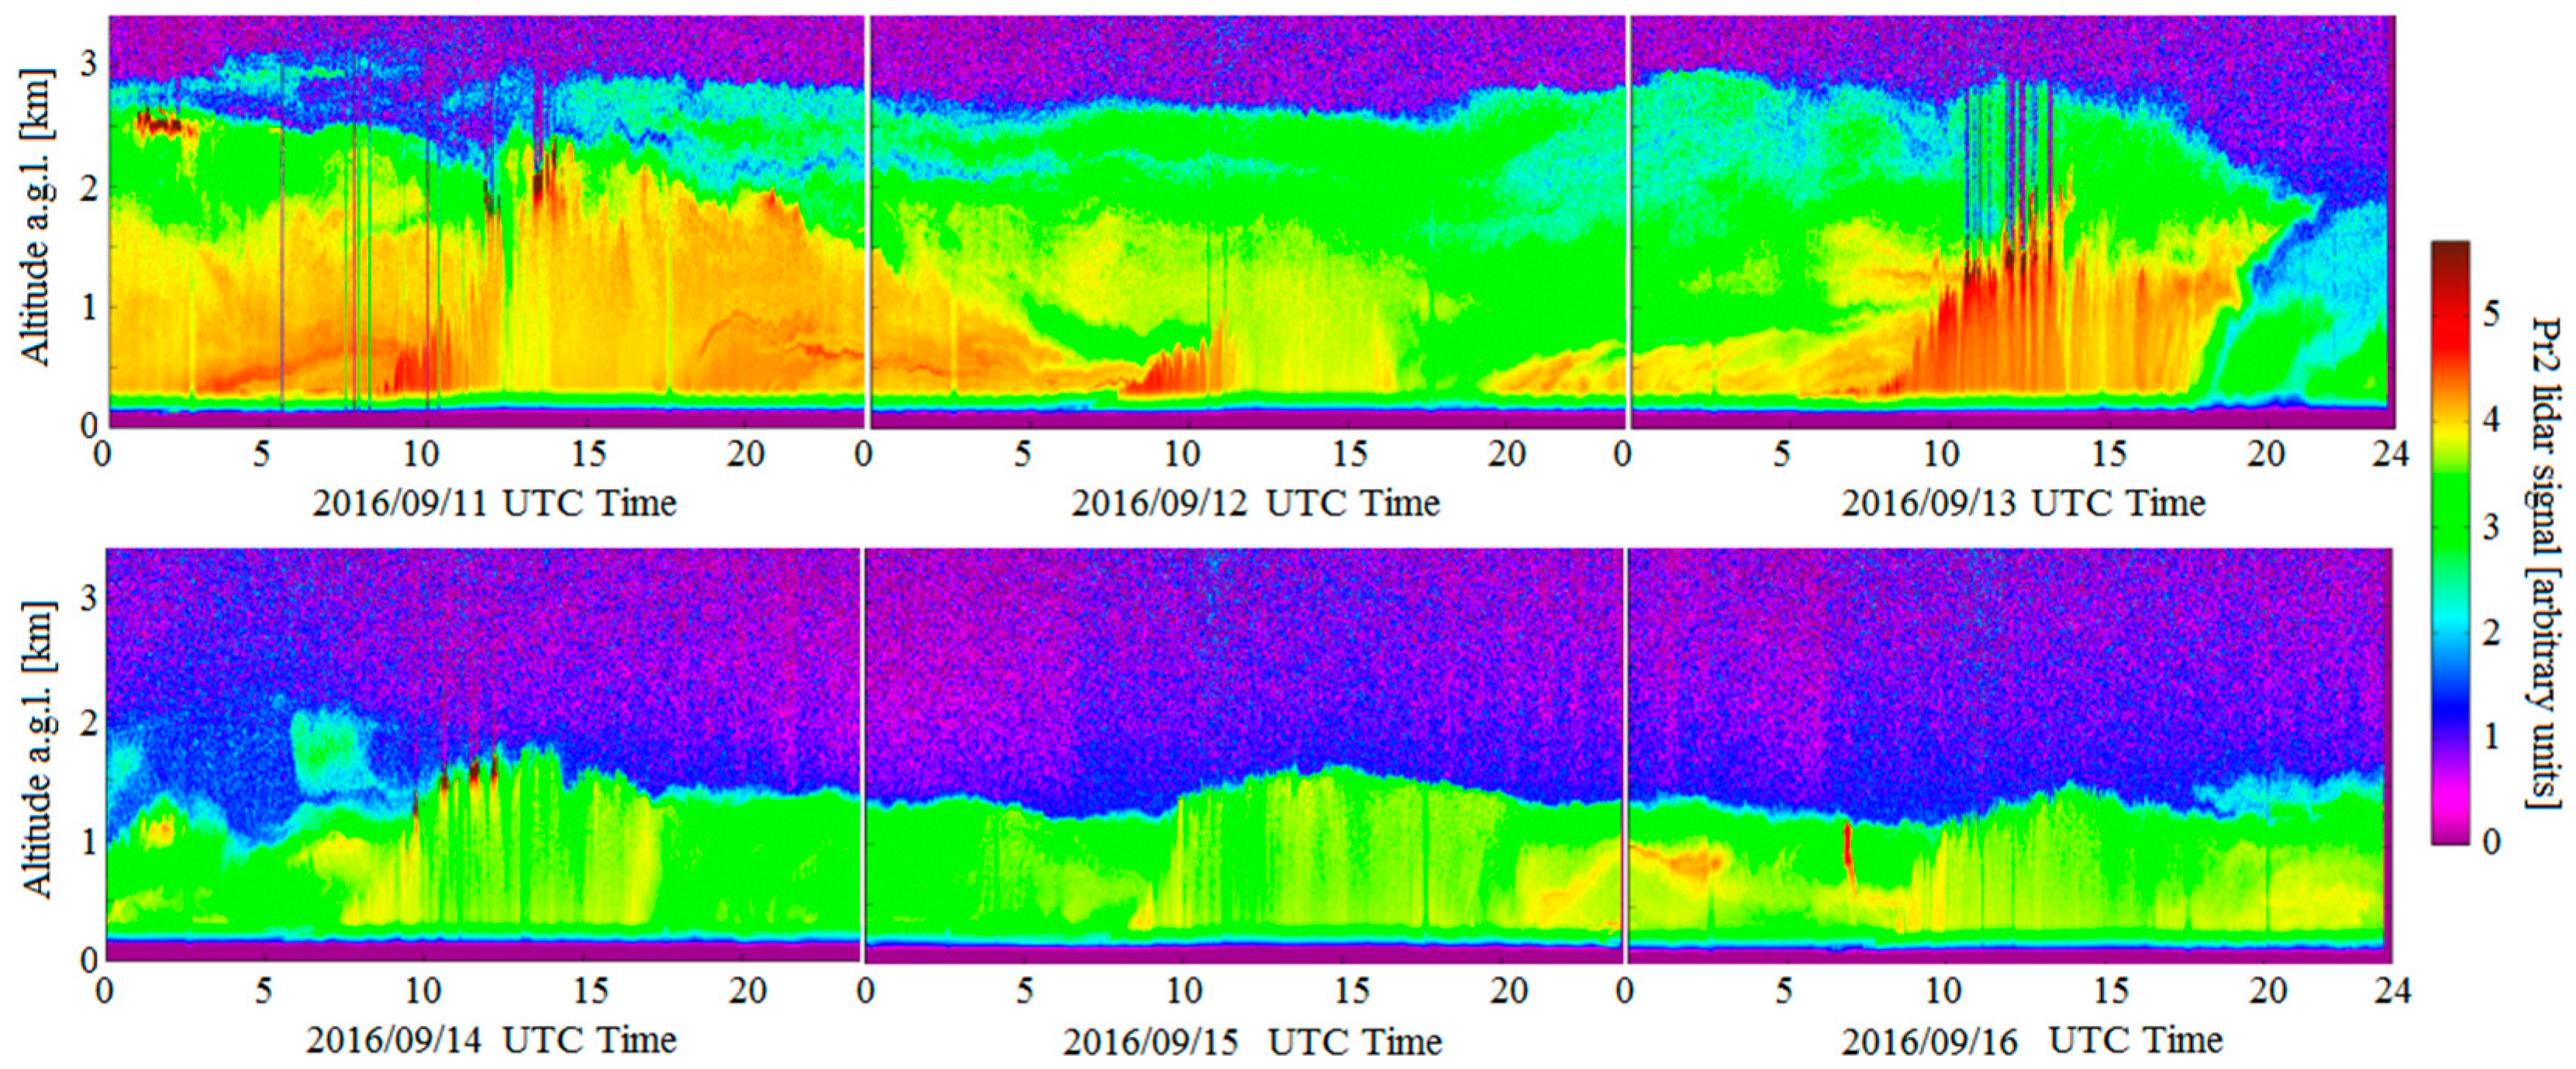
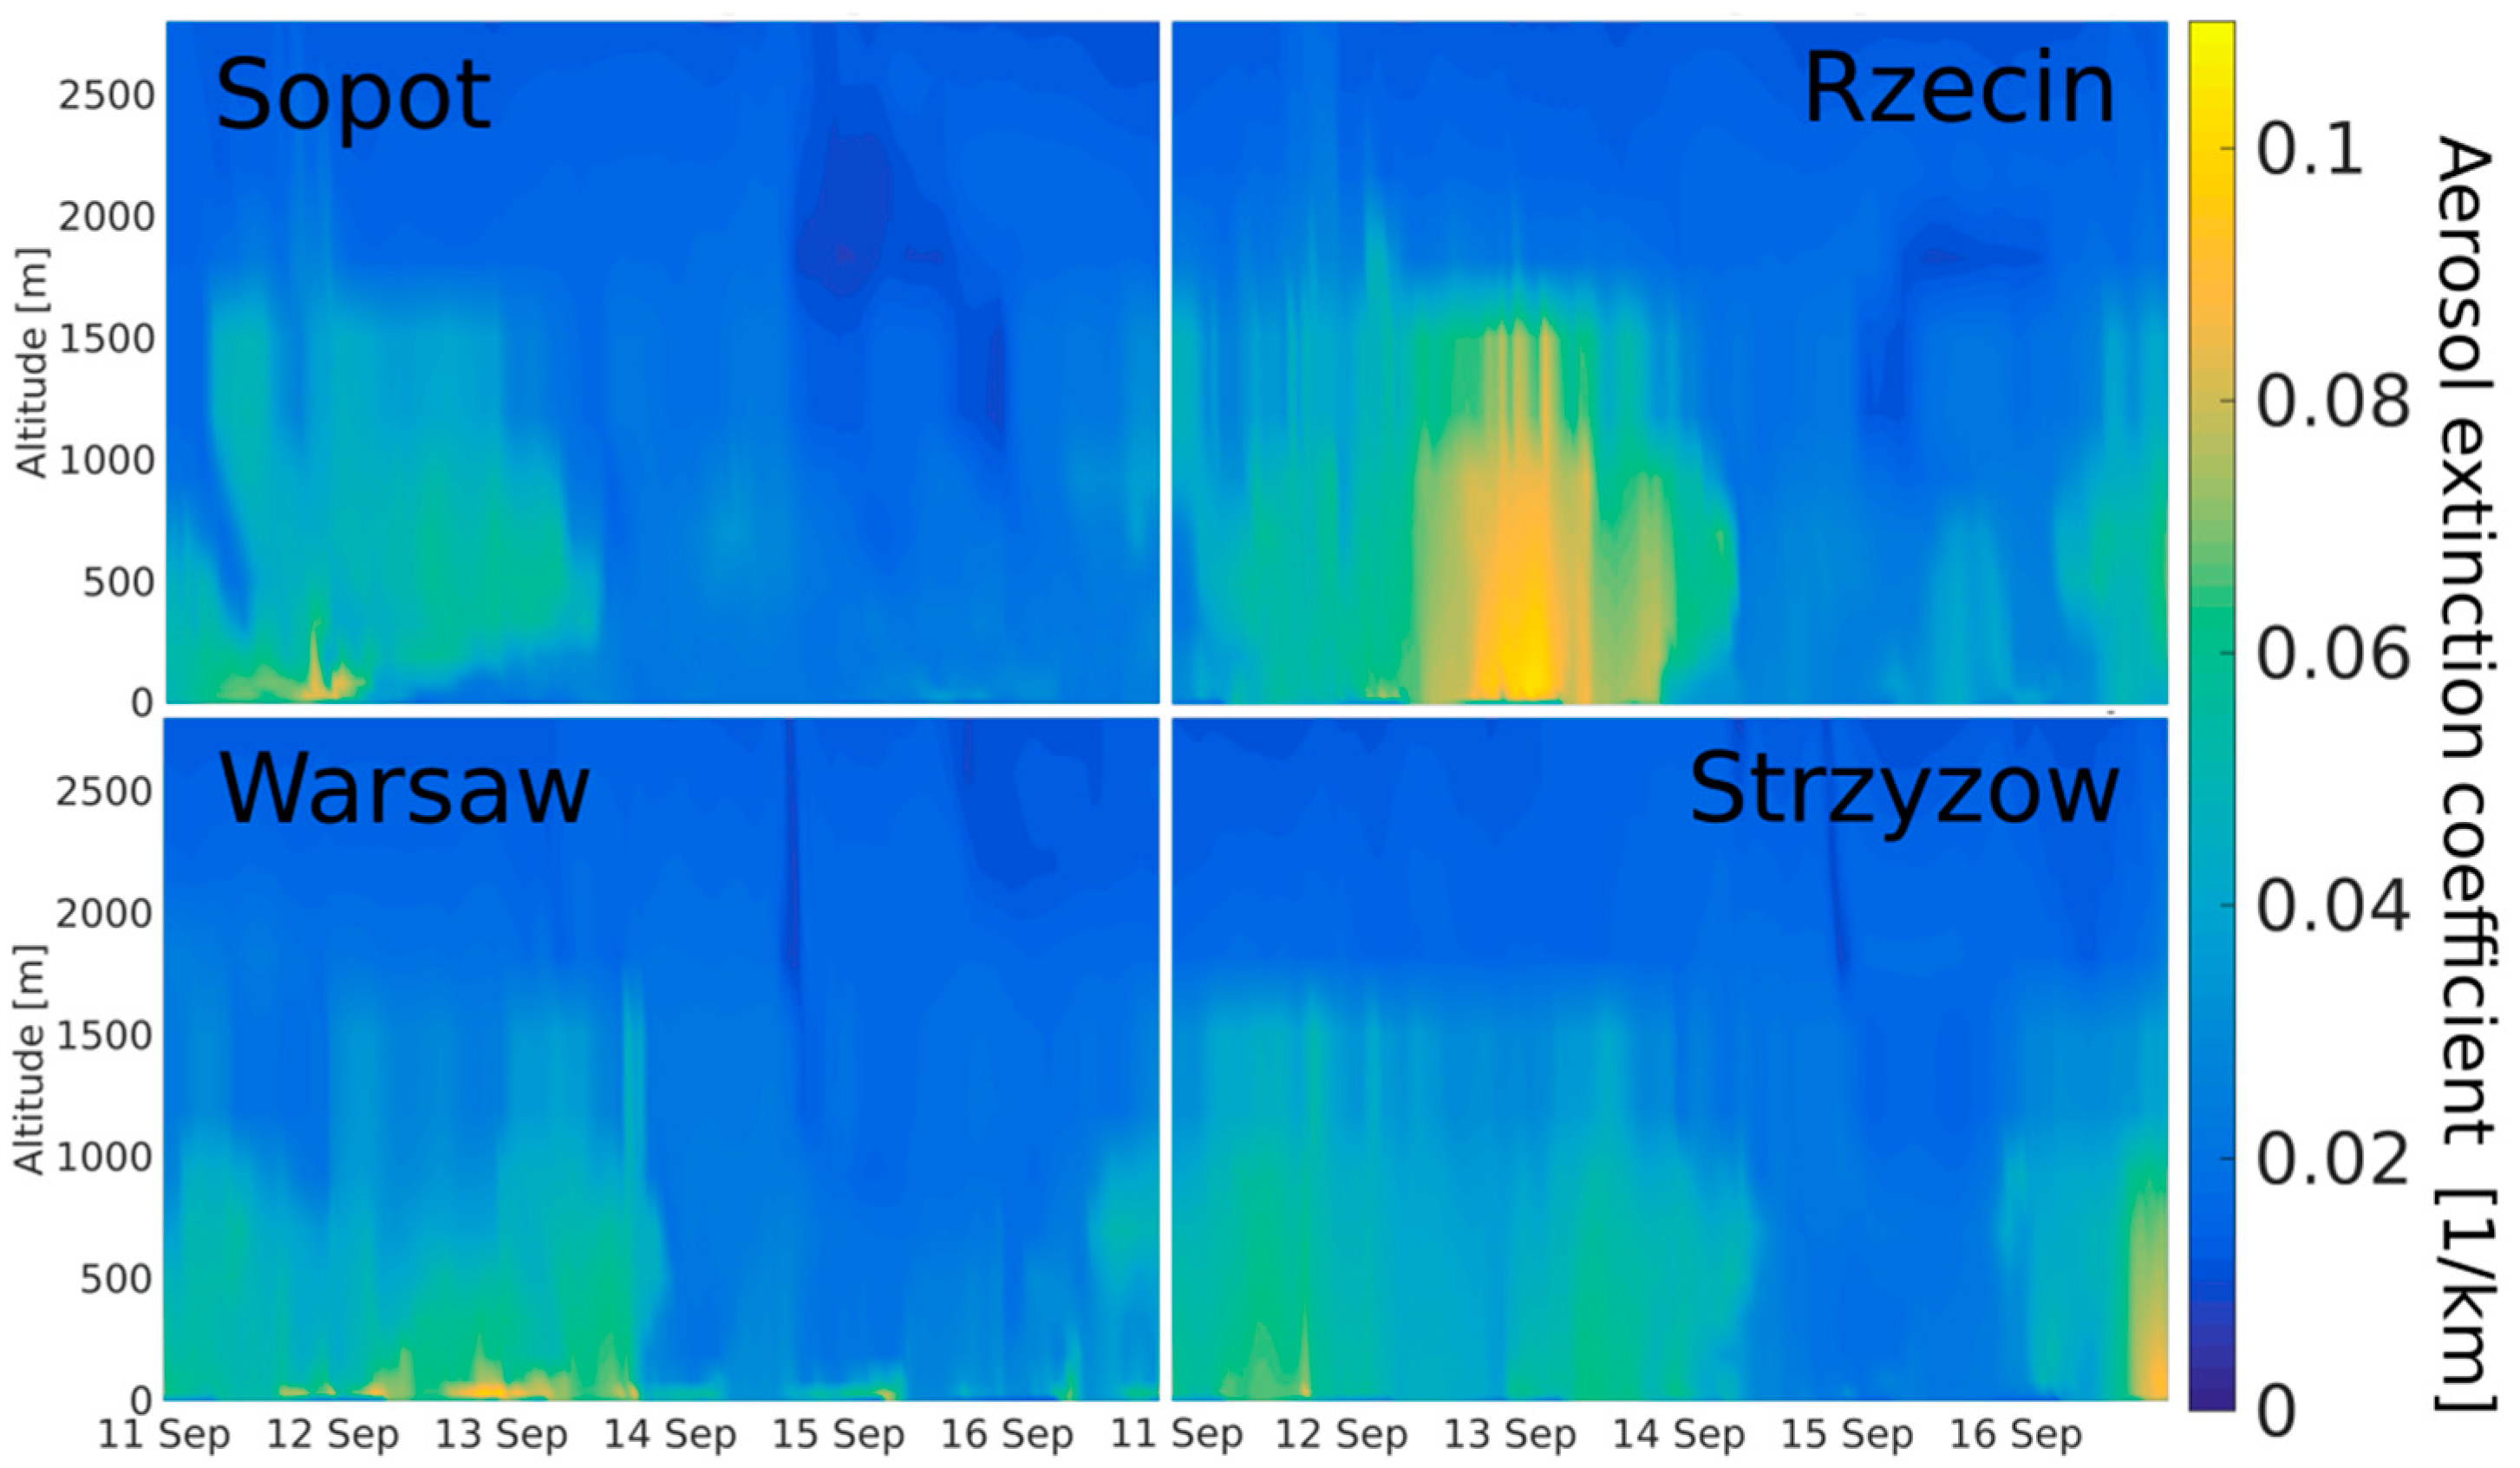
3.1. Optical Properties with Ground-Based Active Remote Sensing
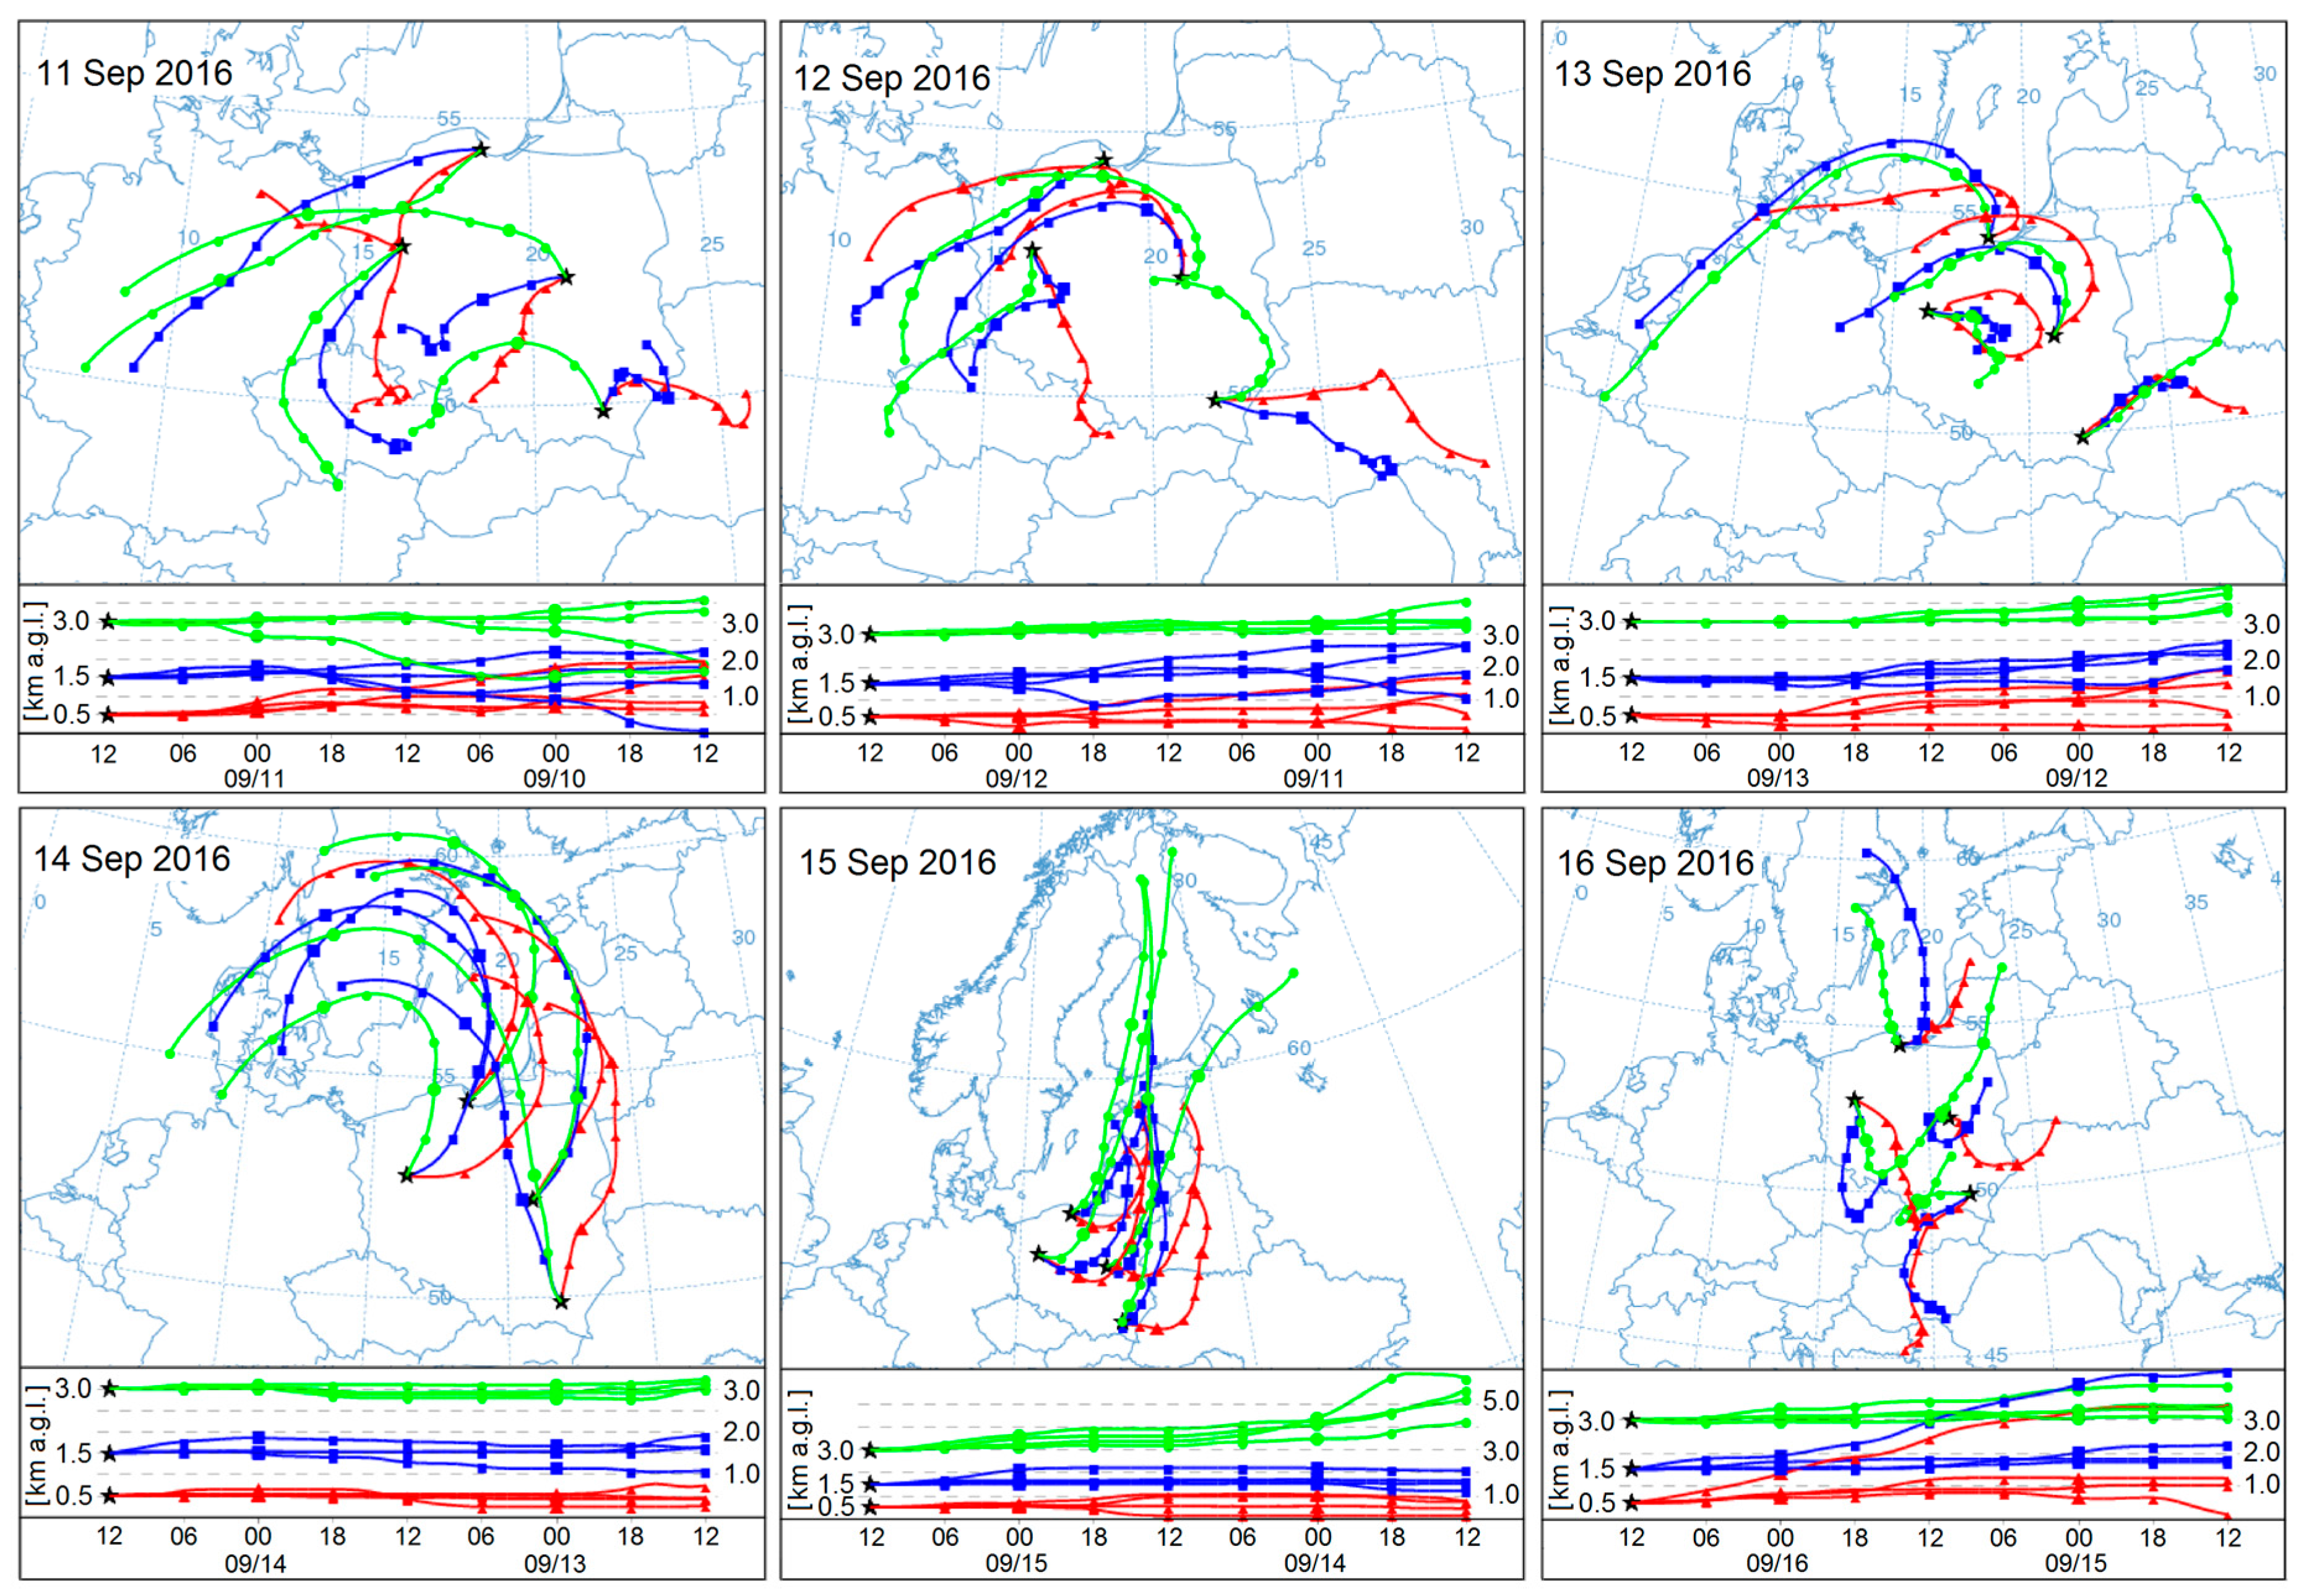
3.2. Aerosol Properties from Model Output Simulation
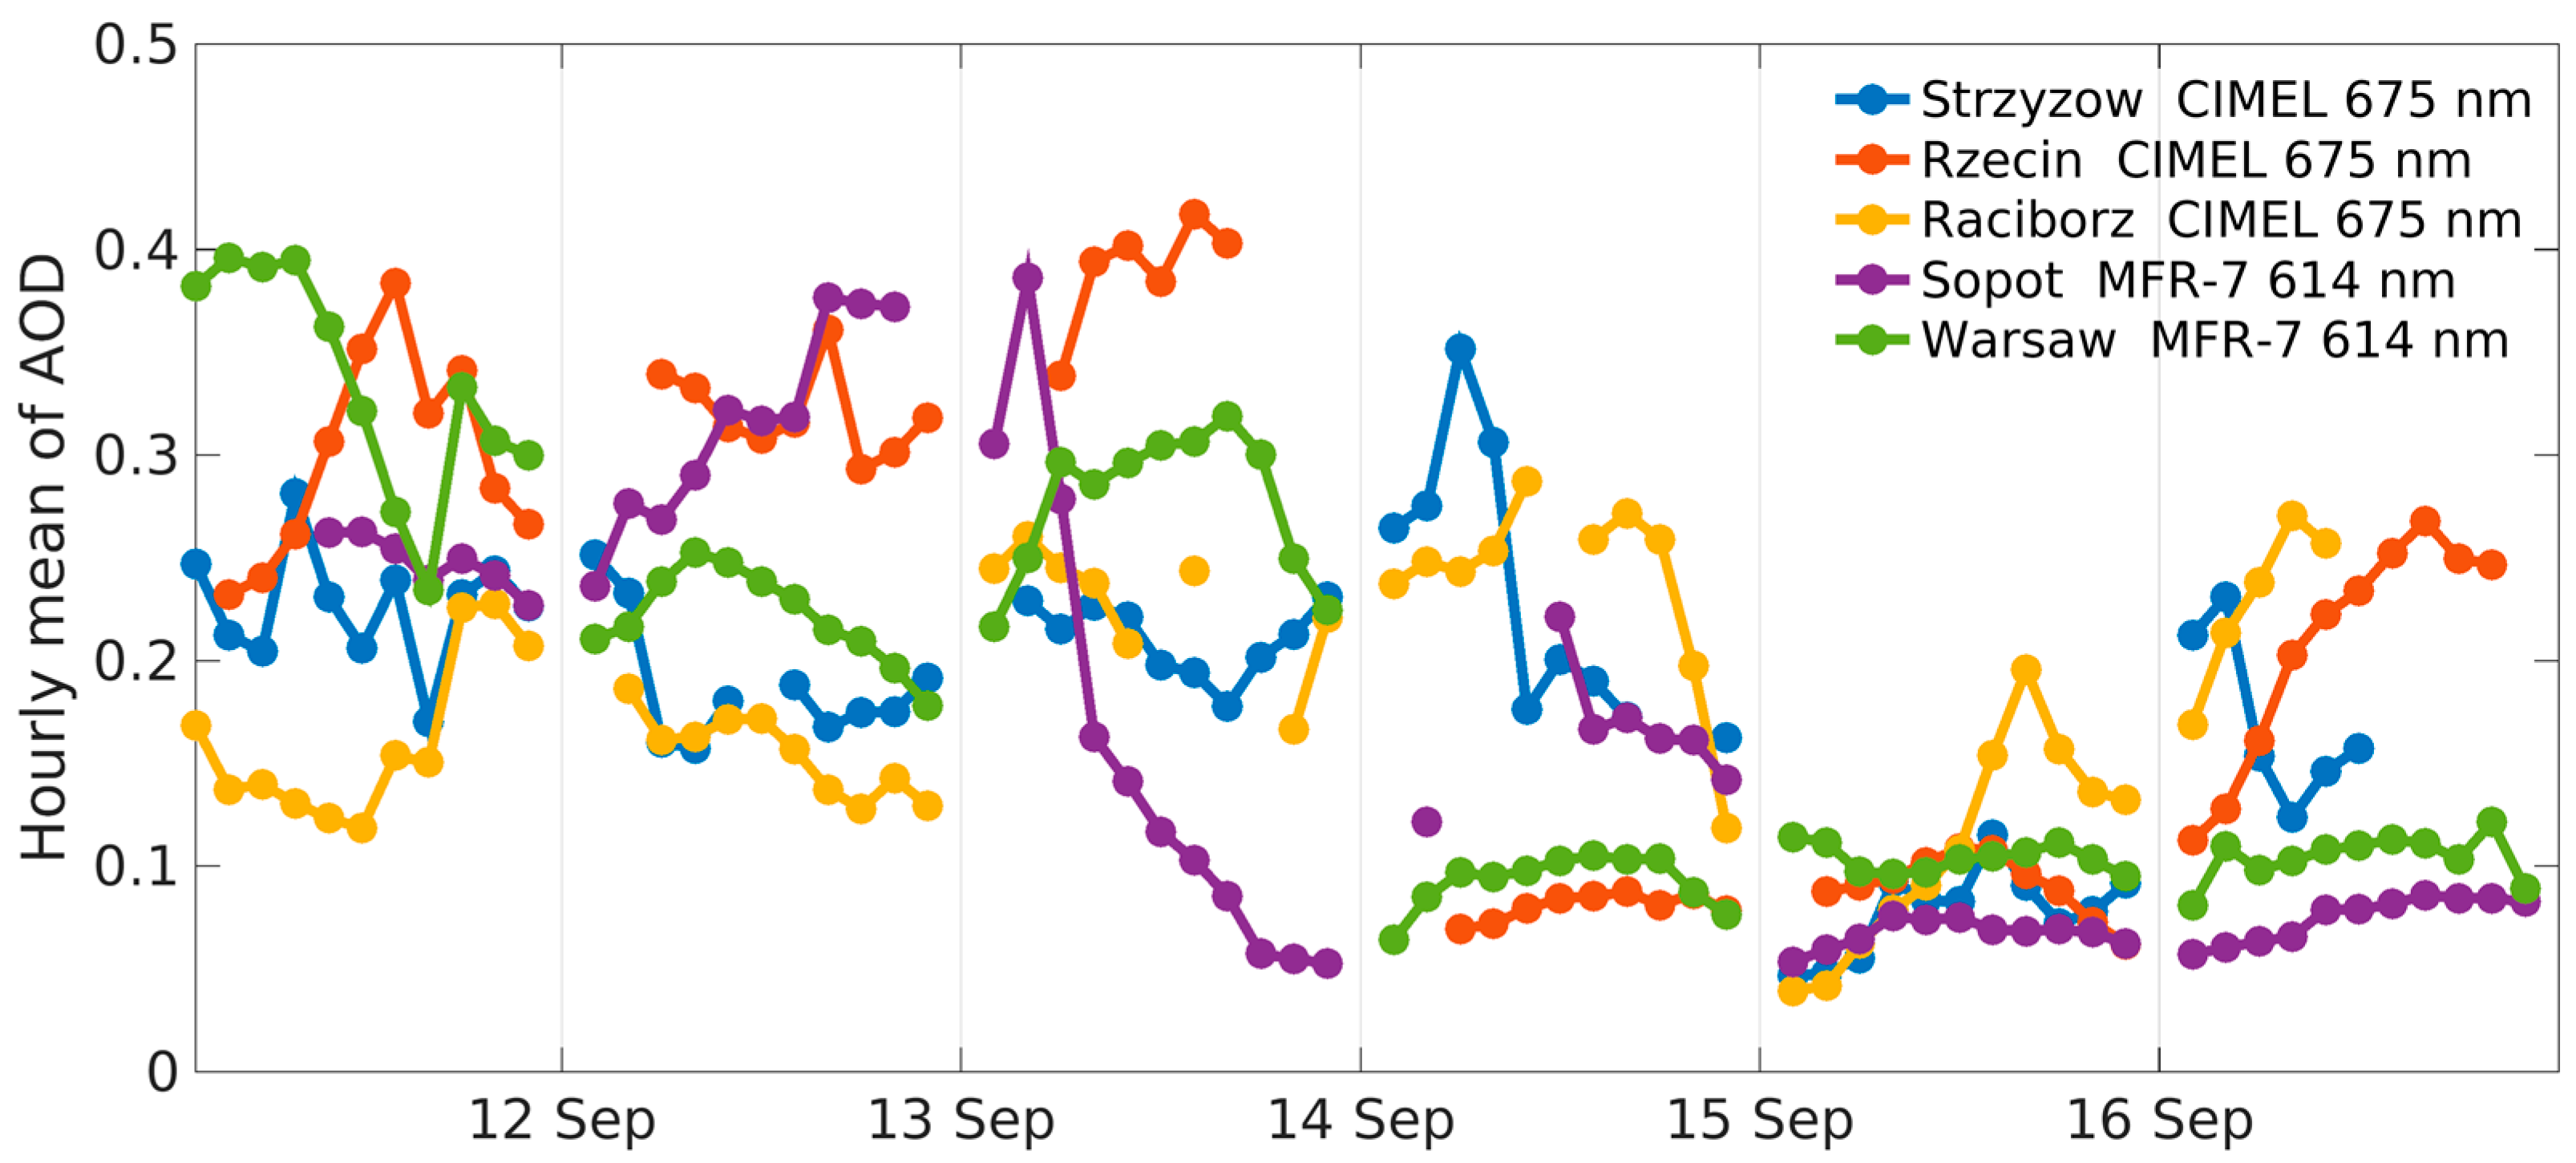
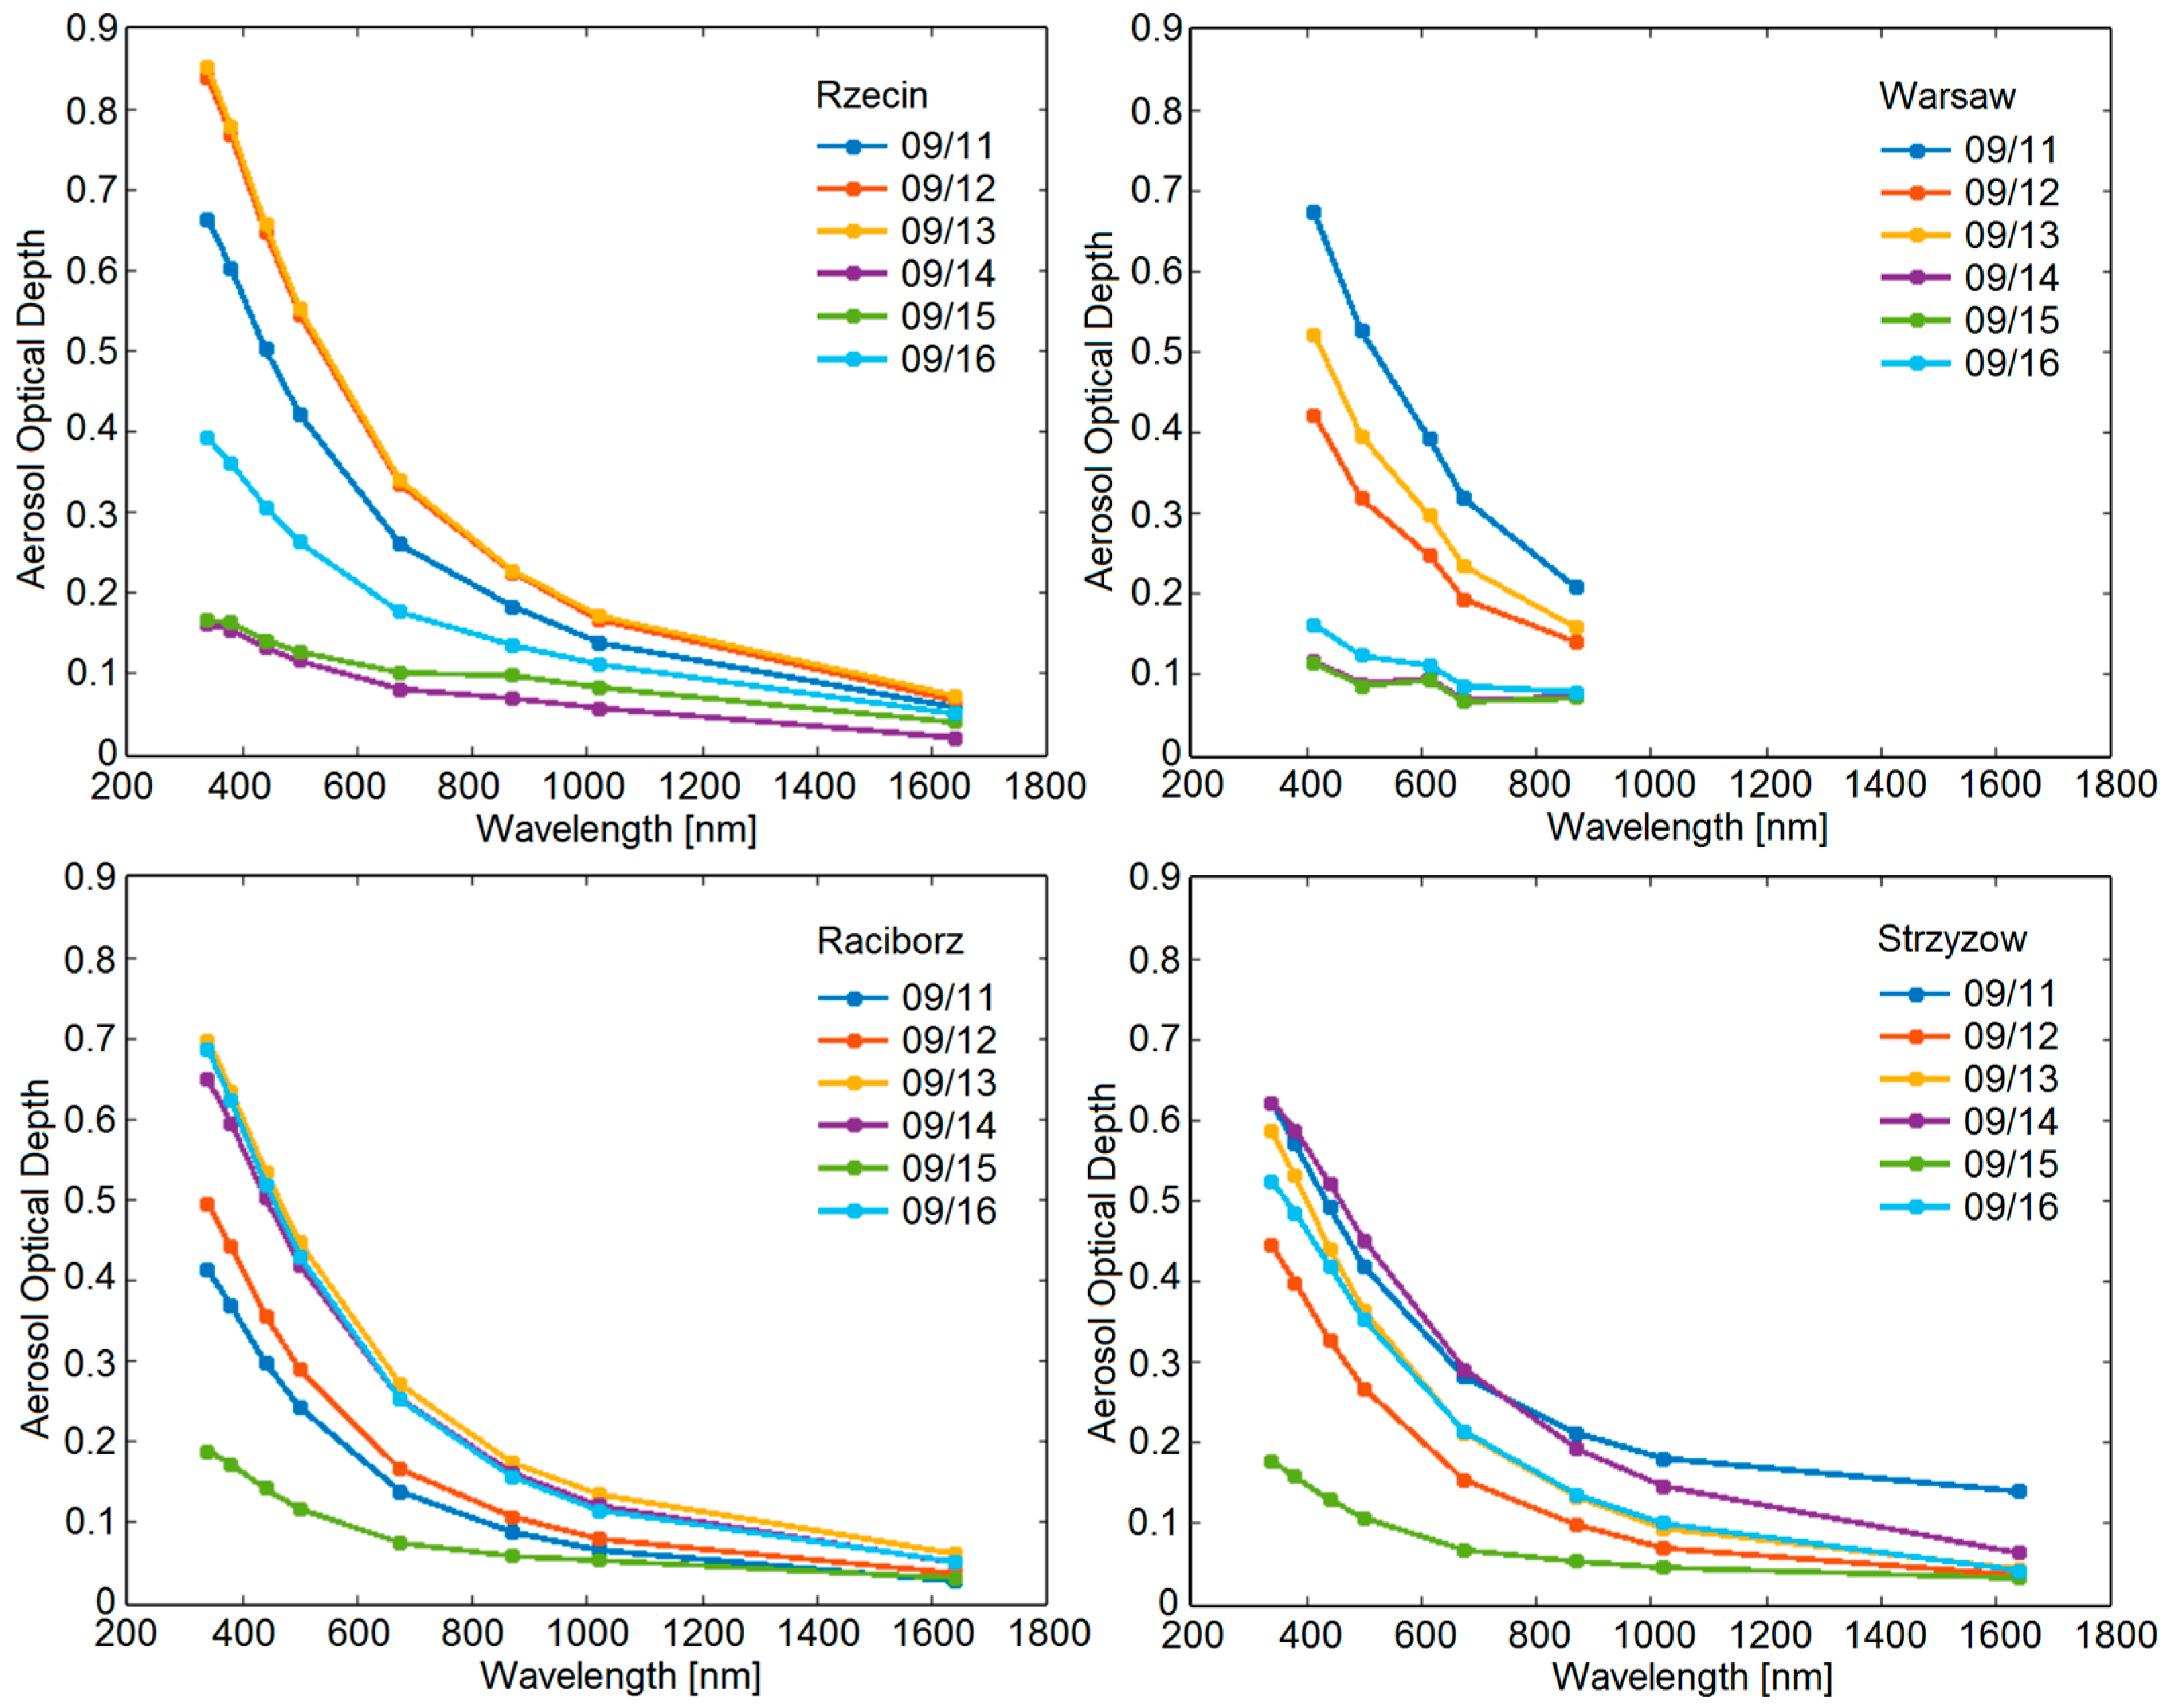
3.3. Optical Properties from Ground-Based Passive Remote Sensors
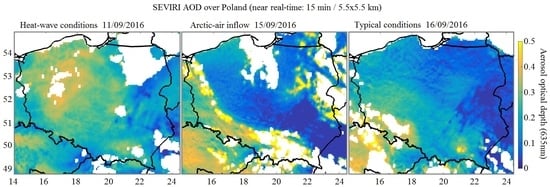
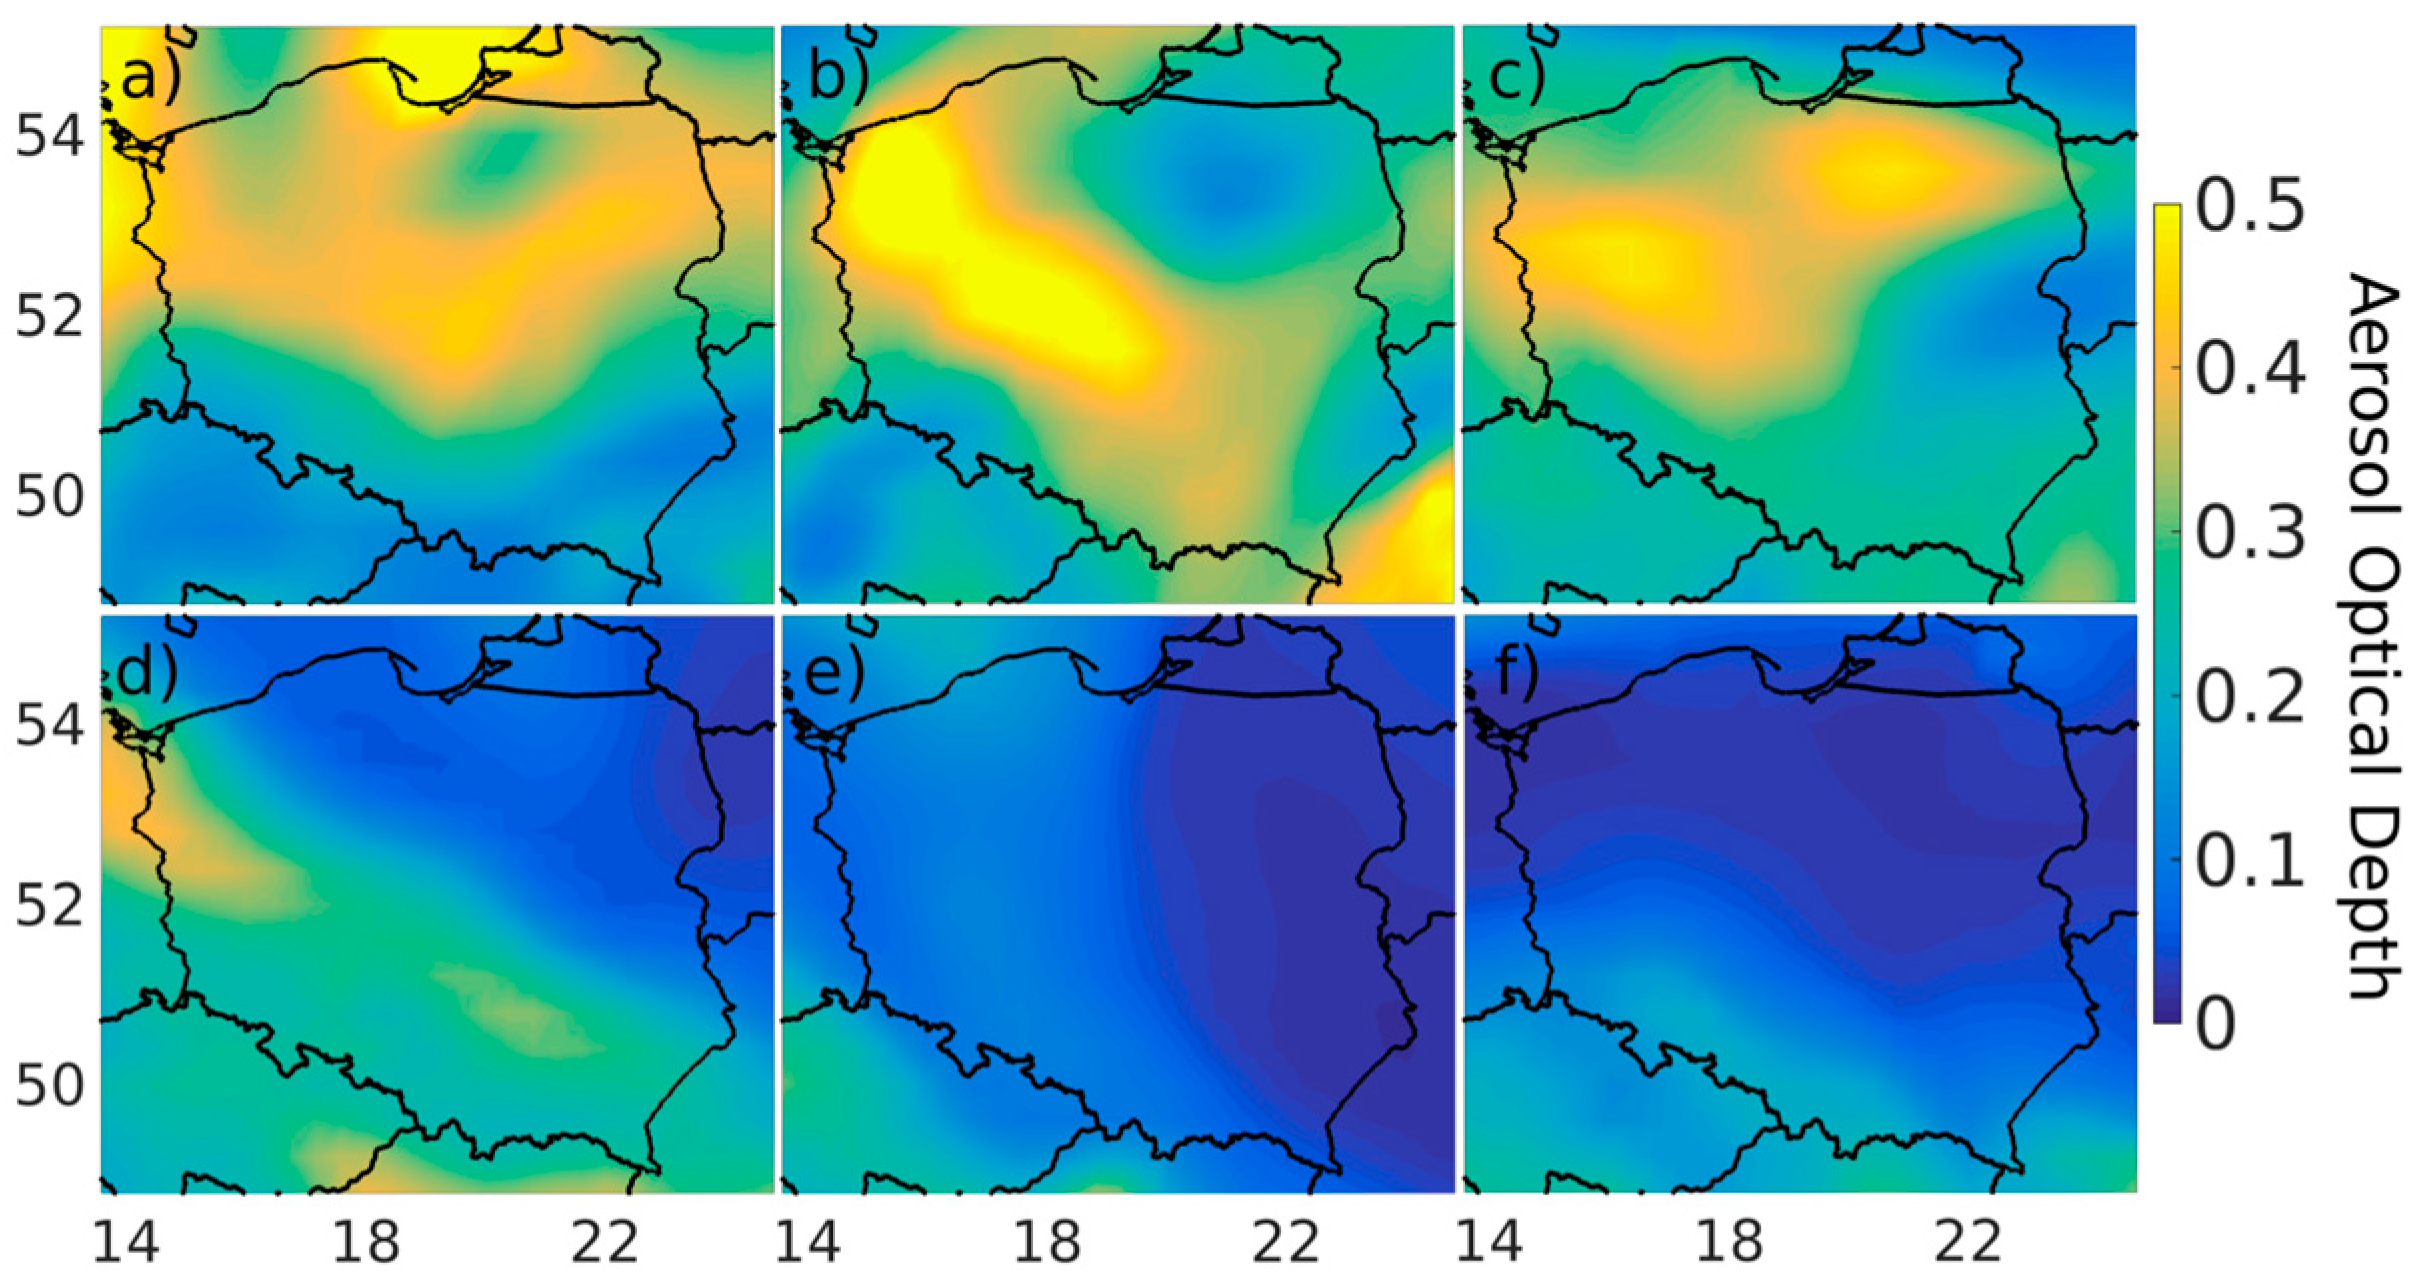
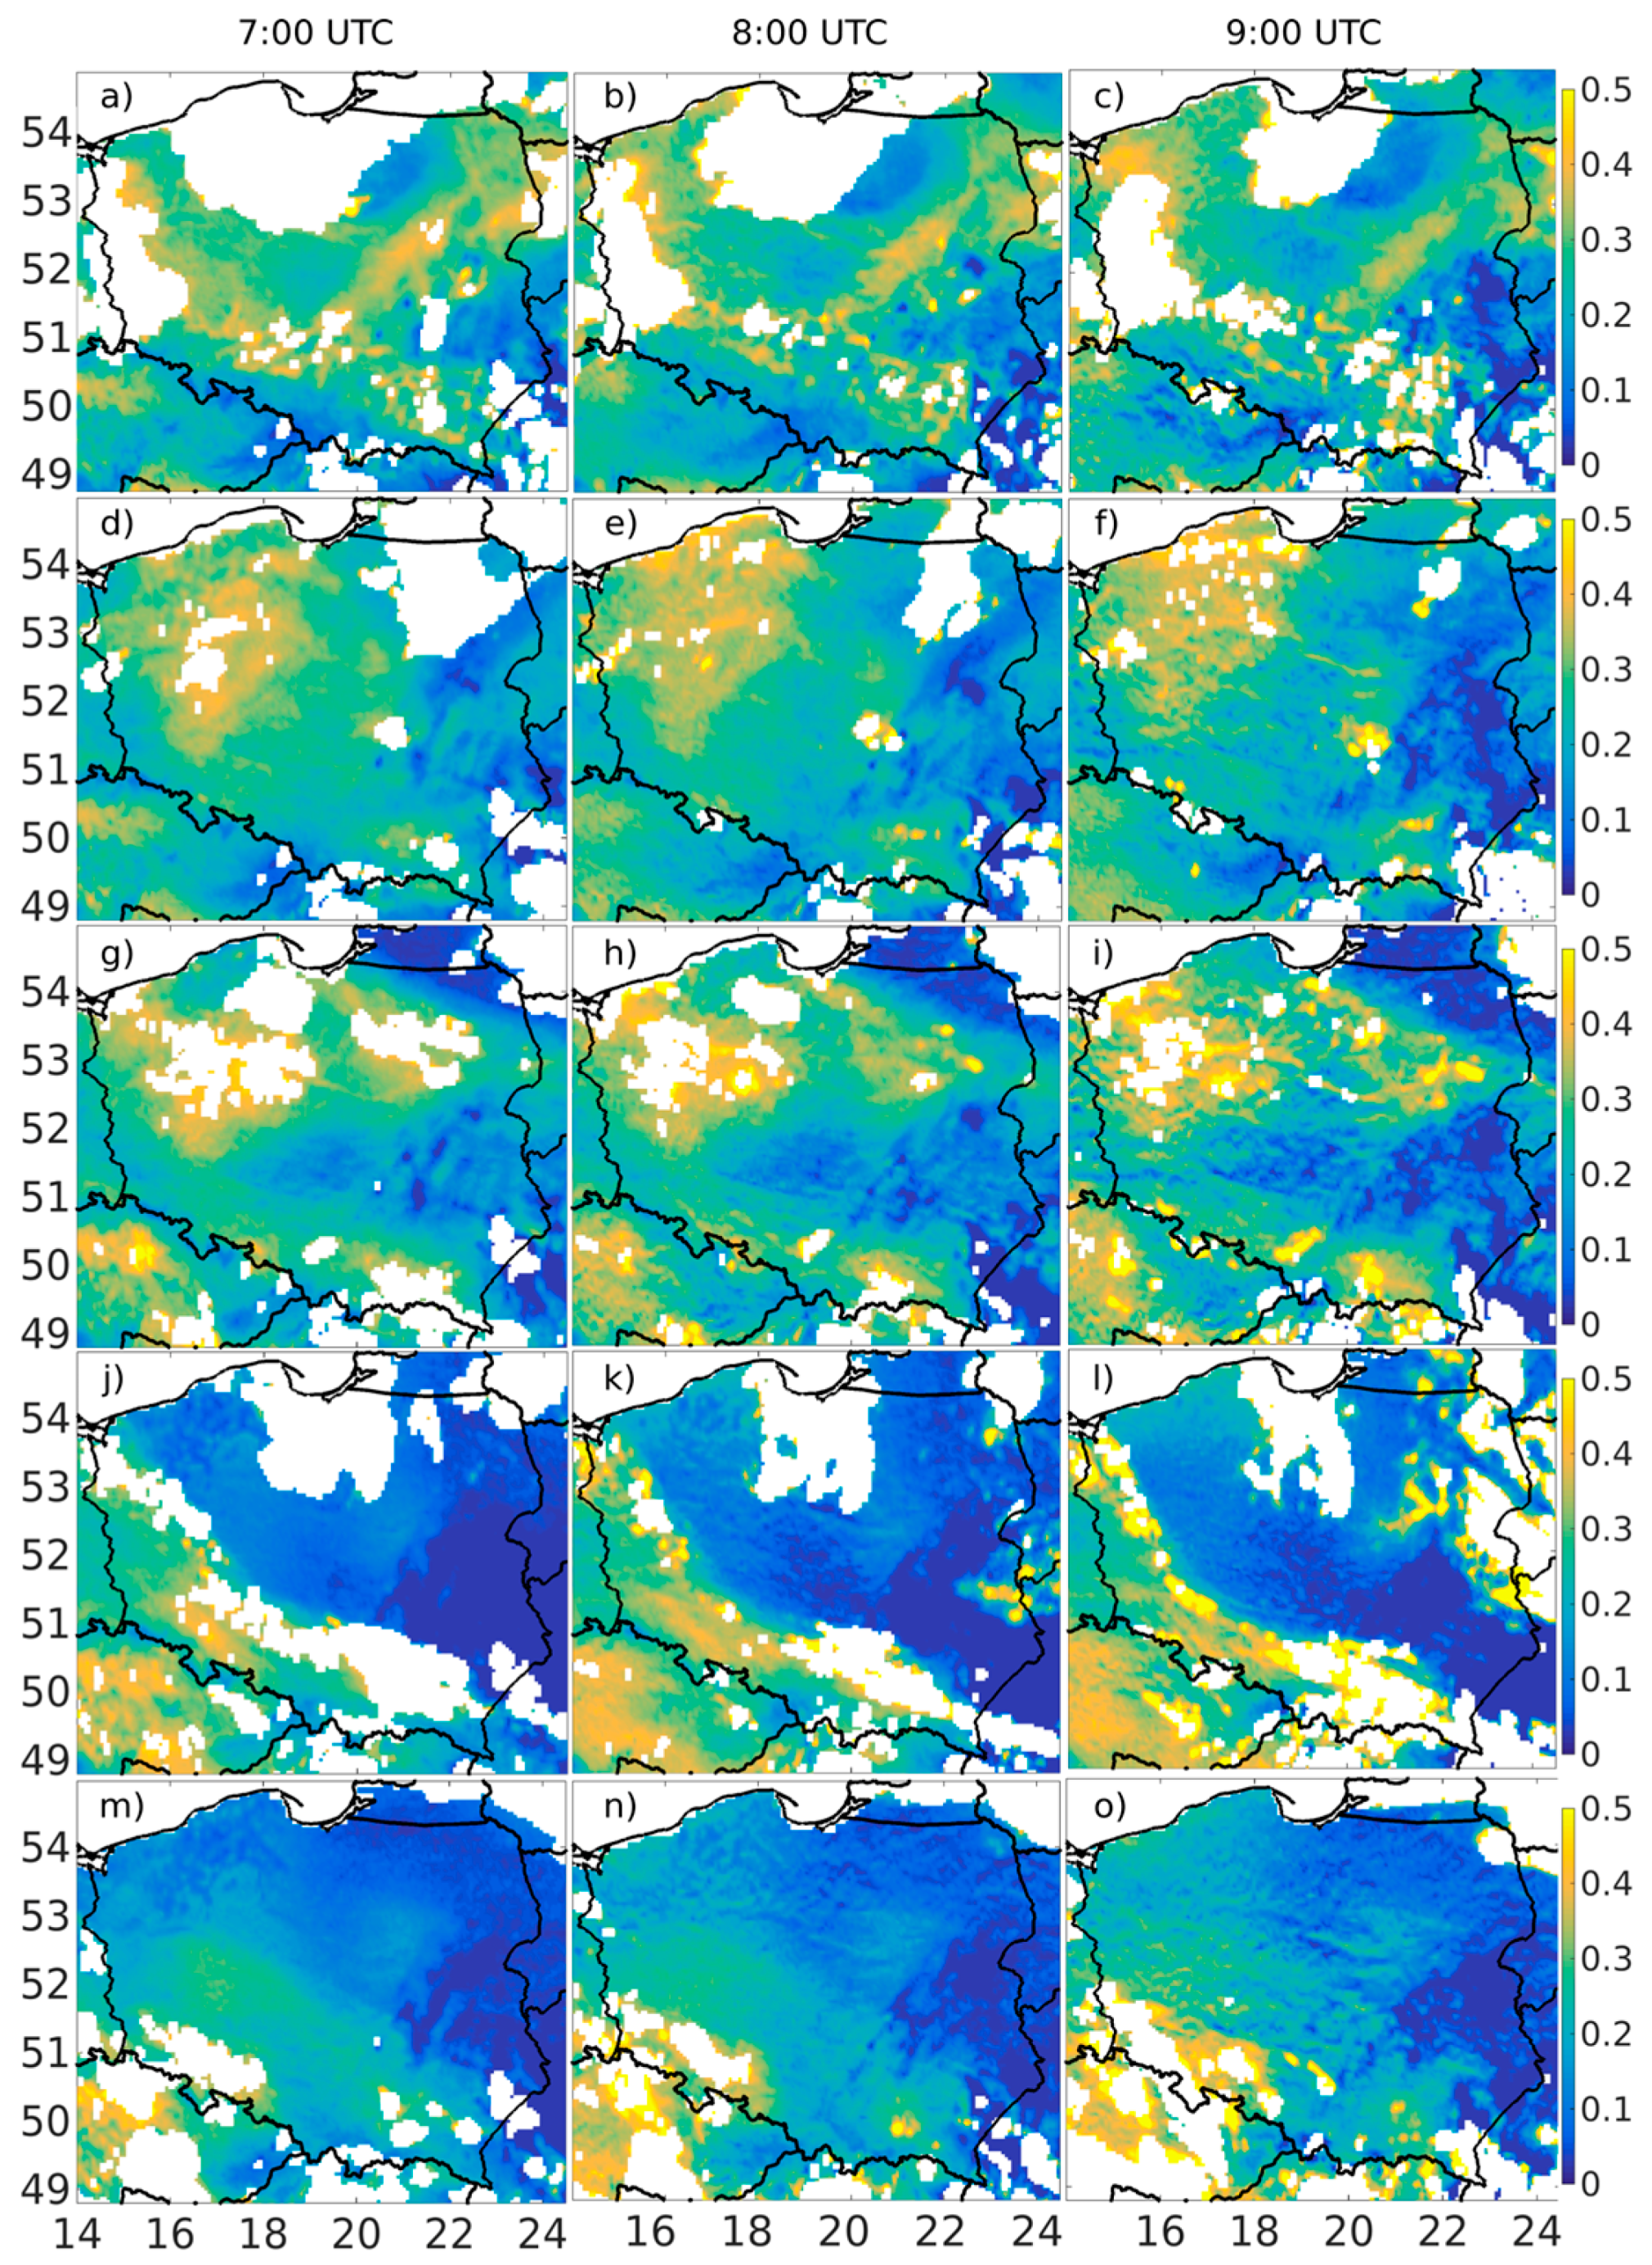
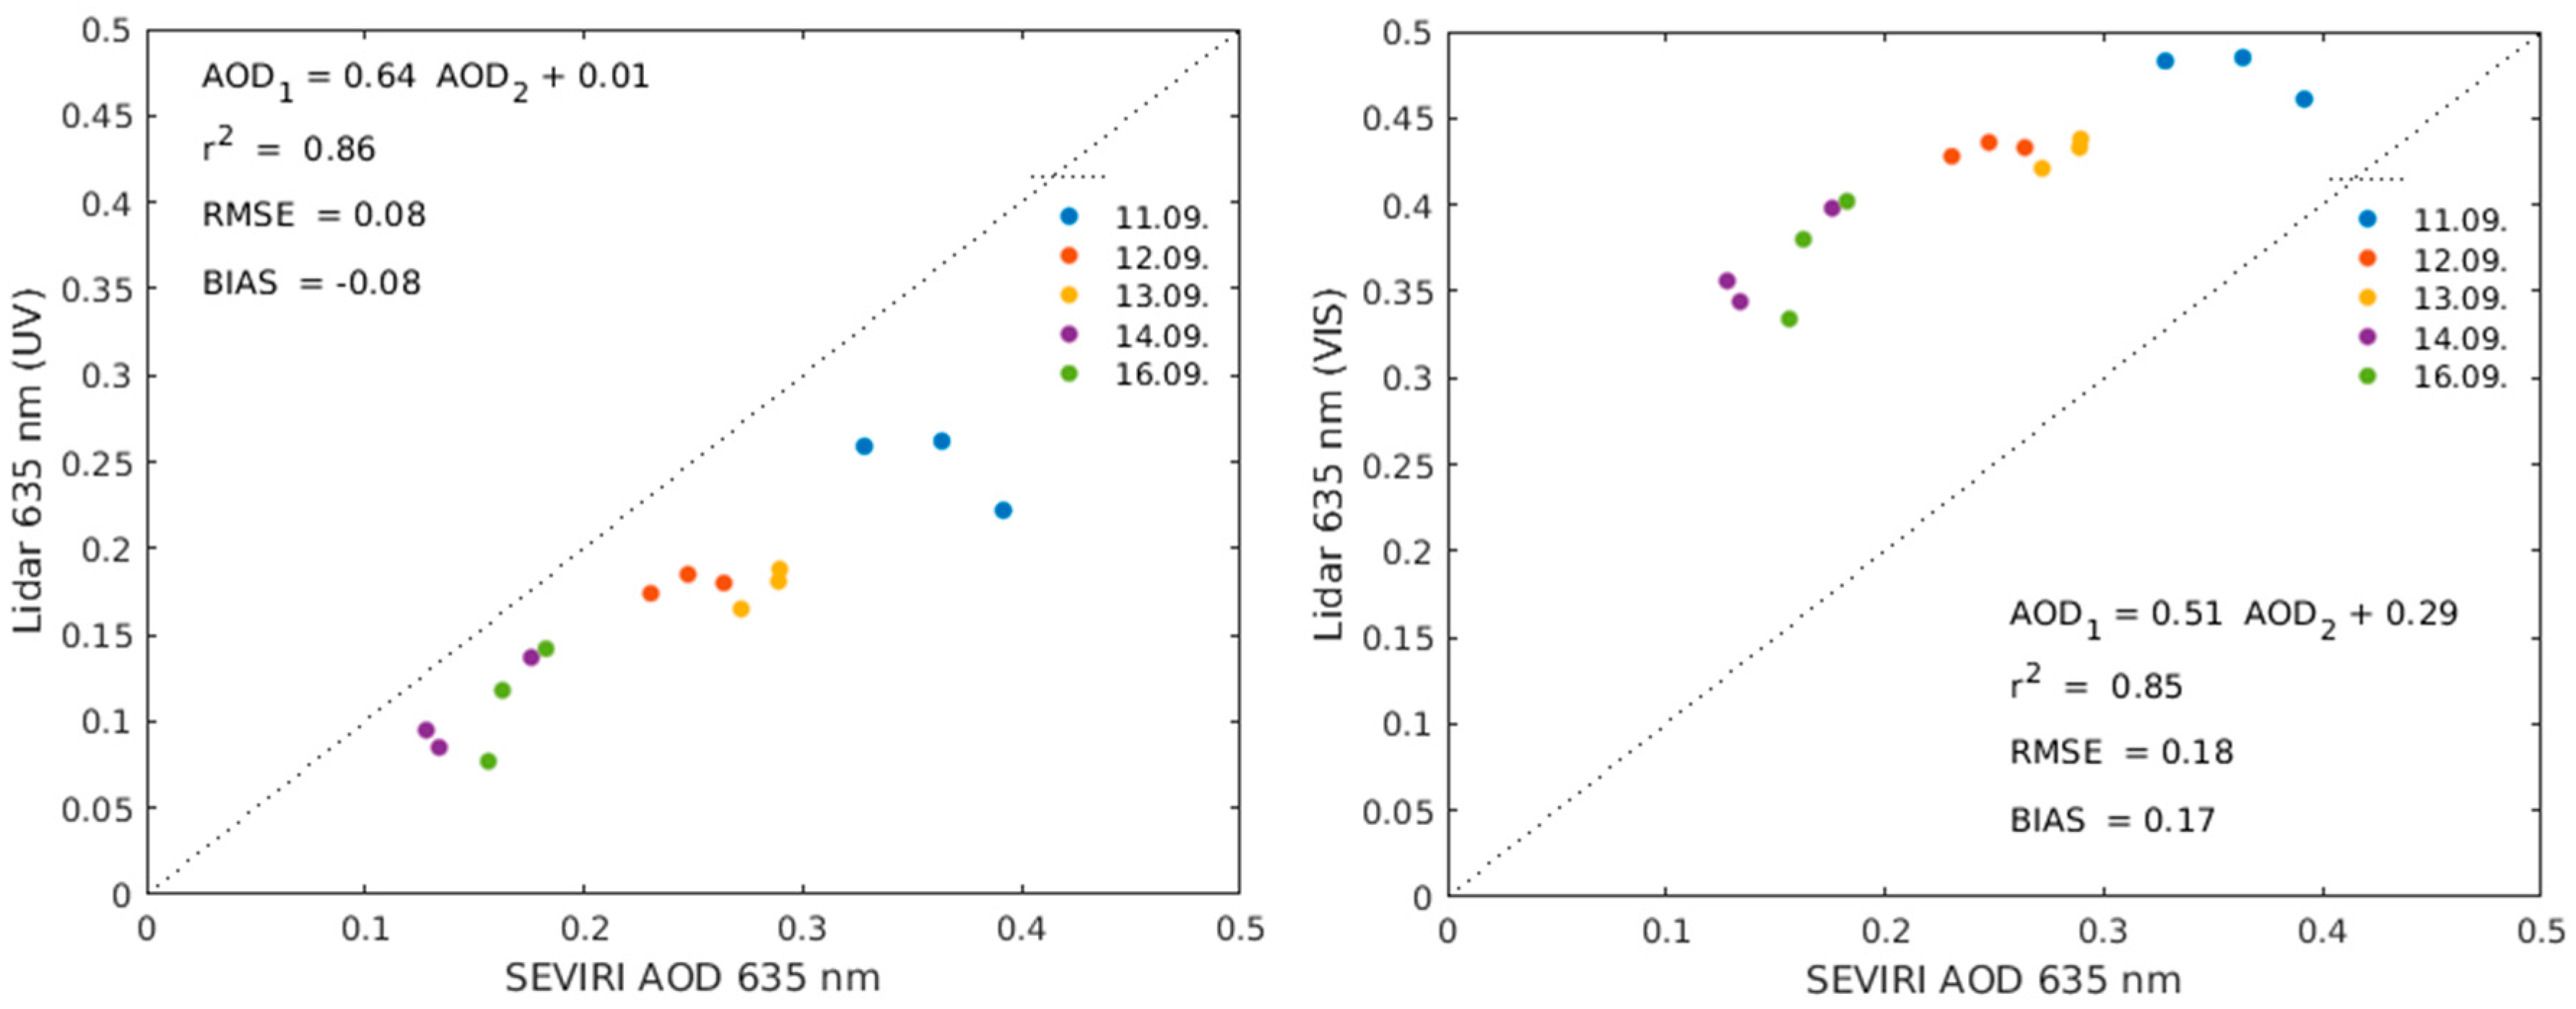
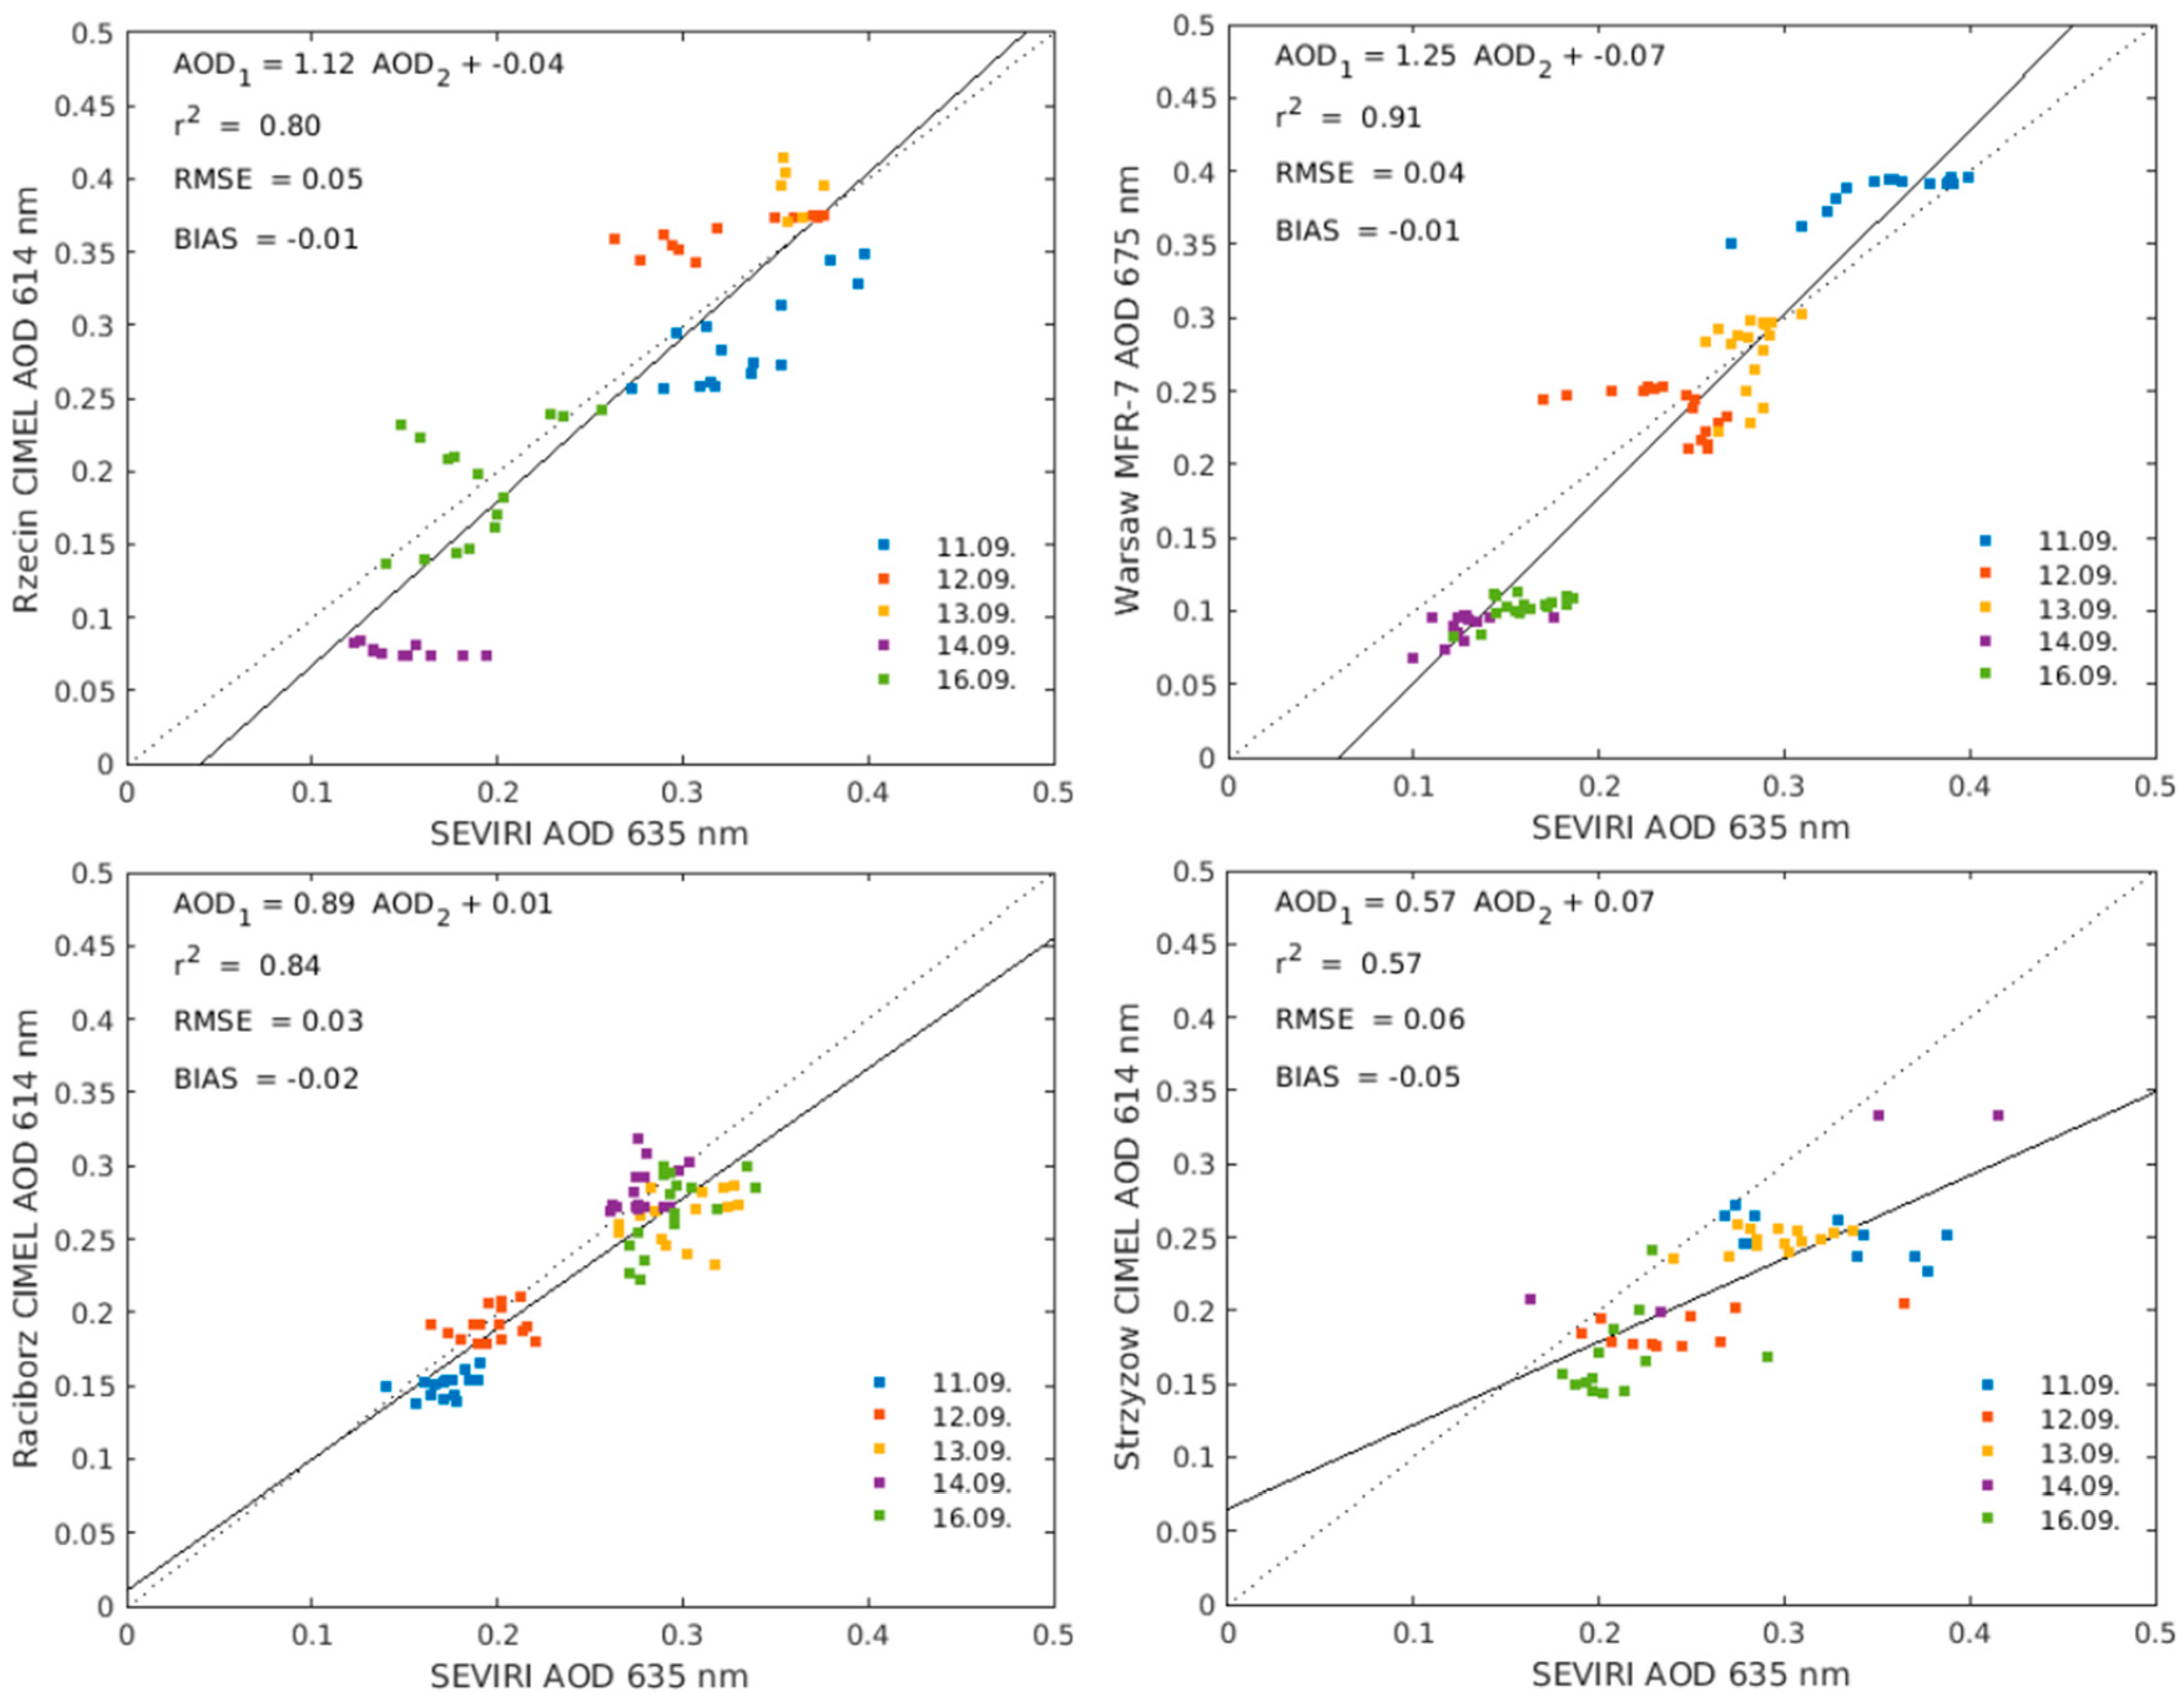
3.4. Satellite-derived Aerosol Optical Depth Maps of Poland
4. Conclusions
Acknowledgments
Author Contributions
Conflicts of Interest
References
- Bernstein, D.N.; Neelin, J.D.; Li, Q.B.; Chen, D. Could aerosol emissions be used for regional heat wave mitigation? Atmos. Chem. Phys. 2013, 13, 6373–6390. [Google Scholar] [CrossRef]
- Meehl, G.A.; Tebaldi, C. More intense, more frequent, and longer lasting heat waves in the 21st century. Science 2004, 305, 994–997. [Google Scholar] [CrossRef] [PubMed]
- Dalla-Marta, P.M.; Haylock, M.R.; Luterbacher, J.; Wanner, H. Doubled length of western European summer heat waves since 1880. J. Geophys. Res. 2007, 112, D15103. [Google Scholar] [CrossRef]
- Tomczyk, A.M.; Bednorz, E. Heat waves in Central Europe and their circulation conditions. Int. J. Climatol. 2016, 36, 770–782. [Google Scholar] [CrossRef]
- Lyamani, H.; Olmo, F.J.; Alcántara, A.; Alados-Arboledas, L. Atmospheric aerosols during the 2003 heat wave in southeastern Spain I: Spectral optical depth. Atmos. Environ. 2006, 40, 6453–6464. [Google Scholar] [CrossRef]
- Lyamani, H.; Olmo, F.J.; Alcántara, A.; Alados-Arboledas, L. Atmospheric aerosols during the 2003 heat wave in southeastern Spain II: Microphysical columnar properties and radiative forcing. Atmos. Environ. 2006, 40, 6465–6476. [Google Scholar] [CrossRef]
- Penner, J.E.; Dickinson, R.E.; O’Neill, C.A. Effects of aerosol from biomass burning on the global radiation budget. Science 1992, 256, 1432–1435. [Google Scholar] [CrossRef] [PubMed]
- Zhang, Q.; Ma, X.; Tie, X.; Huang, M.; Zhao, C. Vertical distributions of aerosols under different weather conditions: Analysis of in situ aircraft measurements in Beijing, China. Atmos. Environ. 2009, 43, 5526–5535. [Google Scholar] [CrossRef]
- Collaud, C.M.; Weingartner, E.; Furger, M.; Nyeki, S.; Prévôt, A.S.H.; Steinbacher, M.; Baltensperger, U. Aerosol climatology and planetary boundary influence at the Jungfraujoch analyzed by synoptic weather types. Atmos. Chem. Phys. 2011, 11, 5931–5944. [Google Scholar] [CrossRef] [Green Version]
- Dörnbrack, A.; Stachlewska, I.S.; Ritter, C.; Neuber, R. Aerosol distribution around Svalbard during intense easterly winds. Atmos. Chem. Phys. 2010, 10, 1473–1490. [Google Scholar] [CrossRef] [Green Version]
- Quan, J.; Gao, Y.; Zhang, Q.; Tie, X.; Cao, J.; Han, S.; Meng, J.; Chen, P.; Zhao, D. Evolution of planetary boundary layer under different weather conditions, and its impact on aerosol concentrations. Particuology 2013, 11, 34–40. [Google Scholar] [CrossRef]
- Jacob, D.J.; Winner, D.A. Effect of climate change on air quality. Atmos. Environ. 2009, 43, 51–63. [Google Scholar] [CrossRef]
- Wang, H.; Xue, M.; Zhang, X.Y.; Liu, H.L.; Zhou, C.H.; Tan, S.C.; Che, H.Z.; Chen, B.; Li, T. Mesoscale modeling study of the interactions between aerosols and PBL meteorology during a haze episode in Jing–Jin–Ji (China) and its nearby surrounding region—Part 1: Aerosol distributions and meteorological features. Atmos. Chem. Phys. 2015, 15, 3257–3275. [Google Scholar] [CrossRef]
- European Union. Air Quality in Europe—2016 Report; European Environment Agency EEA Report No. 28/2016; Publications Office of the European Union: Luxembourg, 2016. [Google Scholar]
- Katsouyanni, K.; Pantazopoulou, A.; Touloumi, G.; Tselepidaki, I.; Moustris, K.; Asimakopoulos, D.; Poulopoulou, G.; Trichopoulos, D. Evidence for interaction between air pollution and high temperature in the causation of excess mortality. Arch. Environ. Health 1993, 48, 235–242. [Google Scholar] [CrossRef] [PubMed]
- Patz, J.A.; Campbell-Lendrum, D.; Holloway, T.; Foley, J.A. Impact of regional climate change on human health. Nature 2005, 438, 310–317. [Google Scholar] [CrossRef] [PubMed]
- Fischer, P.H.; Brunekreef, B.; Lebret, E. Air pollution related deaths during the 2003 heat wave in the Netherlands. Atmos. Environ. 2004, 38, 1083–1085. [Google Scholar] [CrossRef]
- Shaposhnikov, D.; Revich, B.; Bellander, T.; Bedada, G.B.; Bottai, M.; Kharkova, T.; Kvasha, E.; Lezina, E.; Lind, T.; Semutnikova, E.; et al. Mortality related to air pollution with the Moscow heat wave and wildfire of 2010. Epidemiology 2014, 25, 359–364. [Google Scholar] [CrossRef] [PubMed]
- Janicka, L.; Stachlewska, I.S.; Veselovskii, I.; Baars, H. Temporal variations in optical and microphysical properties of mineral dust and biomass burning aerosol derived from daytime Raman Lidar observations over Warsaw, Poland. Atmos. Environ. 2017, 169, 162–174. [Google Scholar] [CrossRef]
- Markowicz, K.M.; Chilinski, M.T.; Lisok, J.; Zawadzka, O.; Stachlewska, I.S.; Janicka, L.; Rozwadowska, A.; Makuch, P.; Pakszys, P.; Zielinski, T.; et al. Study of aerosol optical properties during long-range transport of biomass burning from Canada to Central Europe in July 2013. J. Aerosol Sci. 2016, 101, 156–173. [Google Scholar] [CrossRef]
- Ortiz-Amezcua, P.; Guerrero-Rascado, L.L.; Granados-Muñoz, M.J.; Benavent-Oltra, J.A.; Böckmann, C.; Samaras, S.; Stachlewska, I.S.; Janicka, L.; Baars, H.; Bohlmann, S.; et al. Microphysical characterization of long-range transported biomass burning particles from North America at three EARLINET stations. Atmos. Chem. Phys. 2017, 17, 5931–5946. [Google Scholar] [CrossRef]
- Pyta, H.; Rosik-Dulewska, C.; Czaplicka, M. Speciation of ambient mercury in the Upper Silesia Region, Poland. Water Air Soil Pollut. 2009, 197, 233–240. [Google Scholar] [CrossRef]
- Pastuszka, J.S.; Rogula-Kozłowska, W.; Zajusz-Zubek, E. Characterization of PM10 and PM2.5 and associated heavy metals at the crossroads and urban background site in Zabrze, Upper Silesia, Poland, during the smog episodes. Environ. Monit. Assess. 2010, 168, 613–627. [Google Scholar] [CrossRef] [PubMed]
- Maciszewska, A.E.; Markowicz, K.M.; Witek, M.L. A multiyear analysis of aerosol optical thickness over Europe and Central Poland using NAAPS model simulation. Acta Geophys. 2010, 58, 1147–1163. [Google Scholar] [CrossRef]
- Stachlewska, I.S.; Costa-Suros, M.; Althausen, D. Raman Lidar water vapor profiling over Warsaw, Poland. Atmos. Res. 2017, 194, 258–267. [Google Scholar] [CrossRef]
- Taravat, A.; Proud, S.; Peronaci, S.; Del Frate, F.; Oppelt, N. Multilayer perceptron neural networks model for meteosat second generation SEVIRI daytime cloud masking. Remote Sens. 2015, 7, 1529–1539. [Google Scholar] [CrossRef] [Green Version]
- Hammer, A.; Kühnert, J.; Weinreich, K.; Lorenz, E. Short-term forecasting of surface solar irradiance based on meteosat-SEVIRI data using a nighttime cloud index. Remote Sens. 2015, 7, 9070–9090. [Google Scholar] [CrossRef]
- Zawadzka, O.; Markowicz, K.M. Retrieval of aerosol optical depth from optimal interpolation approach applied to SEVIRI data. Remote Sens. 2014, 6, 7182–7211. [Google Scholar] [CrossRef]
- Gonzalez, L.; Briottet, X. North Africa and Saudi Arabia day/night sandstorm survey (NASCube). Remote Sens. 2017, 9, 896. [Google Scholar] [CrossRef]
- Zhang, Y.; Li, Z.; Qie, L.; Hou, W.; Liu, Z.; Zhang, Y.; Xie, Y.; Chen, X.; Xu, H. Retrieval of aerosol optical depth using the empirical orthogonal functions (EOFs) based on PARASOL multi-angle intensity data. Remote Sens. 2017, 9, 578. [Google Scholar] [CrossRef]
- Belle, J.H.; Liu, Y. Evaluation of aqua MODIS collection 6 AOD parameters for air quality research over the Continental United States. Remote Sens. 2016, 8, 815. [Google Scholar] [CrossRef]
- Nichol, J.E.; Bilal, M. Validation of MODIS 3 km resolution aerosol optical depth retrievals over Asia. Remote Sens. 2016, 8, 328. [Google Scholar] [CrossRef]
- Libner, P.; Stefeniak, G. Tablice Geograficzne (The Geographical Tables of Poland); Kram: Warsaw, Poland, 2017. [Google Scholar]
- Engelmann, R.; Kanitz, T.; Baars, H.; Heese, B.; Althausen, D.; Skupin, A.; Wandinger, U.; Komppula, M.; Stachlewska, I.S.; Amiridis, V.; et al. The automated multiwavelength Raman polarization and water vapor Lidar PollyXT: The neXT generation. Atmos. Meas. Tech. 2016, 9, 1767–1784. [Google Scholar] [CrossRef]
- Baars, H.; Kanitz, T.; Engelmann, R.; Althausen, D.; Heese, B.; Komppula, M.; Preißler, J.; Tesche, M.; Ansmann, A.; Wandinger, U.; et al. An overview of the first decade of PollyNET: An emerging network of automated Raman-polarization Lidars for continuous aerosol profiling. Atmos. Chem. Phys. 2016, 16, 5111–5137. [Google Scholar] [CrossRef] [Green Version]
- Pappalardo, G.; Amodeo, A.; Apituley, A.; Comeron, A.; Freudenthaler, V.; Linné, H.; Ansmann, A.; Bösenberg, J.; D’Amico, G.; Mattis, I.; et al. EARLINET towards an advanced sustainable European aerosol Lidar network. Atmos. Meas. Tech. 2014, 7, 2389–2409. [Google Scholar] [CrossRef] [Green Version]
- Holben, B.N.; Eck, T.F.; Slutsker, I.; Tanré, D.; Buis, J.P.; Setzer, A.; Vermote, E.; Reagan, J.A.; Kaufman, Y.J.; Nakajima, T.; et al. AERONET—A federated instrument network and data archive for aerosol characterization. Remote Sens. Environ. 1998, 66, 1–16. [Google Scholar] [CrossRef]
- Stachlewska, I.S.; Piadlowski, M.; Migacz, S.; Szkop, A.; Zielinska, A.J.; Swaczyna, P.L. Ceilometer observations of the boundary layer over Warsaw, Poland. Acta Geophys. 2012, 60, 1386–1412. [Google Scholar] [CrossRef]
- Sokół, P.; Stachlewska, I.S.; Ungureanu, I.; Stefan, S. Evaluation of the boundary layer morning transition using the CL-31 ceilometer signals. Acta Geophys. 2014, 62, 367–380. [Google Scholar] [CrossRef]
- Aminou, D.M. MSG’s SEVIRI Instrument. ESA Bull. 2000, 111, 15–17. [Google Scholar]
- Popp, C.; Hauser, A.; Foppa, N.; Wunderle, S. Remote sensing of aerosol optical depth over central Europe from MSG-SEVIRI data and accuracy assessment with ground-based AERONET measurements. J. Geophys. Res. 2007, 112, D24S11. [Google Scholar] [CrossRef]
- Mei, L.; Xue, Y.; de Leeuw, G.; Holzer-Popp, T.; Guang, J.; Li, Y.; Yang, L.; Xu, X.; Li, C.; Wang, Y.; et al. Retrieval of aerosol optical depth over land based on a time series technique using MSG/SEVIRI data. Atmos. Chem. Phys. 2012, 12, 9167–9185. [Google Scholar] [CrossRef] [Green Version]
- Rodgers, C. Inverse Methods for Atmospheric Sounding: Theory and Practice; Series on Atmospheric, Oceanic and Planetary Physics; World Scientific: Singapore, 2000; Volume 2. [Google Scholar]
- Benedetti, A.; Morcrette, J.-J.; Boucher, O.; Dethof, A.; Engelen, R.J.; Fischer, M.; Flentjes, H.; Huneeus, N.; Jones, L.; Kaiser, J.W.; et al. The GEMS-AER team. Aerosol analysis and forecast in the ECMWF Integrated Forecast System. Part II: Data assimilation. J. Geophys. Res. 2009, 114, D13205. [Google Scholar] [CrossRef]
- Morcrette, J.J.; Boucher, O.; Jones, L.; Salmond, D.; Bechtold, P.; Beljaars, A.; Benedetti, A.; Bonet, A.; Kaiser, J.W.; Razinger, M.; et al. Aerosol analysis and forecast in the ECMWF Integrated Forecast System. Part I: Forward modeling. J. Geophys. Res. 2009, 114D, D06206. [Google Scholar] [CrossRef]
- IMGW. Available online: www.pogodynka.pl/polska/mapa_synoptyczna (accessed on 22 November 2017).
- Owczarek, M.; Filipiak, J. Contemporary changes of thermal conditions in Poland, 1951–2015. Bull. Geogr. 2016, 10, 31–50. [Google Scholar] [CrossRef]
- Draxler, R.R.; Rolph, G.D. HYSPLIT (HYbrid Single-Particle Lagrangian Integrated Trajectory); Model Access via NOAA ARL READY Website; NOAA Air Resources Laboratory: Silver Spring, MD, USA, 2010. Available online: http://ready.arl.noaa.gov/HYSPLIT.php (accessed on 8 October 2017).
- Rolph, G.D. Real-Time Environmental Applications and Display System (READY); NOAA Air Resources Laboratory: Silver Spring, MD, USA, 2016. Available online: http://ready.arl.noaa.gov (accessed on 8 October 2017).
- Lynch, P.; Reid, J.S.; Westphal, D.L.; Zhang, J.; Hogan, T.F.; Hyer, E.J.; Curtis, C.A.; Hegg, D.A.; Shi, Y.; Campbell, J.R.; et al. An 11-year global gridded aerosol optical thickness reanalysis (v1.0) for atmospheric and climate sciences. Geosci. Model Dev. 2016, 9, 1489–1522. [Google Scholar] [CrossRef]
- Kaminski, J.W.; Neary, L.; Struzewska, J.; McConnell, J.C.; Lupu, A.; Jarosz, J.; Toyota, K.; Gong, S.L.; Côté, J.; Liu, X.; et al. GEM-AQ, an on-line global multiscale chemical weather modeling system: Model description and evaluation of gas phase chemistry processes. Atmos. Chem. Phys. 2008, 8, 3255–3281. [Google Scholar] [CrossRef]


| Instrument | 11 September 2017 | 12 September 2017 | 13 September 2017 | 14 September 2017 | 16 September 2017 |
|---|---|---|---|---|---|
| SEVIRI AOD at 635 nm | 0.39 | 0.26 | 0.29 | 0.13 | 0.16 |
| 0.36 | 0.25 | 0.29 | 0.13 | 0.16 | |
| 0.33 | 0.23 | 0.27 | 0.18 | 0.18 | |
| <0.36> | <0.25> | <0.28> | <0.15> | <0.17> | |
| MFR7 AOD at 675 nm | 0.39 | 0.23 | 0.28 | 0.09 | 0.11 |
| 0.39 | 0.25 | 0.30 | 0.10 | 0.10 | |
| 0.38 | 0.25 | 0.28 | 0.10 | 0.10 | |
| <0.39> | <0.24> | <0.29> | <0.1> | <0.11> | |
| Raman Lidar AOD at 532 nm | 0.27 | 0.23 | 0.22 | 0.11 | 0.13 |
| 0.33 | 0.22 | 0.23 | 0.12 | 0.16 | |
| 0.32 | 0.20 | 0.21 | 0.16 | 0.19 | |
| <0.31> | <0.22> | <0.22> | <0.13> | <0.16> | |
| Raman Lidar AOD at 355 nm | 0.38 | 0.37 | 0.35 | 0.30 | 0.37 |
| 0.41 | 0.35 | 0.36 | 0.29 | 0.34 | |
| 0.40 | 0.33 | 0.35 | 0.31 | 0.36 | |
| <0.38> | <0.35> | <0.35> | <0.30> | <0.36> | |
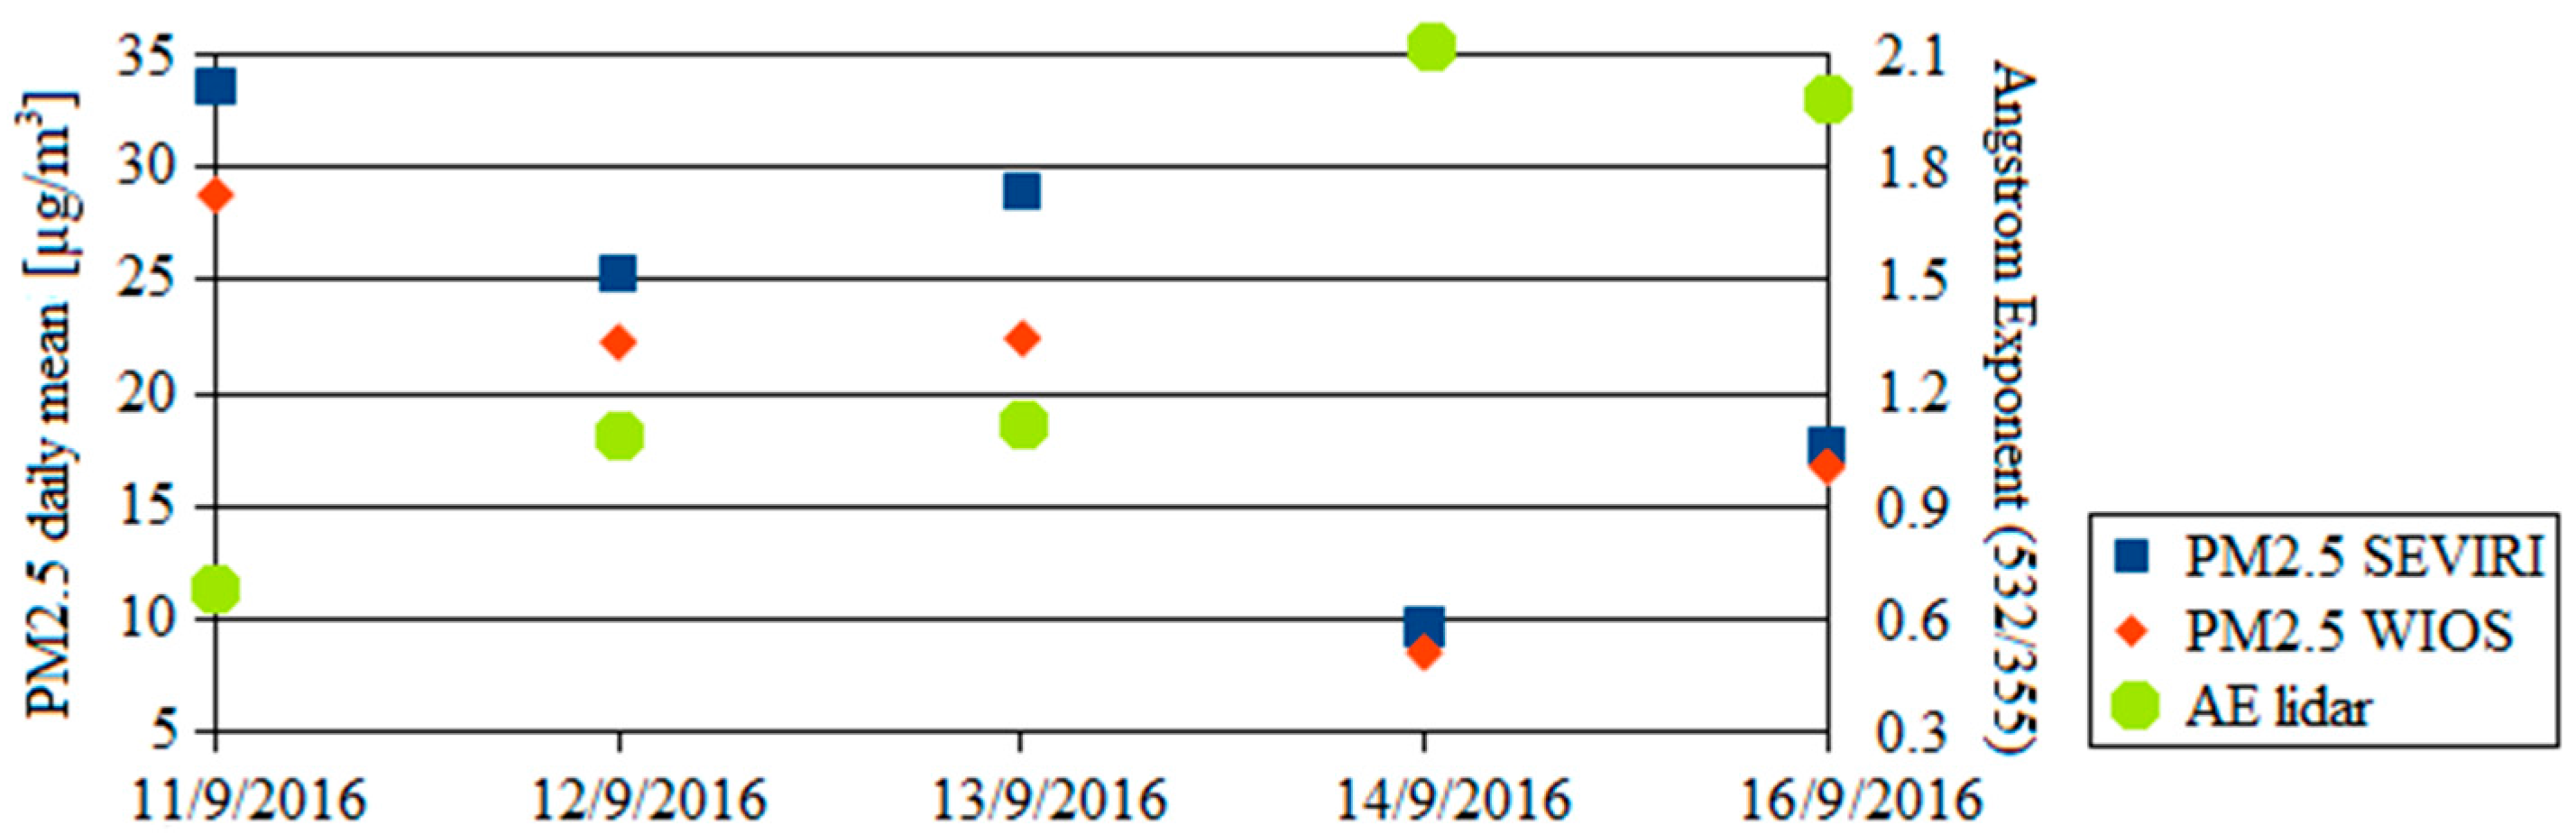
| SEVIRI PM2.5 (µg/m3) | 33.65 | 25.27 | 28.95 | 9.73 | 17.65 |
| Surface PM2.5 (µg/m3) | 28.8 | 22.3 | 19.6 | 8.6 | 16.8 |
| Ångström exponent (532/355) | 0.62 | 1.17 | 1.19 | 2.12 | 2.03 |
© 2017 by the authors. Licensee MDPI, Basel, Switzerland. This article is an open access article distributed under the terms and conditions of the Creative Commons Attribution (CC BY) license (http://creativecommons.org/licenses/by/4.0/).
Share and Cite
Stachlewska, I.S.; Zawadzka, O.; Engelmann, R. Effect of Heat Wave Conditions on Aerosol Optical Properties Derived from Satellite and Ground-Based Remote Sensing over Poland. Remote Sens. 2017, 9, 1199. https://0-doi-org.brum.beds.ac.uk/10.3390/rs9111199
Stachlewska IS, Zawadzka O, Engelmann R. Effect of Heat Wave Conditions on Aerosol Optical Properties Derived from Satellite and Ground-Based Remote Sensing over Poland. Remote Sensing. 2017; 9(11):1199. https://0-doi-org.brum.beds.ac.uk/10.3390/rs9111199
Chicago/Turabian StyleStachlewska, Iwona S., Olga Zawadzka, and Ronny Engelmann. 2017. "Effect of Heat Wave Conditions on Aerosol Optical Properties Derived from Satellite and Ground-Based Remote Sensing over Poland" Remote Sensing 9, no. 11: 1199. https://0-doi-org.brum.beds.ac.uk/10.3390/rs9111199