Article

An Incomplete Inventory of Suspected Human-Induced Surface Deformation in North America Detected by Satellite Interferometric Synthetic-Aperture Radar

by
Alana G. Semple
,
Matthew E. Pritchard
* and
Rowena B. Lohman
Department of Earth and Atmospheric Sciences, Cornell University, Ithaca, NY 14850, USA
*
Author to whom correspondence should be addressed.
Current address: Department of Earth, Environmental and Planetary Sciences, Rice University, MS-126, 6100 Main Street, Houston, TX 77005, USA.
Remote Sens. 2017, 9(12), 1296; https://0-doi-org.brum.beds.ac.uk/10.3390/rs9121296
Submission received: 18 September 2017 / Revised: 5 December 2017 / Accepted: 7 December 2017 / Published: 12 December 2017
(This article belongs to the Section Remote Sensing in Geology, Geomorphology and Hydrology)

Abstract

:
We used satellite interferometric synthetic-aperture radar (InSAR) data to document ground deformation across North America suspected to be caused by human activities. We showed that anthropogenic deformation can be measured from space across the continent and thus satellite observations should be collected routinely to characterize this deformation. We included results from the literature as well as new analysis of more than 5000 interferograms from the European Remote Sensing (ERS) satellite, Envisat, the Advanced Land Observing Satellite (ALOS), and other satellites, collectively spanning the period 1992–2015. This compilation, while not complete in terms of spatial or temporal coverage nor uniform in quality over the region, contains 263 different areas of likely anthropogenic ground deformation, including 65 that were previously unreported. The sources can be attributed to groundwater extraction (50%), geothermal sites (6%), hydrocarbon production (20%), mining (21%), and other sources (3%) such as lake level changes driven by human activities and tunneling. In a few areas, the source of deformation is ambiguous. We found at least 80 global positioning system (GPS) stations within 20 km of of these areas that could be contaminated by the anthropogenic deformation. At sites where we performed a full time series analysis, we found a mix of steady and time-variable deformation rates. For example, at the East Mesa Geothermal Field in California, we found an area that changed from subsidence to uplift around 2006, even though publicly available records of pumping and injection showed no change during that time. We illustrate selected non-detections from wastewater injection in Oklahoma and eastern Texas, where we found that the detection threshold with available data is >0.5 cm/yr. This places into doubt previous results claiming detection below this threshold in eastern Texas. However, we found likely injection-induced uplift in a different area of eastern Texas at rates in excess of −2 cm/yr. We encourage others to expand the database in space and time in the supplemental material.

Graphical Abstract

1. Introduction

Human activity, such as mining, extraction of ground water and hydrocarbons, injection of fluid to enhance secondary recovery of hydrocarbons or dispose of wastewater, and utilization of geothermal fields, can cause displacements of the Earth’s surface that scientists can measure from space (e.g., [1,2]). This anthropogenic deformation is important to quantify for several reasons—(1) it can present a hazard to infrastructure (e.g., [3,4]); (2) it contaminates precise measurements of other types of deformation (e.g., magmatic, tectonic, or glacial isostatic adjustment; [5,6,7,8,9]); (3) the Earth’s response to known pumping, surface change, or mining activity can provide otherwise inaccessible information about the subsurface (e.g., [10,11]); and (4) when there is damage, discriminating anthropogenic and natural deformation can have implications for liability—for example deformation (particularly subsidence) can exacerbate natural hazards like flooding and sea level rise (e.g., [12,13]). While individual sites in North America have been examined in detail (e.g., [5,6,10,11,14,15,16,17,18]), we lack a continental-scale, synoptic view of anthropogenic deformation and its significance, including characterization of how well we can observe it when it exists, i.e., the detection threshold for signals with a range of scales and environments.
In this paper, we present a catalog of anthropogenic deformation signals in North American over the period 1992–2015 that have been detected primarily using satellite interferometric synthetic-aperture radar (InSAR), based on both the scientific literature and new data analysis. We focus here on deformation that is related, at least in part, to changes in the subsurface—land use changes associated with logging and agricultural activity can also be detected by InSAR (e.g., [19,20]) but we do not attempt to document all of these sources here. We focus on deformation at spatial scales of much less than 50 km and not the longer-wavelength deformation from glacial isostatic adjustment (GIA) or tectonics (e.g., [21,22,23]). While the catalog is incomplete in terms of spatial and temporal sampling, it allows some basic questions to be answered for the first time and serves as a foundation for future studies. For example: What are the dominant causes of anthropogenic ground deformation and does the dominant source vary with location in North America? To what extent are surveying monuments, like those of the global positioning system (GPS) that are part of the Plate Boundary Observatory (PBO) and other networks, impacted by anthropogenic deformation? Are sufficient InSAR data being collected to fully characterize anthropogenic deformation in North America? In what areas are human activities occurring, but without deformation that can be detected by available satellite-based InSAR catalogs? In the next sections we describe the InSAR data used to create the catalog of anthropogenic ground deformation, how the cause of the deformation was assessed, and then examine the characteristics of this catalog, which is fully available in the supplemental material.

2. Data and Methods

InSAR is a geodetic tool that has been used for the past several decades to measure and monitor changes in the shape of the Earth’s surface by measuring the difference in the radar line-of-sight (LOS) between radar acquisitions taken at two different times (e.g., [24]). Spatial resolution of the images (or interferograms) depends on the satellite and observation mode (described below). For this study, resolution is at around tens of meters per pixel over images spanning hundreds of square kilometers, allowing InSAR to complement less spatially dense ground-based surveys and geodetic networks. Radar imaging is able to operate at night and in the presence of cloud cover. However, the available satellite InSAR observations have some limitations (described below) that result in non-uniform quality of observations over North America.

2.1. InSAR Processing

We have compiled available InSAR observations of anthropogenic deformation from the literature throughout North America (Table S1) and have systematically processed InSAR data over the conterminous USA to complement the literature studies. We use the Caltech/Jet Propulsion Laboratory software suite ROI_PAC [25] with the topographic contribution removed from the interferograms using the 3-arcsecond (∼90 m/pixel) Shuttle Radar Topography Mission (SRTM) [26] digital elevation models (DEMs) in most areas. In a few limited areas in the eastern U.S. (documented in figure captions), we also use DEMs from the 1-arcsecond (∼30 m/pixel) SRTM and the 10- or 30-m/pixel USGS National Elevation Dataset (NED) [27]. As we document below, we have used different satellites and processing strategies in different geographic areas. Our processing strategy is controlled by data availability and computational constraints. In the western USA, we create time series of interferograms primarily from European Space Agency’s (ESA) three satellites with C-band radars (5.6 cm wavelength) between roughly 1992 and 2011: European Remote Sensing-1 (ERS-1), ERS-2, and Envisat (Table 1). In the eastern USA, we create individual interferograms from the Japan Aerospace Exploration Agency’s (JAXA) Advanced Land Observing Satellite-1 (ALOS-1) with an L-band radar (wavelength 23.6 cm) spanning the years 2006–2011, with additional interferograms and time series from ALOS-1 in selected deforming areas (Table 2). In all areas, we selectively processed adjacent, but non-overlapping, satellite tracks instead of all possible tracks to minimize disk space usage while covering as much area as possible (although there were gaps between tracks visible in Figure 1 and Figure 2). In areas where signals were found to be present, we examined the other overlapping satellite tracks when signal size and data availability warranted it, but we did not stitch tracks together or use multi-track analysis of individual pixels.

2.1.1. Western USA

Previous studies have demonstrated that synthetic-aperture radar (SAR) observations over large portions of the western conterminous USA result in high-quality, coherent interferograms, even over time intervals of a year or longer (e.g., [6,10,11,14,15,17]). This fact, coupled with the high levels of tectonic and magmatic activity in the region prompted coordinated, routine data collection from ERS-1, ERS-2, and Envisat. We processed 18 different tracks of data from these satellites (Table 1 and Figure 1) including, on average, 145 interferograms in each track with multiple frames spanning 200–1800 km in length. For a few selected areas (three tracks total, Table 1), we also processed data from ALOS-1 spanning the years 2006–2011. The pairs of acquisition dates used to create interferograms were determined with the criteria of a perpendicular baseline of 300 m or less for the C-band satellites, and a baseline of 1000 m or less for the L-band ALOS-1 satellite. Each interferogram was individually examined at a downsampled resolution of ∼90 m/pixel (4 “looks” in range, 20 “looks” in azimuth) to identify areas where ground deformation was present (Table S1). In these areas, the data was further downsampled to 32 range looks (160 looks in azimuth), or 720 m/pixel for time series analysis using a modified version of the small baseline subset (SBAS) algorithm [29] as implemented by Henderson and Pritchard [30]. Downsampling the interferograms increases the signal-to-noise ratio, results in more robust phase unwrapping, and reduces processing time and file size, allowing for large amounts of data to be processed more efficiently.
For our processing in the western USA, we delimited the northern, western, southern, and eastern boundaries of the region to be studied by producing test interferograms for those areas to assess data quality and evaluating the distribution of available C-band data. In Figure 1, we show a measure of data quality for individual interferograms (as calculated in ROI_PAC software for use as a mask for phase unwrapping that scales phase variance as a unitless value between 0 and 1) for the three C-band satellites in the western USA. Values close to 1 indicate good data quality (little change between the time of SAR acquisitions). The interferograms shown in Figure 1 span a range of time intervals (9 months to 2 years) and include data acquired in different seasons, but the general patterns are representative of the spatial variations in data quality. Specifically, the coherence and InSAR data quality are lower in the areas with high topographic relief and/or seasonal snow cover (like the Sierra Nevada and Rocky Mountains) and at the northernmost and southernmost latitudes of the study area, likely because of changes in vegetation and precipitation.

2.1.2. Eastern USA

In the eastern USA (east of about longitude 102 W), there have been relatively few studies using InSAR to measure deformation of the Earth’s solid surface, in part because of the lack of data and poor data quality at the C-band in heavily vegetated areas (however, see [12,31]). However, the longer radar wavelength, L-band observations from the ALOS-1 satellite (46-day repeat interval) are coherent over much of the eastern USA. We use a simple approach to take the first systematic look at the data in this region—we create single, multi-frame interferograms from 32 independent ALOS-1 paths, some more than 2000 km in length. We choose interferograms that have short perpendicular baselines, to minimize decorrelation due to vegetation and topographic relief, and that span long time intervals so that any secular deformation signals will be larger relative to sources of noise (Table 2 and Figure 2). The use of single, long-term interferograms can miss deformation in areas that decorrelate over short timescales, as well as deformation that is reversible over time and/or seasonal (e.g., [32]). Each interferogram was individually examined for signals of potential ground deformation at a downsampled resolution of four looks in the range direction (∼30 m/pixel) and typically with eight looks in the azimuth direction to produce square pixels. In five areas where potential deformation is suspected, we processed additional ALOS-1 data over a smaller area (documented in Table 2).
Another potentially useful dataset over urban areas in the eastern USA is comprised of X-band radar observations (wavelength 3.2 cm) collected by the CosmoSKY-Med (CSM) satellites of the Italian Space Agency. Although we have not systematically processed this data due to limits on time and data quota, we report on a time series of observations covering Washington, DC, and Alexandria, VA [33,34] that shows potential anthropogenic deformation to illustrate the potential for further analysis of this data.

2.1.3. Deformation Detection and Error Analysis

Here we briefly summarize our assessment and minimization of sources of error that affect SAR interferograms and time series analysis (e.g., [35,36,37]). We do not include corrections for the contribution from the atmosphere—instead, we require that candidate deformation signals be visible in multiple, independent interferograms using pair-wise logic (e.g., [38]). To reduce the contribution of noise to the time series, dates where all interferograms sharing that date have a spatially-averaged variance greater than the 2 σ threshold for the entire dataset and those with noticeable large atmospheric patterns were omitted from the time series. To facilitate the visibility of small deformation signals, we estimate a quadratic ramp for each interferogram to correct for long-wavelength (>50 km) errors associated with orbital, ionospheric, atmospheric, and other effects (e.g., [39]). These ramps do not generally affect our conclusions about the smaller scale ( < 50 km) anthropogenic deformation, but do remove long-wavelength sources of deformation (e.g., GIA or tectonic). Interferograms covering a shorter time period are usually more coherent or are less noisy than those with longer temporal baselines (e.g., [40]). We used a maximum temporal baseline of 5 years to maximize coherence. Some areas become decorrelated when one scene has snow, but L-band observations are often correlated in the presence of dry snow (e.g., [28,41]), which is typical in the continental interior (e.g., [42]) and can produce a coherent phase signature. This is an additional source of noise for the ALOS-1 data, but suspected deformation can be confirmed by using independent interferograms that do not include snow (e.g., [28]).
Some types of human activity cause significant changes (>100 m) to the topography (e.g., mining tailings piles) compared to the SRTM DEM (collected in February 2000) resulting in a phase change in the interferogram caused by DEM error. These types of large topographic changes can result in decorrelation while the Earth’s surface is being modified, but can be coherent once activity stops when it is not trivial to separate the topographic change effect from subsequent surface movement. SRTM is the most recent open-source DEM with high quality over the entire study area, but a comparison of more recent DEMs with the SRTM DEM is needed to determine whether the signal was just DEM error or also included ground motion. For the purposes of this study, we have not tried to discriminate between these, and just noted that there were mining-related changes detected by InSAR. For example, we suspect that the phase changes observed at several mines, including Mesquite Mine in Brawley, CA and the Kennecott tailings piles in Salt Lake City, UT (Table S1), are actually DEM errors caused by elevation changes as material is displaced during mining operations, as noted at the Centralia mine, WA (e.g., [43]).
The threshold to detect deformation over our study area is spatially variable. C-band time series have robustly constrained deformation at rates of a few mm/year or less (e.g., [37,44,45]), but considering that not all areas have data of the quality used in those studies, we estimate our detection threshold is higher—perhaps 0.5 cm/yr across the entire western USA for time series data. For ALOS-1, which was operational for a much shorter time period than ENVISAT or the ERS-1/2 satellites, time series results from other regions indicate that deformation rates below about 0.5–2.5 cm/yr can not be detected (e.g., [46,47]). Lower detection thresholds of 0.3–0.4 cm/yr are possible where GPS stations are available to correct the ALOS-1 time series (e.g., [48]) Considering that we are using single interferograms instead of a time series approach for ALOS-1 (except in the Texas and New York examples), and are examining data from a wide range of terrains and with varying levels of agricultural activity and vegetation, our detection threshold is higher. We estimate the detection threshold is 3–4 cm/yr for the ALOS-1 interferograms across the eastern USA, but this value clearly varies across the area of about 1 million square km.

2.1.4. Attribution of the Cause of Deformation

We identify potential anthropogenic deformation signals above the detection threshold through manual examination of individual interferograms and the time series analysis (where available) for each track. We use the following criteria to propose a suspected anthropogenic cause of deformation as distinct from natural deformation: visual assessment of the area using the processed SAR amplitude images and optical imagery, the presence of agricultural fields that may be associated with groundwater extraction, attribution as anthropogenic deformation in previous work, presence of a known mine (e.g., [49]) or geothermal power plant in the vicinity, or evidence of other human activity. We use the following broad classifications: groundwater, mining (includes surface and subsurface, which can be difficult to separate), hydrocarbon, geothermal, and other (including unknown). In areas of groundwater withdrawal near a mine, we attribute the deformation to the mining category.
SAR interferograms are sensitive to increases and decreases in length along the radar LOS direction. The satellites utilized here view the ground at approximately 23–34 degrees from vertical. Observed increases or decreases in the LOS can often be attributed to ground subsidence and uplift, respectively, although horizontal motions do occur and can, in fact, dominate in some locations (see example from Alexandria, VA, below). The sign of the observed displacements can also change from positive to negative. For example, a time series near Roswell, NM (Figure 3) exhibits a seasonal pattern similar to those that have been related to groundwater pumping during the dry season and recharge during the wet season in other areas (e.g., [4,32]). Thus, we suspect that this signal is related to groundwater use. For all sites, the coordinates of the center of the deformation and the potential cause are in Table S1.

2.2. Comparison with GPS

We compare our list of anthropogenic deformation locations to 2869 publicly available GPS locations (as archived at UNAVCO and accessed in early 2015) to determine which GPS stations are within 20 km of the center of an anthropogenic deformation signal. We then plot the locations of these GPS stations with the geographically rectified interferograms and time series to visually assess the impact of anthropogenic deformation on these stations. If a station is located within the footprint of deformation identified in either the interferograms or time series, we mark it as potentially contaminated. If the GPS station is located outside the footprint of deformation, we mark it as most likely not impacted by anthropogenic deformation. We leave a rigorous comparison of the GPS measurements with the InSAR at the same location for future work.

3. Results

In this study, we have manually cataloged 263 locations of deformation in the western US, Canada, and Mexico (Table S1, Figure 4) with 50% (132) attributed to groundwater (extraction or aquifer refilling), 6% (16) to geothermal activity, 20% (51) to hydrocarbon production (extraction or stimulation), 21% (55) to mining activity (surface or subsurface, including groundwater pumping related to mining), and 3% (9) to other anthropogenic activities. To our knowledge, about 65 are described here for the first time in the open scientific literature. The rest of the anthropogenic signals were identified through literature review, and most of these signals were confirmed through our InSAR analysis. Our survey also found no detectable signal in some places where deformation was previously expected, and we describe a few of these null results in the following sections. For most of the figures, blue colors (negative) indicate movement toward the satellite—i.e., decrease is the satellite LOS or upward movement with the sign of EW and NS motion depending on whether the orbital track is ascending or descending, except where noted otherwise in the caption.

3.1. Selected Detections

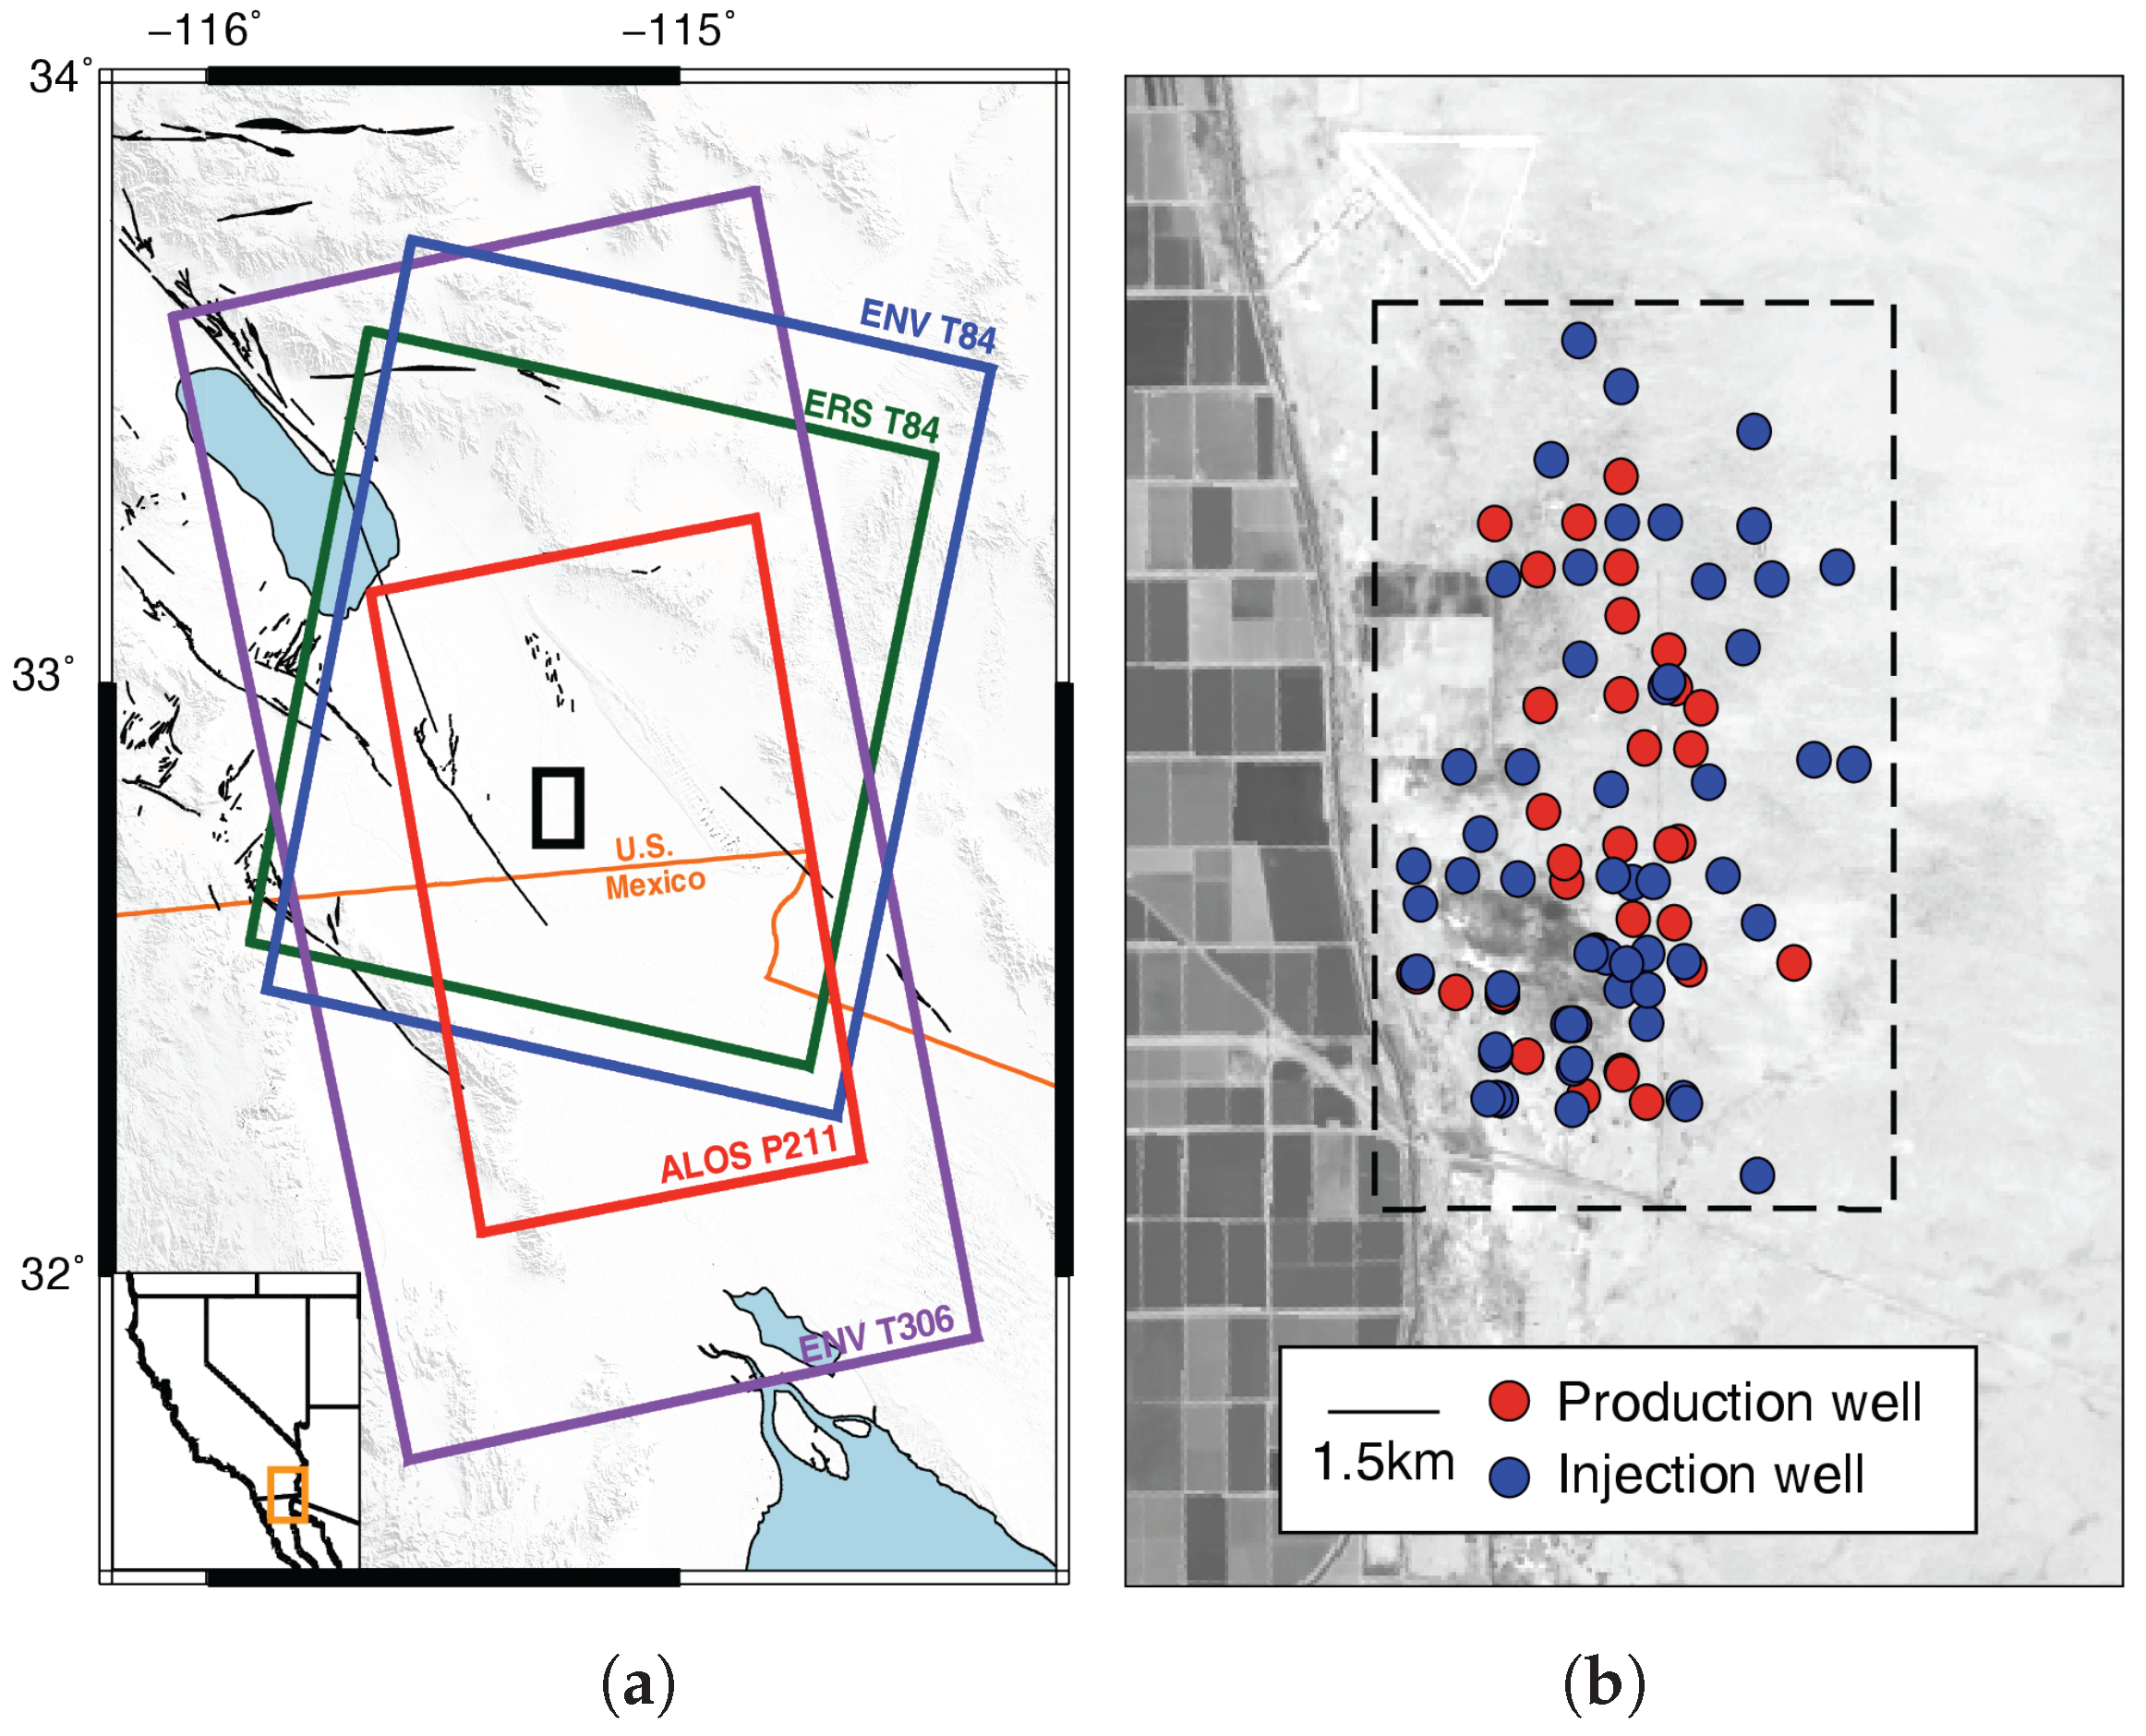
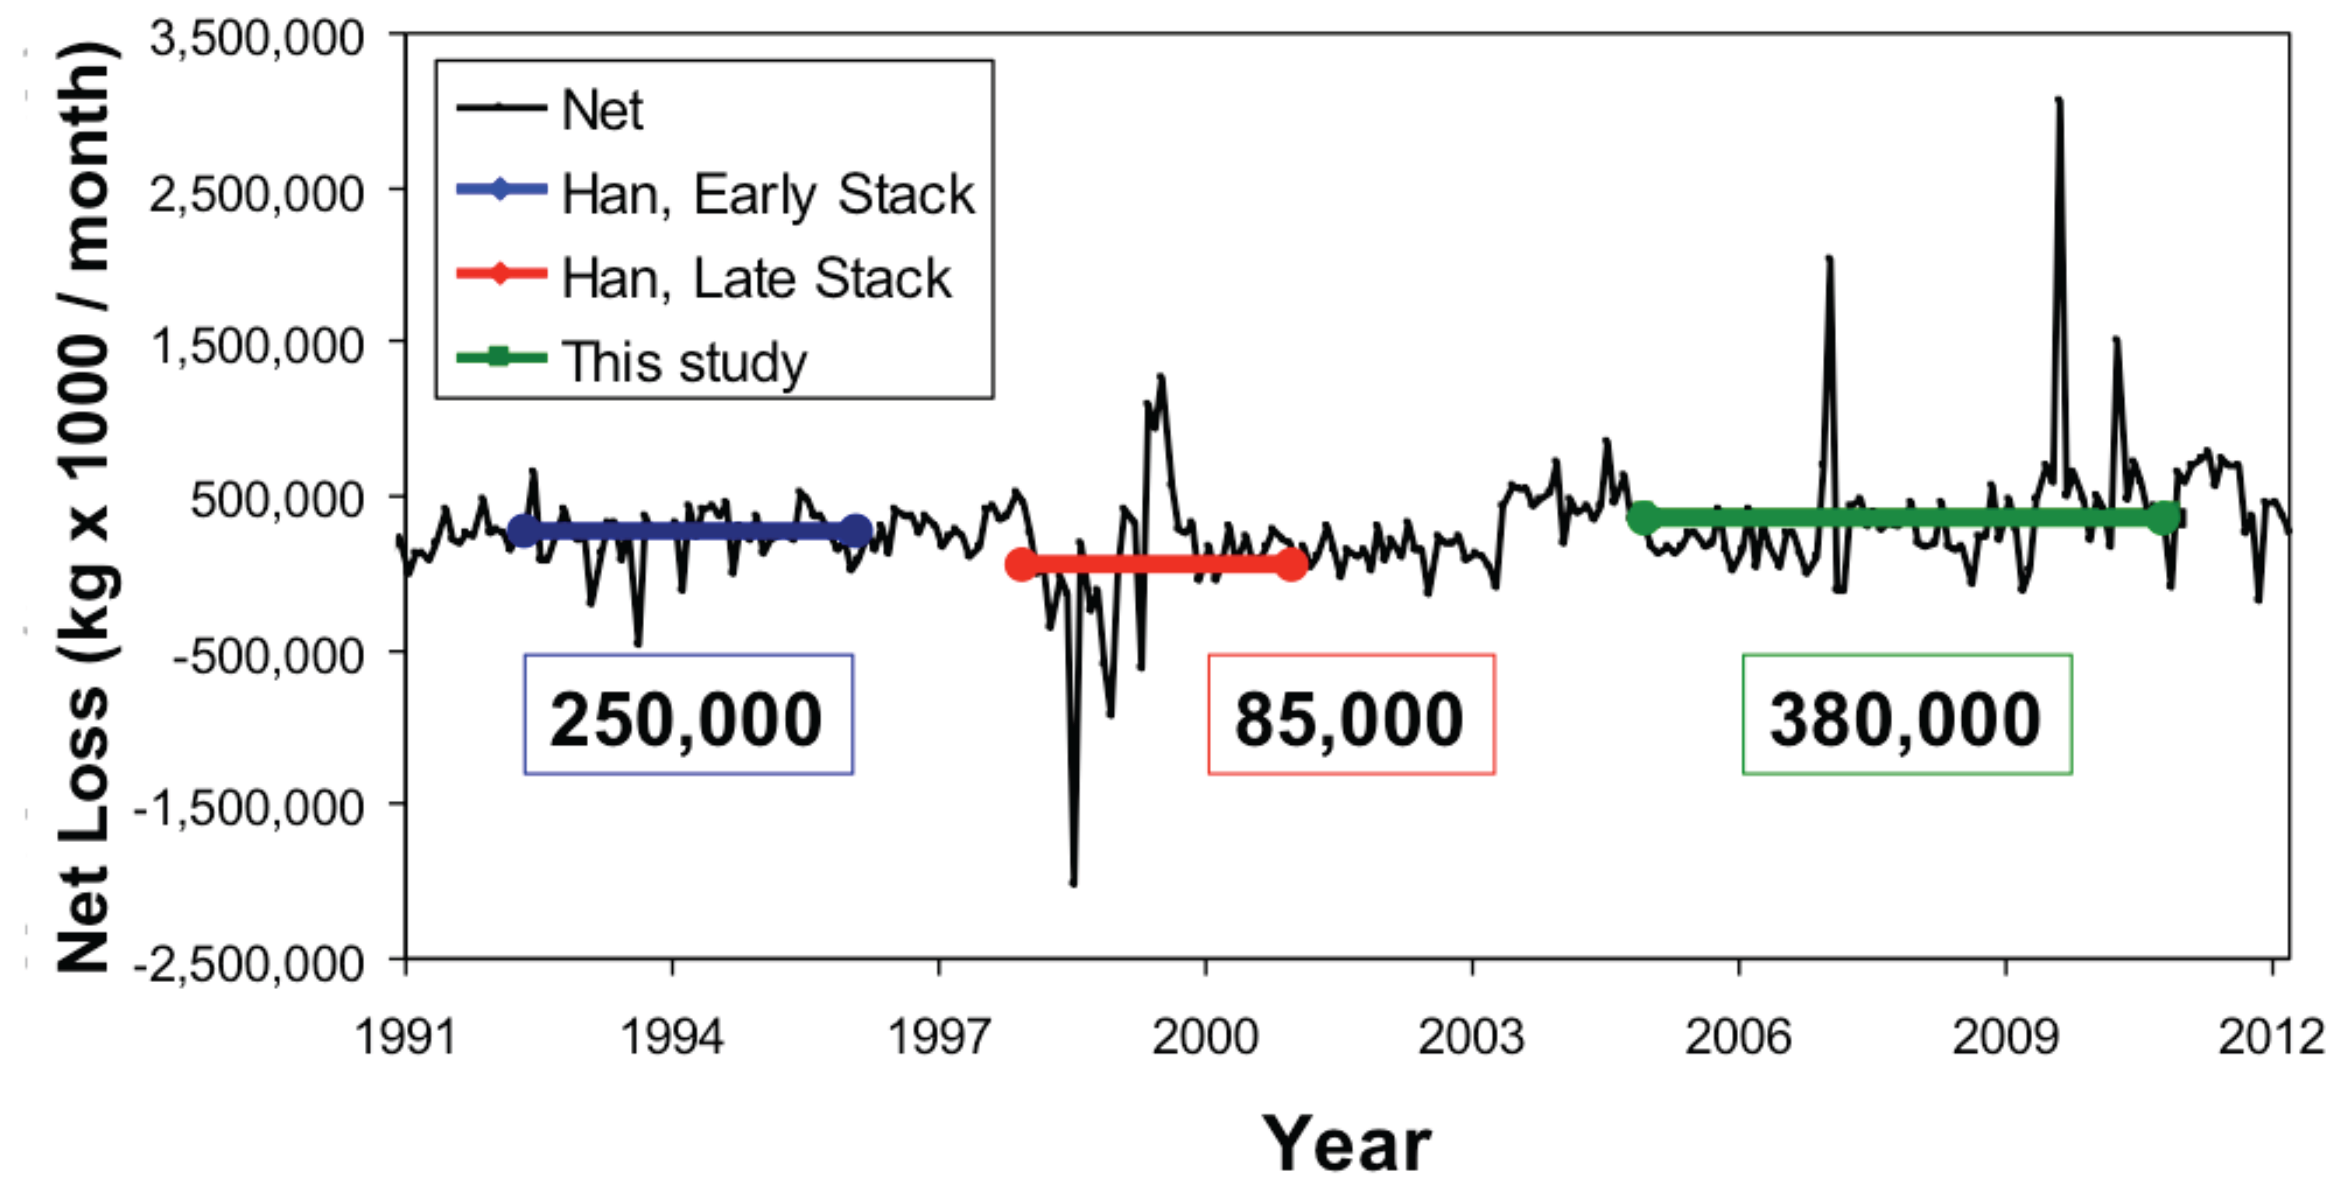
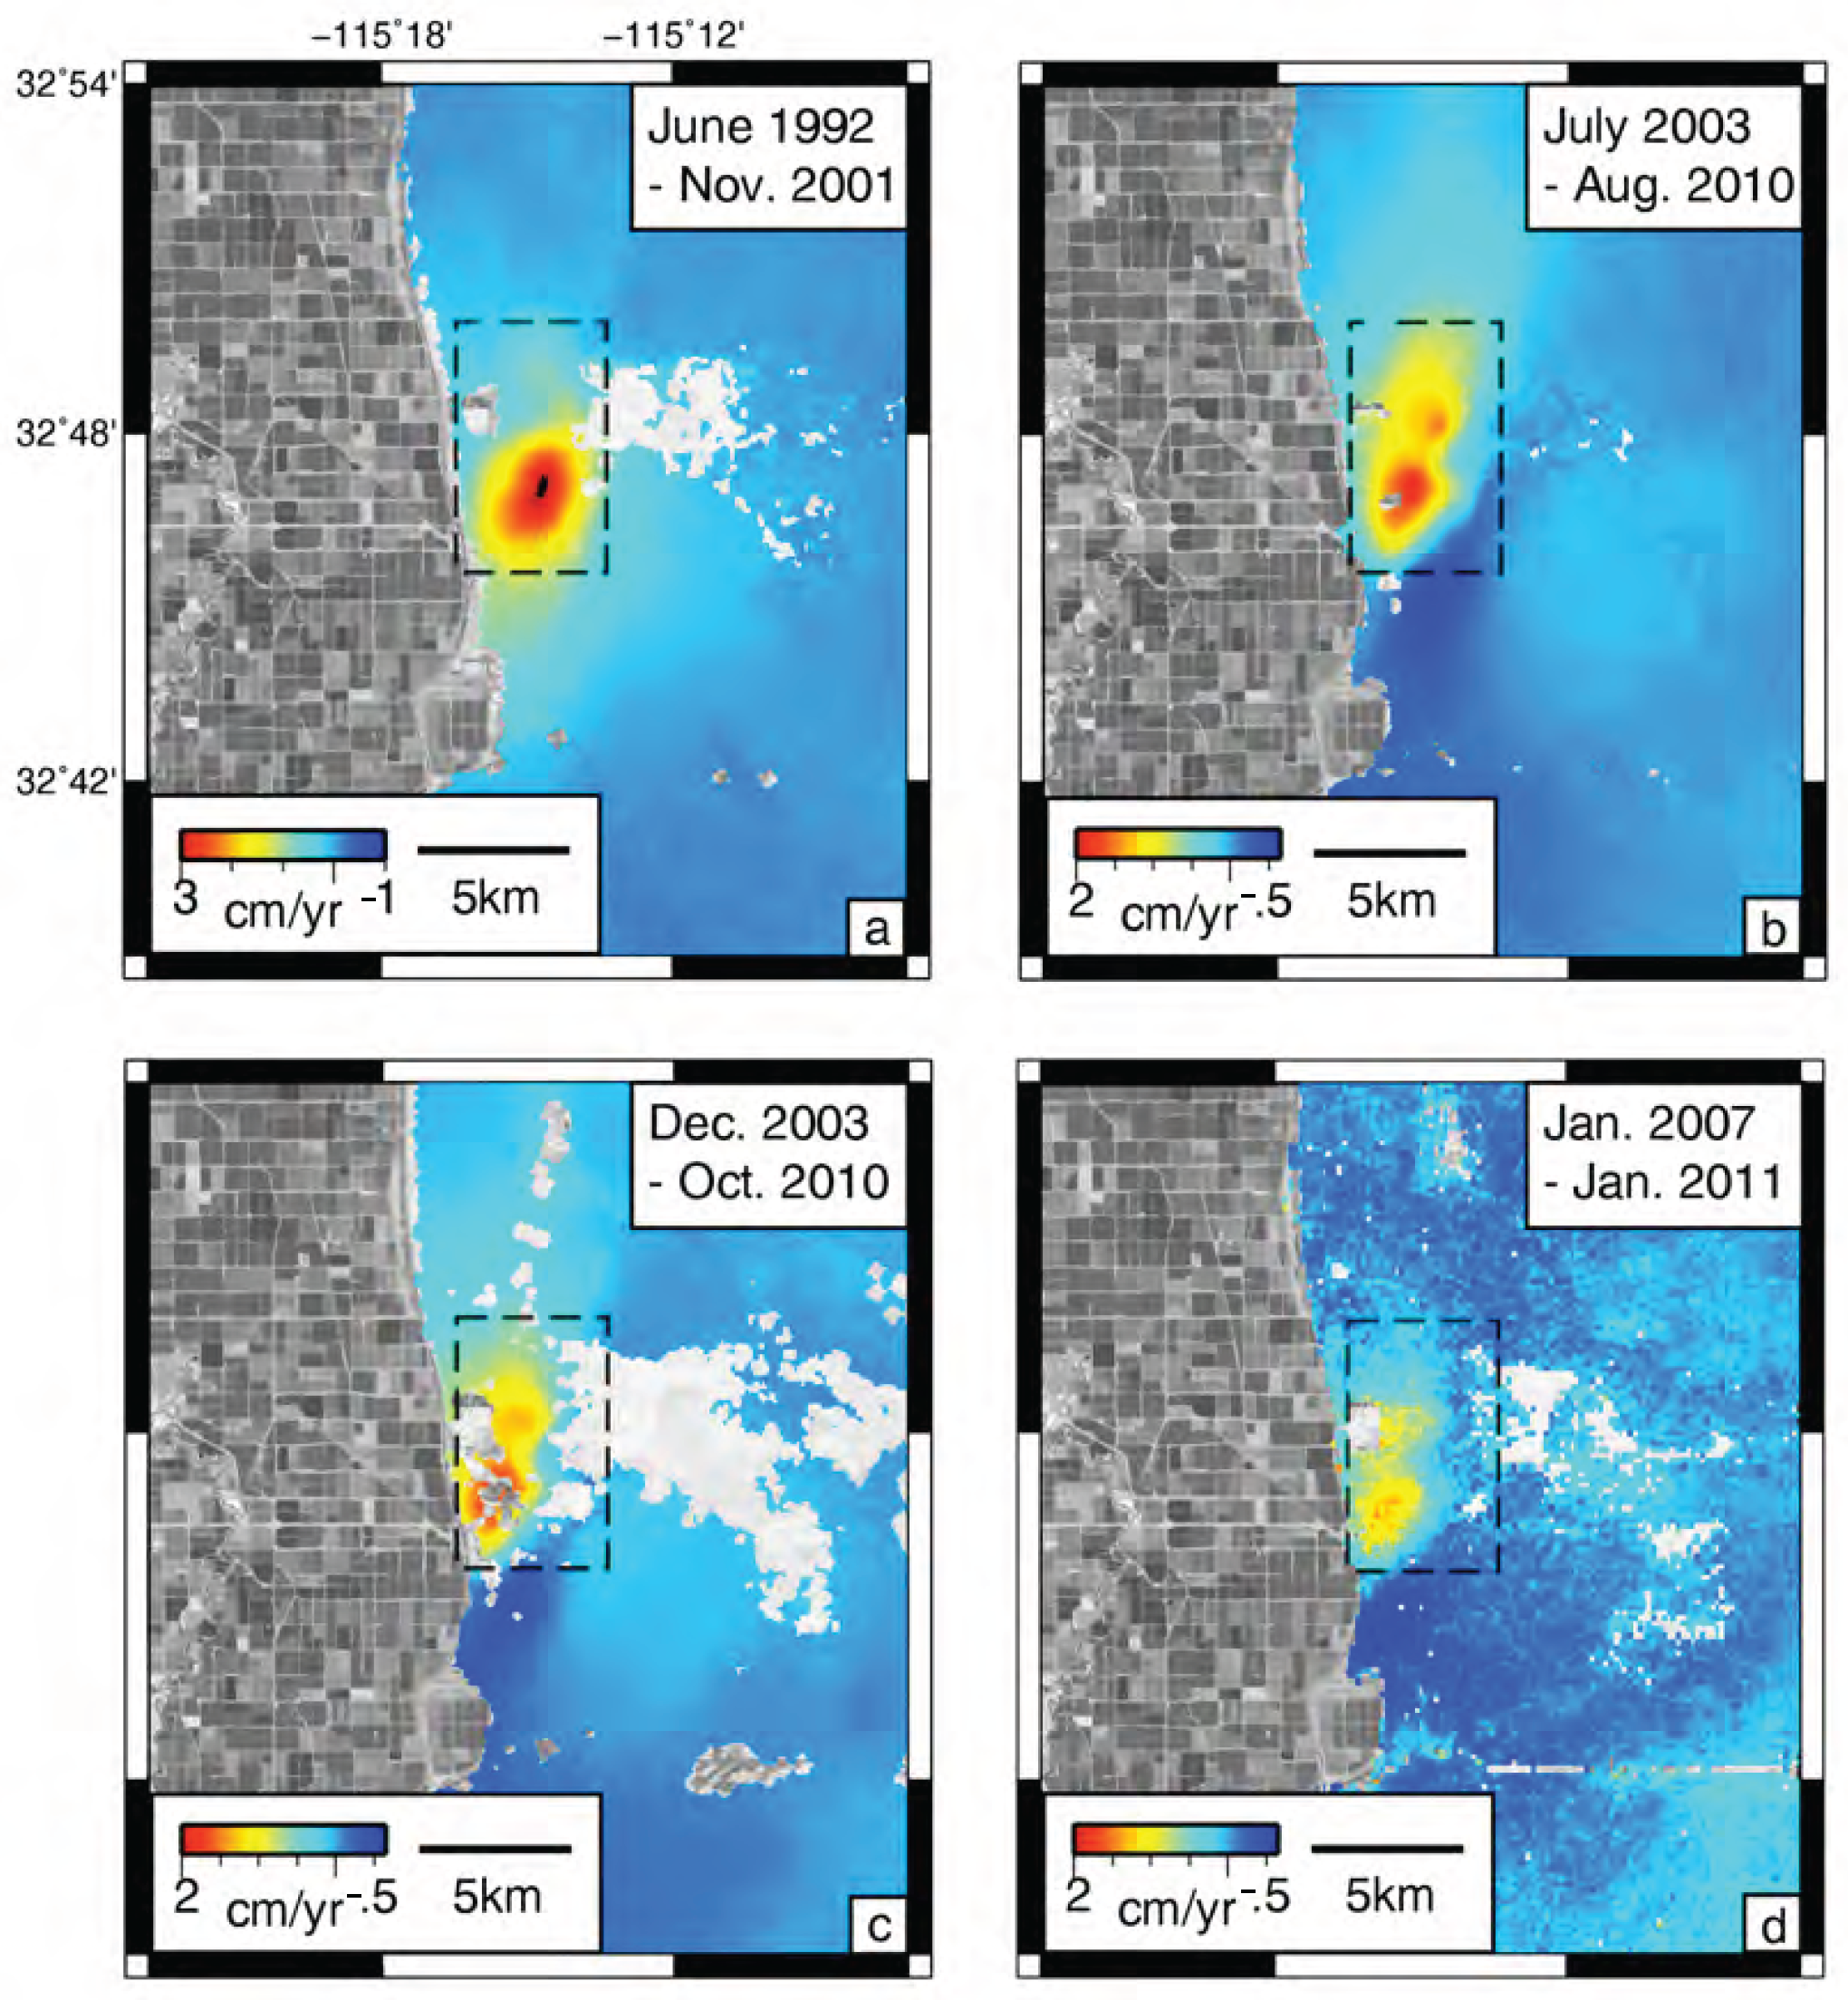
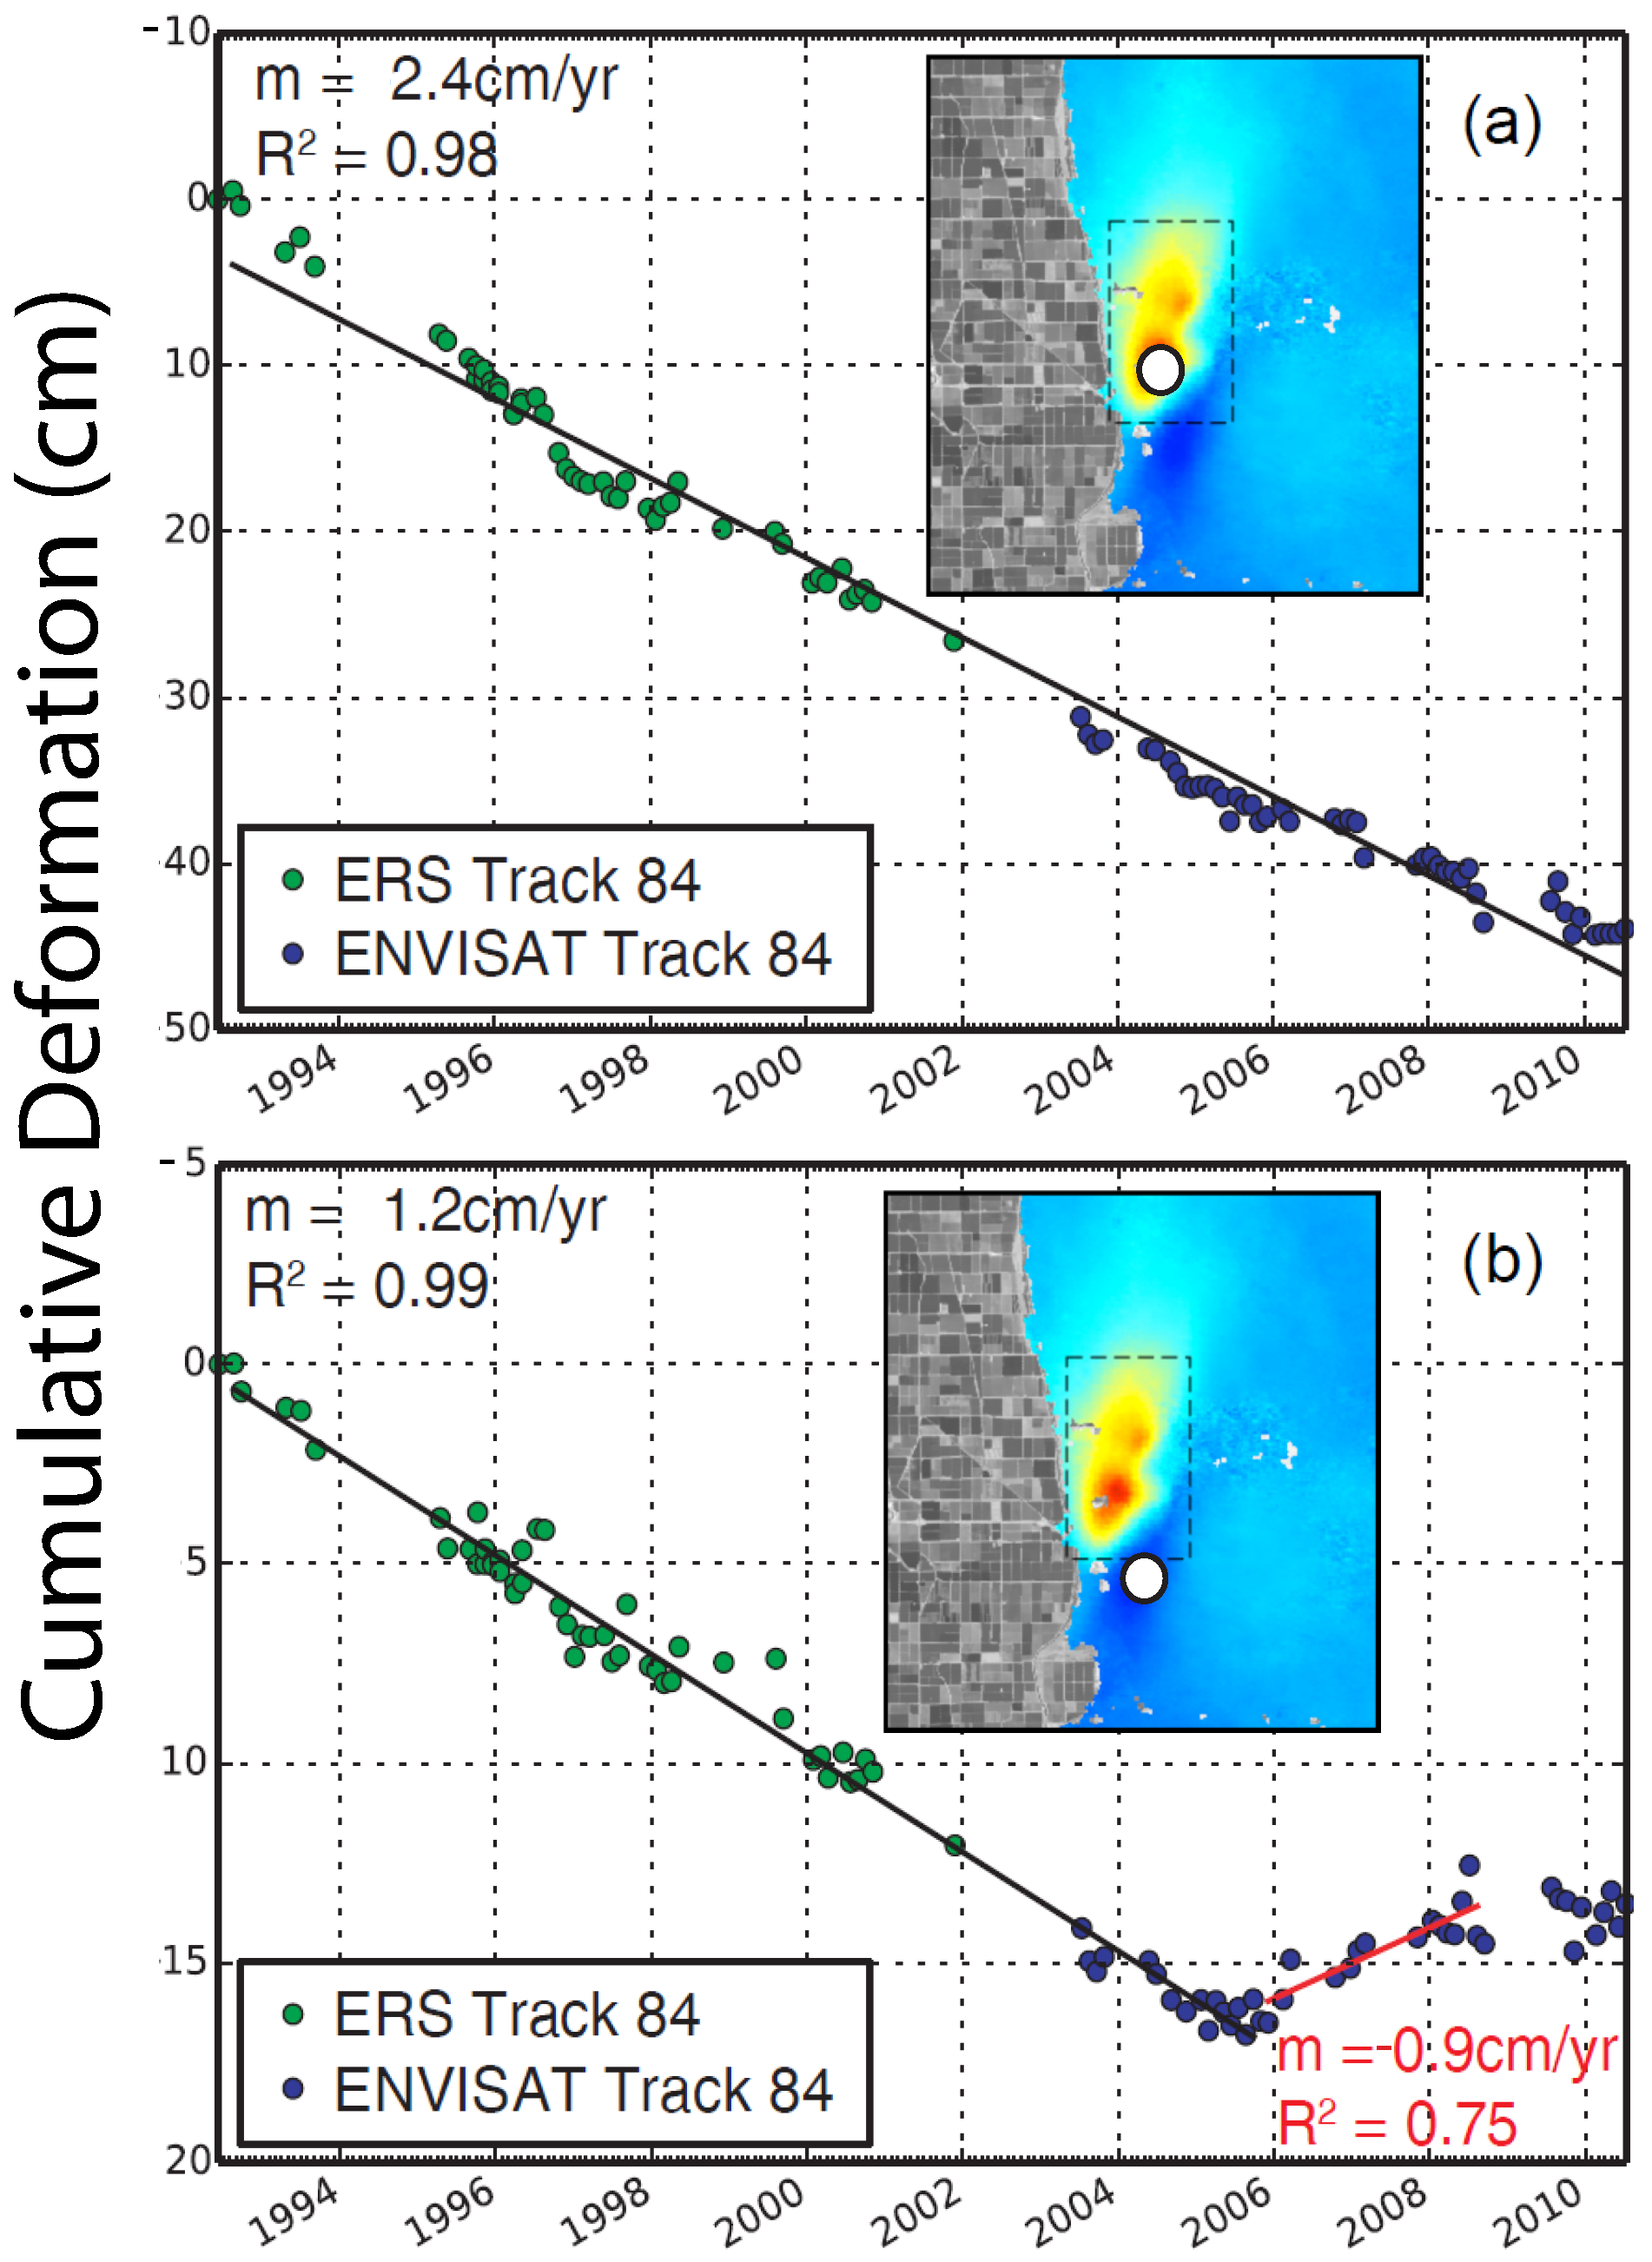
3.1.1. East Mesa, CA

Ground deformation at the East Mesa Geothermal Field (EMGF, Figure 5), also known as the Ormesa complex, shows the value of InSAR in revealing a spatially and temporally complex of deformation that is not easily predicted based on publicly available pumping records. EMGF is a series of six geothermal power plants with a 57-MW generating capacity comprised of several production and reinjection wells that started in 1983. Despite 96% reinjection (e.g., Figure 6, [50]), the EMGF has been experiencing subsidence since at least 1992, which is of particular interest due to its close proximity to several major canals (e.g., [14,50]).
Before significant geothermal development had begun (between 1972 and 1977), ground deformation in the Imperial Valley showed tectonic vertical changes of up to 3.5 centimeters [51,52]. While a survey line was in close proximity to East Mesa, anthropogenic deformation at the EMGF was not investigated until InSAR studies (e.g., [14,50]) showed an area of subsidence centrally located on the well field. The rates from InSAR were found to be consistent with the 1991 and 1994 releveled survey data from the line south of the field [14]. Given these rates and the proximity of the deformation to the geothermal field, the authors attribute geothermal fluid production as the source of the subsidence. Our time series study builds on previous InSAR studies of the EMGF (e.g., [14,50,53,54]), by using both ascending and descending tracks (total of 1043 interferograms, Table 1) from four satellites (ERS-1, ERS-2, Envisat, and ALOS) adding 11 years of new data not used in previous work to cover a 19-year time period (1992–2011, Figure 7 and Figure 8).
Han et al. [50] used InSAR to show that subsidence at East Mesa was decreasing over time, from 4.3 cm/yr (1992–1997) to 3.4 cm/yr (1996–2000) in the radar LOS, which was consistent with our analysis (Figure 8). Han et al. [50] related the decrease in subsidence rate (Figure 8) to a decrease in net water loss (projection minus injection volumes) in the geothermal system between 1992 and 1997, and between 1996 and 2000, as recorded by monthly production and injection volumes for the field (Figure 6) integrated for all wells, which are reported to the California Department of Conservation (http://www.conservation.ca.gov/DOG/geothermal). In contrast, more recent Envisat data from tracks 84 and 306 revealed changes in the shape and style of deformation (Figure 7 and Figure 8). The time series reveals the onset of relative uplift in the southern portion of the well field starting in 2006 (Figure 8). During the period of uplift, subsidence continued over the area of maximum deformation rate, which decreased to about 2 cm/yr in the radar LOS, and deformation began to extend further northward by several kilometers. The area of LOS decrease deformed at a rate of −1 cm/yr in the radar LOS until early 2008 before a period of little to no displacement from 2008 to 2010 (Figure 8b). We observed an increase in net water loss from 200,000 to 380,000 metric tons/month when we compared the time periods from ERS (1992–2000) and Envisat (2003–2010) (Figure 6). We would expect subsidence rates to increase as the net water loss in the system increased, allowing further compaction within the reservoir. However, we saw the opposite of what was expected; during the time of increased net loss, East Mesa had the lowest absolute value of subsidence rates and relative uplift began in the southern portion of the field (Figure 7 and Figure 8). We consider the fact that changes in production and injection among the numerous wells in the field may be responsible for the change in ground deformation patterns. Unfortunately, detailed production data is proprietary and so we are not able to resolve this question.

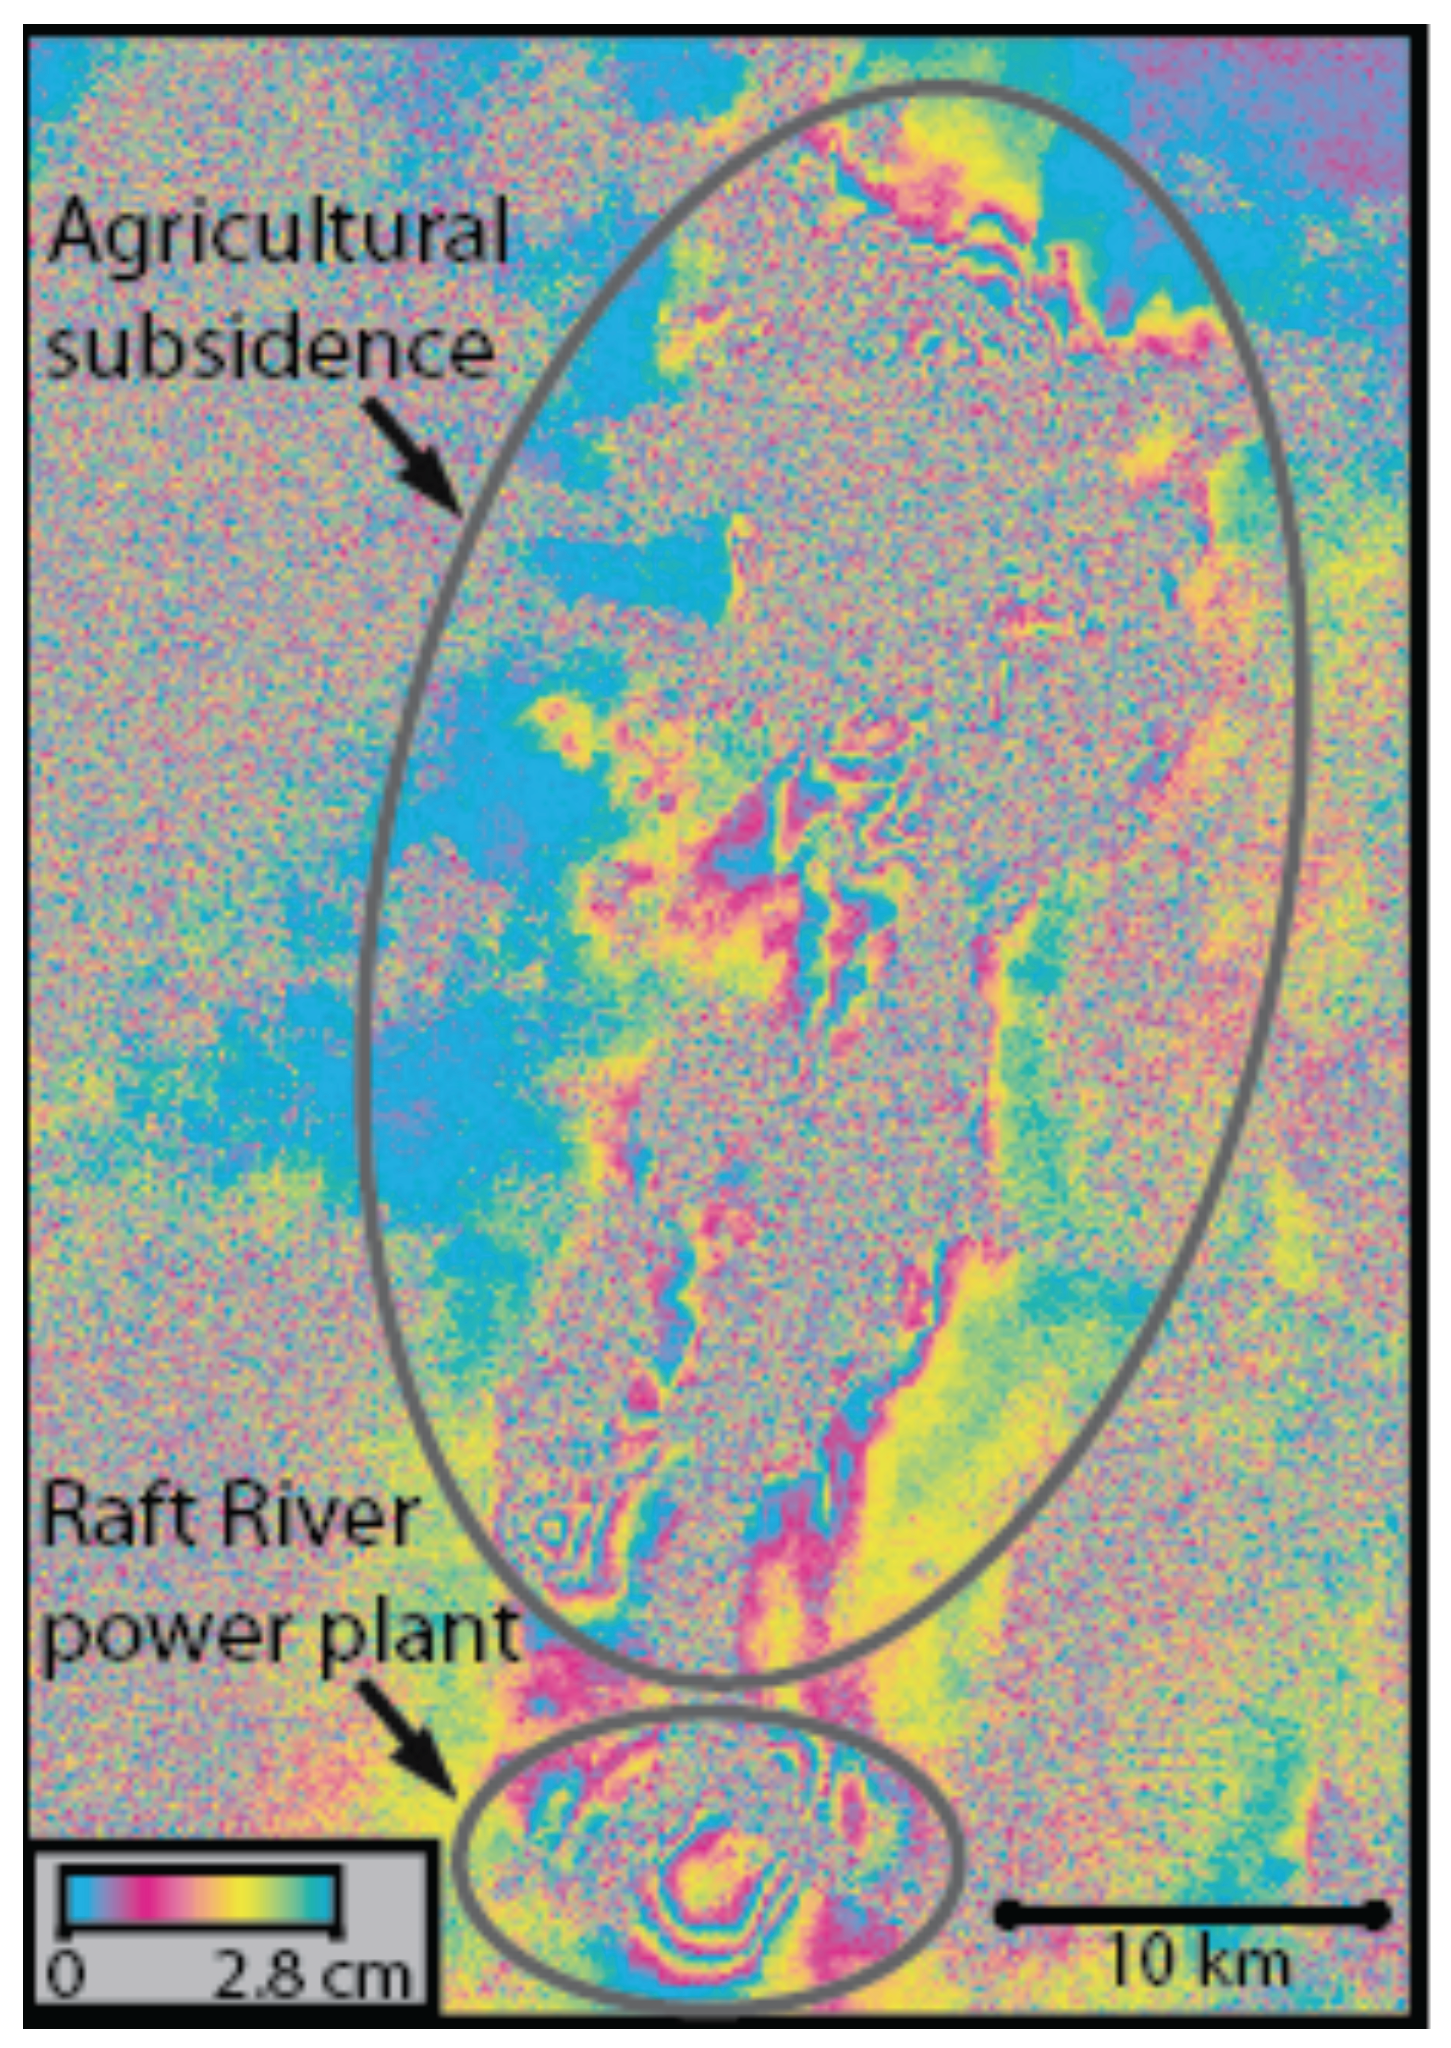
3.1.2. Raft River Valley, ID
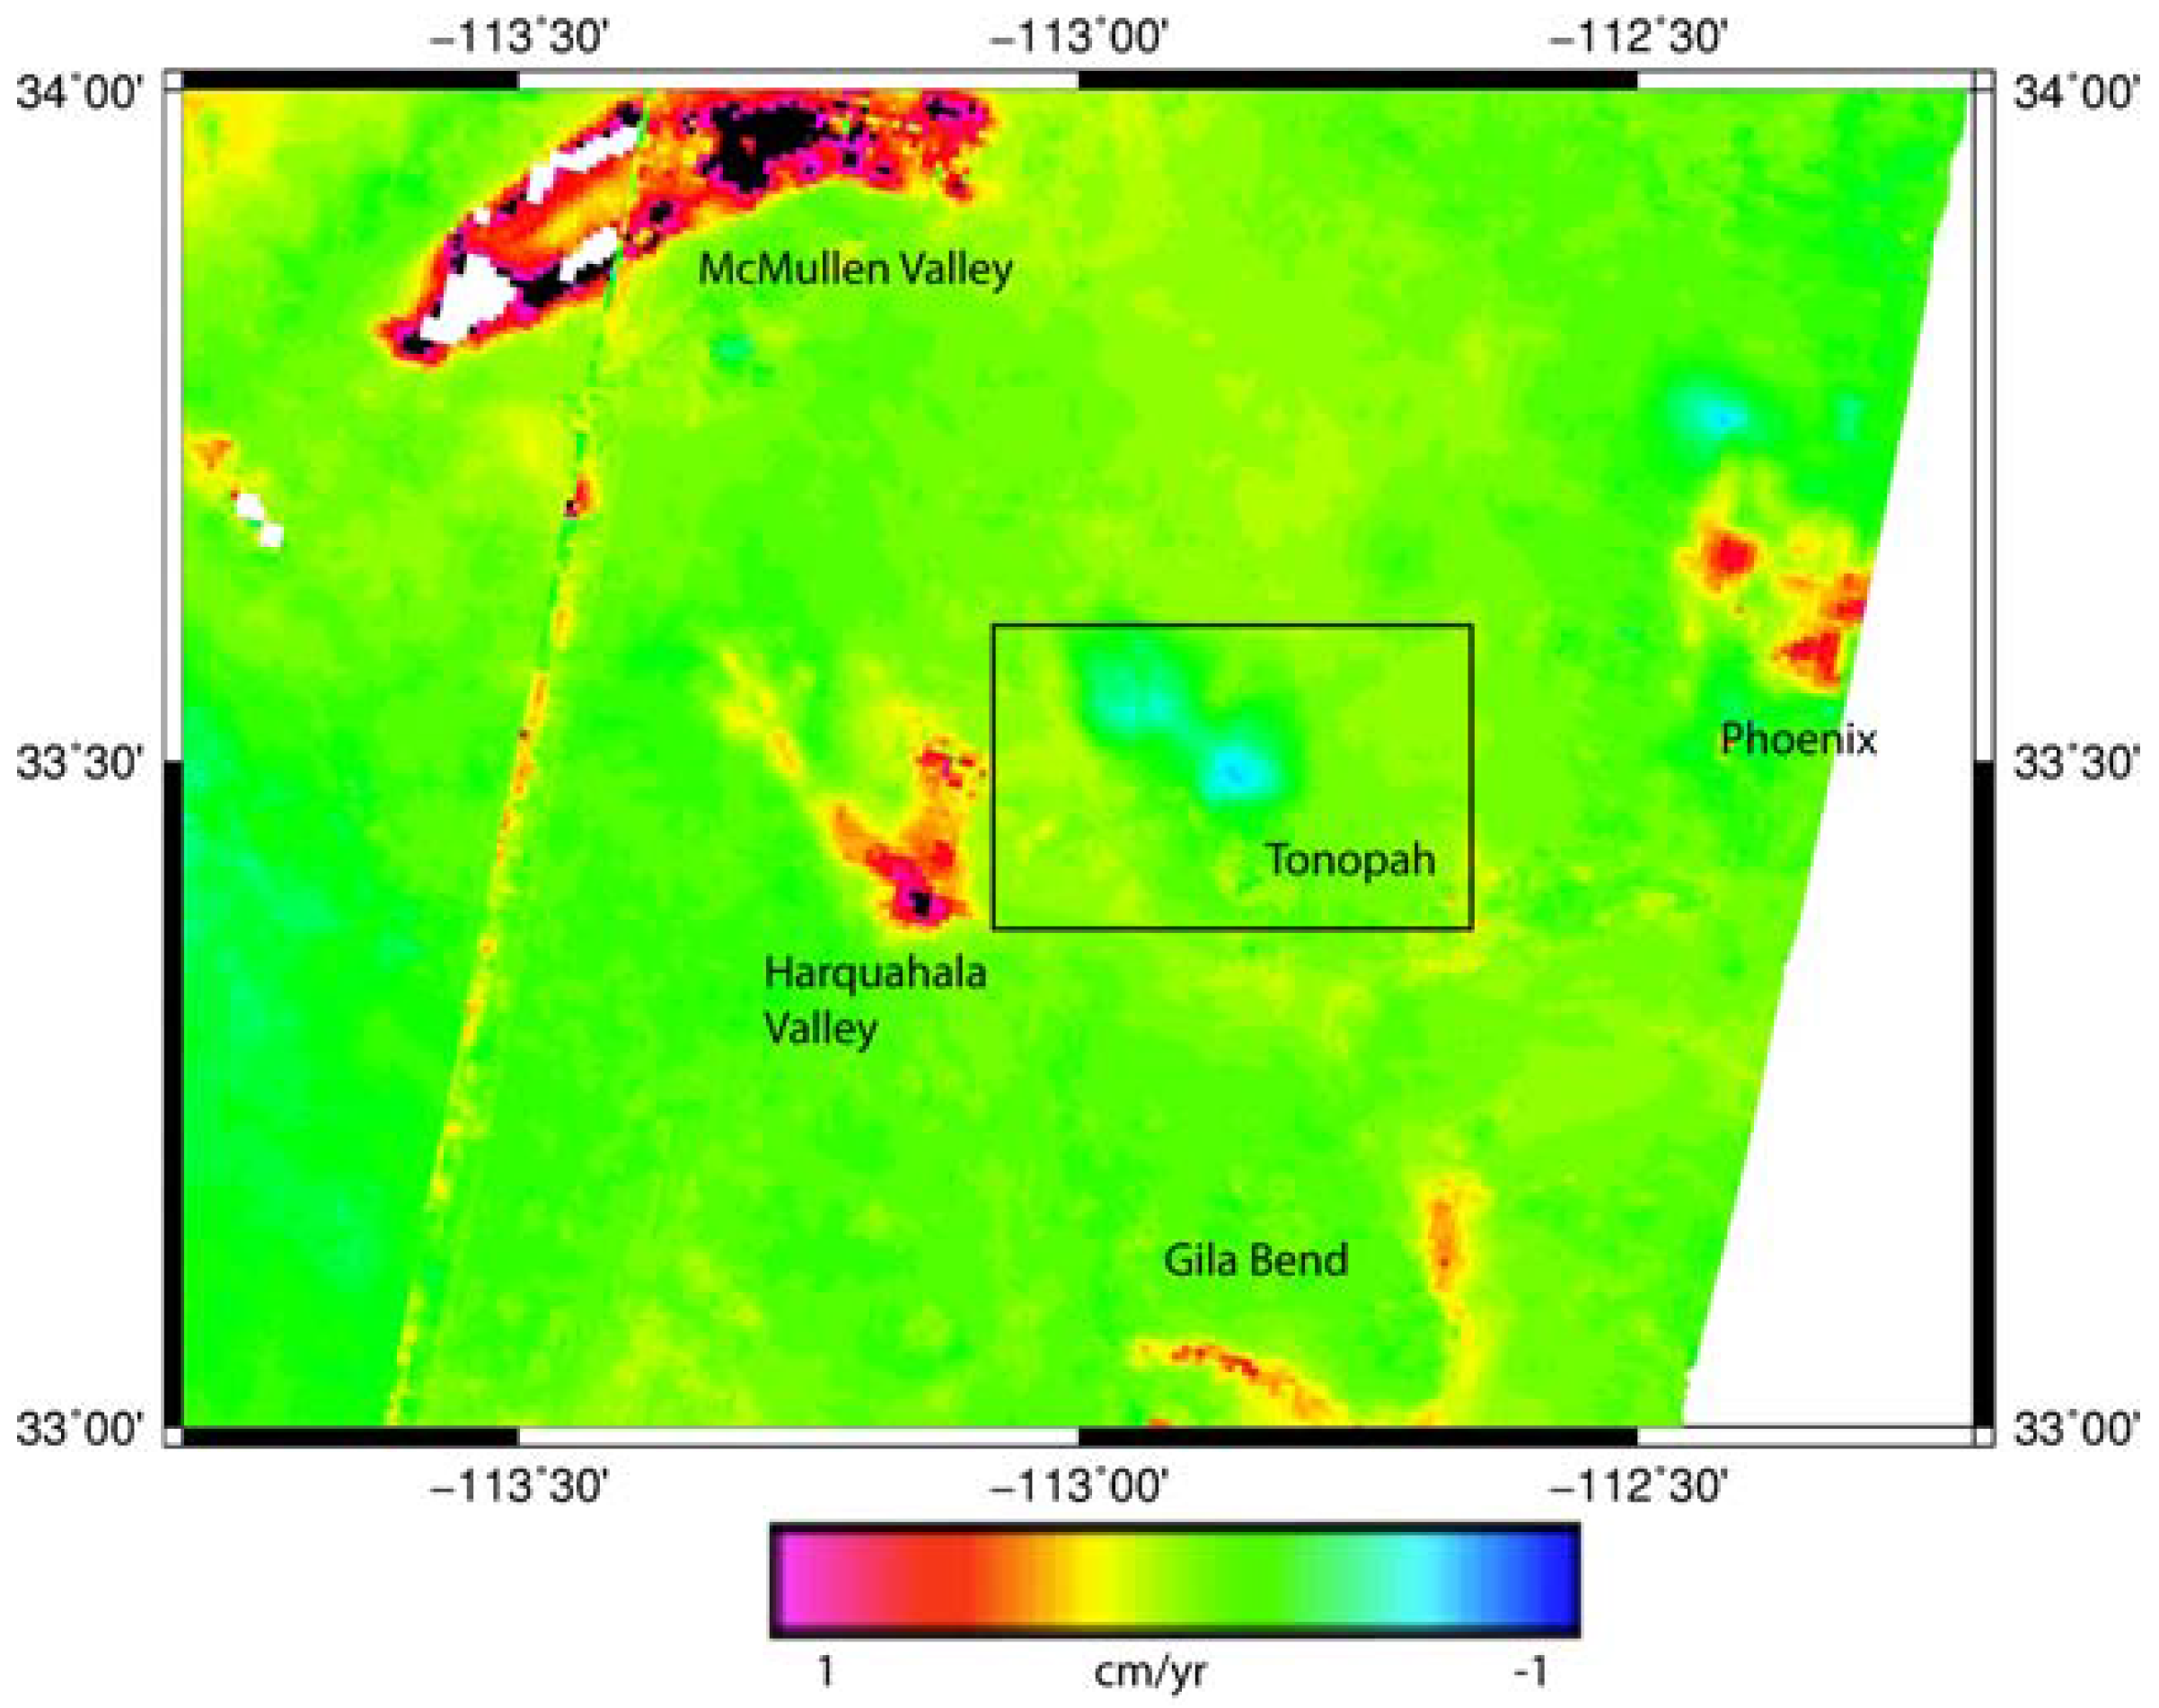
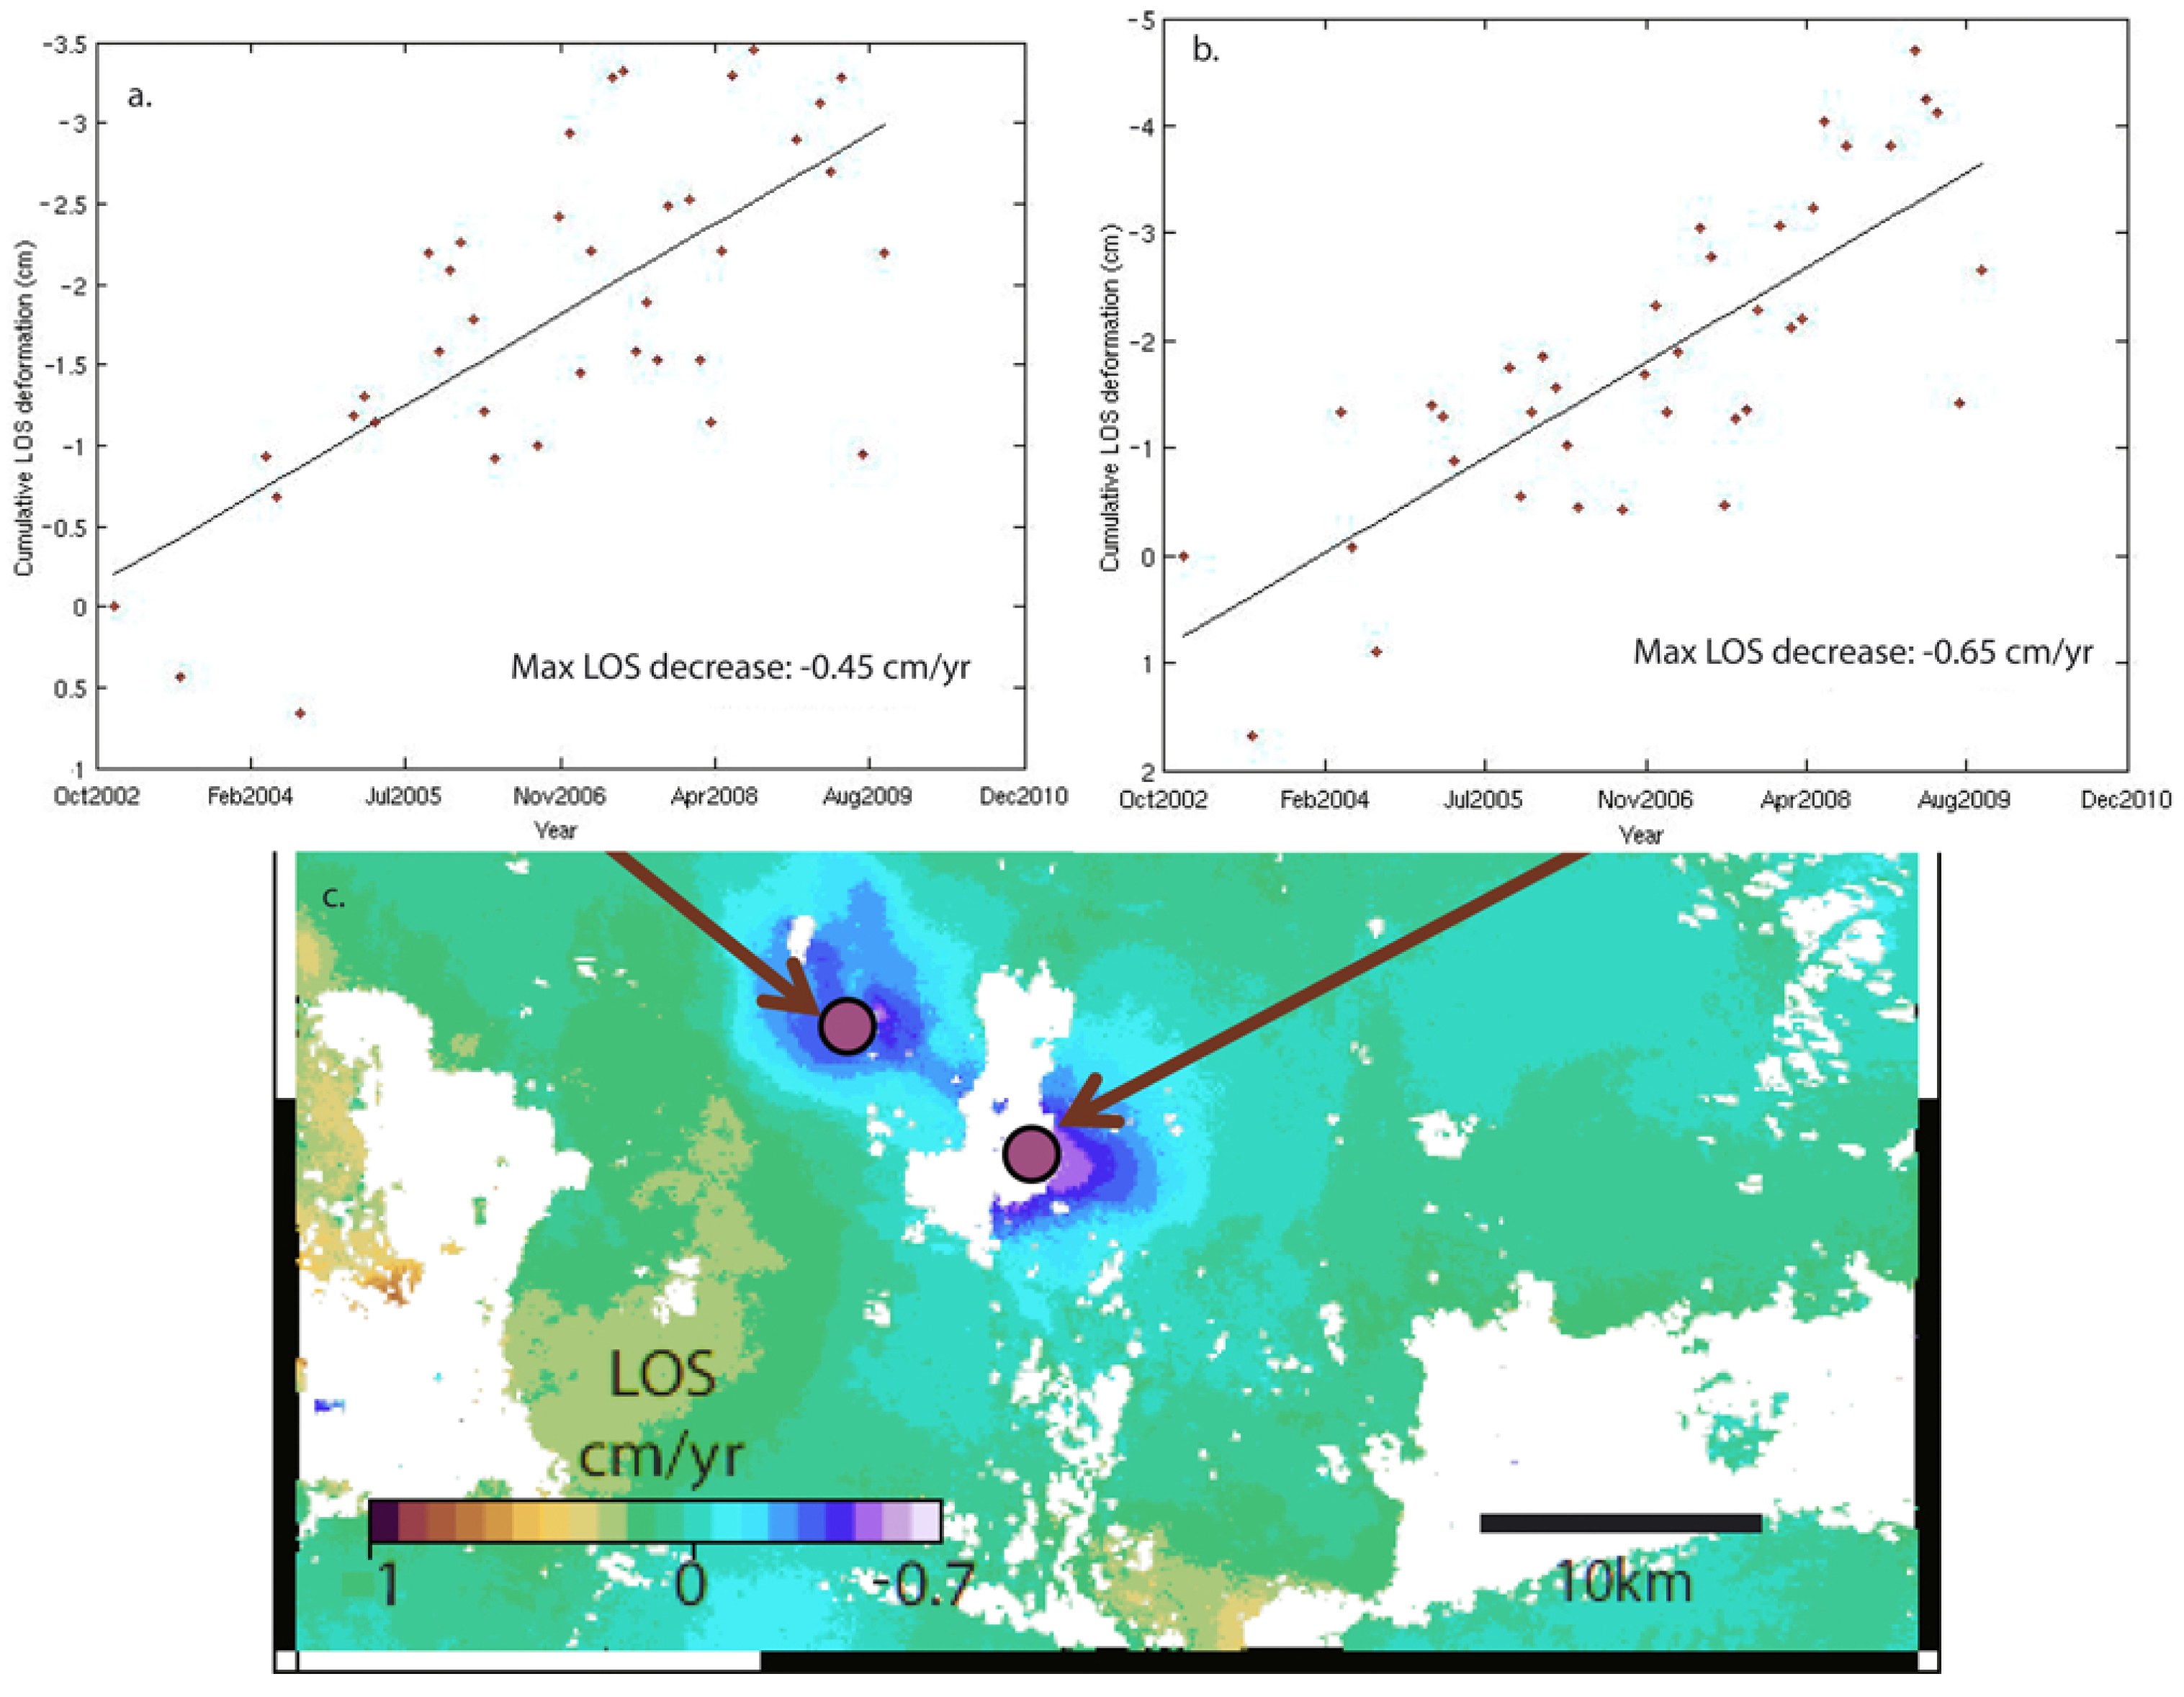
The Raft River Valley in Idaho is an area of agricultural development and the site of a recently renovated geothermal power plant near the southern end. Long-term subsidence in the valley due to ground water pumping was first reported in a study of releveling data by Lofgren [55] and deformation related to the geothermal power plant detected by InSAR is described by Ali et al. [18]. Interferograms from two overlapping tracks show the subsidence to be on the order of 2 cm/yr in the radar LOS during 2005–2010 (Figure 9). These tracks also show uplift and subsidence at the Raft River Valley geothermal power plant that began around the time the plant started commercial operation in 2008 [18]. The largest signal is a circular-shaped lobe of uplift which has a maximum rate of −2 cm/yr in the radar LOS. A smaller oblong-shaped subsidence lobe, sinking at a maximum rate of 1 cm/yr in the radar LOS, is adjacent to the uplift. Both the uplift and subsidence appear to decrease in rate over time.

3.1.3. Tonopah, AZ

While there are several areas of known subsidence in southern Arizona related to groundwater pumping (e.g., [17,56]), an area of uplift is also shown in Figure 10 and Figure 11, near a canal of the Central Arizona Project (CAP) close to Tonopah, AZ. In 2006, the Tonopah Desert Recharge Project completed construction and started full-scale operations to allow surface water to replenish the subsurface aquifers. The basin infiltration area is located adjacent to the CAP canal for easy water access and covers an area of 207 acres. Reported average infiltration rates are 4–5 feet per day [57]. The cause of uplift in Tonopah, AZ could be related to the CAP water recharge project, although the uplift seems to have begun before the start of the recharge. This uplift signal should be investigated further because the CAP canal runs through the footprint of deformation. The CAP canal brings water from Lake Havasu to locations in and near Phoenix [57].

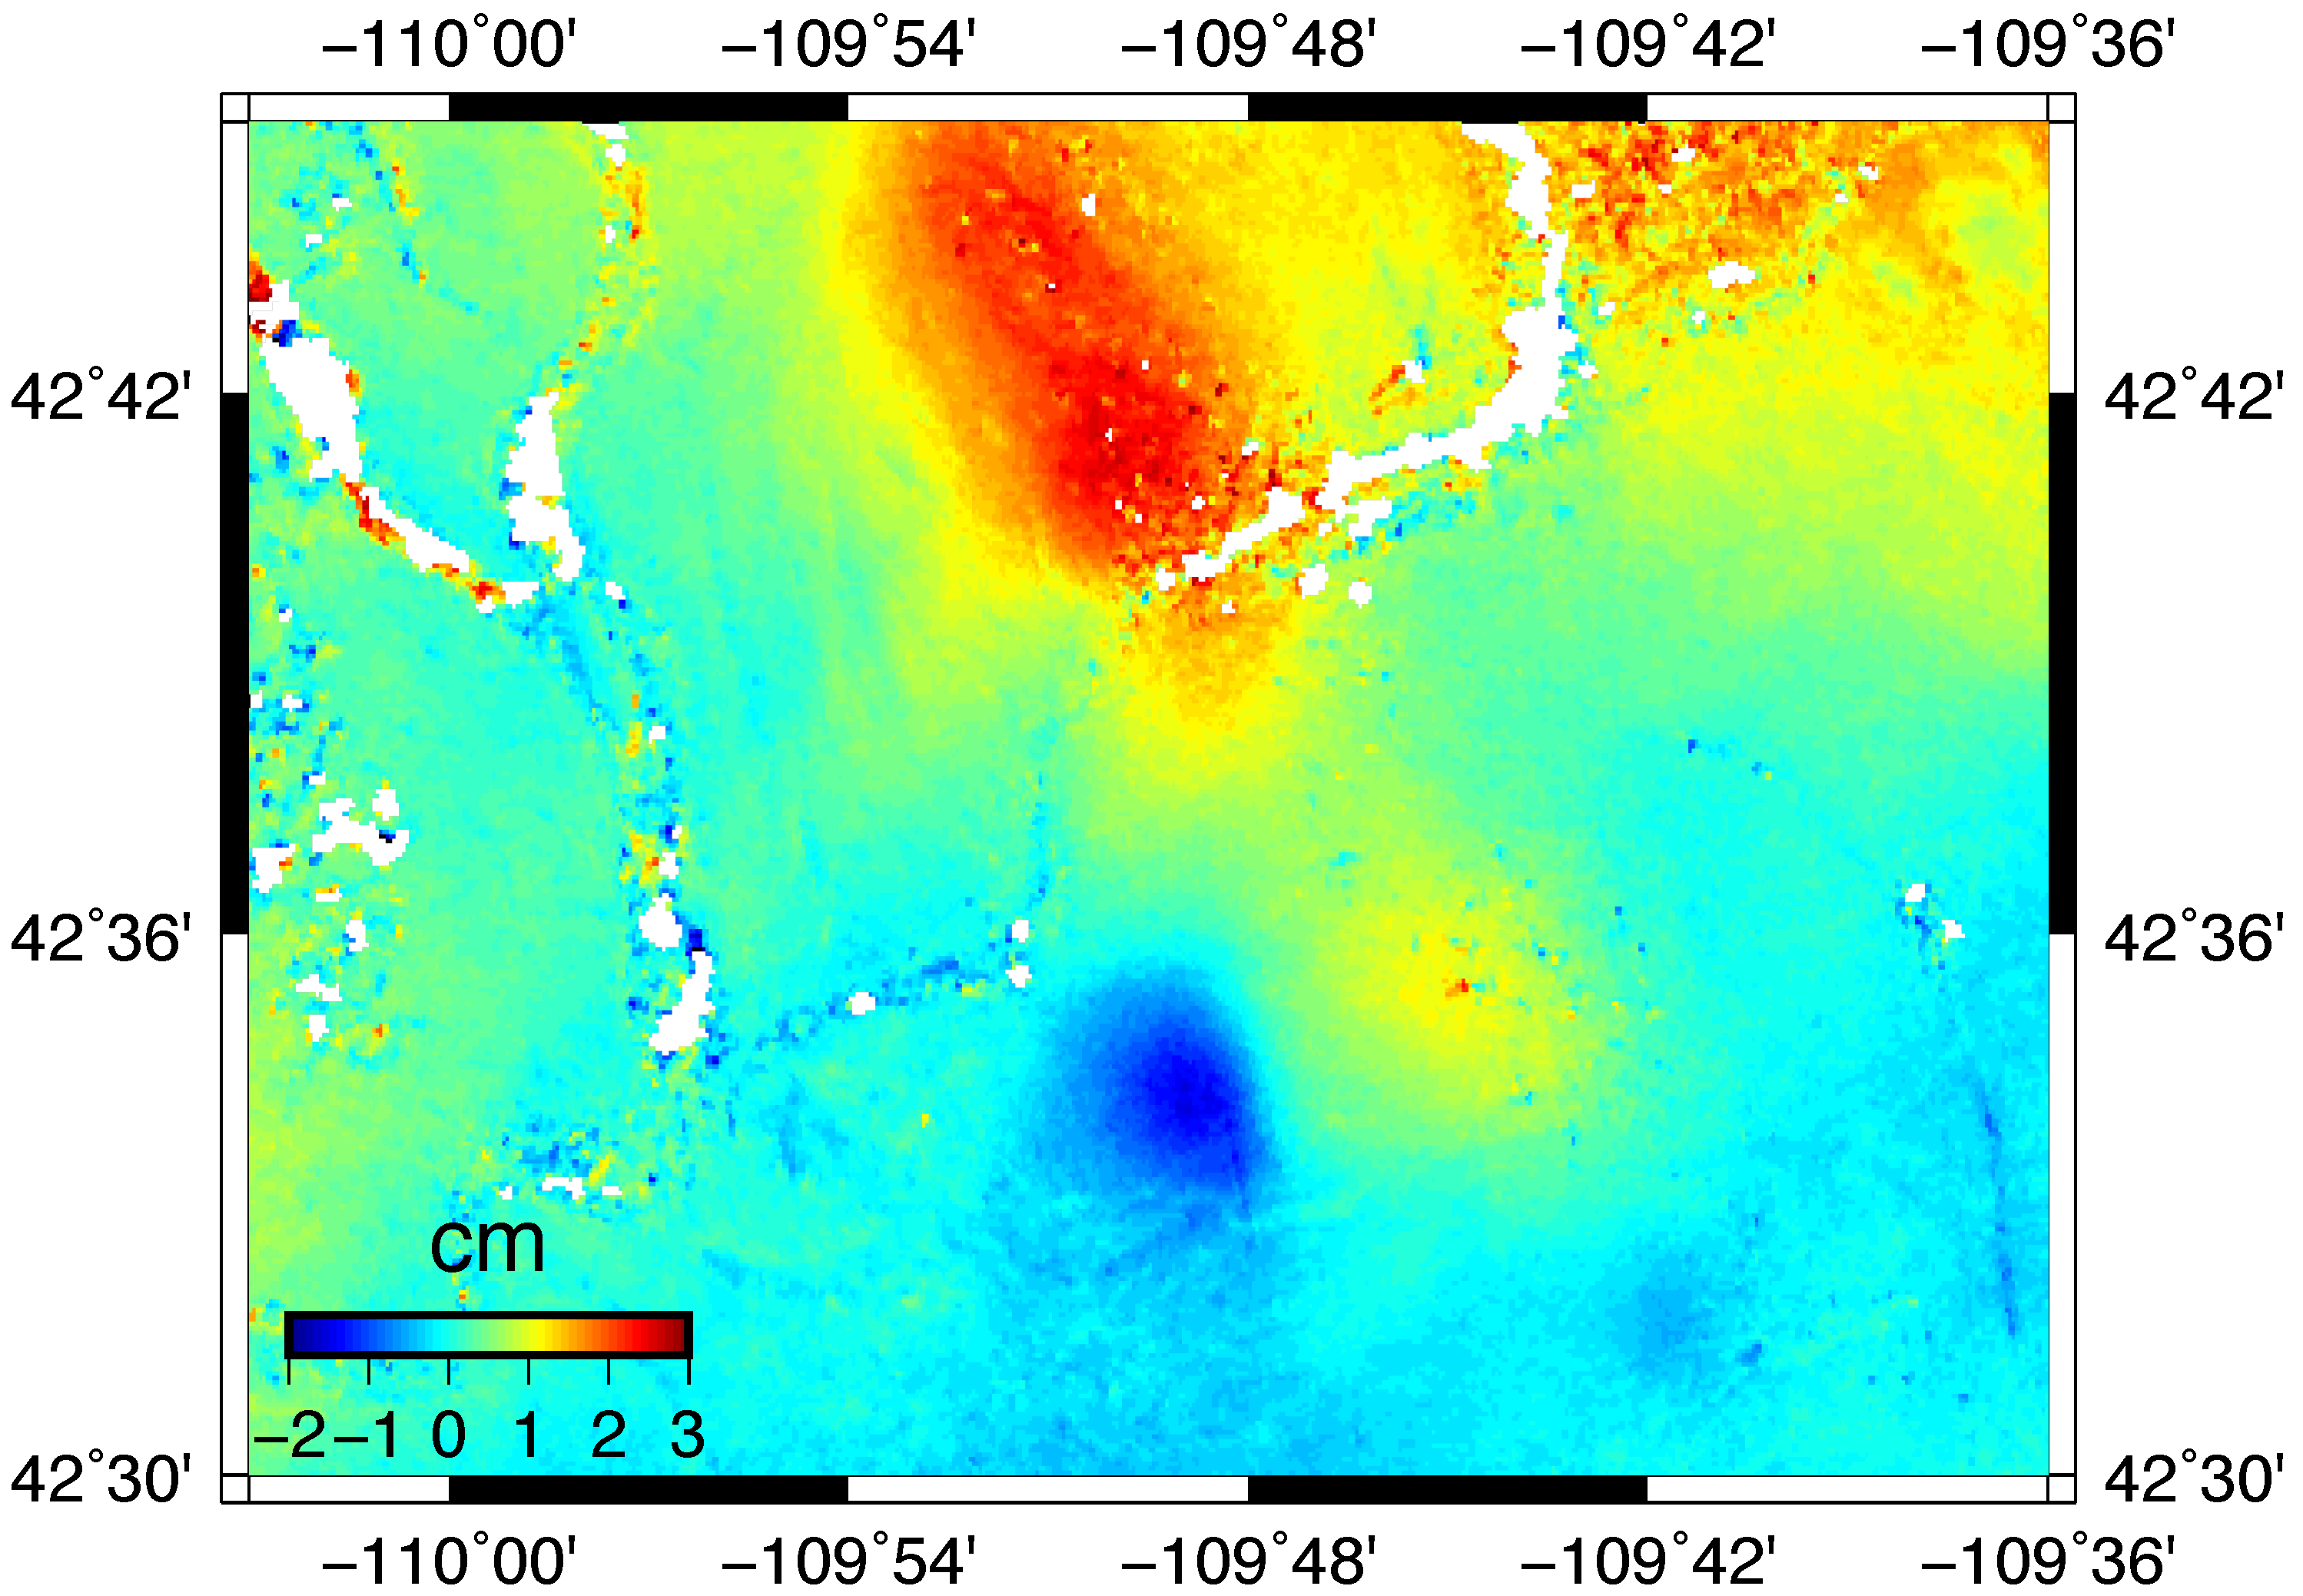
3.1.4. Jonah Field, WY

A large source of natural gas in the U.S., called Jonah Field, is located in the Green River Basin in Sublette County, Wyoming. The natural gas is located within the Pinedale Anticline, and is currently estimated to contain more than 25 trillion cubic feet of natural gas [58]. EnCana, the company that most recently owned the wells in Jonah Field, reported a daily average production rate of 603 million cubic feet per day in 2008, an increase from 557 million cubic feet per day reported in 2007 [59].
The deformation seen in Figure 12 involves both an increase and decrease in the InSAR LOS, likely related to both uplift and subsidence associated with extraction and stimulation of natural gas from Jonah Field. Extraction and stimulation of natural gas involves both pumping fluids into to the ground, and extracting fluids, such as natural gas, from the ground.

3.1.5. Washington, DC, and Alexandria, VA

A spatially and temporally complex deformation pattern was found in Washington, DC, and parts of Virginia and Maryland only through the use of high-resolution data from the CSK satellites. CSK time series data were processed by the company TRE Canada for a collaborative project with the University of Virginia and the Virginia Department of Transportation funded by the U.S. Department of Transportation [33,34] to monitor transportation infrastructure over Alexandria, VA including Washington, DC and portions of Maryland (Figure 13a,b). By combining ascending and descending tracks, they were able to separate horizontal and vertical deformation (Figure 13c,d) and identify several areas of ground subsidence in Washington, D.C. as well as an area of time-variable subsidence changing to an uplift and eastward motion centered on the Blue Plains Advanced Waste Water Treatment Plant (BPAWWTP) and extending into MD and Alexandria, VA. The cause of the deformation is not certain, but we note that the timing and location of the deformation could be related to the Blue Waters tunneling project to route the combined sewer overflows to the BPAWWTP for treatment before release into the surrounding rivers [60]. Specifically, the subsidence signal in the northeast part of Figure 13d is near the location of new tunnels (maximum LOS rate of the descending dataset is 3.37 ± 0.23 cm/yr). Further, the region of uplift/eastward motion (maximum LOS rate of the descending dataset is −2.3 ± 0.23 cm/yr) close to the bottom of Figure 13d is near a vertical shaft where dewatering occurred during construction [60]. A GPS station next to BPAWWTP records the vertical and horizontal motion seen in the InSAR data (Figure 13e,f) potentially also consistent with the period of dewatering and rewatering during the tunneling project, but further work is needed to test this hypothesis.

3.2. Selected Non-Detections

3.2.1. Diablo Plateau, Texas

Leveling data between 1934 and 1977 showed uplift of up to 19 ± 3 cm over an area spanning 120 km in the EW direction in the Diablo Plateau-Salt Basin region of west Texas as well as a ∼20-km wide subsidence signal of −4.3 ± 0.3 cm between 1958 and 1977 [63]. The cause of the deformation was not known, but Reilinger et al. [63] suggested that the uplift signal could be from tectonic or magmatic effects, while the subsidence might be from groundwater pumping. No ground deformation was detectable by InSAR in the area between 1992 and 2001 (Figure 14), but we can make no statement on the deformation during the earlier time period. Further, if uplift is still occurring at the rate detected by the leveling data decades ago (i.e., ∼0.04 cm/yr), the signal would be hard to detect with available InSAR.

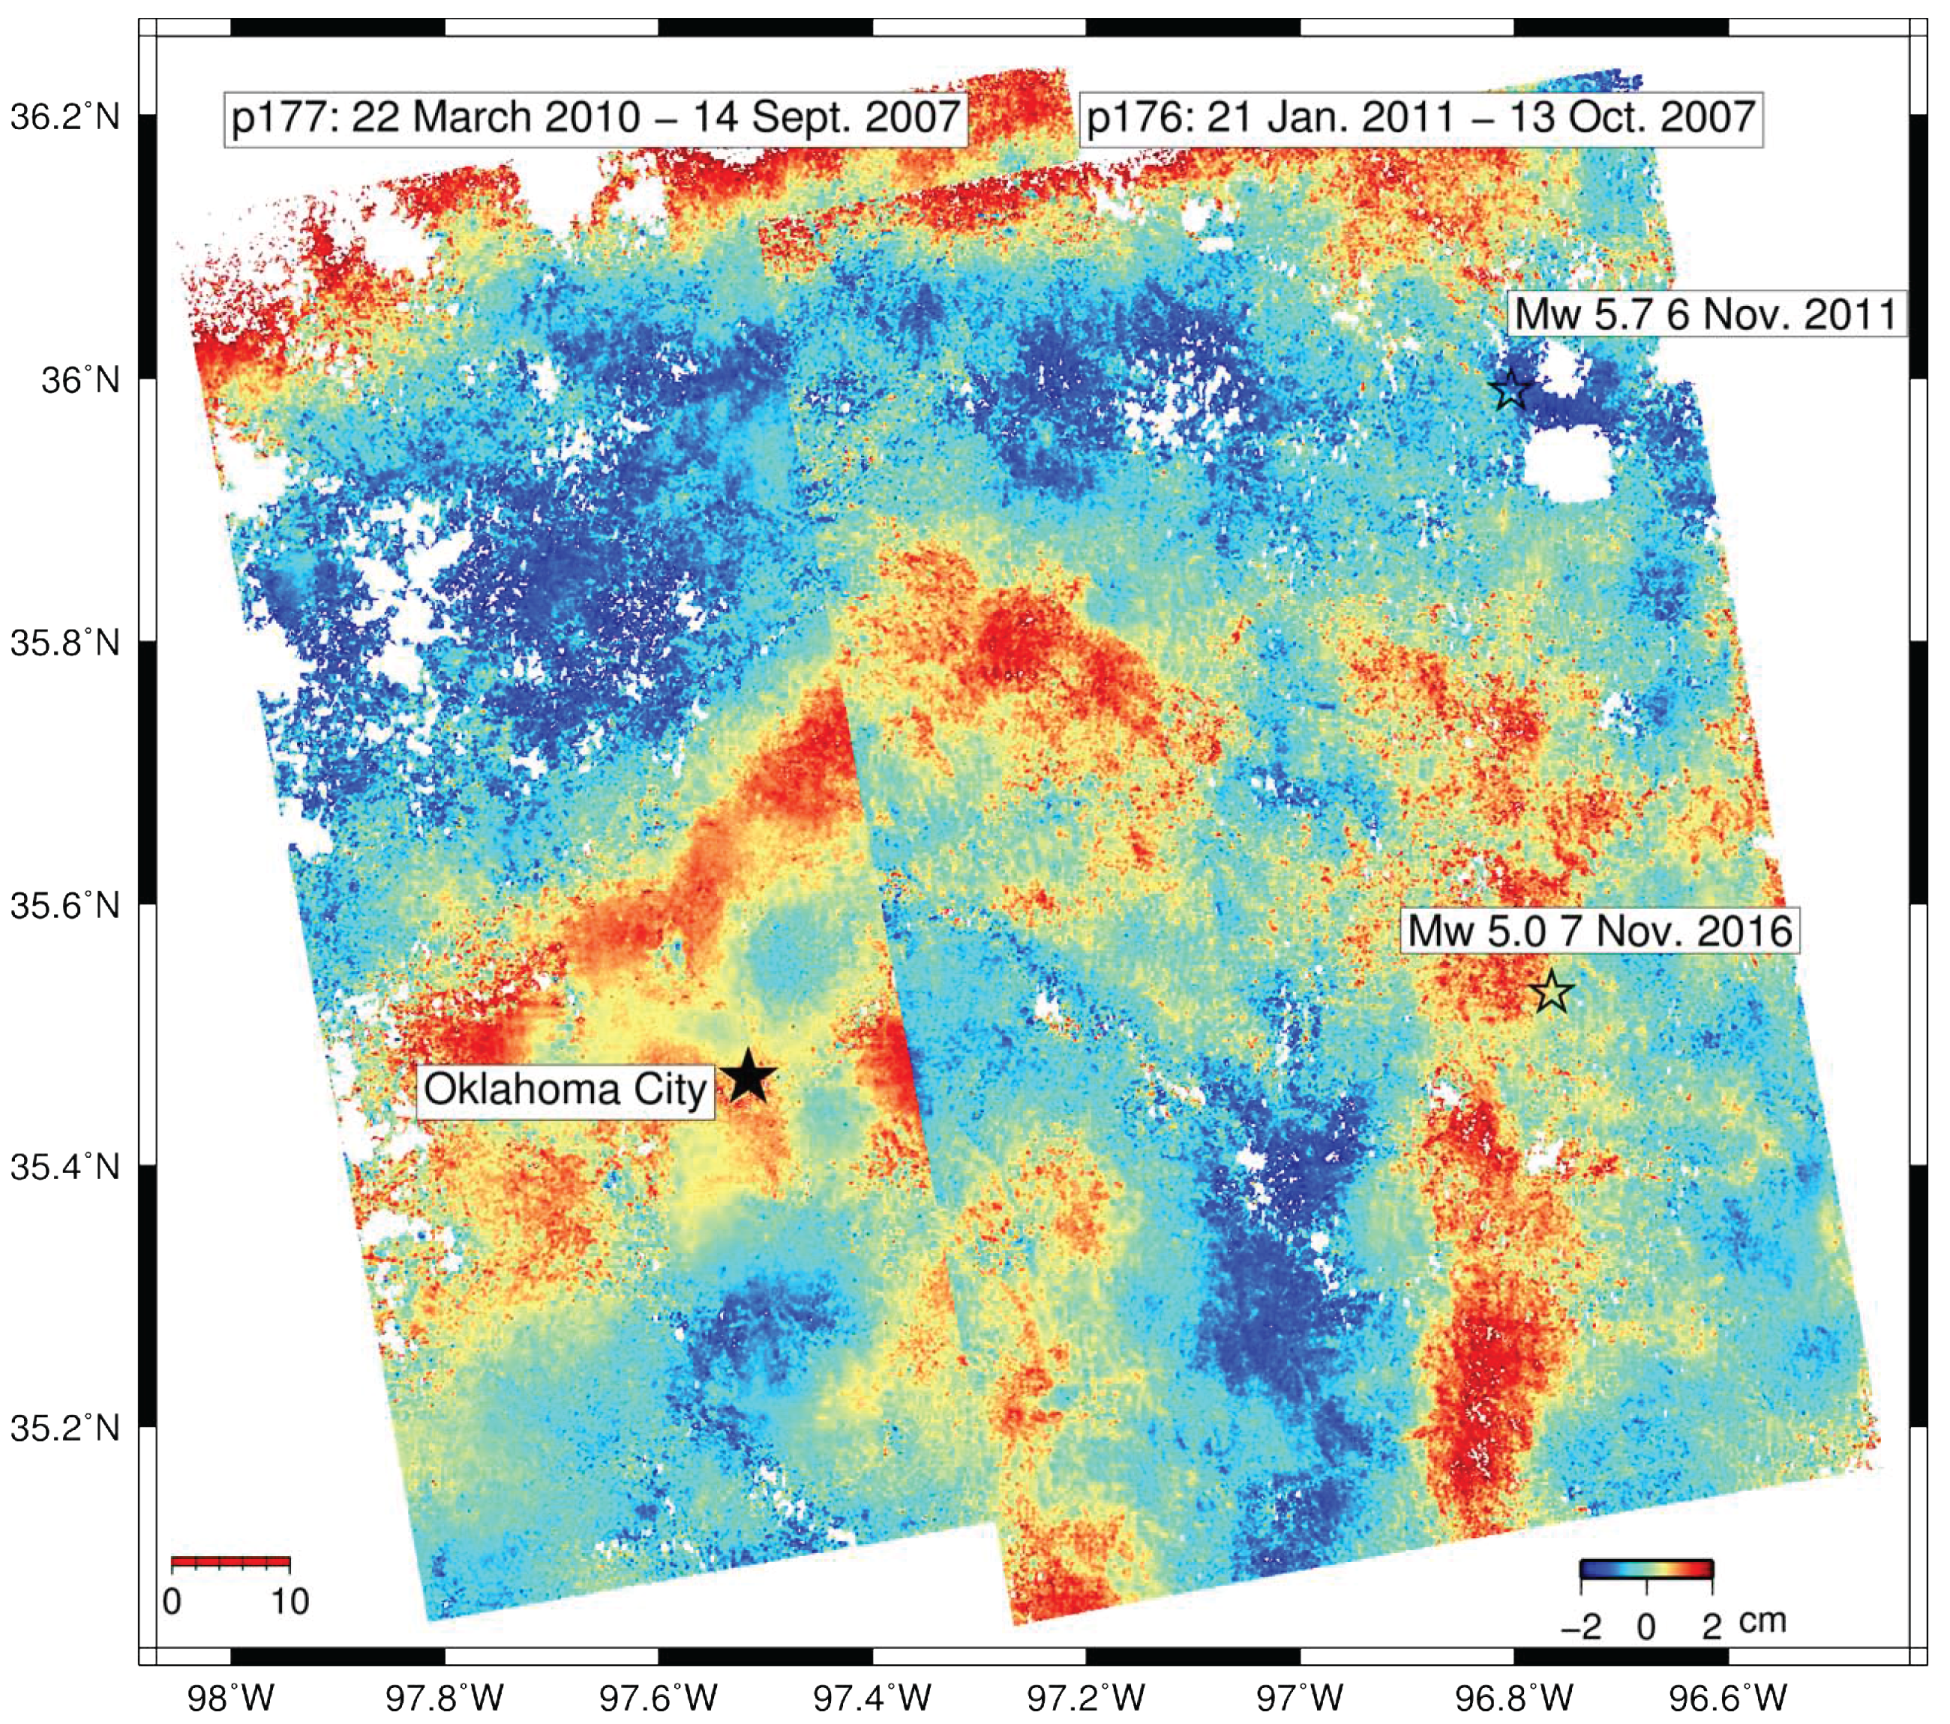
3.2.2. Oklahoma Injection

Several studies have shown that a recent increase in wastewater re-injection in Oklahoma and other places has likely induced earthquakes in several parts of the state (e.g., [64]), but our ALOS-1 observations between 2006 and 2011 do not show any clear ground deformation from the injection (Figure 15). Further research is needed to determine the reason for the lack of detection. The relatively short ALOS-1 data archive may simply be not sensitive enough to detect the ground deformation—we estimate the precision of our measurements in this active agricultural area to be 3–4 cm/yr, which is in line with estimates of ALOS-1 time series precision in other areas (0.5–0.8 cm/yr in New Zealand [65], 0.5 cm/yr in Colorado [66], 2.4 cm/yr in Central America [47], 2 cm/yr in Mexico and Indonesia [67] and ∼2.5 cm/yr in Java [46]. The low level of ground deformation could be due to characteristics of the groundwater pumping or subsurface geology in Oklahoma (e.g., deep injection in very porous rock overlain by very rigid layers). For example, InSAR time series analysis of ALOS-1 observations in the Raton Basin in Colorado and New Mexico did not detect any uplift from wastewater re-injection above the detection threshold of 0.5 cm/yr, possibly because of the depth of injection (1.12–2.2 km), but did allow detection of ground subsidence (Table S1 [66]). Alternatively, the time period of ALOS-1 observations (fromlate 2006 to early 2011) also may not have overlapped with the period of highest activity and associated ground deformation—the number of earthquakes in Oklahoma increased from 41 in 2010 (when our observations end) to 903 in 2015 according to the Oklahoma Geological Survey.

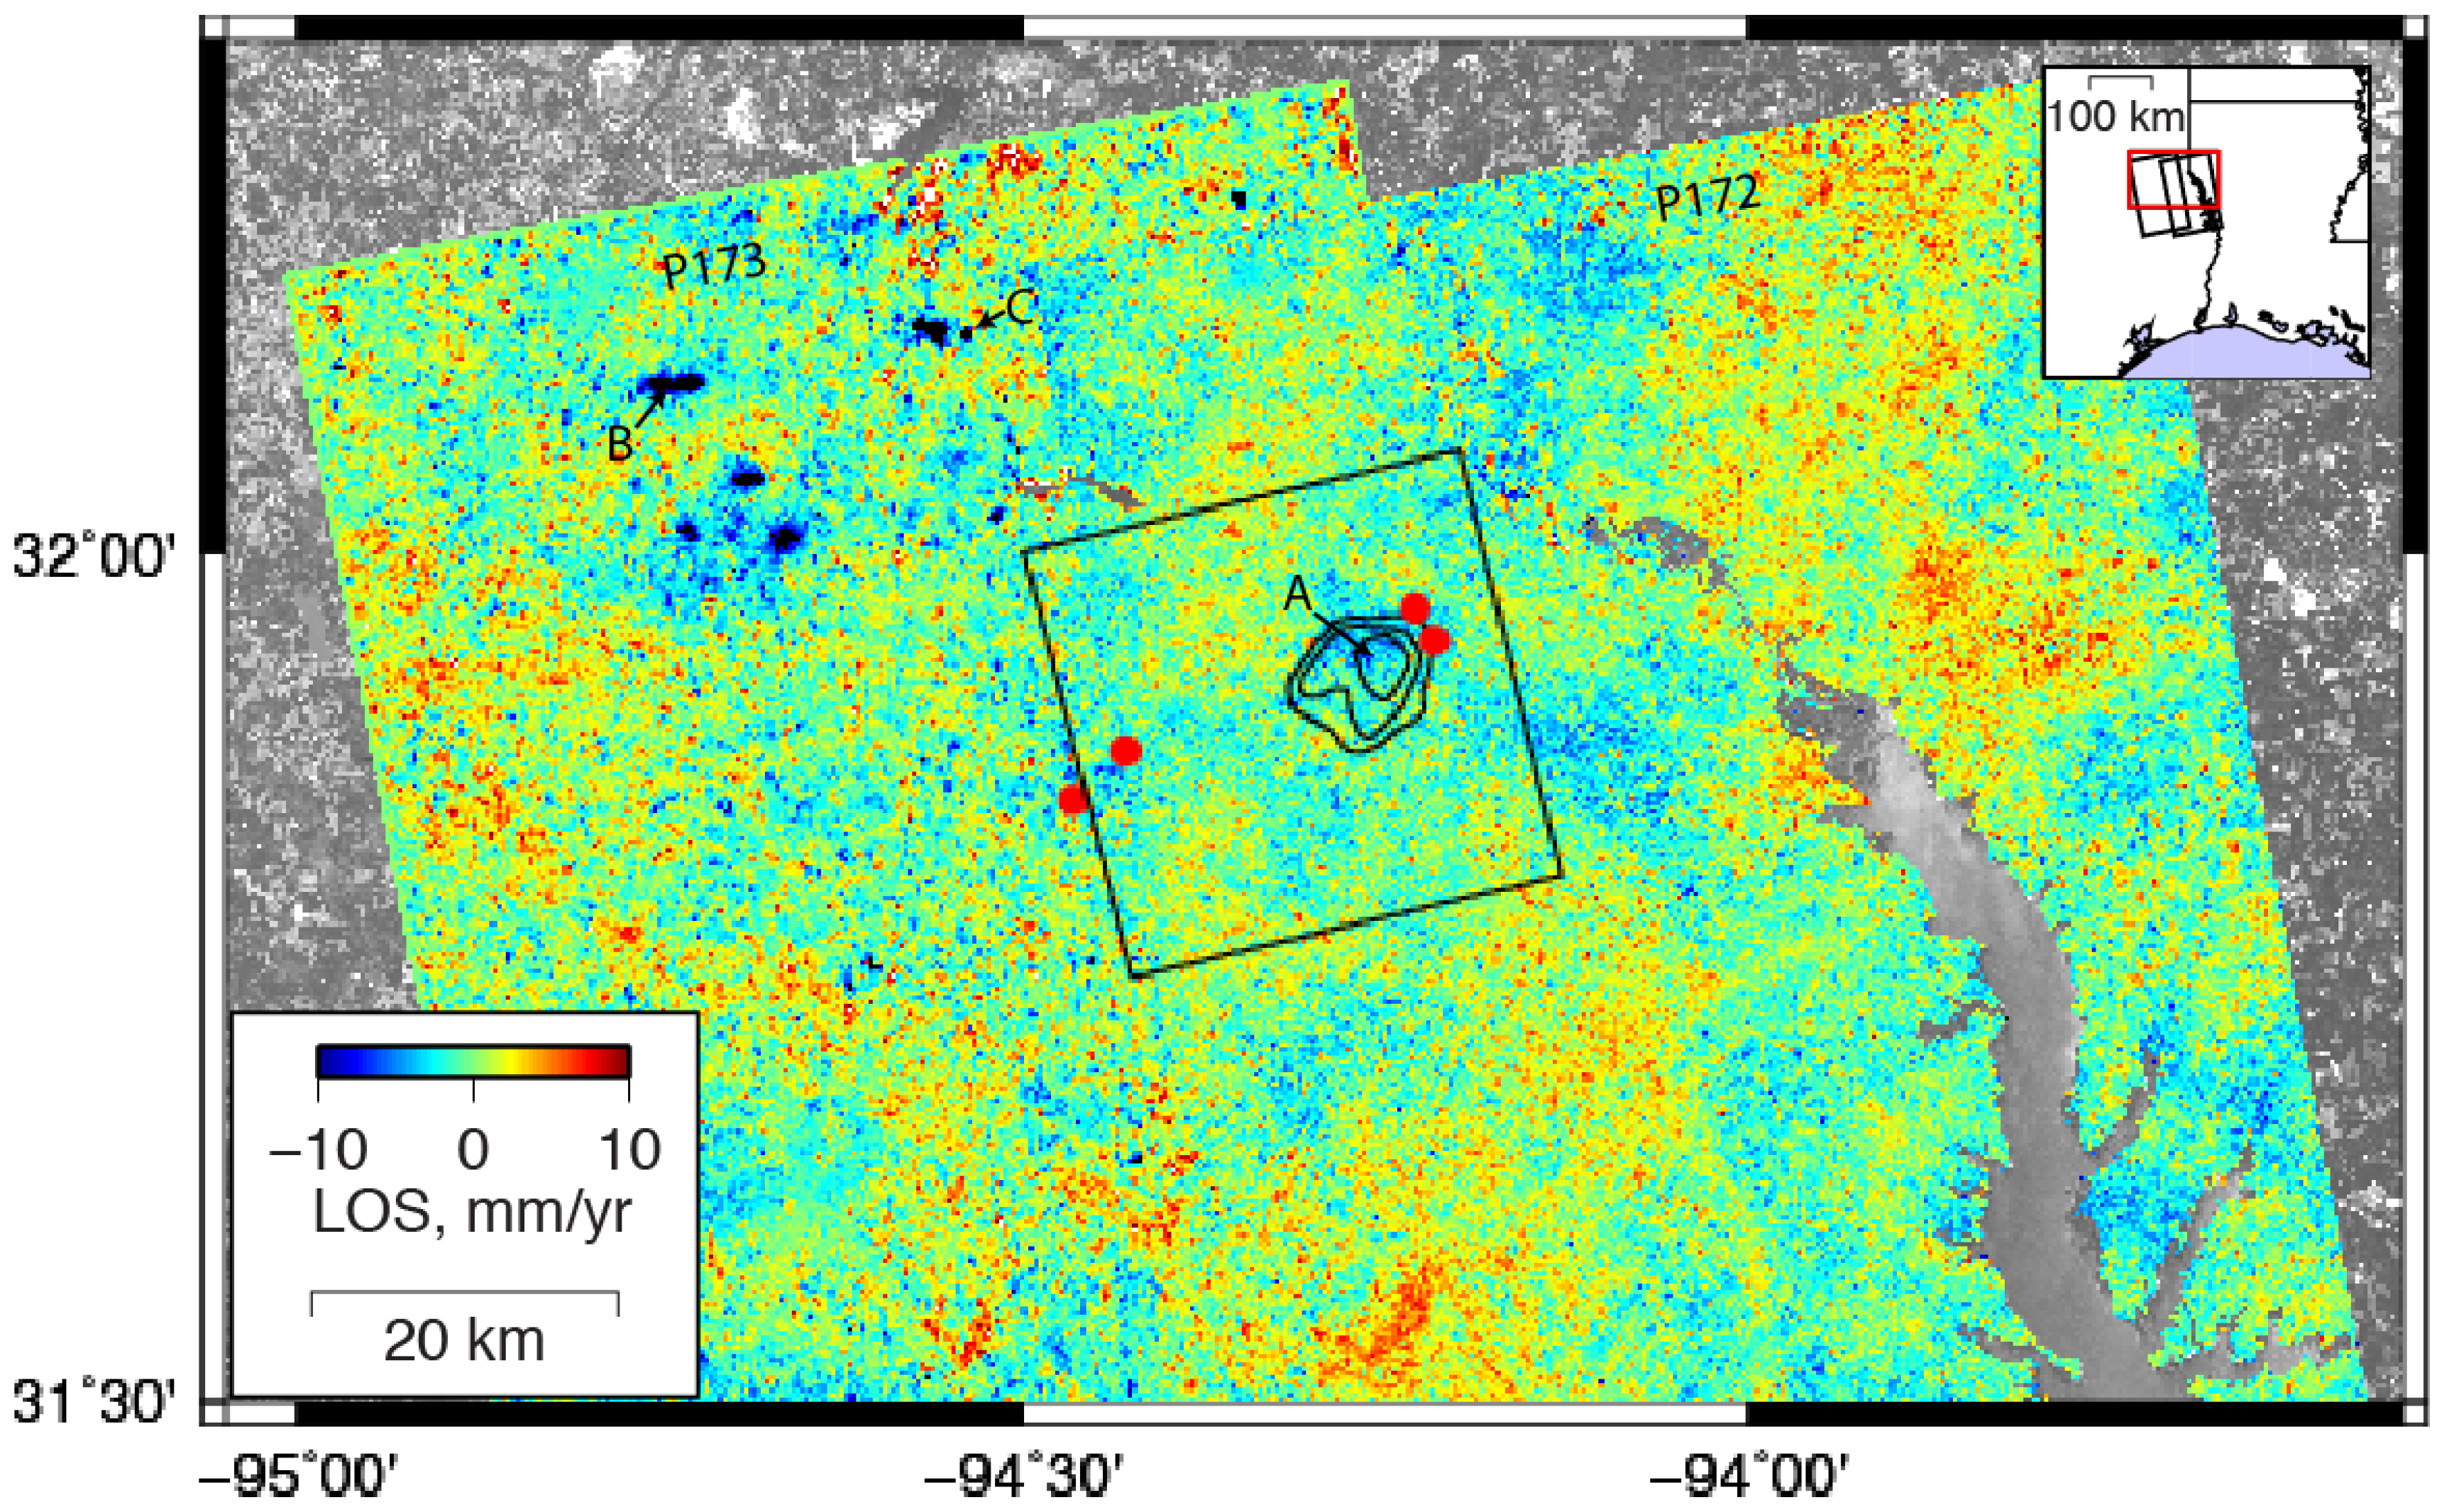
3.2.3. East Texas: New Detection and Non-Detection

Ground uplift with a maximum of about −0.3 cm/yr in the radar LOS over an area about 10 km across using ALOS-1 time series was reported between 2007 and 2010 associated with wastewater injection near the cities of Tenaha and Timpson, TX, by Shirzaei et al. [68]. Our own analysis of the same data leads us to conclude that deformation at these rates can not be constrained with the available ALOS-1 observations. First, as we noted in the last section, previous work has shown that the small number of SAR observations available from ALOS-1 (10–12 dates per frame in the data examined here) only allows rates in the 0.5–2.5 cm/yr range to be detected. Second, our own time series analysis of the same data used in Shirzaei et al. [68] reveals that while the best-fit linear rate to the available data does result in a small signal (a few mm/yr) near the injection wells (Figure 16) there are signals with similar magnitude and spatial scale all over the study area, indicating that the level of atmospheric noise in this region is also >0.5 cm/yr (Figure 17). This is not surprising, as interferograms that span particular noisy dates within this limited data set have contributions from the atmosphere with magnitudes >10 cm (not shown), with spatial scales very similar to the postulated deformation signal. Shirzaei et al. [68] note that their method has been validated to measure deformation rates of mm/yr or less, but that precision was obtained using different satellites with >40 SAR dates in areas with high coherence (urban areas and unvegetated lava flows) and thus is not directly applicable to this ALOS-1 dataset. The paper notes that the signal is observed in three overlapping ALOS-1 orbit tracks, but in fact, only two of these are independent (i.e., Figure S1d and S1e of Shirzaei et al. [68] use identical data from overlapping frames 620 and 630 of path 172 and should, therefore, agree, although a different number of dates was used in frame 630). Thus, while there may be uplift associated with the wastewater injection, we do not think that available ALOS-1 archive can robustly image it.
Our results involved processing the data over a larger spatial area and similar time interval (January 2007 to January 2011) but we explore using both the full dataset and the subset of dates used in Shirzaei et al. [68]—they used only 10 of the 20 dates for path 172 and 8 out of 15 dates for path 173. We find that processing the InSAR time series in the areas immediately surrounding the study area of Shirzaei et al. [68] (extent shown in Figure 16) is key for evaluation of the robustness of the signal. Regions with apparent deformation signals similar to those inferred for the area of the study in Shirzaei et al. [68] are present throughout the entire region, supporting the idea that signals of this size are related to atmospheric noise. Interestingly, to the immediate northwest of the area examined in Shirzaei et al. [68], several very clear uplift signals are present with magnitudes of >10 cm/yr and spatial scales of 5–10 km. These signals can be clearly seen in maps of the average secular rate (Figure 16) as well as in the relationship between displacement and time that we infer at individual points from the suite of interferograms (Figure 17)—they are also apparent in independent interferograms (not shown here). Shirzaei et al. [68] also show interferograms from the Radarsat-2 satellite covering a different time period (March to August 2014) with uplift rates of up to −0.9 cm/yr and a different spatial pattern. Since we do not have access to this data, and no estimate of detection threshold is provided, we cannot assess the robustness of the Radarsat-2 signal.

3.3. GPS Contamination

We have compiled a list of 82 GPS stations located within 20 km of a deformation signal. So far we have evaluated 67 of these stations, and have found that at least 17 (Table 3) of the stations have likely been contaminated by anthropogenic deformation. Contamination in 52 stations is unresolvable with the available data because the stations are either located in an area of persistent decorrelation, an area that was not unwrapped, or they are located outside the area covered by our current InSAR data products. As shown in Figure 13, station NRL1 is affected by the suspected anthropogenic deformation and several other examples are shown in the supplemental figures. Our list of GPS-contaminated sites is not complete—for example Karegar et al. [13] report other GPS along the coast between southern Virginia and South Carolina to be affected by anthropogenic activities where anthropogenic signals were not detected in our survey.

4. Discussion

Although our catalog of deformation is extensive, it is not complete. In particular, we note the following limitations to our work:
  • To maximize areal coverage subject to fixed computational resources, we do not routinely process ascending and descending data over the same locations, which limits the ability to separate horizontal and vertical ground deformation.
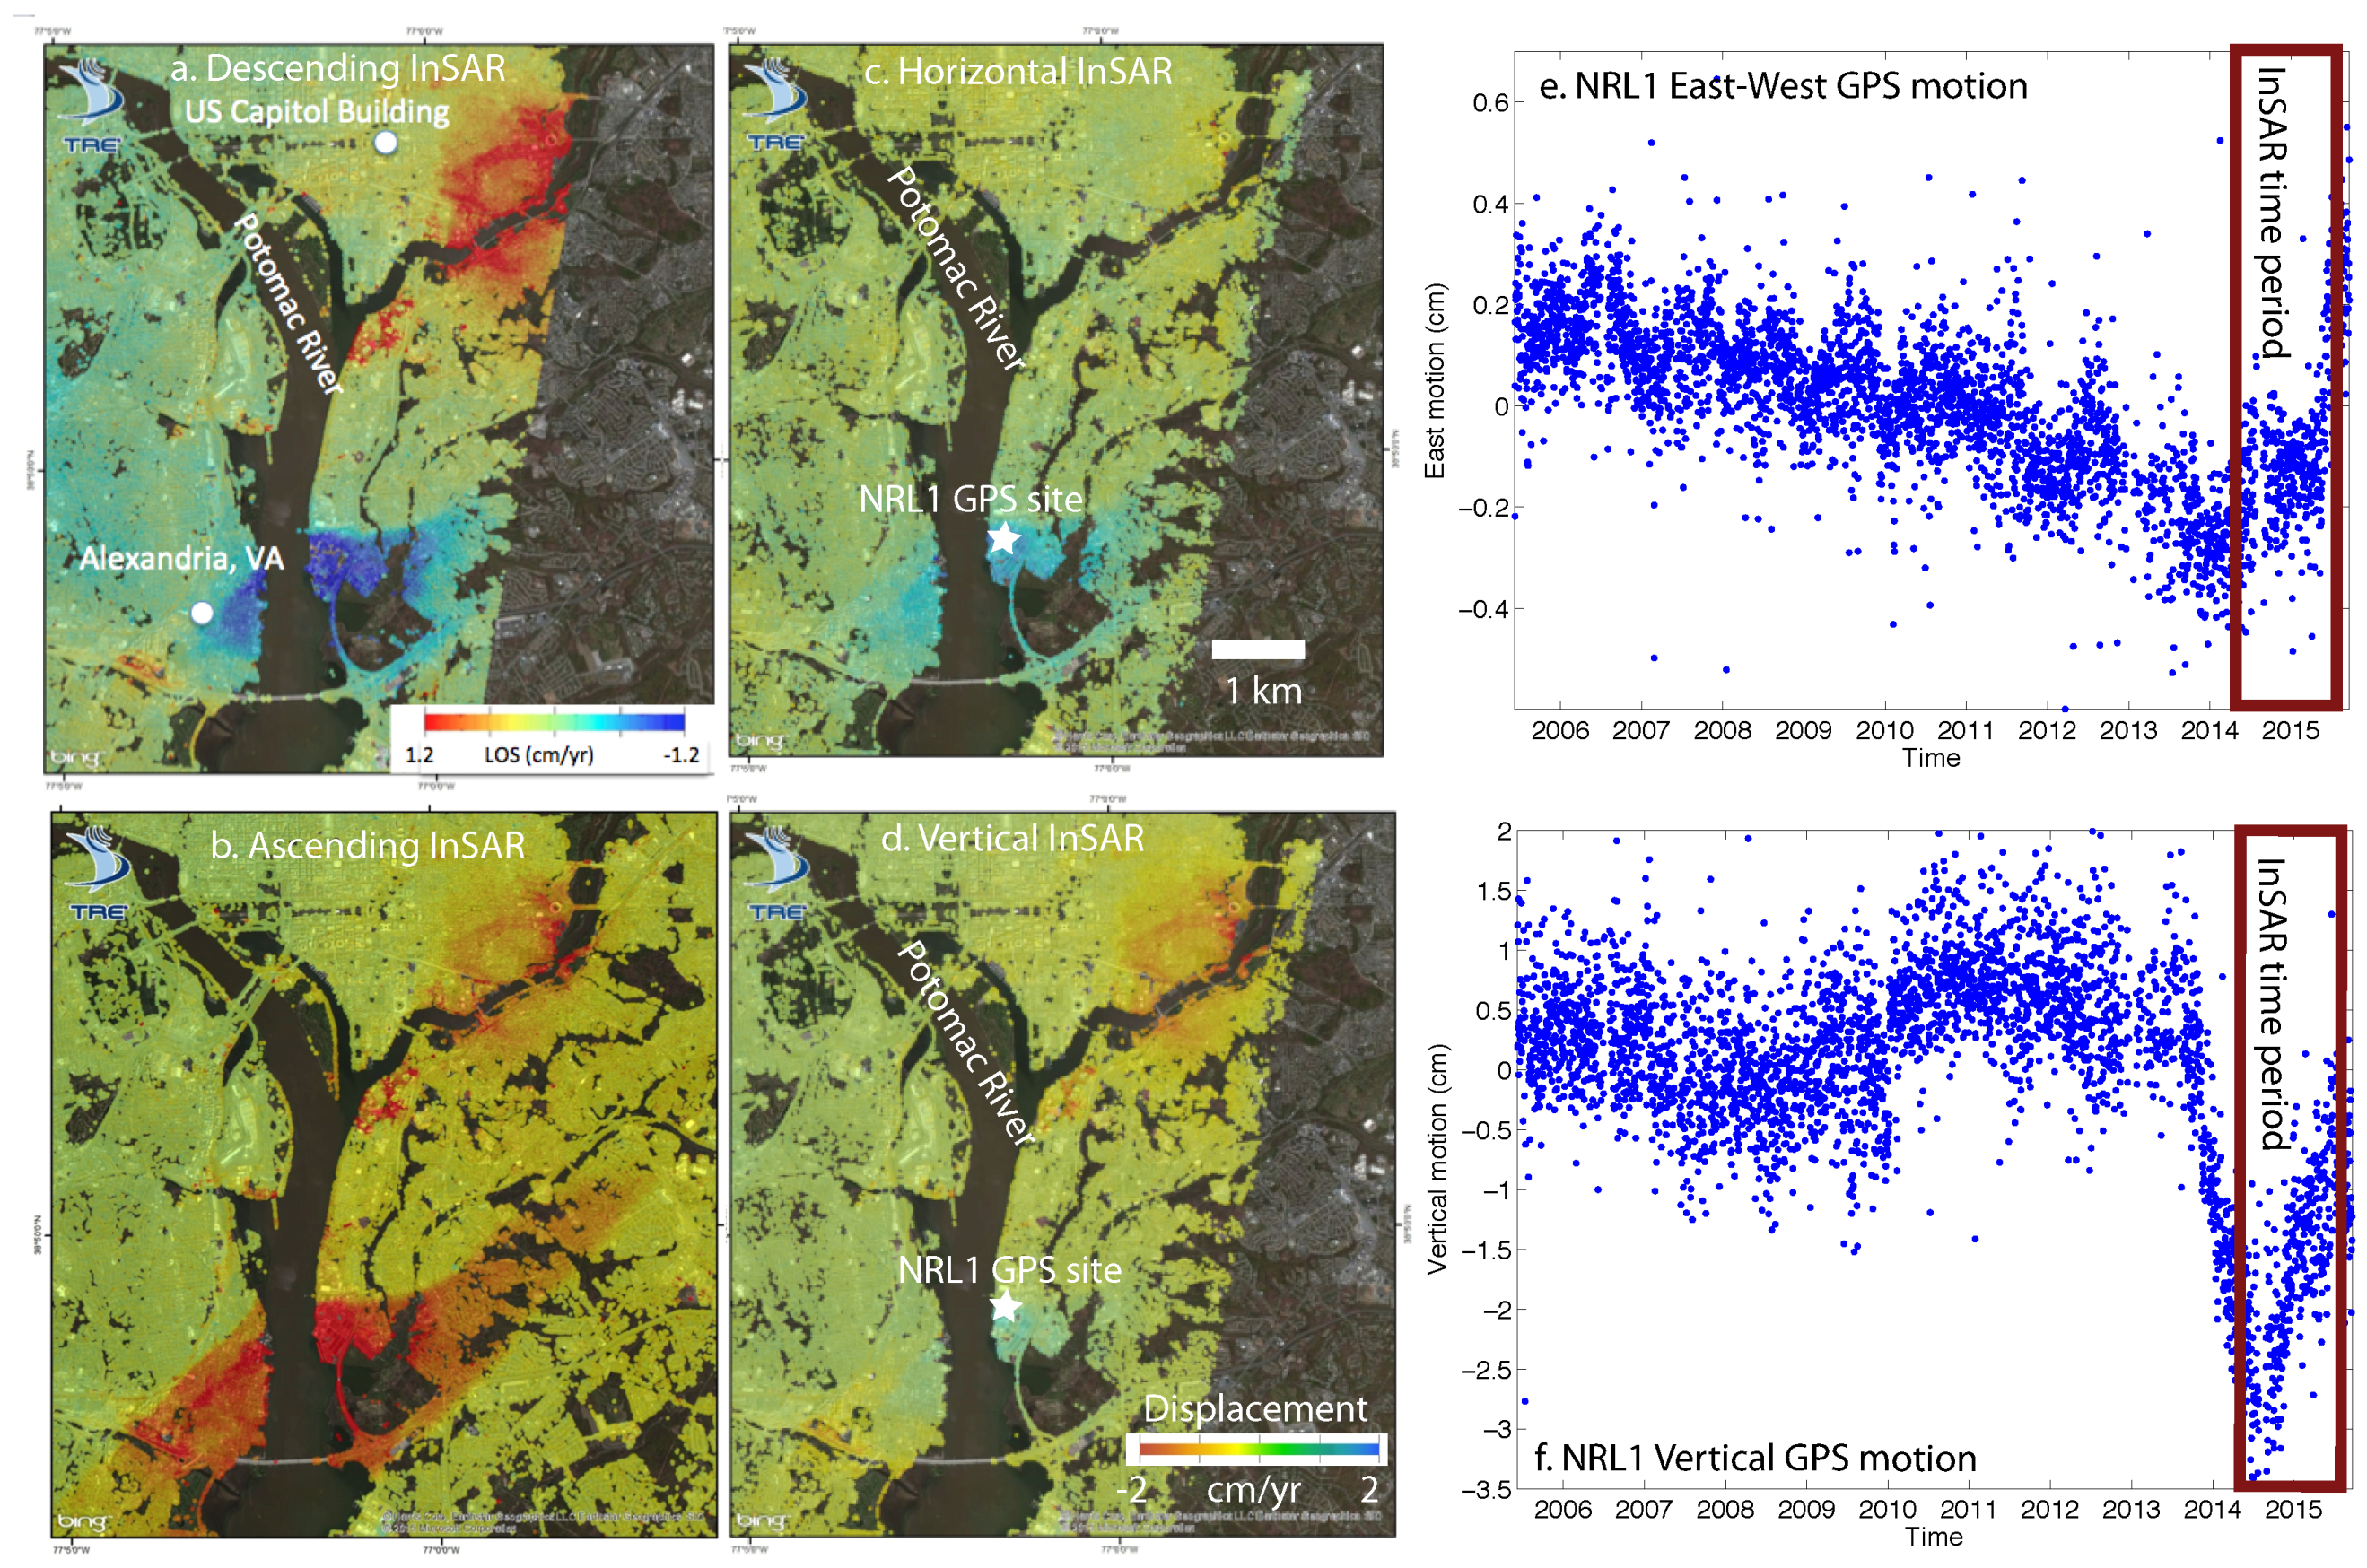
  • For the regional InSAR processing, temporal coverage is limited to 1992–2011 in the western US and 2006–2011 in other places. Deformation that might have occurred during other time periods would not be detected—for example, the deformation near Alexandria, VA, was not during this time interval and was not detected with the regional InSAR processing.
  • Spatial coverage is limited to literature studies in Canada and Mexico with essentially no coverage in Alaska. Even within the conterminous USA, there are several regions that were not analyzed as shown in Figure 1 and Figure 2.
  • Many areas of anthropogenic activity may be deforming at a level below our detection threshold, which is higher in the eastern U.S. For example, the deformation near Alexandria, VA, (Figure 13) would not have been detected by our analysis of the ALOS-1 data alone.
  • Since deformation must be a few pixels in size to be detected, deformation must be a few hundred meters in size to be detectable with our approach.
In spite of the limitations of our study, we draw several key conclusions. Human-caused ground deformation can be detected from space across North America within a variety of environmental conditions. The characteristics of the deformation vary significantly from location to location, and so individual characteristics such as the pattern or rates of deformation are not simply diagnostic of the source of deformation. For example, groundwater-related deformation (the dominant cause of ground deformation in our survey) alone produces signals varying from 0.5 cm/yr to 6 cm/yr in the radar LOS over areas ranging in diameter from 3 km to 80 km. While most of the areas of anthropogenic deformation we document are in the western USA and Mexico (Figure 4), our cursory examination of a subset of the available data identified several interesting signals in eastern North America, with not all of them understood (e.g., the cause of the eastward movement near Alexandria, VA). Most of the deformation observed in eastern North America is related to mining, but given the lack of suitable data acquired there to date, we must consider the survey of this area as incomplete—perhaps the mining signals are just the largest and other signals will be revealed from data with a lower detection threshold. Unfortunately, several currently active SAR systems are only collecting limited data over eastern North America—for example, some areas of known deformation in Livingstone County, NY, (Figure S7) and several areas in PA and WV (Figure S8) have no data from CSK or TSX and three SAR acquisitions or less from Sentinel in all of 2015, although the rate of data acquisition in these areas increased in late 2016.
Another lesson is that deformation can have complex spatial and temporal patterns that are not always obviously related to human activities like ground pumping. For example, at the EMGF, the rate of ground subsidence was thought to be related to net water production [50], but more recent data show that refinements to this conceptual model are needed to explain the change from subsidence to uplift associated with increased net production. Another example is the comparison of Brady Hot Springs and Desert Peak geothermal plants in Nevada which have similar structural settings, well placements, and production rates, but Brady shows subsidence rates of a few centimeters per year in the radar LOS, and Desert Peak, only 7 km away, has little to no deformation (e.g., [69,70]). While deformation studies provide mechanisms and models to explain their observations, deformation rate and style are highly dependent on the particular reservoir, making it difficult to extrapolate behavior between areas. Our work highlights the need for detailed studies at the 263 individual sites to better understand the physical processes driving ground deformation.

5. Conclusions

Returning to the questions posed in the introduction, we find that InSAR is a useful (if imperfect tool) to measure anthropogenic ground deformation over North America and observe changes in the deformation over time. We have cataloged 263 sources of suspected anthropogenic deformation. The dominant form of deformation is related to groundwater usage, especially in the western USA and Mexico, while mining is the most common source of deformation in the eastern USA. At least 17 GPS sites, and as many as 63 are affected by the anthropogenic deformation detected by InSAR. While the primary datasets we used are mostly of historical interest, we hope that researchers with a particular interest in the any of the signals shown here will be motivated to try and extract even more out of the existing (and future) datasets. To this end, we have made our catalog of sources available in the supplemental material in the hope that other researchers will build upon it to expand the temporal and spatial coverage—we have no plans to continue this compilation at a continental scale. While our analysis of historic data has been incomplete due to limitations of data quality (e.g., poor C-band coherence from ERS-1/2 and Envisat in most areas of eastern North America) and computing resources (e.g., we have not yet been able to process the entire archive for time series), there are opportunities for routine and automated wide area mapping using data from Sentinel-1a/b (e.g., [71]) that would improve upon our approach.
We suspect that there are hundreds other sources of deformation that could be detected with satellite InSAR but that were missed because of: (1) limited spatial coverage (either no data was acquired or data that was not coherent); (2) limited temporal coverage (i.e., deformation occurred during a time period not examined here; (3) limited spatial resolution (i.e., deformation was too small to be detected); or (4) deformation occurred at a rate that was below our spatially variable deformation threshold. Robust null results for deformation associated with human activities can also provide useful constraints on porosity and rock mechanical structure (e.g., Brady Hot Springs and Desert Peak, for example [69,70]), although the significance of the lack of deformation associated with wastewater injection in Oklahoma and the Raton Basin is still to be determined (e.g., [66]). Unfortunately, InSAR data are not routinely collected in all areas of North America. Future InSAR satellite missions should make routine observations over the entire continent to develop a more complete understanding of anthropogenic deformation in North America. Because ground deformation can be variable in time, many observations are needed each year to characterize these temporal variations.

Supplementary Materials

The following are available online at www.mdpi.com/2072-4292/9/12/1296/s1, Figures S1–S43 Interferograms of newly documented ground deformation; Table S1: Sites of suspected anthropogenic deformation and their potential cause.

Acknowledgments

ERS-1/2 and Envisat data were provided by the European Space Agency through the WInSAR and GeoEarthScope data collections hosted by UNAVCO through the GAGE facility with support from NSF and NASA under NSF Cooperative Agreement EAR-1261833. ALOS-1 data are from the Japanese Space Agency (JAXA) through the Alaska Satellite Facility. Alana G. Semple and Matthew E. Pritchard were supported by the National Science Foundation (EAR-0955547); Rowena B. Lohman was partly supported by the NASA Science Mission Directorate (NNX16AL20G and NNX16AK57G). We thank five anonymous reviewers and the editors for critical comments and Fernando Greene for coordinates of deforming areas from his Ph.D. thesis. For assistance with InSAR processing, we thank Cornell graduate students Scott Henderson, Maria Furtney, Ben Valentino, Holly Taylor (supported by a NASA Earth and Space Sciences Fellowship and a Coleman Fellowship from the Cornell University College of Engineering), and Kyle Murray, as well as undergraduate students Ian Moskal and Mary Pisaniello (who was partly supported by the Cornell University College of Engineering).

Author Contributions

Matthew E. Pritchard and Rowena B. Lohman conceived the study; Alana G. Semple analyzed data from the western US with assistance from Matthew E. Pritchard, Rowena B. Lohman and others listed in the acknowledgments; Rowena B. Lohman did the analysis of data for TX and supervised the analysis for East Mesa; Matthew E. Pritchard initiated analysis of ALOS-1 data in the eastern US, and all authors contributed to figures and to text in the paper.

Conflicts of Interest

The authors declare no conflict of interest.

References

  1. Vilardo, G.; Ventura, G.; Terranova, C.; Matano, F.; Nardò, S. Ground deformation due to tectonic, hydrothermal, gravity, hydrogeological, and anthropic processes in the Campania Region (Southern Italy) from Permanent Scatterers Synthetic Aperture Radar Interferometry. Remote Sens. Environ. 2009, 113, 197–212. [Google Scholar] [CrossRef]
  2. Tomás, R.; Romero, R.; Mulas, J.; Marturià, J.J.; Mallorquí, J.; Lopez-Sanchez, J.M.; Herrera, G.; Gutiérrez, F.; González, P.J.; Fernández, J.; et al. Radar interferometry techniques for the study of ground subsidence phenomena: A review of practical issues through cases in Spain. Environ. Earth Sci. 2014, 71, 163–181. [Google Scholar] [CrossRef] [Green Version]
  3. Mitigating Losses from Land Subsidence in the United States; Consensus Study Report; The National Academies Press: Washington, DC, USA, 1991.
  4. Galloway, D.; Jones, D.R.; Ingebritsen, S.E.E. Land Subsidence in the United States; US Geological Survey: Reston, VA, USA, 1999.
  5. Argus, D.F.; Heflin, M.B.; Peltzer, G.; Crampé, F.; Webb, F.H. Interseismic strain accumulation and anthropogenic motion in metropolitan Los Angeles. J. Geophys. Res. Solid Earth 2005, 110, 1–26. [Google Scholar] [CrossRef]
  6. Gourmelen, N.; Amelung, F.; Casu, F.; Manzo, M.; Lanari, R. Mining-related ground deformation in Crescent Valley, Nevada: Implications for sparse GPS networks. Geophys. Res. Lett. 2007, 34, 1–5. [Google Scholar] [CrossRef]
  7. González, P.J.; Tiampo, K.F.; Palano, M.; Cannavó, F.; Fernández, J. The 2011 Lorca earthquake slip distribution controlled by groundwater crustal unloading. Nat. Geosci. 2012, 5, 821–825. [Google Scholar] [CrossRef] [Green Version]
  8. Marshall, S.T.; Funning, G.J.; Owen, S.E. Fault slip rates and interseismic deformation in the western Transverse Ranges, California. J. Geophys. Res. Solid Earth 2013, 118, 4511–4534. [Google Scholar] [CrossRef]
  9. Trugman, D.T.; Borsa, A.A.; Sandwell, D.T. Did stresses from the Cerro Prieto Geothermal Field influence the El Mayor-Cucapah rupture sequence? Geophys. Res. Lett. 2014, 41, 8767–8774. [Google Scholar] [CrossRef]
  10. Fialko, Y.; Simons, M. Deformation and seismicity in the Coso geothermal area, Inyo County, California: Observations and modeling using satellite radar interferometry. J. Geophys. Res. B 2000, 105, 21781–21793. [Google Scholar] [CrossRef]
  11. Bell, J.W.; Amelung, F.; Ferretti, A.; Bianchi, M.; Novali, F. Permanent scatterer InSAR reveals seasonal and long-term aquifer-system response to groundwater pumping and artificial recharge. Water Resour. Res. 2008, 44. [Google Scholar] [CrossRef]
  12. Dixon, T.H.; Amelung, F.; Ferretti, A.; Novali, F.; Rocca, F.; Dokka, R.; Sella, G.; Kim, S.W.; Wdowinski, S.; Whitman, D. Space geodesy: Subsidence and flooding in New Orleans. Nature 2006, 441, 587–588. [Google Scholar] [CrossRef] [PubMed]
  13. Karegar, M.A.; Dixon, T.H.; Engelhart, S.E. Subsidence along the Atlantic Coast of North America: Insights from GPS and late Holocene relative sea level data. Geophys. Res. Lett. 2016, 43, 3126–3133. [Google Scholar] [CrossRef]
  14. Massonnet, D.; Holzer, T.; Vadon, H. Land subsidence caused by the East Mesa geothermal field, California, observed using SAR interferometry. Geophys. Res. Lett. 1997, 24, 901–904. [Google Scholar] [CrossRef]
  15. Amelung, F.; Galloway, D.; Bell, J.; Zebker, H.; Laczniak, R. Sensing the ups and downs of Las Vegas: InSAR reveals structural control of land subsidence and aquifer-system deformation. Geology 1999, 27, 483–486. [Google Scholar] [CrossRef]
  16. Bawden, G.W.; Thatcher, W.; Stein, R.S.; Hudnut, K.W.; Peltzer, G. Tectonic contraction across Los Angeles after removal of groundwater pumping effects. Nature 2001, 412, 812–815. [Google Scholar] [CrossRef] [PubMed]
  17. Miller, M.M.; Shirzaei, M. Spatiotemporal characterization of land subsidence and uplift in Phoenix using InSAR time series and wavelet transforms. J. Geophys. Res. Solid Earth 2015, 120, 5822–5842. [Google Scholar] [CrossRef]
  18. Ali, S.T.; Akerley, J.; Baluyut, E.C.; Davatzes, N.C.; Lopeman, J.; Moore, J.; Plummer, M.; Spielman, P.; Warren, I.; Feigl, K.L. Geodetic Measurements and Numerical Models of Deformation: Examples from Geothermal Fields in the Western United States. In Proceedings of the 41st Workshop on Geothermal Reservoir Engineering Stanford University, Stanford, CA, USA, 22–24 February 2016. [Google Scholar]
  19. Gabriel, A.K.; Goldstein, R.M.; Zebker, H.A. Mapping small elevation changes over large areas—Differential radar interferometry. J. Geophys. Res. 1989, 94, 9183–9191. [Google Scholar] [CrossRef]
  20. Prush, V.; Lohman, R. Forest Canopy Heights in the Pacific Northwest Based on InSAR Phase Discontinuities across Short Spatial Scales. Remote Sens. 2014, 6, 3210–3226. [Google Scholar] [CrossRef]
  21. Calais, E.; Han, J.; DeMets, C.; Nocquet, J. Deformation of the North American plate interior from a decade of continuous GPS measurements. J. Geophys. Res. Solid Earth 2006, 111. [Google Scholar] [CrossRef]
  22. Sella, G.F.; Stein, S.; Dixon, T.H.; Craymer, M.; James, T.S.; Mazzotti, S.; Dokka, R.K. Observation of glacial isostatic adjustment in “stable” North America with GPS. Geophys. Res. Lett. 2007, 34. [Google Scholar] [CrossRef]
  23. Peltier, W.; Argus, D.; Drummond, R. Space geodesy constrains ice age terminal deglaciation: The global ICE-6G_C (VM5a) model. J. Geophys. Res. Solid Earth 2015, 120, 450–487. [Google Scholar] [CrossRef]
  24. Bürgmann, R.; Rosen, P.A.; Fielding, E.J. Synthetic aperture radar interferometry to measure Earth’s surface topography and its deformation. Ann. Rev. Earth Planet. Sci. 2000, 28, 169–209. [Google Scholar] [CrossRef]
  25. Rosen, P.A.; Hensley, S.; Peltzer, G.; Simons, M. Updated Repeat Orbit Interferometry Package Released. EOS 2004, 85, 47. [Google Scholar] [CrossRef]
  26. Farr, T.G.; Rosen, P.A.; Caro, E.; Crippen, R.; Duren, R.; Hensley, S.; Kobrick, M.; Paller, M.; Rodriguez, E.; Roth, L.; et al. The Shuttle Radar Topography Mission. Rev. Geophys. 2007, 45, RG2004. [Google Scholar] [CrossRef]
  27. Gesch, D.; Oimoen, M.; Greenlee, S.; Nelson, C.; Steuck, M.; Tyler, D. The national elevation dataset. Photogramm. Eng. Remote Sens. 2002, 68, 5–32. [Google Scholar]
  28. Valentino, B.R. Application of InSAR to Salt Mine Subsidence. Master’s Thesis, Cornell University, Ithaca, NY, USA, 2016. [Google Scholar]
  29. Berardino, P.; Fornaro, G.; Lanari, R.; Sansosti, E. A new Algorithm for Surface Deformation Monitoring based on Small Baseline Differential SAR Interferograms. IEEE Trans. Geosci. Remote Sens. 2002, 40, 2375–2383. [Google Scholar] [CrossRef]
  30. Henderson, S.T.; Pritchard, M.E. Decadal volcanic deformation in the Central Andes Volcanic Zone revealed by InSAR time series. Geochem. Geophys. Geosyst. 2013, 14, 1358–1374. [Google Scholar] [CrossRef]
  31. Buckley, S.M.; Rosen, P.A.; Hensley, S.; Tapley, B.D. Land subsidence in Houston, Texas, measured by radar interferometry and constrained by extensometers. J. Geophys. Res. Solid Earth (1978–2012) 2003, 108. [Google Scholar] [CrossRef]
  32. Schmidt, D.A.; Bürgmann, R. Time-dependent land uplift and subsidence in the Santa Clara valley, California, from a large interferometric synthetic aperture radar data set. J. Geophys. Res. 2003, 108. [Google Scholar] [CrossRef]
  33. Meyer, F.; Hsiao, V.; Oommen, T.; Moruza, T. Using Interferometric Synthetic Aperture Radar for Network-Wide Transportation Infrastructure Monitoring. Presented at the TRB Webinar, Washington, DC, USA, 12 July 2016. [Google Scholar]
  34. Hoppe, E.; Bohane, A.; Falorni, G.; Bruckno, B.; Vaccari, A.; Meyer, F.; Pritchard, M. InSAR remote sensing for performance monitoring of transportation infrastructure at the network level. In Proceedings of the Transport Research Arena TRA2016, Warsaw, Poland, 18–21 April 2016. [Google Scholar]
  35. Hanssen, R.A. Radar Interferometry: Data Interpretation and Error Analysis; Kluwer Academic Publishers: Dordrecht, The Netherlands, 2001. [Google Scholar]
  36. Barnhart, W.D.; Lohman, R.B. Characterizing and estimating noise in InSAR and InSAR time series with MODIS. Geochem. Geophys. Geosyst. 2013, 14, 4121–4132. [Google Scholar] [CrossRef]
  37. Greene, F. Surface Deformation Measured with Interferometric Synthetic Aperture Radar: Case Studies of Basin and Range and Garlock-San Andreas Fault. Ph.D. Thesis, University of Miami, Coral Gables, FL, USA, 2014. [Google Scholar]
  38. Massonnet, D.; Feigl, K. Discrimination of geophysical phenomena in satellite radar interferograms. Geophys. Res. Lett. 1995, 22, 1537–1540. [Google Scholar] [CrossRef]
  39. Pritchard, M.E.; Simons, M.; Rosen, P.; Hensley, S.; Webb, F. Co-seismic slip from the 1995 July 30 Mw = 8.1 Antofagasta, Chile, earthquake as constrained by InSAR and GPS observations. Geophys. J. Int. 2002, 150, 362–376. [Google Scholar] [CrossRef]
  40. Zebker, H.A.; Villasenor, J. Decorrelation in interferometric radar echoes. IEEE Trans. Geosci. Remote Sens. 1992, 30, 950–959. [Google Scholar] [CrossRef]
  41. Malinverni, E.; Sandwell, D.; Tassetti, A.; Cappelletti, L. Decorrelation of L-Band and C-Band Interferometry to volcanic risk prevention. In Proceedings of the SPIE Remote Sensing, International Society for Optics and Photonics, Dresden, Germany, 17 October 2013; p. 88910B. [Google Scholar]
  42. Baxter, M.A.; Graves, C.E.; Moore, J.T. A climatology of snow-to-liquid ratio for the contiguous United States. Weather Forecast. 2005, 20, 729–744. [Google Scholar] [CrossRef]
  43. Prush, V.B.; Lohman, R.B. Time-Varying Elevation Change at the Centralia Coal Mine in Centralia, Washington (USA), Constrained with InSAR, ASTER, and Optical Imagery. IEEE J. Sel. Top. Appl. Earth Obs. Remote Sens. 2015, 8, 919–925. [Google Scholar] [CrossRef]
  44. Finnegan, N.J.; Pritchard, M.E.; Lohman, R.B.; Lundgren, P.R. Constraints on surface deformation in the Seattle, WA urban corridor from satellite radar interferometry time series analysis, Geophys. J. Int. 2008, 174, 29–41. [Google Scholar] [CrossRef]
  45. Fialko, Y.; Simons, M. Evidence for on-going inflation of the Socorro magma body, New Mexico, from interferometric synthetic aperture radar imaging. Geophys. Res. Lett. 2001, 28, 3549–3552. [Google Scholar] [CrossRef]
  46. Philibosian, B.; Simons, M. A survey of volcanic deformation on Java using ALOS PALSAR interferometric time series. Geochem. Geophys. Geosyst. 2011, 12, Q110044. [Google Scholar] [CrossRef]
  47. Ebmeier, S.; Biggs, J.; Mather, T.; Amelung, F. On the lack of InSAR observations of magmatic deformation at Central American volcanoes. J. Geophys. Res. Solid Earth 2013, 118, 2571–2585. [Google Scholar] [CrossRef]
  48. Bekaert, D.; Hamlington, B.; Buzzanga, B.; Jones, C. Spaceborne Synthetic Aperture Radar Survey of Subsidence in Hampton Roads, Virginia (USA). Sci. Rep. 2017, 7, 14752. [Google Scholar] [CrossRef] [PubMed]
  49. EIA. U.S. Energy Information Agency, Active Coal Mines, Surface and Underground. Available online: https://www.eia.gov/maps/layer_info-m.php (accessed on 2 June 2017).
  50. Han, J.Y.; Forster, R.R.; Moser, D.E.; Ford, A.L.J.; Ramírez-Hernández, J.; Tiampo, K.F. The spatial and temporal subsidence variability of the East Mesa Geothermal Field, California, USA, and its potential impact on the All American Canal System. Int. J. Remote Sens. 2011, 32, 3427–3449. [Google Scholar] [CrossRef]
  51. Lofgren, B.E. Measuring ground movement in geothermal areas of Imperial Valley, California. In Proceedings of the Jet Propulsion Laboratory-National Science Foundation Geothermal Energy Conference, Pasadena, CA, USA, 23–25 September 1974; pp. 128–138. [Google Scholar]
  52. Lofgren, B.E. Measured crustal deformation in Imperial Valley, California. Geothermics 1979, 8, 267–272. [Google Scholar] [CrossRef]
  53. Eneva, M.; Adams, D.; Falorni, G.; Morgan, J. Surface deformation in Imperial Valley, CA, from satellite radar interferometry. Geotherm. Resour. Counc. Trans. 2012, 36, 1339–1344. [Google Scholar]
  54. Eneva, M.; Adams, D.; Falorni, G.; Morgan, J. Applications of radar interferometry to detect surface deformation in geothermal areas of Imperial Valley in southern California. In Proceedings of the 38th Workshop on Geothermal Reservoir Engineering, Stanford, CA, USA, 11–13 February 2013. [Google Scholar]
  55. Lofgren, B.E. Land Subsidence and Tectonism, Raft River Valley, Idaho; U.S. Geological Survey: Reston, VA, USA, 1975; p. 21.
  56. ADWR. Arizona Department of Water Resources, Land Subsidence in Arizona. Available online: http://www.azwater.gov/AzDWR/Hydrology/Geophysics/LandSubsidenceInArizona.htm (accessed on 8 April 2015).
  57. CAP Project. Tonopah Desert Recharge Project. Available online: http://www.cap-az.com/index.php/departments/recharge-program/tonopah-desert (accessed on 10 January 2017).
  58. Pinedale Anticline Project Office, Pinedale, Wyoming. Available online: http://www.wy.blm.gov/jio-papo/papo/index.htm (accessed on 10 January 2017).
  59. Encana, USA Division. Annual Information Form. Available online: https://www.encana.com/pdf/investors/financial/annual-reports/2008/p006996.pdf (accessed on 11 December 2016).
  60. District of Columbia Water and Sewer Authority. DC Clean Rivers Project—Division A, Blue Plains Tunnel. Available online: https://www.dcwater.com/workzones/projects/pdfs/blueplains_tunnel.pdf (accessed on 26 May 2011).
  61. Blewitt, G.; Kreemer, C.; Hammond, W.C.; Goldfarb, J.M. Terrestrial reference frame NA12 for crustal deformation studies in North America. J. Geodyn. 2013, 72, 11–24. [Google Scholar] [CrossRef]
  62. Blewitt, G.; Kreemer, C.; Hammond, W.C.; Gazeaux, J. MIDAS robust trend estimator for accurate GPS station velocities without step detection. J. Geophys. Res. Solid Earth 2016, 121, 2054–2068. [Google Scholar] [CrossRef] [PubMed]
  63. Reilinger, R.; Brown, L.; Powers, D. New evidence for tectonic uplift in the Diablo Plateau region, west Texas. Geophys. Res. Lett. 1980, 7, 181–184. [Google Scholar] [CrossRef]
  64. Keranen, K.M.; Savage, H.M.; Abers, G.A.; Cochran, E.S. Potentially induced earthquakes in Oklahoma, USA: Links between wastewater injection and the 2011 Mw 5.7 earthquake sequence. Geology 2013, 41, 699–702. [Google Scholar] [CrossRef]
  65. Samsonov, S.; Beavan, J.; González, P.J.; Tiampo, K.; Fernández, J. Ground deformation in the Taupo Volcanic Zone, New Zealand, observed by ALOS PALSAR interferometry. Geophys. J. Int. 2011, 187, 147–160. [Google Scholar] [CrossRef] [Green Version]
  66. Barnhart, W.D.; Benz, H.M.; Hayes, G.P.; Rubinstein, J.L.; Bergman, E. Seismological and geodetic constraints on the 2011 Mw 5.3 Trinidad, Colorado earthquake and induced deformation in the Raton Basin. J. Geophys. Res. Solid Earth 2014, 119, 7923–7933. [Google Scholar] [CrossRef]
  67. Chaussard, E.; Amelung, F.; Aoki, Y. Characterization of open and closed volcanic systems in Indonesia and Mexico using InSAR time series. J. Geophys. Res. Solid Earth 2013, 118, 3957–3969. [Google Scholar] [CrossRef]
  68. Shirzaei, M.; Ellsworth, W.L.; Tiampo, K.F.; González, P.J.; Manga, M. Surface uplift and time-dependent seismic hazard due to fluid injection in eastern Texas. Science 2016, 353, 1416–1419. [Google Scholar] [CrossRef] [PubMed]
  69. Ali, S.T.; Davatzes, N.C.; Feigl, K.L.; Wang, H.F.; Foxall, W.; Mellors, R.J.; Akerley, J.; Zemach, E.; Spielman, P. Deformation at Brady Hot Springs geothermal field measured by time series analysis of InSAR data. In Proceedings of the Fourtieth Workshop on Geothermal Reservoir Engineering Stanford University, Stanford, CA, USA, 26–28 January 2015; Volume 40, pp. 26–28. [Google Scholar]
  70. Im, K.; Elsworth, D.; Guglielmi, Y.G.; Mattioli, G.S. Use of Geodesy to Discriminate Deformation Mechanics in Geothermal Reservoirs. In Proceedings of the 9th US Rock Mechanics/Geomechanics Symposium, San Francisco, CA, USA, 28 June–1 July 2015. [Google Scholar]
  71. Barra, A.; Solari, L.; Béjar-Pizarro, M.; Monserrat, O.; Bianchini, S.; Herrera, G.; Crosetto, M.; Sarro, R.; González-Alonso, E.; Mateos, R.M.; et al. A Methodology to Detect and Update Active Deformation Areas Based on Sentinel-1 SAR Images. Remote Sens. 2017, 9, 1002. [Google Scholar] [CrossRef]
Figure 1. Spatial variations of InSAR data quality for single interferograms spanning 9 months to 2 years for tracks used in the survey for anthropogenic deformation. This map was used to determine the limits of the data processing—low values indicate poor data quality (see text for details).
Remotesensing 09 01296 g001
Figure 2. Selected ALOS-1 interferograms (each color cycle corresponds to 11.3 cm of line-of-sight displacement) covering the eastern USA that were processed in this study (Table 2), illustrating the high coherence possible over much of the region. Data gaps include areas that were decorrelated and could not be unwrapped, where there are holes in the Shuttle Radar Topography Mission digital elevation model (SRTM DEM), and for three paths of data that had errors and were not processed. Longer spatial scales are dominated by ionospheric, atmospheric, and other effects, limiting our constraints to shorter spatial scale features that are not visible at the scale of this figure (see section on deformation detection and error analysis). The fairly small number of available ALOS-1 acquisitions means that the historical SAR imagery is not sensitive to larger spatial-scale signals such as glacial isostatic adjustment. We expect this situation to improve as more L-band data are acquired in the future, and as methods for isolating the ionospheric effects improve.
Remotesensing 09 01296 g002
Figure 3. (a,b) Wrapped interferograms of (a) uplift from 15 August 1992 to 2 January 1993 and (b) subsidence from 31 December 1996 to 20 May 1997 near Roswell, NM, with location (white dot, approximate location: 33.2 N, −104.3 W) of the time series shown in (c). (c) Line-of-sight (LOS) displacements vs. day of year and vs. absolute date (inset).
Remotesensing 09 01296 g003
Figure 4. An incomplete compilation of 263 areas of ground deformation caused by human activities in North America from various sources as detected by satellite InSAR (see Table S1)—see text for details on how potential source of deformation was identified. An additional four sites in Idaho were documented by Greene [37], but are not plotted as coordinates of the mines are not available.
Remotesensing 09 01296 g004
Figure 5. (a) Geographic setting of the East Mesa Geothermal Field (EMGF) study region and data coverage. Colored boxes indicate the extent of InSAR data used (Table 1) in this study, and solid black lines are Holocene faults. The black box indicates the area shown in (b) which shows the locations of currently active production and injection wells at the EMGF. The dashed black box is the reference box for Figure 7 and Figure 8.
Remotesensing 09 01296 g005
Figure 6. Net loss of water (production minus injection) at the EMGF from January 1990 to January 2012 as reported to the California Department of Conservation. Solid blue and red lines show the average net loss during two time periods during the ERS track 84 time series used by Han et al. [50], and the green line is the average net loss during Envisat track 84.
Remotesensing 09 01296 g006
Figure 7. A grayscale Landsat image overlaid with the average LOS velocity (negative values moving toward the satellite) for (a) ERS track 84, (b) Envisat track 84, (c) Envisat track 306, (d) and ALOS-1 path 211. The dashed box indicates the extent of the well field (Figure 5b).
Remotesensing 09 01296 g007
Figure 8. Cumulative LOS displacement showing maximum subsidence (a) and uplift (b) at East Mesa for the combined ERS and Envisat track 84 time series taken from the two locations shown by the white circles in the respective inset maps (see Figure 7b for scale). We assumed the deformation rate was constant during the interval between ERS and Envisat.
Remotesensing 09 01296 g008
Figure 9. Wrapped interferogram from 8 December 2006 to 3 September 2010 showing subsidence in the Raft River Valley, ID, related to groundwater pumping for agricultural use near Burley, ID [55], and both uplift and subsidence at the Raft River geothermal power plant [18].
Remotesensing 09 01296 g009
Figure 10. Unwrapped Envisat interferogram spanning 21 May 2005 to 8 August 2009, showing areas of ground deformation in Arizona that are primarily subsiding, with the uplifting region in the box near Tonopah, AZ, shown in Figure 11.
Remotesensing 09 01296 g010
Figure 11. Unwrapped Envisat interferogram spanning 21 May 2005 to 8 August 2009, showing time series from two areas of LOS decrease (interpreted as uplift—(a,b)) and their locations in (c). The area with no information in the center of the uplifting zone corresponds to agricultural fields that are decorrelated.
Remotesensing 09 01296 g011
Figure 12. Unwrapped interferogram at Jonah Field, WY, from ALOS-1 spanning the period from 19 May 2008 to 25 May 2010, showing areas of uplift and subsidence possibly related to hydrocarbon production.
Remotesensing 09 01296 g012
Figure 13. InSAR data near Washington, DC, from CSK and processed by TRE Canada using the SqueeSAR T M technique for a collaborative project with the University of Virginia and the Virginia Department of Transportation funded by the United States Department Of Transportation [33,34]. (a) Time series from 28 descending CSK SAR acquisitions spanning from March 2014 to June 2015 where blue indicates movement toward the satellite (e.g., uplift and/or eastward motion). (b) Time series from 40 ascending CSK SAR images spanning from February 2013 to August 2015. The average displacement rate standard deviation for all measurement points for the descending dataset (which characterizes the error of the measurements) was calculated to be ±0.23 cm/yr, and should be smaller for the ascending dataset since it contains more dates. These two tracks were combined to decompose the east–west (c) and vertical motion (d) in the common time period (March 2014 to June 2015) shown as a red box in (e,f). Subsidence is observed in the northeast part of the image, while an unusual combination of mostly east–west (e) and some uplift (f) is seen near the Naval Research Lab GPS site (NRL1) during the time period when the InSAR deformation was observed. Global positioning system (GPS) displacements are with respect to the NA12 reference frame [61] and were processed by the University of Nevada, Reno (e.g., [62]).
Remotesensing 09 01296 g013
Figure 14. Time series of 116 interferograms from ERS-1/2 from 1992 to 2001 over the Diablo Plateau where leveling studies showed deformation at a low rate during the earlier decades of the 20th century (star, [63]). Most signals visible here are probably related to atmospheric features and there is likely no detectable deformation above the detection threshold.
Remotesensing 09 01296 g014
Figure 15. Two interferograms from overlapping paths from the ALOS-1 satellite (dates above each path) in a region in Oklahoma (Oklahoma City is labeled) with numerous wastewater injection wells and earthquakes that do not show clear ground deformation (detection threshold is >3 cm/yr based on studies cited in the text). The locations of earthquakes with magnitudes >5 (from the USGS) that occurred after the interferogram time spans are shown.
Remotesensing 09 01296 g015
Figure 16. Secular rate from ALOS-1 time series (color) in eastern TX, where Shirzaei et al. [68] analyzed a subset of the area (black box) covered by two frames and reported ground uplift (black contours) associated with wastewater injection at several sites (red dots). Blue indicates shortening of the satellite LOS (e.g., uplift) in mm/yr, and we did not find a clear uplift signal above background in the area reported by Shirzaei et al. [68]. Note much larger signals to the northwest of the earlier study—these have magnitudes of −2 to −5 cm/yr. Letters and arrows indicate the location of the time series in Figure 17.
Remotesensing 09 01296 g016
Figure 17. Time series and inferred errors on rates at points A–C indicated in Figure 16. Shortening is consistent with either uplift or westward displacement. Dashed lines and closed circles indicate results inferred from path 172, and solid lines and open circles indicate path 173. Error bounds are 95% confidence intervals based just on the fit of the points at an individual pixel and do not reflect the spatial correlations of the noise that are evident in Figure 16.
Remotesensing 09 01296 g017
Table 1. Tracks and paths of InSAR data from the different satellites in the western USA with the time span of each listed (format YYMMDD). Most of the tracks from ERS and Envisat are plotted in Figure 1 and all have multiple frames per track. Information on number of interferograms used in the time series from different tracks and paths are listed. 1 East Mesa. InSAR: interferometric synthetic-aperture radar; ERS: European Remote Sensing; ALOS: Advanced Land Observing Satellite.
Track or PathSatellite# InterferogramsInterferogram Date Range
12ERS90920815–960429
55ERS251920609–001103
84ERS307920611–011125
98ERS160920612–001211
213ERS337920620–011204
234ERS3950531–960515
241ERS79920622–000629
277ERS78920521–001915
284ERS118921112–011209
356ERS354920421–040820
399ERS478920424–000327
442ERS201920601–041209
5Envisat8050816–080527
41Envisat210040902–101021
55Envisat28040730–100430
84Envisat106041104–100711
98Envisat135060807–110731
141Envisat25050127–100923
184Envisat60041114–100711
213Envisat146030722–100928
227Envisat163041124–100929
234Envisat3040219–060330
241Envisat7040916–100930
256Envisat177040326–101001
270Envisat315031213–101002
277Envisat222040118–101003
284Envisat1040919–050313
299Envisat220031006–101004
306Envisat288031216–101005
356Envisat99041029–100903
399Envisat115050214–090817
442Envisat69040826–110225
197ALOS-142060814–110225
211ALOS-143070107–071203
84ERS289 1 (49 dates)920611–011125
84Envisat359 1 (47 dates)030713–100815
306Envisat272 1 (35 dates)031216–101005
211ALOS-193 1 (16 dates)060522–110118
Table 2. Paths and dates (format: YYMMDD, except where multiple interferograms are used, when it is M/YYYY) of InSAR data (Figure 2) used in the eastern USA. 1 Time series of interferograms over a salt mine in western NY (Figure S7; [28]). 2 Multiple interferograms analyzed over coal mines in PA and WV (Figure S8). 3 Multiple interferograms created over coal mines in Alabama (Figure S11). 4 Multiple interferograms created over an area of known wastewater injection in Oklahoma (Figure 15). 5 This is the number of synthetic-aperture radar (SAR) acquisitions, there were more interferograms used in the time series. 6 Time series of interferograms over Alexandria, VA (Figure 13).
Track or PathSatellite# InterferogramsDate or Dates of Interferograms
125ALOS-11110128–080606
127ALOS-11100228–070823
129ALOS-11100403–070926
130ALOS-11100420–071013
131ALOS-11100622–071215
133ALOS-11100626–080118
134ALOS-11100327–070919
135ALOS-11110114–080523
137ALOS-11712/2006–1/2011 1
138ALOS-1105/2007–9/2010 1
139ALOS-11100620–071213
141ALOS-11100308–071016
143ALOS-1321/2007–1/2011 2
145ALOS-11101231–080509
147ALOS-11100418–071026
149ALOS-131/2008–1/2011
151ALOS-11110110–080519
153ALOS-11101229–080519
155ALOS-11100616–071209
159ALOS-135/2008–1/2011 3
161ALOS-11100626–071219
163ALOS-11110130–080606
167ALOS-11100103–070928
169ALOS-11100324–071217
171ALOS-11100612–071205
173ALOS-11100716–080108
175ALOS-11100519–071227
176ALOS-1217/2007–1/2011 4
177ALOS-189/2007–12/2010 4
179ALOS-11100610–071018
181ALOS-11100226–080106
185ALOS-11100620–071213
ascendingCSK40 5 2/2013–8/2015 6
descendingCSK28 5 3/2014–6/2015 6
Table 3. These 17 GPS stations probably lie within the deformation footprint of one of the areas of anthropogenic deformation identified in this study.
GPS Station IDLocationLat, LonFigure
NRL1Naval Research Lab, Washington, DC38.8207, −77.0244Figure 13
COSOChina Lake, CA35.9823, −117.8089Figure S2
UNR1Las Vegas, NV36.246, −115.243Figure S3
P500EMGF, CA32.690 −115.300Figure S4
SUR1Salt Lake City, UT40.675, −111.892Figure S6
P226San Jose, CA37.337, −121.826
P015Show Low, AZ34.264, −110.009
P148Susanville, CA40.419, −120.806
P105Delta Muni, UT39.388, −112.504Figure S26
LACRLamo Crk, NV40.851, −115.704Figure S27
LLASLake Los Angeles School, CA34.586, −117.838Figure S37
SONCGrass Valley, NV40.853, −117.728Figure S32
PARONear Little Salt Lake, UT38.033, −112.676Figure S20
P056Poterville, CA36.027, −119.063Figure S11
LEMALemoore, CA36.292, −119.782Figure S11
CRCNCorcoran, CA36.114, −119.568Figure S11
P564Lerdo Overpass, CA35.499, −119.535Figure S11

