1. Introduction
Mine planning increasingly requires prior knowledge of the characteristics and structures of the rocks to be mined. The competitive ornamental rock industry, which has an increasingly internationalized market, needs to optimize the costs of extracting commercial-size blocks for subsequent sale and manufacturing in the cutting workshop.
Reducing operating costs in the ornamental rock sector is closely linked to the extraction techniques and to the yield of the extracted block (percentage of useful stone relative to the total extracted volume). The yield from ornamental rock quarries is usually very low (approximately 20%), which is mainly due to the presence of fractures, joints, and other anisotropies that control the extraction of commercial size blocks. The low yields are also affected by the dimensions of the mining benches, which are usually defined in a standardized way without determining the mechanical characteristics of the rock massif.
Our goal was to apply non-destructive research techniques to analyse the geometry of the body to be mined, the presence of fractures, and the rock mass quality, which should be known to develop the optimal extraction plan for maximum profitability. To do this, we selected two geophysical methods: ground penetrating radar (GPR) and electrical resistivity imaging (ERI).
GPR is a geophysical prospecting technique that has been applied in geological studies [
1,
2,
3,
4,
5]. However, few studies have used GPR to characterize ornamental rock. Sigurdsson [
6] performed a GPR study in limestone quarries and was able to differentiate zones with textural variations. Porsani [
7] used these techniques in granite quarries in Brazil. Several other studies have used this technique in carbonate quarries to detect fractures [
8,
9,
10]. Other studies show that GPR techniques provide complementary and high-resolution information for determining the textures and fabrics of sedimentary rocks [
11], which offers great potential for delimiting the geological structure to be exploited in a quarry. The critical fractures and quality of an ornamental stone deposit have been examined [
12]. In this research, fracture status was evaluated by an in-situ GPR test. The resulting 3D GPR model allowed an exploration of the extension, shape, and orientation of the detected fractures surfaces.
ERI techniques have also been used to support geological studies [
13,
14,
15]. However, few studies have been performed on lithological characterization and fracturing in ornamental rocks.
There are very few publications in which GPR and ERI are used for lithological characterization, fracture and cavity identification, and rock quality determination of ornamental rock. Recently, the results of using GPR and ERI in three quarries were presented at SUSTAMINING [
16] in Verona (Italy). ERI was used in two marble quarries in Turkey and Italy and a granite quarry in Spain.
Because of the few previous investigations, this study analyses the possibility of using GPR and ERI as non-destructive analysis techniques in ornamental rocks (marbles) to identify the presence of fractures and karstification, lithologic contacts, and variations in the massif that will limit the final size of the blocks to be extracted and thus the design of the exploitation bench and extraction systems.
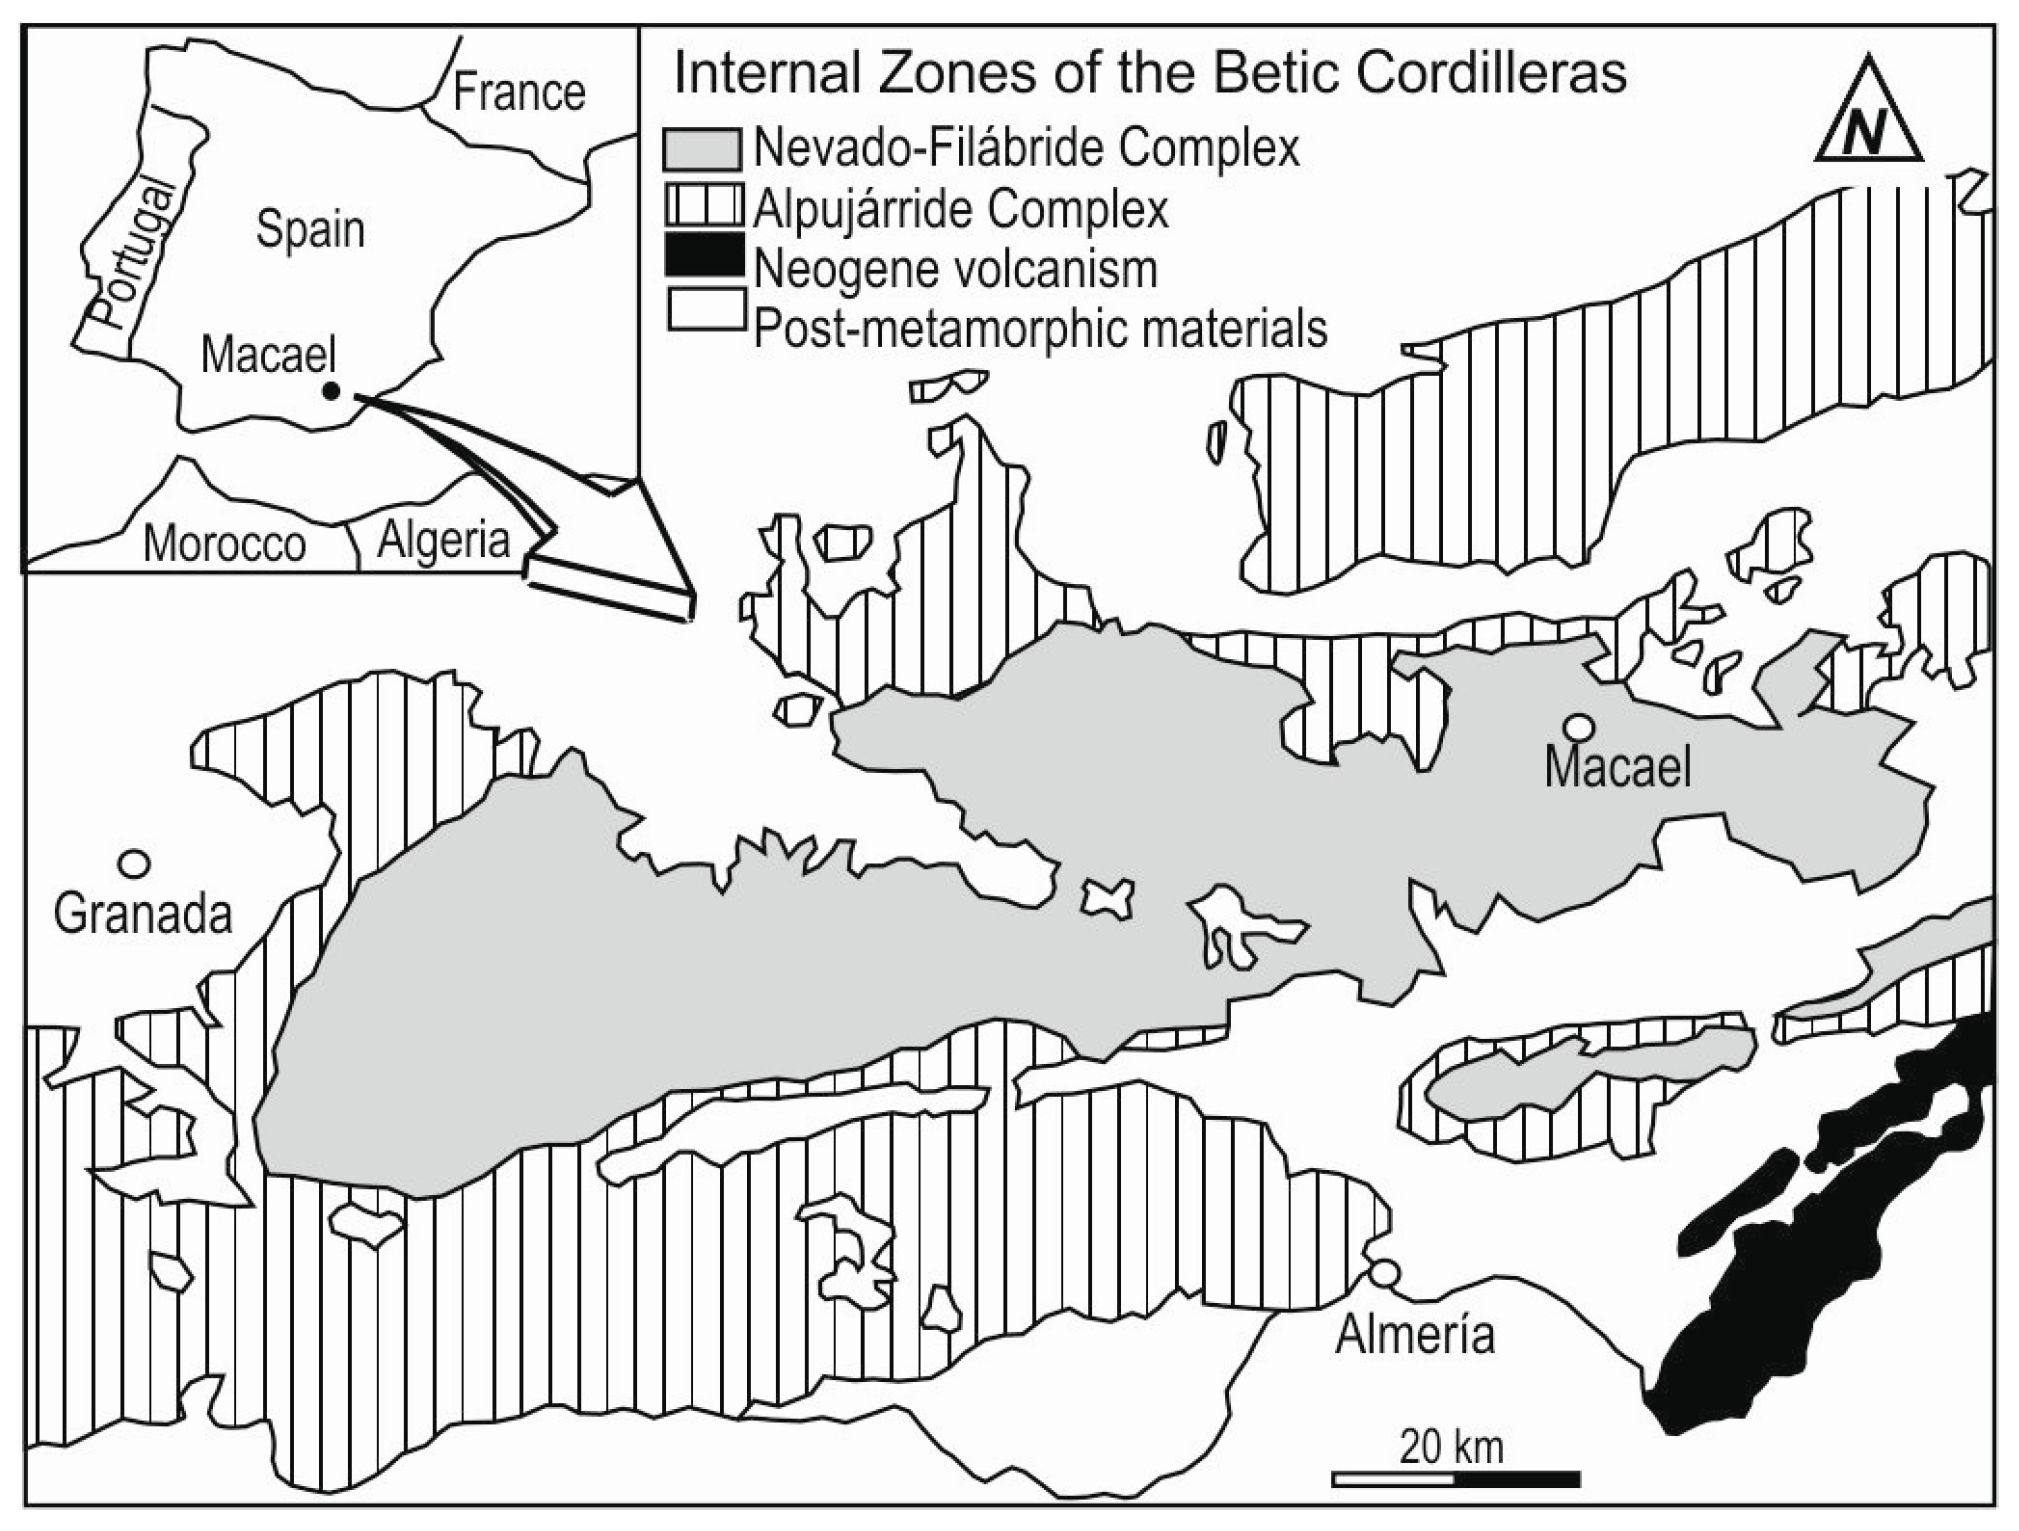
This study was conducted in the region of Macael (
Figure 1), which is currently the most important centre of marble production in Spain and the second most important in Europe after Italy. With marble reserves of more than 70 Mm
3, peak production was reached in 2002 with the extraction of 2 × 10
6 Tm. Fieldwork was conducted in the most important quarry mining area of Macael (the Macael Sur concession) on a marble mining bench with adequate dimensions and geometry for the study.
2. Background to the SITE
2.1. Geological Setting
The rocks that outcrop in the quarry belong to the internal areas of the Baetic Range and specifically to the Nevado-Filabride complex [
18] (
Figure 1), which consists of three tectonic units: the Nevado-Lubrin, Bedar-Macael, and Almocaizar formations.
The characteristic materials of the Nevado-Filabride Formation are Triassic carbonate rocks, which sometimes alternate with micaschists, calcareous micaschists, quartzite micaschists with garnet, and quartzite micaschists with amphibole [
17,
19]. The marbles are located in the Bedar-Macael Formation [
19] and are composed of layered white, grey, and yellow marbles with thicknesses ranging between 10 and 30 m.
The white marble, which is commercially known as “Macael White”, is granoblastic and ranges from equigranular with large grains to heterogranular with medium-fine grains. It also contains small amounts of quartz and isolated crystals of muscovite and feldspar. The marbles generally contain a foliation that is associated with grain size variations, certain orientations of calcite crystals, and the orientations of phyllosilicates.
2.2. Extraction System
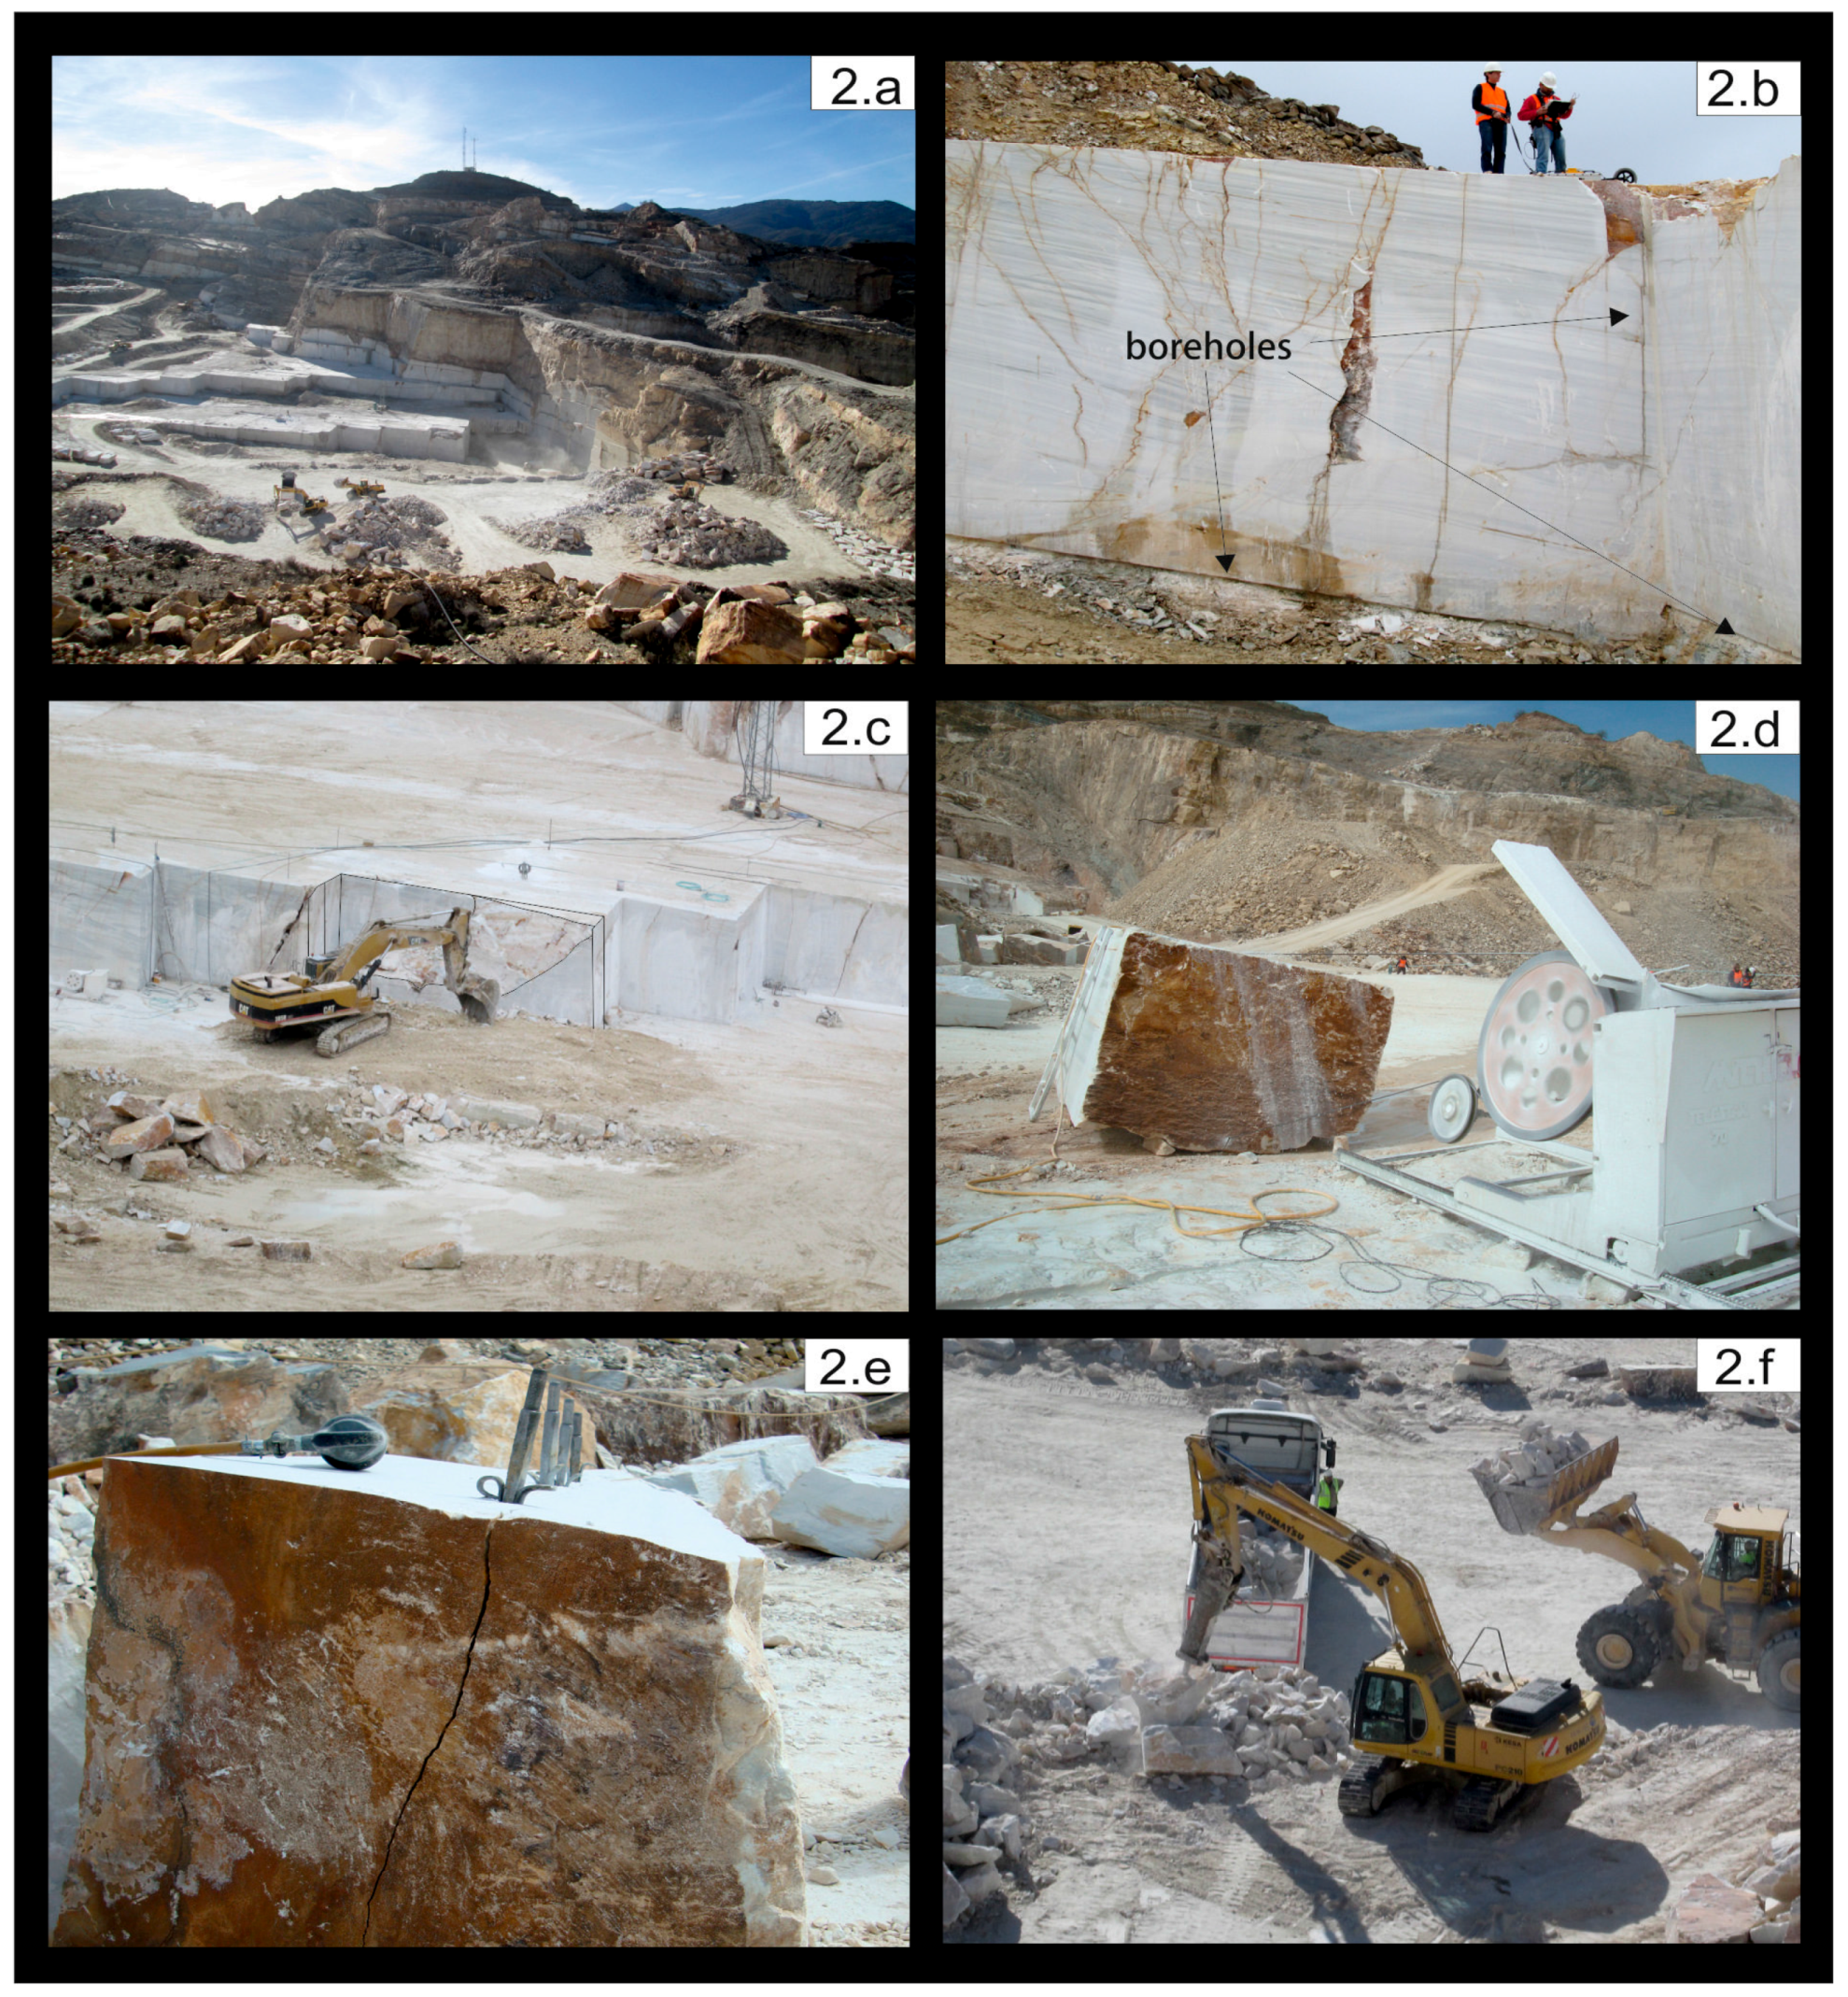
Open-pit mining is commonly used in the Macael mining district. Hillside quarries are mined by means of descending benches (
Figure 2a). Clearing is performed by drilling and blasting and sometimes creates up to 100 m of rubble, which is removed to a dump by mine trucks. The rubble/ore ratio is 6–7 m
3/Tn.
Once the primary mining bench is excavated and prepared (
Figure 2b,c), it is subjected to successive stages of subdivision perpendicular to the front. Two main cutting methods are used. The first is drilling and blasting (using mining powder or detonating cord) combined with mechanical methods, although the use of explosives is increasingly falling out of favour because it damages the rock. The second and most common method is the use of mechanical techniques to cut the marble, such as a diamond wire cutter and rarely a ranging arm shearer. To do this, three perpendicular holes that intersect each other at a point are drilled on the primary bench (
Figure 2b), through which a diamond wire cutter is passed to obtain a “secondary” bench. These benches, which have standard dimensions of 5 × 15 × 15 m in Macael, are in turn subdivided into five “tertiary” benches of 3 × 15 × 5 m by cuts with a diamond wire (
Figure 2c). In these tertiary benches, the commercial blocks are extracted using loaders or excavators with hydraulic drilling hammers or gunpowder. Overturning the marble bench in these quarries is unusual, although the quarries usually contain a sand bed, so segregated blocks are not damaged by falling (
Figure 2c). These cutting and extraction operations are important for the optimization of the quarry because the blocks can be broken due to cracks and fractures. The blocks and rock fragments that are extracted are squared on the quarry floor using a cutting wire for the blocks (
Figure 2d) and drills and wedges for the fragments (
Figure 2e), before being sent to the cutting factories. Finally, the rejects from the block extraction and squaring are used in the micronized stone industry (
Figure 2f).
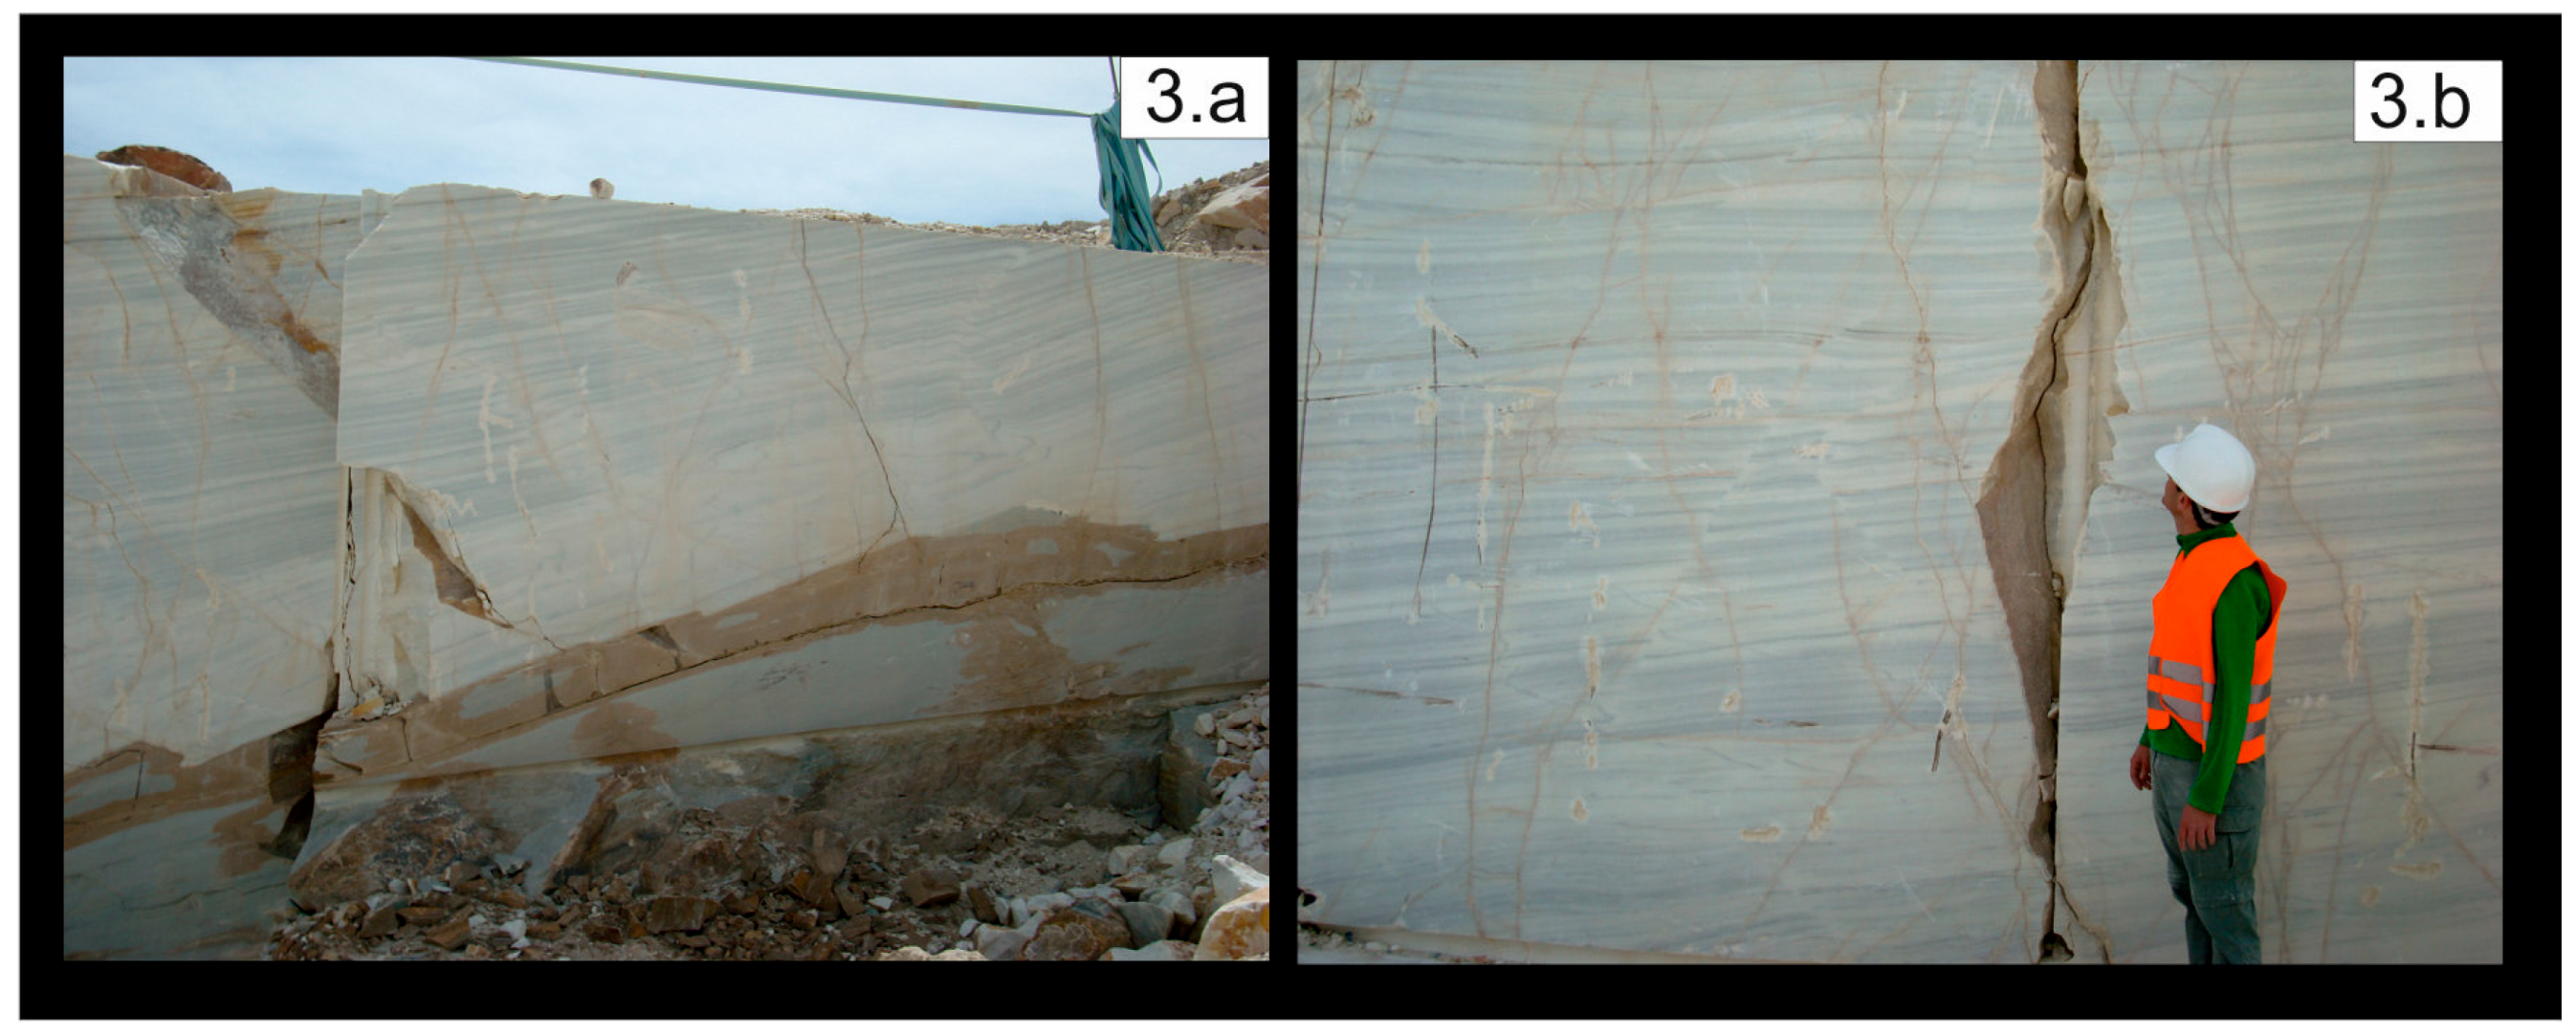
The presence of lithological alternations, fractures, joints, and occasional karstification in the marble level poses a major problem in mining (
Figure 3a,b). It is important to identify these planes of weakness to design and plan the appropriate size and cutting orientations of the secondary and tertiary benches. Hence, using the most appropriate and economical techniques for exploitation will reduce losses and considerably lower costs.
3. Methods
For this GPR and ERI study, we selected a quarry bench that is 48 m long and 5 m high. The bench is composed of marble (Macael white), which is characterized by a granoblastique texture. There are some pelitic intercalations (more or less abundant), with a lepidoblastic texture, which allow the original stratification (f
0) to be identified (
Figure 3a,b). On the wall of the carbonates and at both ends of the bench, the underlying micaschists were identified by a dipping brecciated contact that forms a gentle syncline (
Figure 3a). Vertical closed fractures dip to the northeast in both the marble and the micaschist. Several undeveloped karstic cavities (
Figure 3b) are also located on the face of the bench.
3.1. GPR Data Acquisition and Processing
This study used a Pro-Ex model RAMAC/GPR system manufactured by MALÅ GeoScience (Malå, Sweden). The depth/resolution requirements and the soil conditions determine the choice of antenna frequency. On one side, the depth penetration is controlled by the centre frequency and the conductivity of the material. In low-loss materials, the approximate maximum penetration depth for frequencies of 200–250 MHz is approximately 8–20 m, whereas, when using 100 MHz antenna, it is about 25 m [
20,
21]. On the other side, resolution depends on the frequency of the antenna. Taking a velocity of 100 mm/ns, by using antennas of 250 and 100 MHz, the wavelength will be 0.4 m and 1 m,
will be 0.1 m and 0.25 m, and
m and
m, respectively, where r is the distance between the antenna and the target [
22]. In this work, a 250 MHz antenna is selected because it provides the best resolution with a penetration depth of 20 m that satisfies our survey requirements. The test was performed using the following operating parameters: nominal frequency of 250 MHz, time window between 189.8 ns (approximately 10 m) and 359.8 ns (approximately 18 m), distance interval of 0.05 m, sampling frequency of 2.54 GHz, number of stacks of two, and the velocity of 100 mm/ns was estimated during the data processing. Specifically, the velocity was estimated using the popular method of hyperbola fitting [
22], which is included in ReflexW software [
23], when the data obtained were analysed.
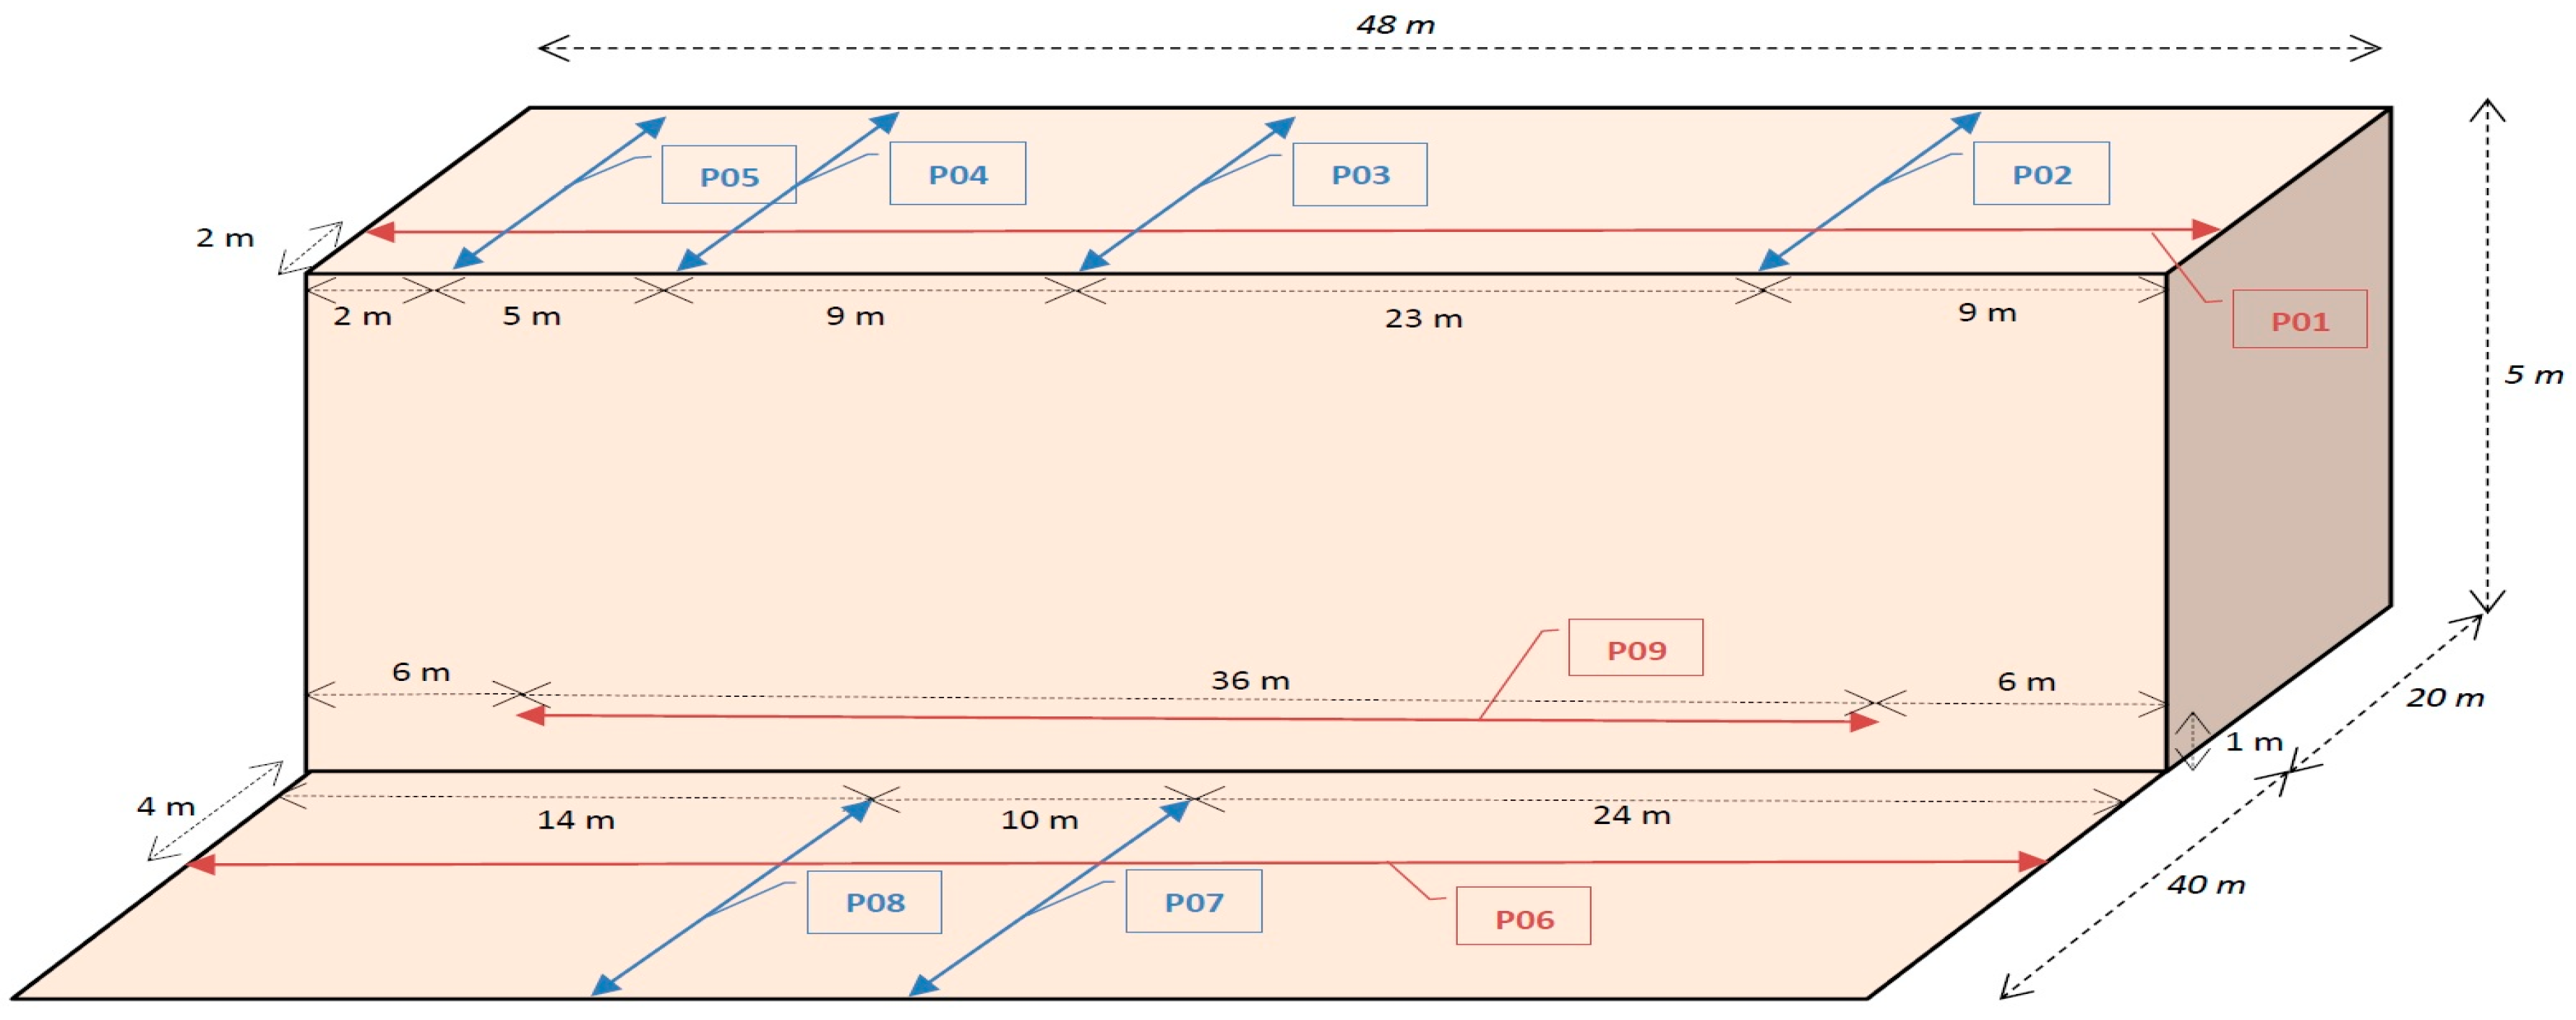
Several profiles were measured in the quarry, which are parallel and perpendicular to the main bench of stone exploited (
Figure 4 and
Figure 5). The first profiles were obtained at the top of the quarry (
Figure 4a,b and
Figure 5) in the longitudinal direction (profile P01; 48 m long) and transversal directions (profiles P02–P05; 20 m long). Three profiles (P06–P08) were obtained in the lower part of the quarry in two directions (40 m long for P07 and P08 and 48 m long for P06). The last profile (P09) was obtained directly at the face of the quarry (36 m long due to difficulties in measuring the entire face).
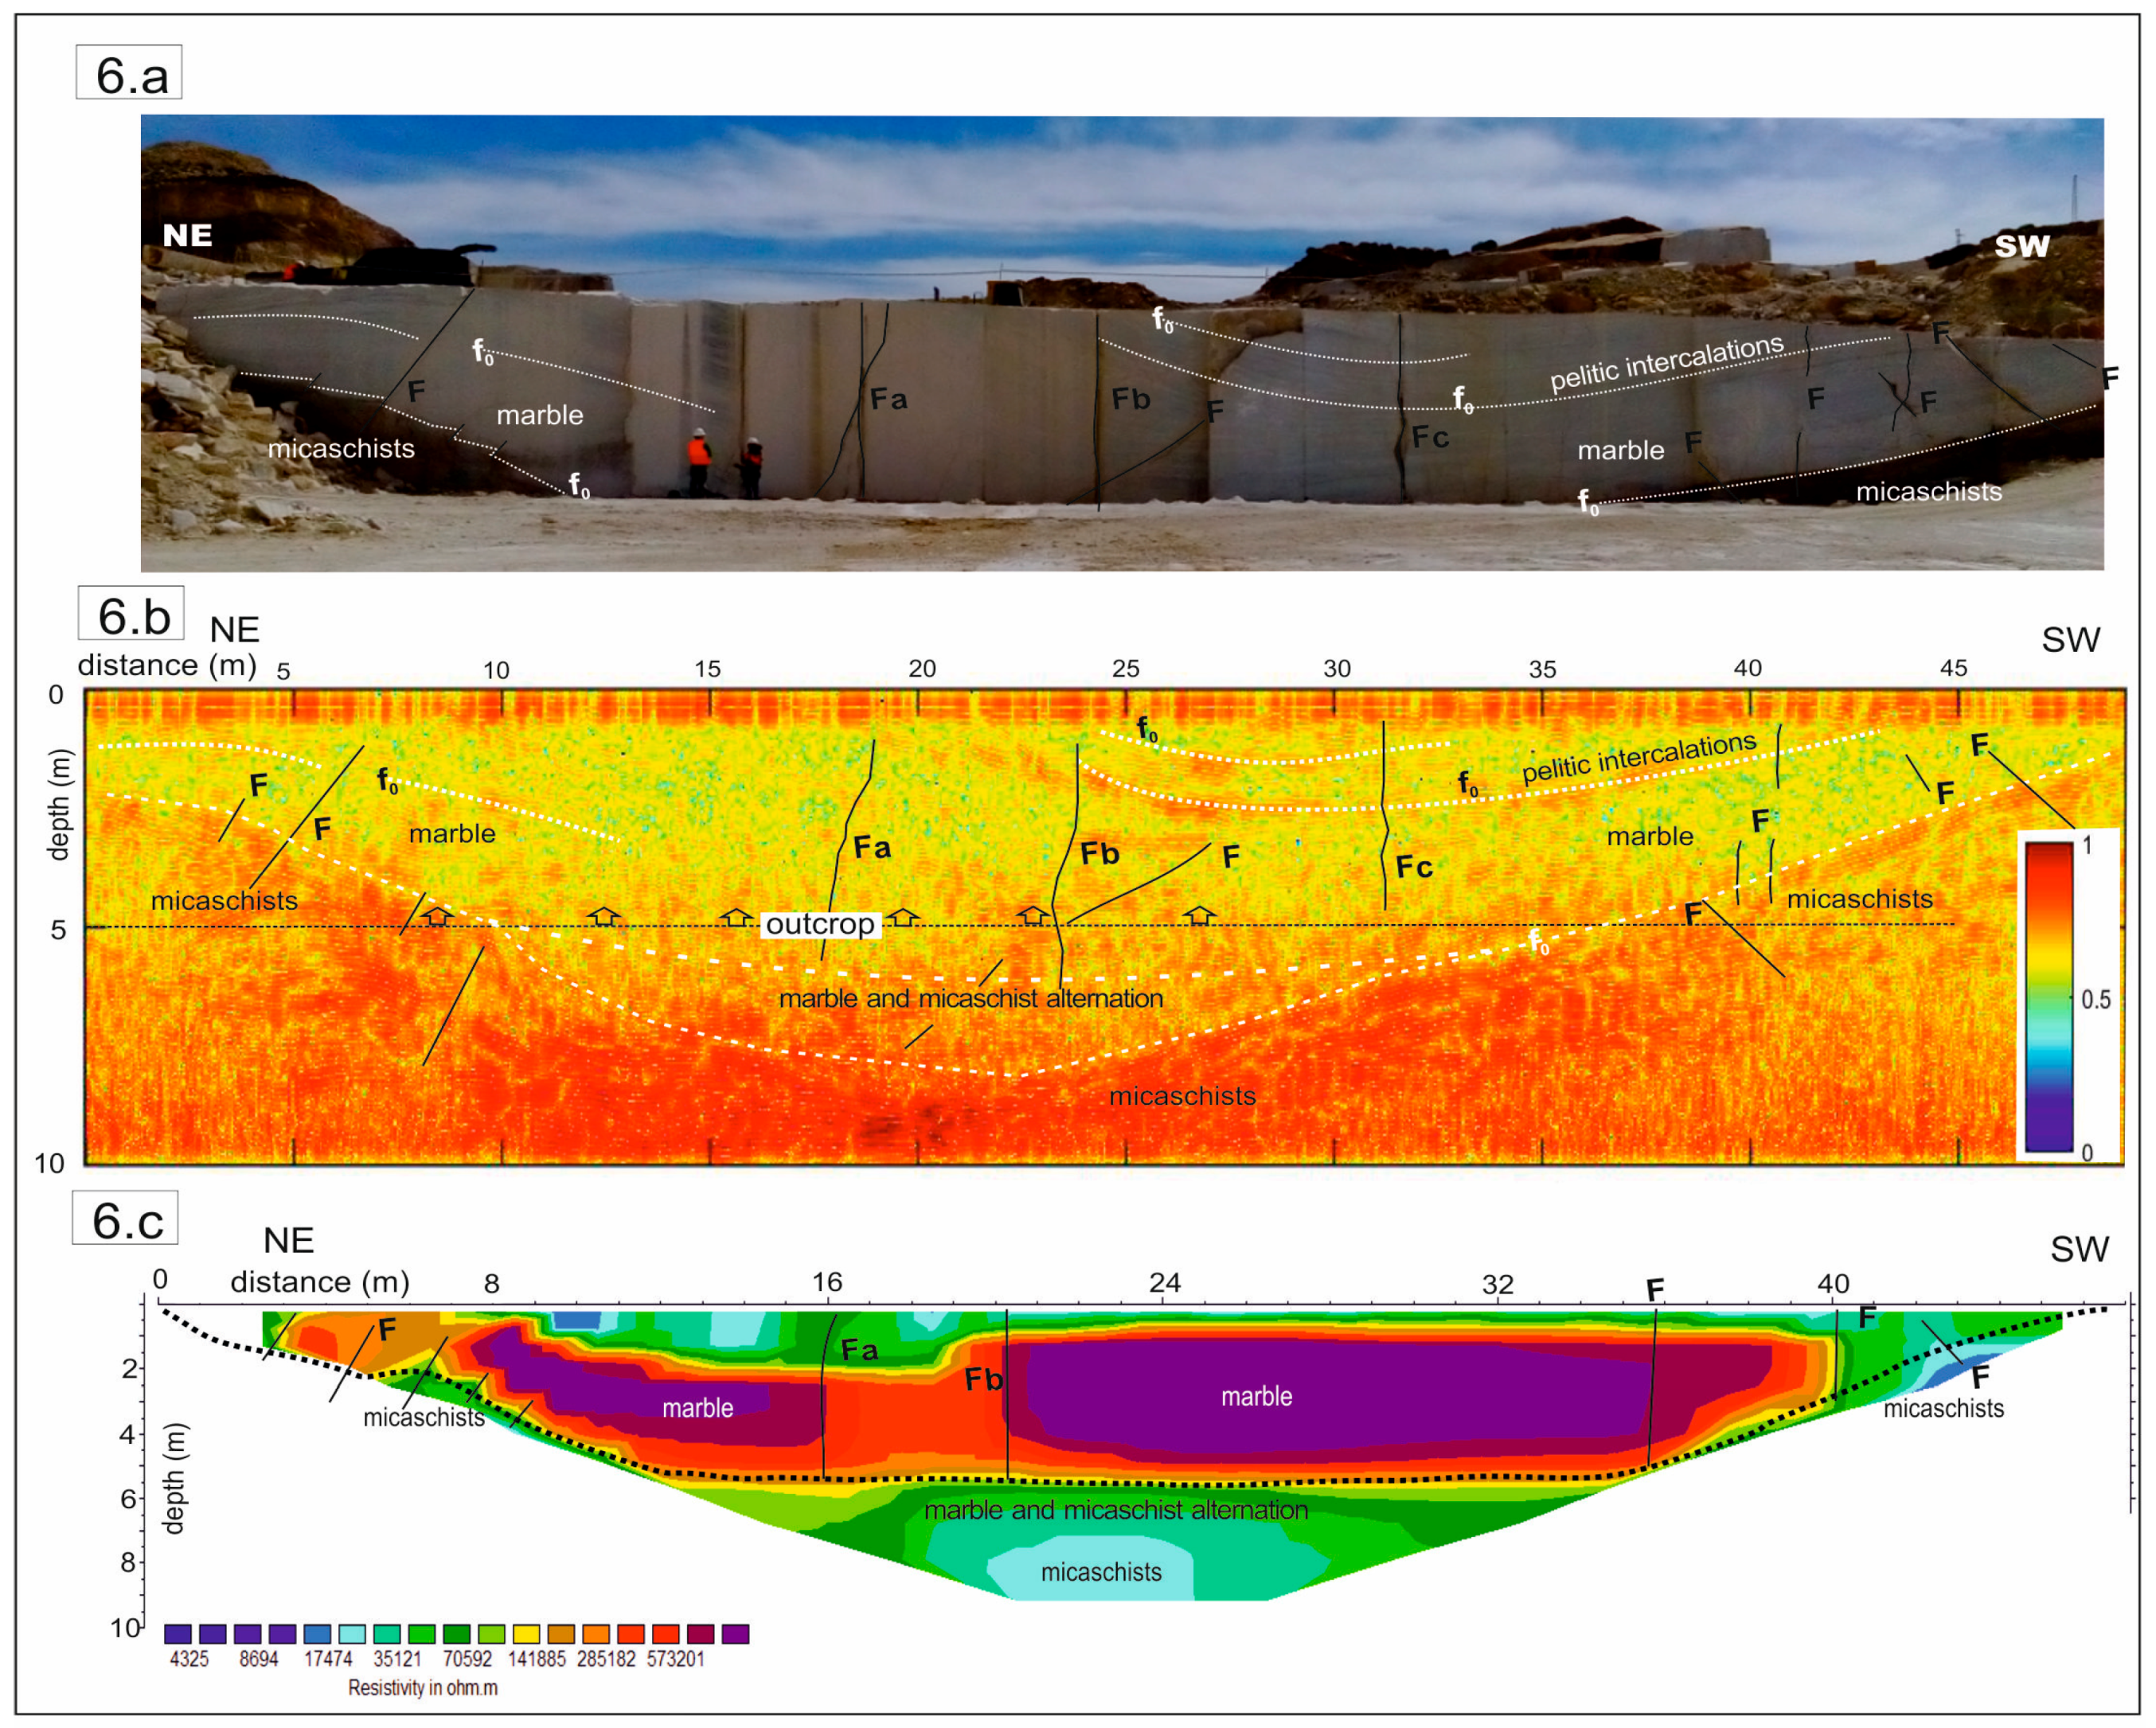
Figure 6a shows details of the structure of the quarry. The marble can be differentiated from the micaschist in both the first face of the quarry (approximately 5 m high) and in the second face (3 m deep). The measurements from profile P09 were collected at the first face of the quarry (P09), where two people are shown in the figure.
A set of standard pre-processing techniques [
24], using software developed with Matlab, was applied to the radargrams. First of all, DC removal subtracts the mean from the centre value of a window of 40 ns and 75 ns (smallest and largest profile, respectively). Secondly, amplitude correction is applied using trace equalization, where every trace is normalized according to the maximum absolute value of the amplitudes in a window of 160 ns and 300 ns (smallest and largest profile, respectively). Then, band-pass filtering, with 125 MHz and 325 MHz as the lower and upper cut-off frequency points, removes the unwanted frequencies. Finally, automatic trace subtraction, as the noise background removal method [
25], removes the mean of several traces within a window of 22 ns. As a result, the effects of clutter (energy that is unrelated to the real target) are reduced [
26] and the signal-to-noise (SNR) ratio is enhanced.
3.2. ERI Data Acquisition and Processing
ERI can be used to determine the distribution of a characteristic physical parameter in the subsurface based on a very large number of measurements collected at the ground surface. We measured the electrical resistivity of certain materials, which is the resistance that is encountered by an electric current when passing through a material [
27,
28]. The variations in the geoelectric behaviour allow 2D profiles to be constructed, which makes ERI one of the most effective non-destructive tools for studying and characterizing discontinuities in the subsurface [
28,
29].
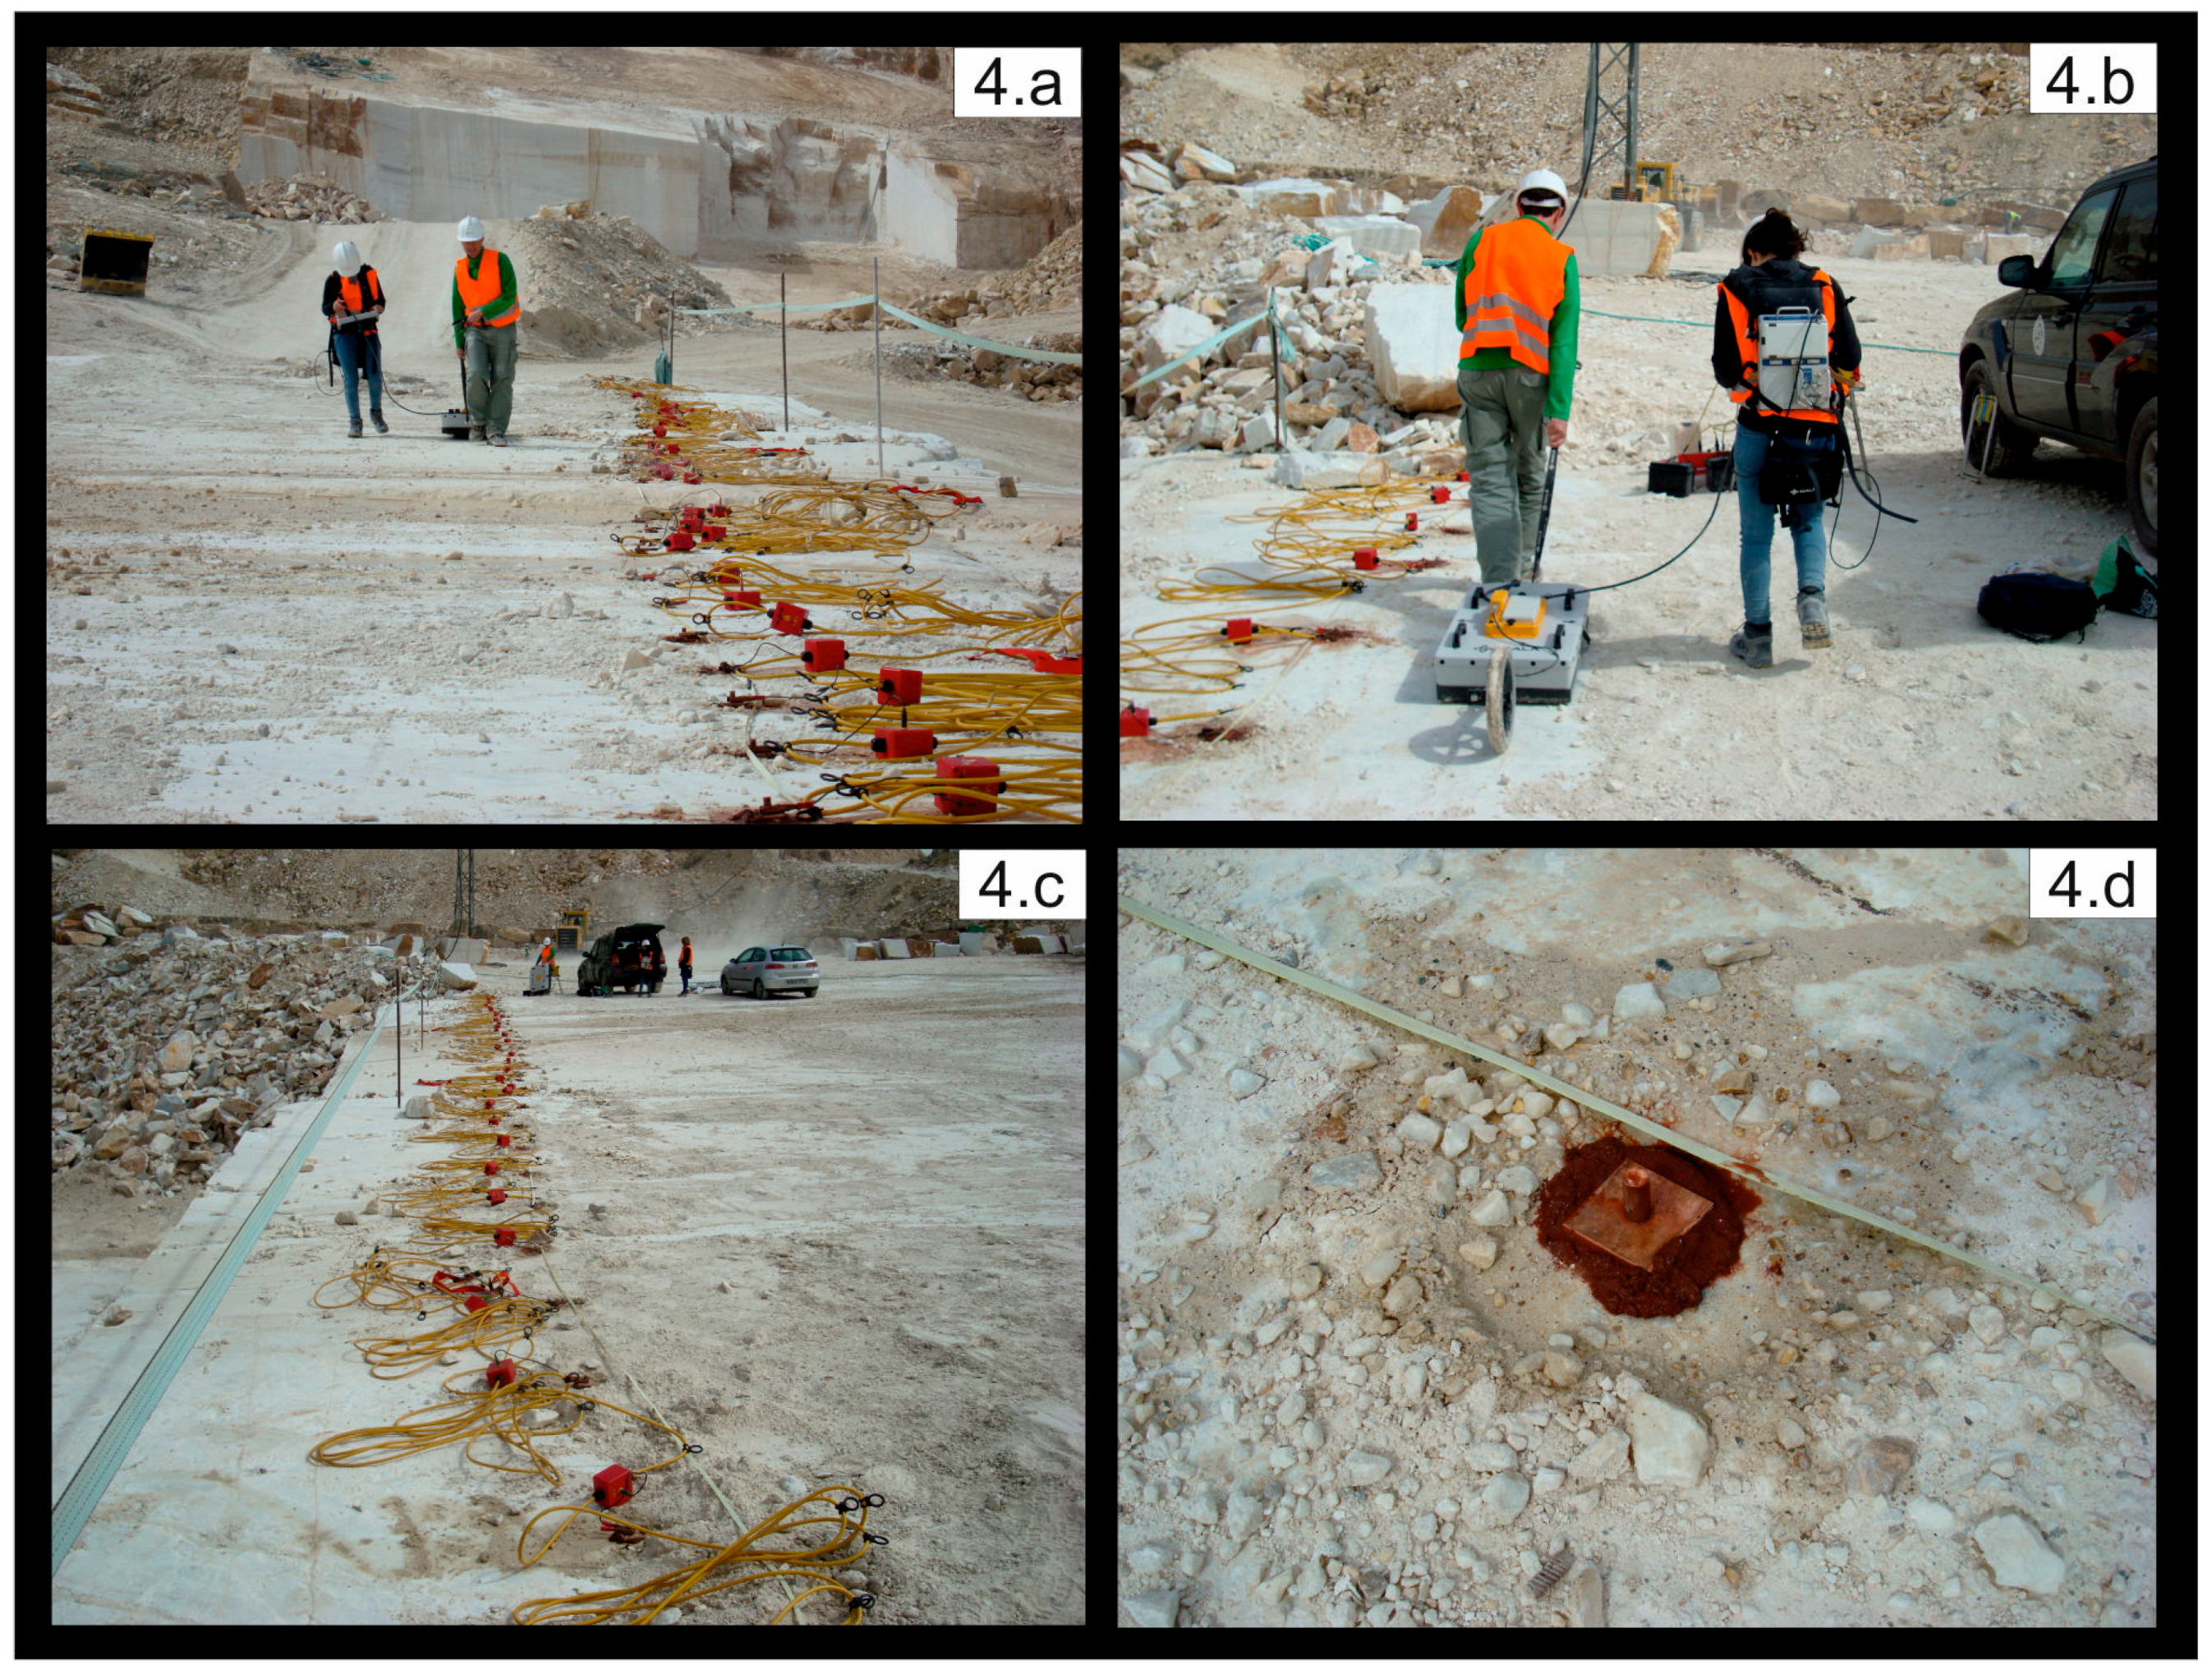
The ERI method involves implanting numerous electrodes along profiles (
Figure 4c). The electrode spacing is dependent on the required resolution, depth, and objectives; the shorter the distance between the electrodes, the greater the resolution, whereas the greater the distance between the electrodes, the greater the depth at which readings can be taken [
29]. In this study, we performed one electrical resistivity imaging profile using a Wenner-Schlumberger array. This array remains stable and behaves well in response to variations in both the vertical and horizontal resistivities, which makes it useful when investigating horizontal layers that may contain lateral facies changes and/or vertical structures [
30]. We used the RESECS electrical tomography equipment made by Deutsche Montan Technologie (DMT). The electrodes were connected to measurement equipment, and we used a specific sequential programme for each objective, which defines the electrodes that should be used at any given moment and their layout. We measured the apparent resistivity at each electrode position, which was then attributed to a particular geometric point in the subsurface. We avoided drilling holes in the marble bench to insert the electrodes. Copper electrodes were composed of a 5 × 5 cm plate and a 2 cm rod where the electrical connection was made and were used for the measurements (
Figure 4d). After cleaning the surface of the bench, the electrodes were placed on a base of wet clay with brine to obtain better current transmission to the ground. Because the marble behaves like a large resistor, it was necessary to use the maximum current that the instrument could deliver (up to 800 V peak-to-peak).
The profile on the bench parallel to the front was 48 m long and used an electrode spacing of 1 m (
Figure 4a–c,
Figure 5 and
Figure 6a). This electrode spacing provides sufficient penetration without losing information about the structure of the rock. A total of 463 measurements were taken, which reached a depth of 9.5 m.
The electrical tomography profiles were interpreted based on the apparent resistivity values that were obtained during the fieldwork, which were processed using the RES2DINV software for the resistivity and induced polarization [
31]. This programme is based on the least squares method with smoothing constraints modified by the Quasi-Newton optimization method. The inversion method constructs a model of the subsurface using rectangular prisms and calculates the resistivity values for each while minimizing the differences between the observed and calculated apparent resistivities [
32,
33]. The apparent resistivity data were refined before the modelling to remove the extrema (bad data points); 61 points were removed. Because of the wide variation in the measured resistivity values and the abrupt variations between neighbouring points, robust inversion and the combined Marquardt and Occam inversion method were used, which appear to provide better results in resolving compact structures.
4. Results and Discussion
Figure 6b shows the radargram for profile P01. The effectiveness of the GPR technique is demonstrated by the correlation of the geological data (observed in the field measurements in
Figure 6a) with the GPR results. Two units are identified: an upper unit that corresponds to the marble (beginning at a depth of 2 m, deepening to approximately 5 m in the middle of the profile, and rising again at the end of the quarry face) and a lower unit that is related to the micaschists. The lower unit is composed of a marble and micaschist alternation (upper part) and micaschist. This smooth variation can be observed in
Figure 6b,c.
The presence of mica-rich layers (lepidoblastic texture) in marbles is shown in the radargrams. Detection of these layers is relevant from two points of view: firstly, they can identify anisotropy layers and therefore can offer information related to their weakness and breaking of the rock. On the other hand, the presence of this banding in ornamental rock can lower its market value.
The radargram demonstrates the suitability of GPR for detecting discontinuities, including stratification (f
0 in
Figure 6a,b), fractures, and cavities, such as at horizontal distances from 10 to 25 m and a depth of 3 m. This information is relevant for cutting blocks by adjusting their size based on the encountered fractures.
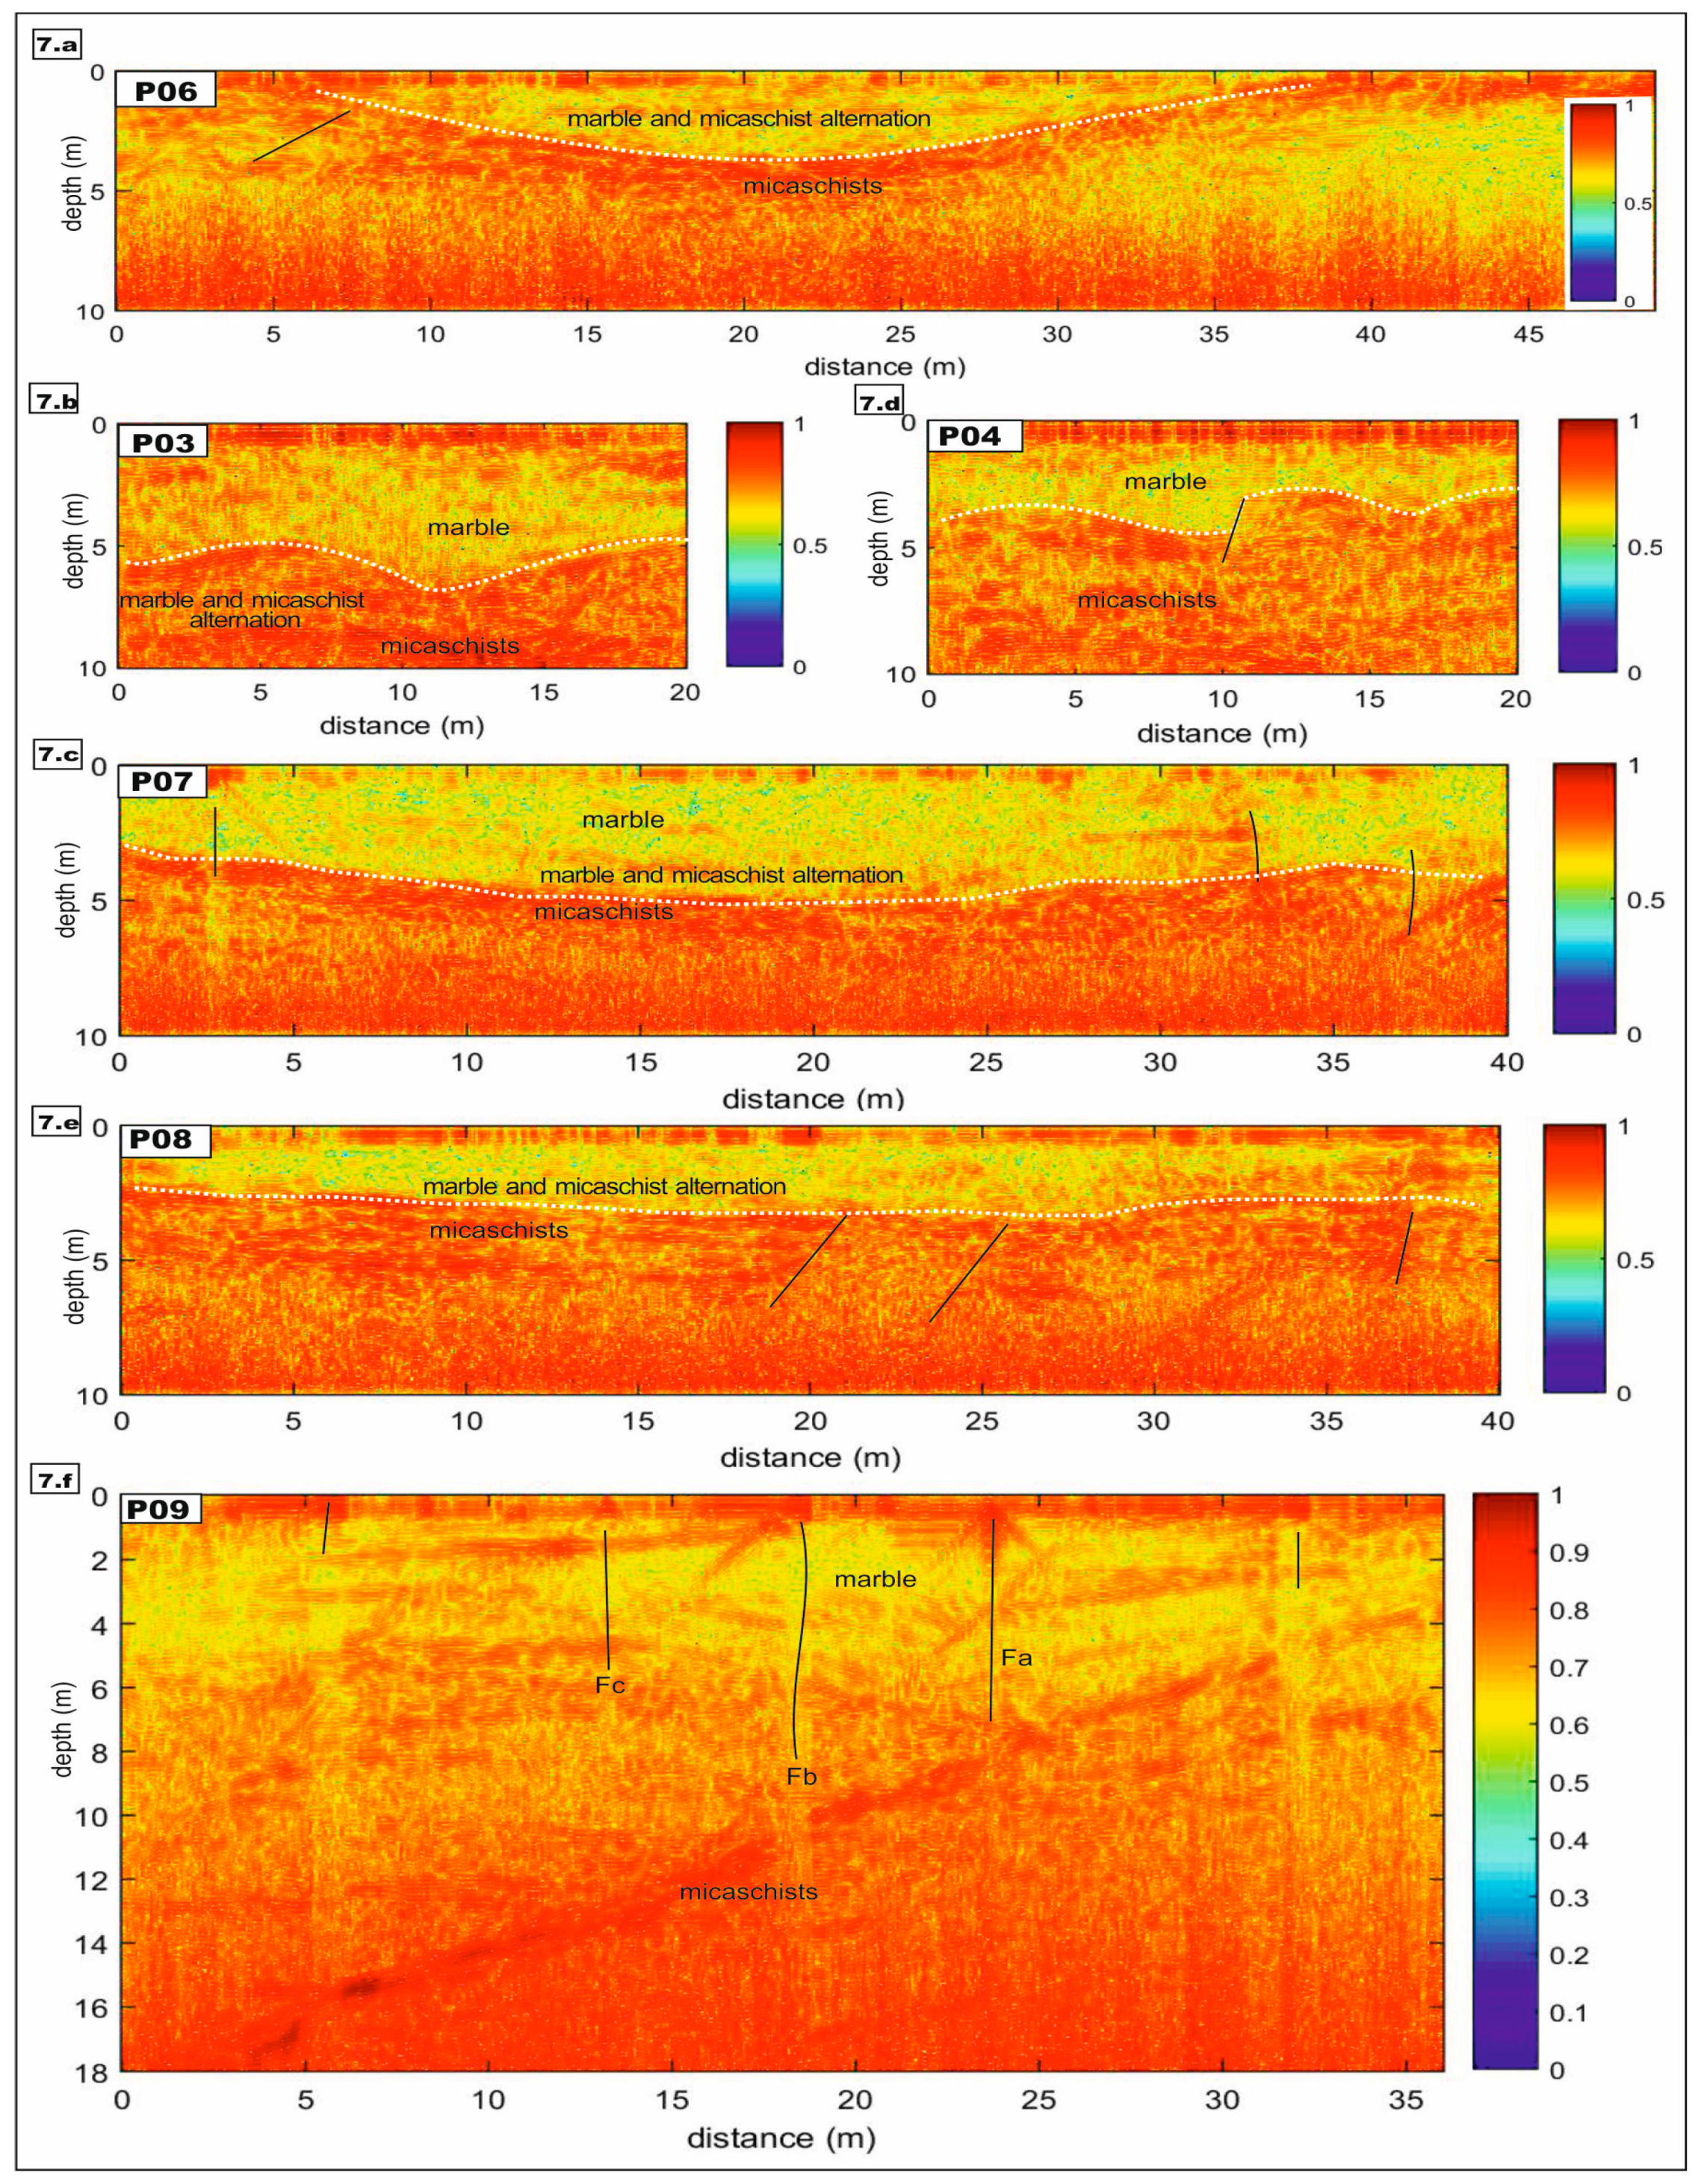
Figure 7 shows other radargrams.
Figure 7a shows profile P06, which contains a noisy area from 5 m to the end of the profile.
Figure 7b,c show profiles P03 and P07, respectively, and
Figure 7d,e show profiles P04 and P08, respectively. The upper profiles show that the micaschist is at depths of 6–8 m, whereas the lower profiles show depths of 2–4 m. These results demonstrate that the resulting information is consistent. Furthermore, the radargrams from the lower part of the quarry (
Figure 7a,c,e) show areas with higher energy than the other profiles, so the upper part of the quarry can be expected to have better quality rock. Several fractures can also be identified in these radargrams. Finally,
Figure 7f shows profile P09. The first part of the radargram (0–6 m) is interpreted to have higher quality rock, and several fractures are located at distances of 18 m, 25 m, and 32 m along the profile. We cannot identify the micaschists because the profile was measured in the middle part of the face (from 6 m to 42 m;
Figure 5 and
Figure 6a).
Besides, GPR can be considered as a promising tool to distinguish the type of fracture because, in addition to detecting fractures, it can provide information on their spatial orientation. As previously mentioned,
Figure 7f shows this utility in which three hyperbolas correspond to Fa, Fb, and Fc vertical fractures. However, pelitic intercalations identified, which can be seen as quasi-horizontal fractures, provide different GPR responses (horizontal pattern in the radargram). Then, GPR could be used as a fracture classification technique.
The ERI profile reaches a depth of 9.5 m (
Figure 6c), as expected with the array configuration used: the Wenner-Schlumberger array in which the penetration depth usually results in a 1/5 of the total length [
34]. Therefore, longer profiles could provide a greater penetration depth in these materials, being crucial in the preliminary stage of the research in order to identify the presence of layers to be exploited.
Figure 6c shows a profile where three zones can be distinguished from the electrical responses. An upper zone with low resistivities runs along the bench between 9 and 15 m from the origin of the profile and reaches up to 2 m deep, which we interpret as a marble decompression zone. An intermediate zone with very high resistivities that correspond to the marbles that are the target for extraction is identified below the upper zone; it reaches a depth of 5 m in the central part of the profile. Finally, a lower zone with lower resistivities is well defined due to the contacts at the bottom and laterally with the underlying micaschists (
Figure 6a,c).
Although the marble in the intermediate zone is fairly homogeneous along the bench, several discontinuities can be identified. Low resistivity zones are observed within the marble from the origin to 7 m, between 16 and 21 m, and from 40 to 47 m, which are associated with the most highly fractured zones. We consider these areas to be zones of weakness with a high risk of breakage during cutting and removal of the blocks. Accordingly, the areas on the bench between 7 and 16 m and between 21 and 40 m appear to be intact and would allow for further optimization of cutting and removing the blocks from the extraction bench.
By means of ERI, the boundaries between the two units of the rock (marble and micaschists) are clearly identified. In addition, the increase of the profile length could allow a greater penetration depth. However, textural changes could not be detected in the marble, only more or less altered areas. Therefore, ERI is a suitable tool that can be used as a preliminary stage of the research, which requires an overall view of the deposit. In a second stage of the research, GPR could offer more detailed information on the anisotropies of the rock to be exploited.
5. Conclusions
This study showed that GPR and ERI provide additional information for determining the quality of ornamental rocks “in situ” in quarries in terms of their lithology and the presence of fractures and contacts. The techniques provide consistent results.
ERI provides more general and basic information about the lithological unit, so it should be applied in the first stages of the quarry research. In this example, the electrical responses allowed us to identify three levels in the extraction bench and to identify the areas within the marble with the most fractures. Thus, this technique can be used at a preliminary stage for the estimation of the reserves of the deposit. However, it does not provide information on the texture or fabric of the rock, so it does not give us much information on the quality of the rock to be extracted (commercial value or market price). A large number of small fractures, but capable of breaking a block at the time of extraction, can be completely undetected using this method. Therefore, the methodology does not offer much potential for planning the exploitation in order to increase yields.
GPR was used to obtain images of the quarry, in which the marble units can be clearly identified. Unlike ERI, the results demonstrated the usefulness of this technique for evaluating the quality of the marble (it allows one to define the stratification and even the fabric and the texture of the rock) and the structural anomalies (fractures, holes, …). Thus, GPR can be used as a tool to characterize the unit to mine in much more detail, as well its commercial value.
In ornamental rock mining, where operations are systematic and repetitive and the mechanical work is optimized using a standardized cutting routine, it is necessary to have a good knowledge of the extraction bench to schedule the cutting sequences. Thus, zones could be delineated that allow commercial-size blocks to be cut with techniques such as diamond wire cutting or the use of ranging arm shearers. In addition, zones with fractures that will generate small blocks and/or rejects can be identified so they can be removed by light blasting with mining powder, which is much more economical. The greater complexity of the different extraction plans for each area of the quarry would be offset by the improved yields.
Therefore, the combined use of tools such as GPR and ERI can help in the a priori identification of fractures and planes of weakness in ornamental rock mines, which will lead to efficient mine planning.


