Editorial

Earth Observations for Geohazards: Present and Future Challenges

1
Departamento de Ingeniería Civil, Escuela Politécnica Superior, Universidad de Alicante, P.O. Box 99, E-03080 Alicante, Spain
2
COMET, School of Civil Engineering and Geosciences, Newcastle University, Newcastle upon Tyne NE1 7RU, UK
*
Author to whom correspondence should be addressed.
Submission received: 22 February 2017 / Revised: 22 February 2017 / Accepted: 22 February 2017 / Published: 24 February 2017
(This article belongs to the Special Issue Earth Observations for Geohazards)

Abstract

:
Earth Observations (EO) encompasses different types of sensors (e.g., Synthetic Aperture Radar, Laser Imaging Detection and Ranging, Optical and multispectral) and platforms (e.g., satellites, aircraft, and Unmanned Aerial Vehicles) and enables us to monitor and model geohazards over regions at different scales in which ground observations may not be possible due to physical and/or political constraints. EO can provide high spatial, temporal and spectral resolution, stereo-mapping and all-weather-imaging capabilities, but not by a single satellite at a time. Improved satellite and sensor technologies, increased frequency of satellite measurements, and easier access and interpretation of EO data have all contributed to the increased demand for satellite EO data. EO, combined with complementary terrestrial observations and with physical models, have been widely used to monitor geohazards, revolutionizing our understanding of how the Earth system works. This Special Issue presents a collection of scientific contributions focusing on innovative EO methods and applications for monitoring and modeling geohazards, consisting of four Sections: (1) earthquake hazards; (2) landslide hazards; (3) land subsidence hazards; and (4) new EO techniques and services.

Graphical Abstract

1. Introduction

Geohazards are often defined as the events related to the geological state and processes that pose potential risks to people, properties and/or the environment, which can be classified within two main categories: natural hazards (such as earthquakes, landslides, volcanic eruptions, tsunamis, and floods) and human-induced hazards (such as land subsidence due to groundwater-extraction, water contamination, and atmosphere pollution). Geohazards could cause enormous human and economic losses and disruption, which continue to grow worldwide. In the past decades, the annual cost of natural hazards has increased dramatically [1]. Earthquakes represent one of the most devastating geohazards in terms of human suffering and economic damage, but the major cause of casualties, infrastructural damage, and economic losses, is the secondary hazard of landslides [2]. Volcanic eruptions also represent a significant proportion of geohazards [2], and major eruptions can modulate regional or global atmospheric composition and climate in detrimental ways. Land subsidence due to anthropogenic processes, such as extraction of groundwater, gas, oil, and coal, is another worldwide geohazard that affects wide areas, causing infrastructure damage and increasing flood risk [3,4]. Better decisions require better knowledge to characterize, monitor and model geohazards and then mitigate their impacts on people and the environment. During the past decades, Earth Observation (EO) has been widely applied to disaster risk management (including disaster preparation, response, recovery and mitigation), especially disaster response [5], since it provides extremely useful information for researchers, decision makers and plan makers.
EO is the gathering of information about the Earth using remote sensing technologies, which are often supported by ground surveying techniques. EO has considerably changed our ways of seeing the world, providing a framework to precisely map and monitor large-scale phenomena in a timely way. EO from space and aircraft, combined with complementary terrestrial observations and physical models, have been used to monitor geohazards. An important aspect of space-based (and airborne) EO is that we can investigate areas in which ground observations are not possible due to physical or political constraints. EO techniques can be classified according to sensor types, e.g., passive or active, optical, radar (radio detection and ranging), LiDAR (Laser Imaging Detection and Ranging), or multispectral/hyperspectral. They can be also classified according to the platforms in which the sensors are installed: satellite-based, aircraft-based, Unmanned Aerial Vehicle (UAV) based and ground-based.
This Special Issue contains a collection of articles focusing on the use of EO techniques for the investigation of geo-hazards. We received a total of 79 manuscripts for consideration of publication, which were carefully reviewed by external and independent experts in their respective fields. Forty-three of these manuscripts were accepted for publication. These studies utilize the state-of-the-art EO techniques to map, characterize, monitor and model a range of geohazards, including earthquakes, landslides, land subsidence, and tsunamis. The following sections include a study of present and future trends and challenges on the use of EO and an overview of the 43 contributions in this Special Issue.

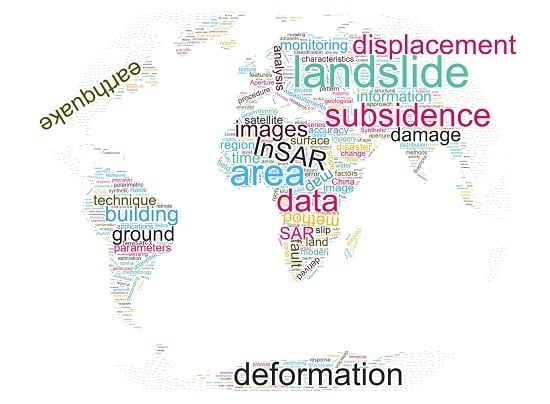
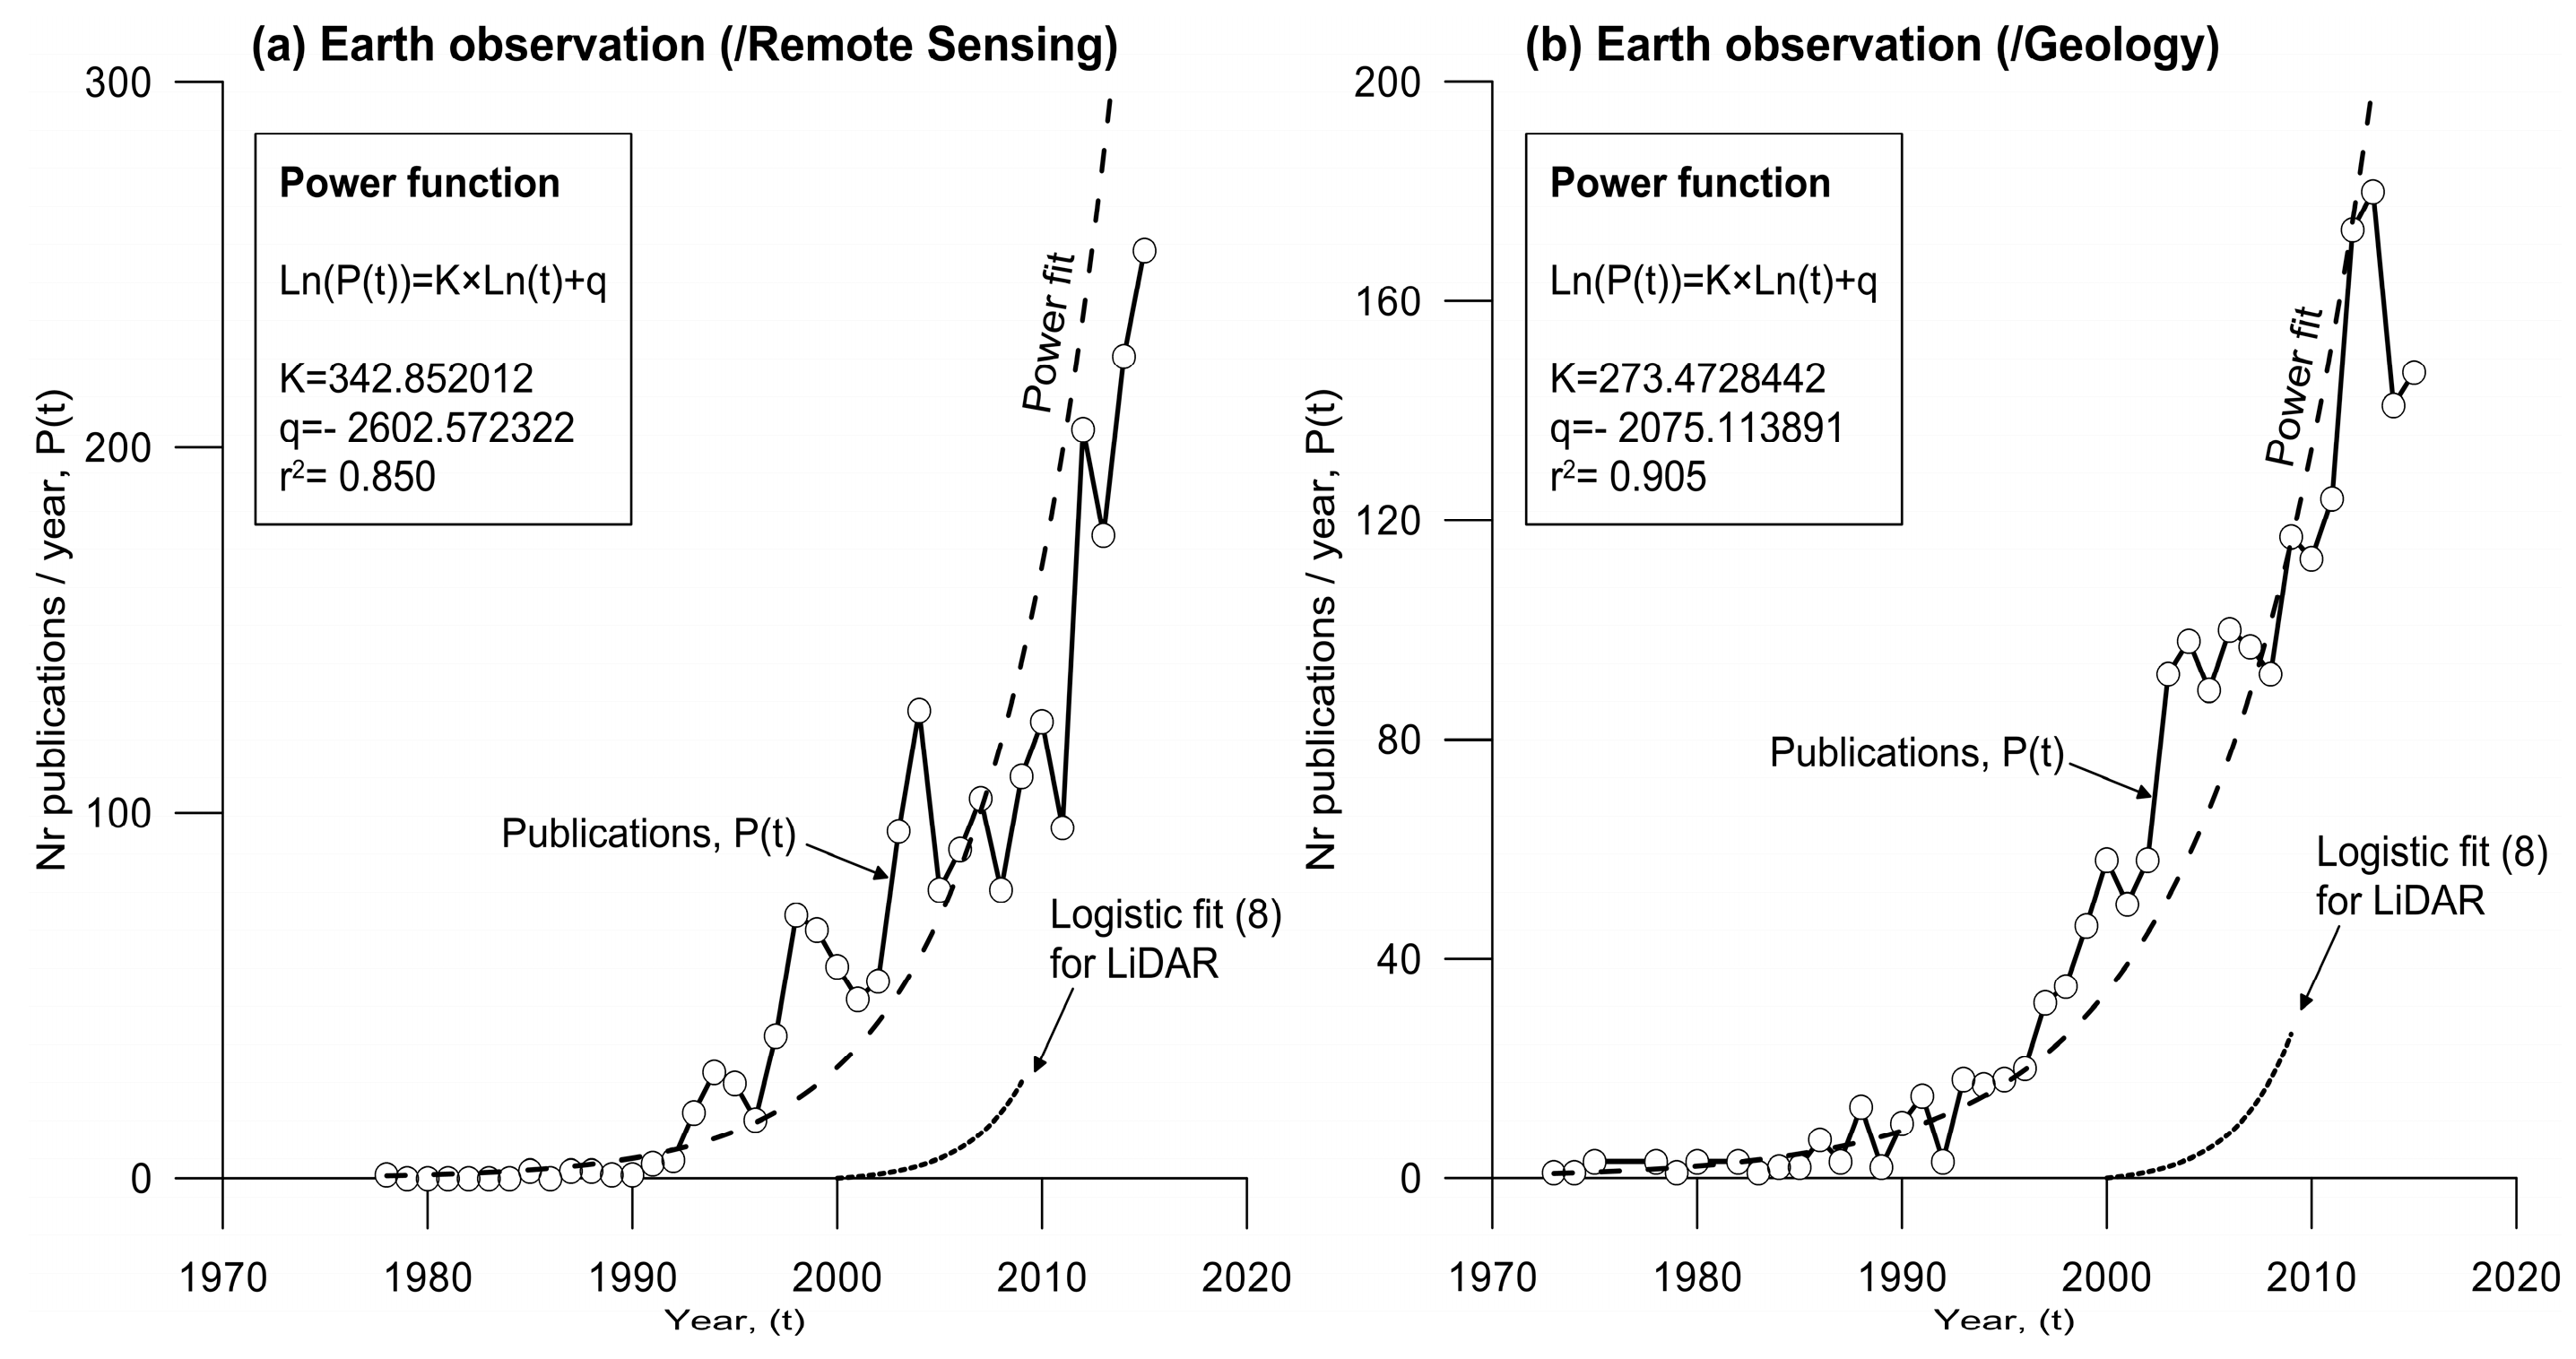
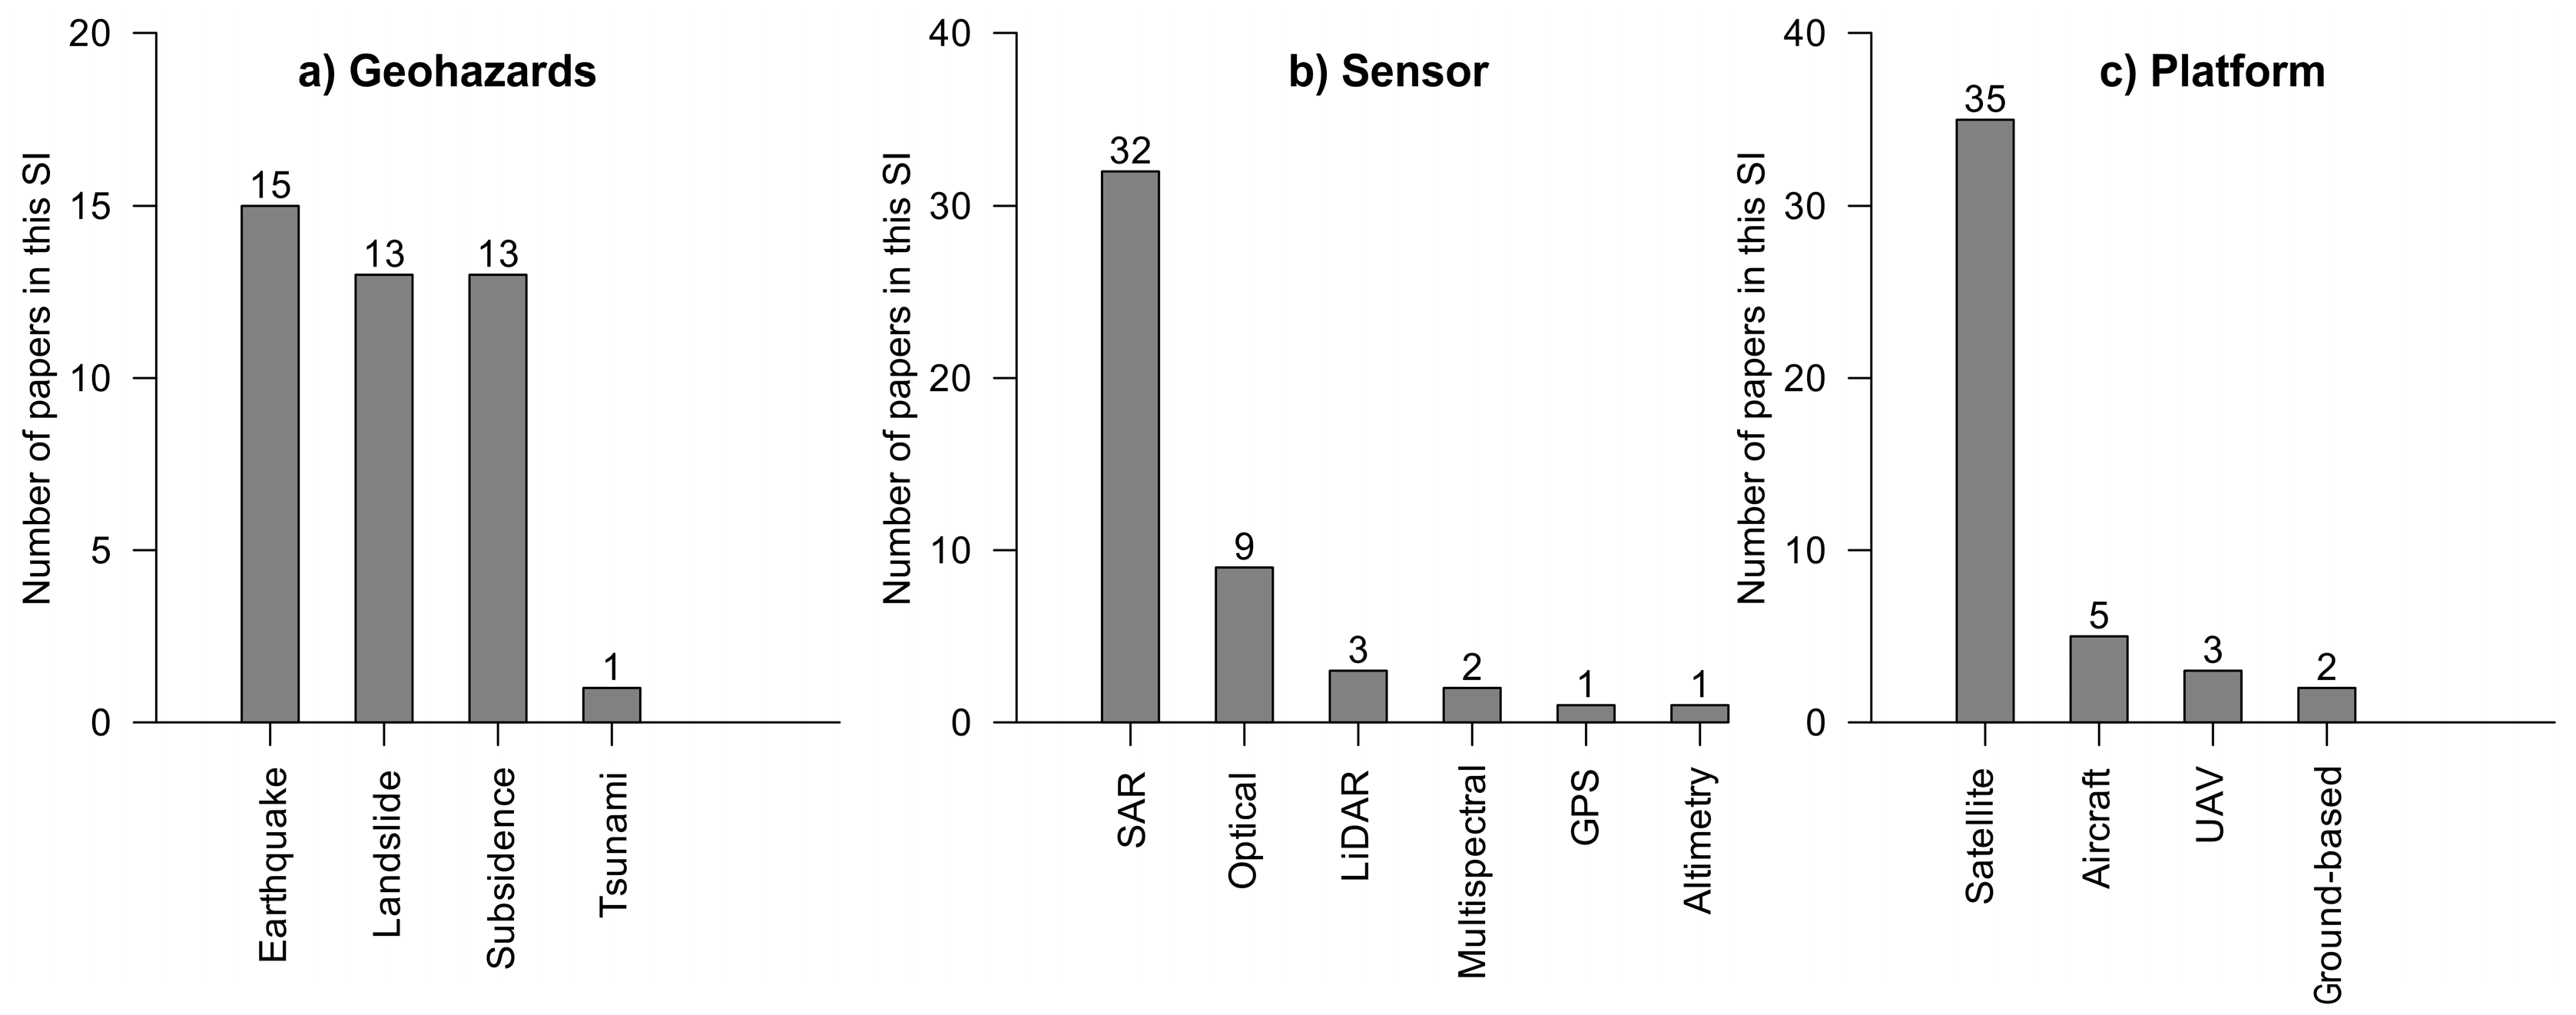
2. Use of EO for Geohazards throughout Bibliometric Data

Although EO techniques were firstly used for military and security applications in the Cold War [6], they have become available for a wide range of applications and users during the past few decades. In this section, we illustrate the increasing use of EO techniques throughout a bibliometric study on the occurrence of the term “Earth Observation” in the Web of Science’s bibliographical database similar to previous studies (e.g., [7]). Our searches are restricted to the “Remote sensing” and “Geology” segments. Figure 1 shows the increasing number of yearly publications about the above-mentioned terms. It is clear in Figure 1 that the number of EO publications has started to increase since the 1990s with an apparent exponential-like trend, indicating that EO literature has been growing considerably. Although EO techniques were born last century, it is still a topical issue probably due to its inherent high technological components and wide range of potential applications.

3. Overview of Contributions

As mentioned earlier, forty-three papers were published in this Special Issue. These studies cover a range of geohazards including earthquakes, landslides, land subsidence, and tsunamis (Figure 2a). Figure 2b shows all the different types of EO sensors used in the published papers such as Synthetic Aperture Radar (SAR), LiDAR, optical, multispectral, GPS and Altimetry, and Figure 2c shows all the different platforms such as satellites, aircraft, Unmanned Aerial Vehicles (UAV) and ground-based platforms. It is clear in Figure 2 that satellite SAR has been widely employed to investigate geohazards due to its all-weather imaging capabilities. It should also be noted that these 43 studies cover different EO usages including geohazard mapping, monitoring and modelling. An overview of all the contributions are presented in the following sections.

3.1. Earthquake Hazards

Earthquakes represent an increasing risk of human loss and severe economic damage as vulnerable populations grow in areas of seismic hazard. Observations of the seismic cycle not only give insight into the mechanics of a fault, but also play key roles in estimating the likelihood of future earthquakes. Interseismic motions build up stress and lead to earthquakes. Zhu et al. [9] employ two tracks of ENVISAT ASAR images to determine the deformation rate maps of the Altyn Tagh Fault (ATF), and then calculate the regional strain rate field using a multi-scale wavelet method. Their results suggest a left-lateral slip rate of 8.0 ± 0.7   mm / year and a locking depth of 14.5 ± 3   km , which is in agreement with previous GPS and ERS InSAR results.
Postseismic transient deformation is a process that contributes to regional stress evolution, modifying the background tectonic plate motions. Liu et al. [10] present a method to model postseismic deformation time series with the combination model of afterslip and viscoelastic relaxation, and then simultaneously estimate the time-dependent afterslip distribution and the viscosity beneath the earthquake zone. It is reported that (i) the preferred time-dependent afterslip of the 2009 Mw 6.3 Dachaidan, China earthquake mainly occurs in the upper 9.1 km, and increases with time; and (ii) the preferred lower bound of the viscosity beneath the Qaidam Basin’s northern side is 1 × 10 19   Pa · s , close to that beneath its southern side but different from those in other parts of the Tibetan Plateau, indicating that the viscosity structure beneath the Tibetan Plateau may vary laterally.
The deformation occurring during an earthquake is referred to as coseismic. Observations of coseismic deformation are often used to determine earthquake source parameters, slip distributions, and even the rupture histories. Xu et al. [11] generate continent-wide two-dimensional (2D) (east–west and vertical) coseismic displacement maps for the 2015 Mw 8.3 Illapel, Chile earthquake using Sentinel-1A TOPS imagery, suggesting that the east–west component (up to 2 m) dominates the 2D surface displacement. Using similar Sentinel-1A data, Solaro et al. [12] also produce coseismic displacement maps for the 2015 Mw 8.3 Illapel, Chile earthquake. Their joint Okada inversion with multiple Sentinel-1A interferograms suggests that most of the slip occurs northwest of the epicenter with a maximum located in the shallowest 20 km; their Finite Element Model indicates that (i) its estimated maximum slip is comparable to the Okada model; and (ii) the von Mises stress distribution agrees with the depth distribution of the aftershock hypocenters. InSAR observations are utilised to investigate the 2003–2004 Bange, China earthquake sequence, involving a series of normal faulting events with Mw > 5.0, indicating that InSAR can provide reliable source parameters of shallow, moderate-sized earthquakes in areas that lack dense seismic networks [13]. Li et al. [14] use Sentinel-1A interferograms to model the 2016 Mw 5.9 Menyuan, China earthquake; they find that the 2016 event has a different focal mechanism from a previous Ms 6.5 earthquake although both are at the two ends of a secondary fault, which is believed to reflect the left-lateral strike-slip characteristics of the Lenglongling fault zone. Multi-platform InSAR observations are employed to determine the coseismic and postseismic slip distributions of the 2011 Mw 7.1 Van, Turkey earthquake, indicating that the upper 7–9 km of the fault, unruptured during the coseismic phase, underwent afterslip in the postseismic phase that may have reduced the seismic potential in its whole length from NW to SE [15].

3.2. Landslide Hazards

Landslides can be triggered by many different mechanisms, such as sudden large earthquakes, constant seismic activity in a tectonically active area, monsoonal rainfall or storms. There are a range of factors that affect landslide motion, including topography, geology, vegetation, precipitation and anthropogenic factors (building roads, deforestation or agricultural terraces). In total, 13 papers on landslides are published in this Special Issue. Mapping is the first topic covered by these papers. Landslide inventory maps document the extent of landslide phenomena in an area and contain relevant information that can be exploited in different ways [16]. Therefore, EO techniques can play an important role in landslide mapping. Al-Rawabdeh et al. [17] present an automated approach to use unmanned aerial vehicles (UAVs) and Semi-Global dense Matching techniques to identify and extract landslide scarps. Watanabe et al. [18] use airborne L-band fully polarimetric SAR to detect landsliding areas induced by Typhoon Wipha on 16 October 2013 on Izu Oshima Island (Japan). Plank et al. [19] propose a fast procedure for mapping landslides based on change detection between pre-event optical imagery and the polarimetric entropy derived from post-event very high resolution (VHR) polarimetric SAR data.
Monitoring landslides is a crucial task to understand the mechanisms, adopt preventive measures and reduce casualties and infrastructure damage [20]. This assignment has been revolutionized by EO techniques. Several contributions are focused on landslide monitoring, proposing and applying novel procedures, using different sensors and platforms and evaluating the quality of the results. Qu et al. [21] develop the hybrid-SAR procedure to combine both amplitude-based and phase-based methods to map and monitor large landslides exhibiting different deformation magnitudes, sliding modes and slope geometries. Using the Slumgullion landslide (southwestern Colorado, USA) as an example, Wang et al. [22] propose a fully polarimetric SAR offset tracking method to improve the precision of landslide movement monitoring. Taking the Shuping landslide (Three Gorges, China) as a case study, Sun and Muller [23] demonstrate the capability of sub-Pixel Offset Tracking techniques to monitor relatively fast slope movements in densely vegetated areas with and without the presence of artificial corner reflectors. Bardi et al. [24] integrate ground-based and satellite InSAR data to study the Åknes rockslide (western coast of Norway). Kropáček et al. [25] monitor the displacements of a large landslide on the western escarpment of the Main Ethiopian Rift (Debre Sina) by means of a multisensor and multitechnique approach. Fernández et al. [26] use Unmanned Aerial Vehicles imagery and high resolution photogrammetry to monitor horizontal and vertical displacements of a landslide affecting olive groves in La Guardia de Jaén (Spain). Finally, in Hsieh et al. [27], the errors of digital terrain models (DTMs) derived using different techniques are discussed.
Modelling is also a hot topic in the landslide field. The relationships between triggering factors and the landslide kinematics are a key aspect for the subsequent prediction of future episodes of activities. Jiang et al. [28] propose a sequential data assimilation method (i.e., Ensemble Kalman filter) to couple the surface displacements of the Shuping landslide (Three Gorges, China) derived from the Pixel Offset Tracking technique with hydrological factors. De Novellis et al. [29] develop three-dimensional (3D) Finite Element Models (FEM) of the Ivancich landslide located in Assisi town (Central Italy) through the integration of geological, geotechnical and satellite datasets.

3.3. Land Subsidence Hazards

Land subsidence is an increasing problem worldwide that has strongly attracted the attention of the InSAR community due to the high capability of InSAR techniques for the study of this type of phenomena. This is evidenced by the fact that all the contributions dedicated to this topic in this Special Issue use InSAR techniques for characterizing and monitoring land subsidence.
Beijing and Tianjin are regional economic drivers in Northern China. The aquifers systems in this region have been massively exploited and land subsidence has become evident. Three papers published in this Special Issue are focused on the spatio-temporal distribution pattern and the characterization of land subsidence as well as its triggering and conditioning factors. Zhang et al. [30] study land subsidence in the Beijing-Tianjin-Hebei region from 1992 to 2014 using ERS-1/2, ENVISAT ASAR and RADARSAT-2 images. Similarly, Liu et al. [31] present their results from C-band ENVISAT ASAR and L-band ALOS PALSAR imagery covering the period 2007–2009 , implying Line of Sight (LOS) displacements up to 170 mm/yr. Chen et al. [32] employ Small Baseline InSAR technique to process ENVISAT ASAR and TerraSAR-X stripmap images collected from 2003 to 2011 and observe a maximum subsidence in the eastern part of Beijing with a rate greater than 100 mm/year; they also find some relationships between land subsidence and different conditioning and triggering factors (e.g., groundwater levels, soft soil thickness and active faults). This contribution has attracted attention of a wide range of prestigious international media (e.g., The Guardian, The Telegraph, Huffington Post, Forbes and BBC), and is ranked in the top 5% of all research outputs ever tracked by Altmetric, a system that tracks the online attention for a specific piece of research (See: https://mdpi.altmetric.com/details/8441790#score). This contribution is also selected as TOP 10 published articles in 2016 by MDPI (http://blog.mdpi.com/2017/02/20/mdpi-altmetrics-top-10-published-articles-in-2016).
Many coastal areas in the world are experiencing land subsidence due to various factors. The combination of land lowering with rising water levels due to global sea-level rise can make coastal areas especially vulnerable to flooding [33]. Two papers in this Special Issue study land subsidence in coastal areas [34,35]. Cianflore et al. [34] analyze different causes contributing to land subsidence observed in the ancient Greek colony of the Sibari Plain (Southern Italy) using ENVISAT ASAR and Cosmo-SkyMED images. Xu et al. [35] focus on the land subsidence affecting the land reclaimed from the sea in Shenzhen (SE China). These authors use a Point Target based Small Baseline Subset InSAR approach to process ascending and descending ENVISAT ASAR images acquired during the period from 2007 to 2010, and observe subsidence rates up to 25 mm/year.
Yang et al. [36] perform correlation analyses between potential triggering and conditioning factors and land subsidence in the Linfen–Yuncheng basin (China) derived from ENVISAT ASAR data collected in 2009–2010. The authors conclude that the observed land subsidence occurs within the fault-controlled basin and is mainly caused by groundwater withdrawal. Similarly, Bai et al. [37] observe a maximum subsidence rate of up to −67.3 mm/year in Wuhan, China using TerraSAR-X images from 2009 to 2010, which are believed to be mainly caused by anthropogenic activities, natural compaction and karst dissolution. A seasonal pattern of displacements is also noticed near the Yangtze River by these authors. Caló et al. [38] use eight-year ENVISAT ASAR images to investigate land subsidence mainly due to groundwater overextraction in the Konya plain, Turkey, and a joint analysis with GRACE data suggests that the groundwater depletion is not limited to the study site but affects a wider region in the Anatolian Plateau.
Land subsidence information from InSAR observations can be exploited for different purposes. Pacheco-Martínez et al. [39] present a novel approach to combine InSAR and gravimetric surveys for risk management related to land subsidence and surface ground faulting generation. Boni et al. [40] describe a novel methodology for the exploitation of InSAR data to support geological interpretation in areas affected by land subsidence, uplift and seasonal displacements.
Mining-induced subsidence is another important anthropogenic geohazard. Ma et al. [41] study mining subsidence in Shendong Coalfield (China), suggesting that the extent of subsidence exhibits a progressive increase of 13.09 km2 per month during the period from 2012 to 2013.
Surface displacements associated with the geothermal field of Yangbajing (China) are studied and modelled by Hu et al. [42] using ENVISAT ASAR images collected from 2006 to 2010, allowing for the interpretation of the volume changes produced in the geothermal field.
Zhou et al. [43] focus on the combination of InSAR observation and numerical modelling to obtain the physical parameters of the Earth-dam displacements of the Shuibuya Dam (China), and these parameters are then used to predict future behaviors of the dam.

3.4. New EO Techniques and Services

Several papers in this Special Issue are focused on new EO techniques and services for geohazard management. Ding et al. [44] develop new methods to reduce stripe artifacts (SA) and Topographic Shadowing Artifacts (TSA) in surface displacement maps retrieved from Landsat 8 optical images. Their experiments indicate that their algorithms could improve the precision of surface displacement maps (near 15%).
Since parameters of satellite orbits of historical declassified intelligence satellite photography (DISP) imagery are not available and ground control points (GCPs) are lacking, Zhou et al. [45] develop a second order polynomial equation-based block adjustment model for orthorectification that provides accuracy in the level of 2.0 pixels (i.e., approximately 2.0–4.0 m) in the assembling of the imagery for geohazard mapping. Chen et al. [46] illustrate the potential of the BeiDou Navigation Satellite System (BDS) to serve as a fast and reliable early warning system of tsunamis. Cignetti et al. [47] propose an iterative procedure which is applied through the Parallel-SBAS web-tool within the Grid Processing-on-Demand (G-POD) environment to improve SAR data selection and processing by minimizing the temporal decorrelation effects over high mountain regions to obtain mean deformation velocity maps and displacement time series.
Following large geohazards, especially those associated with widespread destruction and high mortality, rapid, accurate and reliable damage assessment is essential to obtain information to guide response activities in the critical post-event hours. Using airborne LiDAR data, He et al. [48] develop a 3D shape descriptor to detect surface- and structure-damaged roofs. Using airborne oblique images, Vetrivel et al. [49] develop a Visual-Bag-of-Words (BoW) based damage classification to detect structure-damaged areas. Ma et al. [50] present an automatic procedure to generate cloudless backdrop and disaster change-detection maps from optical imagery, whilst Xie et al. [51] demonstrate a framework to combine aerial remote sensing imagery with crowdsourcing to support wide-area assessments of building collapses. Using high resolution multispectral and panchromatic remote sensing data, Cooner et al. [52] demonstrate the effectiveness of multilayer feedforward neural networks, radial basis neural networks, and Random Forests in detecting earthquake damage. It is demonstrated in [53] that a combination of a post-event very high resolution SAR image with a pre-event building footprint map can be effectively used to detect damaged buildings, and Zhai et al. [54] demonstrated the feasibility to use a single post-event PolSAR image to assess building damage.

4. Current Challenges and Future Trends of EO for Geohazards

In this section, we analyze the evolution of the annual production of EO publications recorded in the Web of Science’s bibliographical database in the fields of Remote sensing and Geology. Several previous studies [55,56,57] conclude that a power model (q > 0, K > 1) can properly explain the growth of publications and new authors in different fields of science. Therefore, to explore the evolution of EO publications, we fit power functions to the available data (Figure 1). It is clear in Figure 1 that the first work in this discipline was published in the middle of the 1970s, but the take-off of this discipline took place in the 1990s. Since then, the number of EO papers has exhibited an exponential-like growth. Furthermore, the fittings show that the growth rate (K) in the number of publications is higher in the remote sensing segment than in the Geology one, because remote sensing includes all the applications of EO not restricted to geology. In order to provide a reference value to be compared with our data, we also plot the best-fit logistic functions of the publications focused on LiDAR or Laser scanning proposed by Derron and Jaboyedoff [8]. Although the data are not directly comparable since their publication data were extracted from the GEOREF database rather than from the Web of Science (WOS), which is usually more restrictive, and the LiDAR discipline is much younger that EO, the initial trends of both EO and LiDAR publications are quite similar.
The high number of manuscripts (i.e., 79) received to be considered for this Special Issue is also a good indicator of the increasing prosperity of the EO community. Most of the papers published in this Special Issue are focused on the post-event exploitation of EO products, i.e., they use EO data to investigate disasters after the event occurs. There is a delay between the event occurrence and the delivery of the useful EO-derived information for decision-makers. Therefore, a great effort is needed in the coming years to reduce the response time after disasters. It should be noted that EO can also be widely applied to disaster preparation, recovery and mitigation. On 1 January 2016, the 17 Sustainable Development Goals (SDGs) of Transforming Our World: the 2030 Agenda for Sustainable Development adopted by world leaders at the 2015 UN Sustainable Development Summit officially came into force, and will run through 2030 and applies to every country. EO and its derived information are specifically demanded to serve the 2030 Agenda by monitoring the 17 SDGs and associated 169 targets, planning and tracking progress, and helping nations and other stakeholders make informed decisions.

5. Conclusions

To conclude, EO has reached some degree of maturity although it is still growing fast following a power trend. The recent success of EO for the investigation of geohazards is mainly due to the development of new EO sensors and techniques, the improved capabilities of EO data acquisition and analysis, and the advance in the production of standardized products to be used by planners and decision makers. It is expected that more and more real-time EO products and services will be emerging in the near future, which will enable us to better manage geohazards.

Acknowledgments

Guest editors would like to take this opportunity to thank all authors, editors, reviewers, and supporters for the hard work and dedication that made this Special Issue possible. Part of this work was supported by the UK Natural Environmental Research Council (NERC) through the Centre for the Observation and Modelling of Earthquakes, Volcanoes and Tectonics (COMET, ref.: come30001) and the LICS and CEDRRIC projects (refs. NE/K010794/1 and NE/N012151/1, respectively), European Space Agency through the ESA-MOST DRAGON-4 projects (ref. 32244) and the Spanish Ministry of Economy and Competitiveness and EU FEDER funds under projects TIN2014-55413- C2-2-P and ESP2013-47780-C2-2-R.

Author Contributions

R.T. and Z.L. are guest editors of this Special Issue, and both wrote and edited the editorial.

Conflicts of Interest

The authors declare no conflict of interest.

References

  1. Hyndman, D.; Hyndman, D. Natural Hazards and Disasters, 5th ed.; Cebgage Learning: Boston, MA, USA, 2017. [Google Scholar]
  2. Aleotti, P.; Chowdhury, R. Landslide hazard assessment: Summary review and new perspectives. Bull. Eng. Geol. Environ. 1999, 58, 21–44. [Google Scholar] [CrossRef]
  3. Poland, J.F. Guidebook to Studies of Land Subsidence Due to Ground-Water Withdrawal; United Nations Educational, Scientific and Cultural Organization: Chelsea, UK, 1984; p. 340. [Google Scholar]
  4. Galloway, D.L.; Jones, D.R.; Ingebritsen, S.E. Land Subsidence in the United States; U.S. Geological Survey: Reston, VA, USA, 1999; p. 177.
  5. Denis, G.; de Boissezon, H.; Hosford, S.; Pasco, X.; Montfort, B.; Ranera, F. The evolution of earth observation satellites in europe and its impact on the performance of emergency response services. Acta Astron. 2016, 127, 619–633. [Google Scholar] [CrossRef]
  6. Tatem, A.J.; Goetz, S.J.; Hay, S.I. Fifty years of earth observation satellites: Views from above have lead to countless advances on the ground in both scientific knowledge and daily life. Am. Sci. 2008, 96, 390–398. [Google Scholar] [CrossRef] [PubMed]
  7. Abellan, A.; Derron, M.-H.; Jaboyedoff, M. “Use of 3D point clouds in geohazards” special issue: Current challenges and future trends. Remote Sens. 2016, 8, 130. [Google Scholar] [CrossRef]
  8. Derron, M.H.; Jaboyedoff, M. Preface “LiDAR and DEM techniques for landslides monitoring and characterization”. Nat. Hazards Earth Syst. Sci. 2010, 10, 1877–1879. [Google Scholar] [CrossRef] [Green Version]
  9. Zhu, S.; Xu, C.; Wen, Y.; Liu, Y. Interseismic deformation of the altyn tagh fault determined by interferometric synthetic aperture radar (INSAR) measurements. Remote Sens. 2016, 8, 233. [Google Scholar] [CrossRef]
  10. Liu, Y.; Xu, C.; Li, Z.; Wen, Y.; Chen, J.; Li, Z. Time-dependent afterslip of the 2009 mw 6.3 dachaidan earthquake (China) and viscosity beneath the qaidam basin inferred from postseismic deformation observations. Remote Sens. 2016, 8, 784. [Google Scholar] [CrossRef]
  11. Xu, B.; Li, Z.; Feng, G.; Zhang, Z.; Wang, Q.; Hu, J.; Chen, X. Continent-wide 2-d co-seismic deformation of the 2015 mw 8.3 illapel, chile earthquake derived from sentinel-1a data: Correction of azimuth co-registration error. Remote Sens. 2016, 8, 376. [Google Scholar] [CrossRef]
  12. Solaro, G.; De Novellis, V.; Castaldo, R.; De Luca, C.; Lanari, R.; Manunta, M.; Casu, F. Coseismic fault model of mw 8.3 2015 illapel earthquake (CHILE) retrieved from multi-orbit sentinel1-A dinsar measurements. Remote Sens. 2016, 8, 323. [Google Scholar] [CrossRef]
  13. Ji, L.; Xu, J.; Zhao, Q.; Yang, C. Source parameters of the 2003–2004 bange earthquake sequence, central tibet, china, estimated from insar data. Remote Sens. 2016, 8, 516. [Google Scholar] [CrossRef]
  14. Li, Y.; Jiang, W.; Zhang, J.; Luo, Y. Space geodetic observations and modeling of 2016 mw 5.9 menyuan earthquake: Implications on seismogenic tectonic motion. Remote Sens. 2016, 8, 519. [Google Scholar] [CrossRef]
  15. Trasatti, E.; Tolomei, C.; Pezzo, G.; Atzori, S.; Salvi, S. Deformation and related slip due to the 2011 van earthquake (turkey) sequence imaged by sar data and numerical modeling. Remote Sens. 2016, 8, 532. [Google Scholar] [CrossRef]
  16. Guzzetti, F.; Mondini, A.C.; Cardinali, M.; Fiorucci, F.; Santangelo, M.; Chang, K.-T. Landslide inventory maps: New tools for an old problem. Earth-Sci. Rev. 2012, 112, 42–66. [Google Scholar] [CrossRef]
  17. Al-Rawabdeh, A.; He, F.; Moussa, A.; El-Sheimy, N.; Habib, A. Using an unmanned aerial vehicle-based digital imaging system to derive a 3D point cloud for landslide scarp recognition. Remote Sens. 2016, 8, 95. [Google Scholar] [CrossRef]
  18. Watanabe, M.; Thapa, R.; Shimada, M. Pi-sar-l2 observation of the landslide caused by typhoon wipha on izu oshima island. Remote Sens. 2016, 8, 282. [Google Scholar] [CrossRef]
  19. Plank, S.; Twele, A.; Martinis, S. Landslide mapping in vegetated areas using change detection based on optical and polarimetric sar data. Remote Sens. 2016, 8, 307. [Google Scholar] [CrossRef]
  20. Angeli, M.-G.; Pasuto, A.; Silvano, S. A critical review of landslide monitoring experiences. Eng. Geol. 2000, 55, 133–147. [Google Scholar] [CrossRef]
  21. Qu, T.; Lu, P.; Liu, C.; Wu, H.; Shao, X.; Wan, H.; Li, N.; Li, R. Hybrid-Sar technique: Joint analysis using phase-based and amplitude-based methods for the xishancun giant landslide monitoring. Remote Sens. 2016, 8, 874. [Google Scholar] [CrossRef]
  22. Wang, C.; Mao, X.; Wang, Q. Landslide displacement monitoring by a fully polarimetric sar offset tracking method. Remote Sens. 2016, 8, 624. [Google Scholar] [CrossRef]
  23. Sun, L.; Muller, J.-P. Evaluation of the use of sub-pixel offset tracking techniques to monitor landslides in densely vegetated steeply sloped areas. Remote Sens. 2016, 8, 659. [Google Scholar] [CrossRef]
  24. Bardi, F.; Raspini, F.; Ciampalini, A.; Kristensen, L.; Rouyet, L.; Lauknes, T.; Frauenfelder, R.; Casagli, N. Space-borne and ground-based insar data integration: The knes test site. Remote Sens. 2016, 8, 237. [Google Scholar] [CrossRef] [Green Version]
  25. Kropáček, J.; Vařilová, Z.; Baroň, I.; Bhattacharya, A.; Eberle, J.; Hochschild, V. Remote sensing for characterisation and kinematic analysis of large slope failures: Debre sina landslide, main ethiopian rift escarpment. Remote Sens. 2015, 7, 16183–16203. [Google Scholar] [CrossRef]
  26. Fernández, T.; Pérez, J.; Cardenal, J.; Gómez, J.; Colomo, C.; Delgado, J. Analysis of landslide evolution affecting olive groves using uav and photogrammetric techniques. Remote Sens. 2016, 8, 837. [Google Scholar] [CrossRef]
  27. Hsieh, Y.-C.; Chan, Y.-C.; Hu, J.-C. Digital elevation model differencing and error estimation from multiple sources: A case study from the meiyuan shan landslide in taiwan. Remote Sens. 2016, 8, 199. [Google Scholar] [CrossRef]
  28. Jiang, Y.; Liao, M.; Zhou, Z.; Shi, X.; Zhang, L.; Balz, T. Landslide deformation analysis by coupling deformation time series from sar data with hydrological factors through data assimilation. Remote Sens. 2016, 8, 179. [Google Scholar] [CrossRef]
  29. De Novellis, V.; Castaldo, R.; Lollino, P.; Manunta, M.; Tizzani, P. Advanced three-dimensional finite element modeling of a slow landslide through the exploitation of dinsar measurements and in situ surveys. Remote Sens. 2016, 8, 670. [Google Scholar] [CrossRef]
  30. Zhang, Y.; Wu, H.a.; Kang, Y.; Zhu, C. Ground subsidence in the Beijing-Tianjin-Hebei region from 1992 to 2014 revealed by multiple sar stacks. Remote Sens. 2016, 8, 675. [Google Scholar] [CrossRef]
  31. Liu, P.; Li, Q.; Li, Z.; Hoey, T.; Liu, G.; Wang, C.; Hu, Z.; Zhou, Z.; Singleton, A. Anatomy of subsidence in tianjin from time series insar. Remote Sens. 2016, 8, 266. [Google Scholar] [CrossRef]
  32. Chen, M.; Tomás, R.; Li, Z.; Motagh, M.; Li, T.; Hu, L.; Gong, H.; Li, X.; Yu, J.; Gong, X. Imaging land subsidence induced by groundwater extraction in Beijing (China) using satellite radar interferometry. Remote Sens. 2016, 8, 468. [Google Scholar] [CrossRef]
  33. Holzer, T.L.; Galloway, D.L. Impacts of land subsidence caused by withdrawal of underground fl uids in the united states. Rev. Eng. Geol. 2005, XVI, 87–99. [Google Scholar]
  34. Cianflone, G.; Tolomei, C.; Brunori, C.; Dominici, R. Insar time series analysis of natural and anthropogenic coastal plain subsidence: The case of sibari (southern Italy). Remote Sens. 2015, 7, 15812. [Google Scholar] [CrossRef] [Green Version]
  35. Xu, B.; Feng, G.; Li, Z.; Wang, Q.; Wang, C.; Xie, R. Coastal subsidence monitoring associated with land reclamation using the point target based SBAS-INSAR method: A case study of shenzhen, China. Remote Sens. 2016, 8, 652. [Google Scholar] [CrossRef]
  36. Yang, C.-S.; Zhang, Q.; Xu, Q.; Zhao, C.-Y.; Peng, J.-B.; Ji, L.-Y. Complex deformation monitoring over the Linfen–Yuncheng basin (China) with time series insar technology. Remote Sens. 2016, 8, 284. [Google Scholar] [CrossRef]
  37. Bai, L.; Jiang, L.; Wang, H.; Sun, Q. Spatiotemporal characterization of land subsidence and uplift (2009–2010) over wuhan in central china revealed by terrasar-X insar analysis. Remote Sens. 2016, 8, 350. [Google Scholar] [CrossRef]
  38. Caló, F.; Notti, D.; Galve, J.; Abdikan, S.; Görüm, T.; Pepe, A.; Balik Şanli, F. Dinsar-based detection of land subsidence and correlation with groundwater depletion in konya plain, turkey. Remote Sens. 2017, 9, 83. [Google Scholar] [CrossRef]
  39. Pacheco-Martínez, J.; Cabral-Cano, E.; Wdowinski, S.; Hernández-Marín, M.; Ortiz-Lozano, J.; Zermeño-de-León, M. Application of insar and gravimetry for land subsidence hazard zoning in aguascalientes, mexico. Remote Sens. 2015, 7, 15868. [Google Scholar] [CrossRef]
  40. Bonì, R.; Pilla, G.; Meisina, C. Methodology for detection and interpretation of ground motion areas with the A-dinsar time series analysis. Remote Sens. 2016, 8, 686. [Google Scholar] [CrossRef]
  41. Ma, C.; Cheng, X.; Yang, Y.; Zhang, X.; Guo, Z.; Zou, Y. Investigation on mining subsidence based on multi-temporal insar and time-series analysis of the small baseline subset—case study of working faces 22201–1/2 in bu’ertai mine, shendong coalfield, China. Remote Sens. 2016, 8, 951. [Google Scholar] [CrossRef]
  42. Hu, J.; Wang, Q.; Li, Z.; Zhao, R.; Sun, Q. Investigating the ground deformation and source model of the yangbajing geothermal field in tibet, china with the wls insar technique. Remote Sens. 2016, 8, 191. [Google Scholar] [CrossRef]
  43. Zhou, W.; Li, S.; Zhou, Z.; Chang, X. Insar observation and numerical modeling of the earth-dam displacement of shuibuya dam (China). Remote Sens. 2016, 8, 877. [Google Scholar] [CrossRef]
  44. Ding, C.; Feng, G.; Li, Z.; Shan, X.; Du, Y.; Wang, H. Spatio-temporal error sources analysis and accuracy improvement in landsat 8 image ground displacement measurements. Remote Sens. 2016, 8, 937. [Google Scholar] [CrossRef]
  45. Zhou, G.; Yue, T.; Shi, Y.; Zhang, R.; Huang, J. Second-order polynomial equation-based block adjustment for orthorectification of disp imagery. Remote Sens. 2016, 8, 680. [Google Scholar] [CrossRef]
  46. Chen, K.; Zamora, N.; Babeyko, A.; Li, X.; Ge, M. Precise positioning of bds, BDS/GPS: Implications for tsunami early warning in South China sea. Remote Sens. 2015, 7, 15814. [Google Scholar] [CrossRef]
  47. Cignetti, M.; Manconi, A.; Manunta, M.; Giordan, D.; De Luca, C.; Allasia, P.; Ardizzone, F. Taking advantage of the esa G-pod service to study ground deformation processes in high mountain areas: A valle d’aosta case study, northern italy. Remote Sens. 2016, 8, 852. [Google Scholar] [CrossRef]
  48. He, M.; Zhu, Q.; Du, Z.; Hu, H.; Ding, Y.; Chen, M. A 3D shape descriptor based on contour clusters for damaged roof detection using airborne LiDAR point clouds. Remote Sens. 2016, 8, 189. [Google Scholar] [CrossRef]
  49. Vetrivel, A.; Gerke, M.; Kerle, N.; Vosselman, G. Identification of structurally damaged areas in airborne oblique images using a visual-bag-of-words approach. Remote Sens. 2016, 8, 231. [Google Scholar] [CrossRef]
  50. Ma, Y.; Chen, F.; Liu, J.; He, Y.; Duan, J.; Li, X. An automatic procedure for early disaster change mapping based on optical remote sensing. Remote Sens. 2016, 8, 272. [Google Scholar] [CrossRef]
  51. Xie, S.; Duan, J.; Liu, S.; Dai, Q.; Liu, W.; Ma, Y.; Guo, R.; Ma, C. Crowdsourcing rapid assessment of collapsed buildings early after the earthquake based on aerial remote sensing image: A case study of yushu earthquake. Remote Sens. 2016, 8, 759. [Google Scholar] [CrossRef]
  52. Cooner, J.A.; Shao, Y.; Campbell, B.J. Detection of urban damage using remote sensing and machine learning algorithms: Revisiting the 2010 Haiti earthquake. Remote Sens. 2016, 8, 868. [Google Scholar] [CrossRef]
  53. Gong, L.; Wang, C.; Wu, F.; Zhang, J.; Zhang, H.; Li, Q. Earthquake-induced building damage detection with post-event sub-meter vhr terrasar-X staring spotlight imagery. Remote Sens. 2016, 8, 887. [Google Scholar] [CrossRef]
  54. Zhai, W.; Shen, H.; Huang, C.; Pei, W. Building earthquake damage information extraction from a single post-earthquake polsar image. Remote Sens. 2016, 8, 171. [Google Scholar] [CrossRef]
  55. Egghe, L.; Ravichandra Rao, I.K. Classification of growth models based on growth rates and its applications. Scientometrics 1992, 25, 5–46. [Google Scholar] [CrossRef]
  56. Gupta, B.M.; Karisiddappa, C.R. Modelling the Growth of Literature in the Area of Theoretical Population Genetics. Scientometrics, 2000, 49, 321–355. [Google Scholar] [CrossRef]
  57. Gupta, B.M.; Sharma, P.; Kumar, S. Growth of world and Indian physics literature. Scientometrics, 1999, 44, 5–16. [Google Scholar] [CrossRef]
Figure 1. Evolution of the number of publications per year (dots) in the database Web of Science (WOS) containing the term “Earth observation” in the field of TOPICS between 1968 and 2015. Note that the searches are restricted to (a) “Remote Sensing”; and (b) Geology in the Web of Science. The dashed lines represent the best fit power function of the dots. The dotted lines correspond to the logistic fit performed by [8] for the terms “LiDAR” or “Laser scanning” in the GEOREF database.
Remotesensing 09 00194 g001
Figure 2. Number of papers published in this Special Issue (SI) classified according to: (a) the types of geohazards; (b) the types of sensors employed; and (c) the types of the sensor platforms. Note that (i) the total number in (a) is less than 43 since one article addresses an EO method that could be applied to various geohazards; and (ii) the total numbers in (b,c) are greater than 43 because multiple sensors and/or platforms were utilised in some papers.
Remotesensing 09 00194 g002

