Article

A Recognition and Geological Model of a Deep-Seated Ancient Landslide at a Reservoir under Construction

1
Key Laboratory of Shale Gas and Geoengineering, Institute of Geology and Geophysics, Chinese Academy of Sciences, Beijing 100029, China
2
College of Earth Sciences, University of Chinese Academy of Sciences, Beijing 100049, China
3
College of Civil Engineering, Shaoxing University, Shaoxing 312000, China
4
Highway School, Chang’an University, Xi’an 710064, China
5
China Aero-geophysical Survey and Remote Sensing Center for Land and Resources, Beijing 100083, China
6
Chengdu Engineering Co. Ltd., China Power, Chengdu 610072, China
7
China Zhengyuan Geomatics Co. Ltd., Jinan 250101, Shandong, China
*
Author to whom correspondence should be addressed.
Submission received: 17 January 2017 / Revised: 15 April 2017 / Accepted: 17 April 2017 / Published: 19 April 2017
(This article belongs to the Special Issue Remote Sensing of Landslides)

Abstract

:
Forty-six ancient Tibetan star-shaped towers and a village are located on a giant slope, which would be partially flooded by a nearby reservoir currently under construction. Ground survey, boreholes, and geophysical investigations have been carried out, with results indicating that the slope consists of loose deposit with a mean thickness of approximately 80 m in addition to an overlying bedrock of micaceous schist and phyllite. Ground survey and Interferometric Synthetic Aperture Radar (InSAR) indicated that the slope is experiencing some local deformations, with the appearance of cracks and occurrence of two small landslides. Through using borehole logs with the knowledge of the regional geological background, it can be inferred that the loose deposit is a result of an ancient deep-seated translational landslide. This landslide was initiated along the weak layer of the bedding plane during the last glaciation in the late Pleistocene (Q3) period, which was due to deep incision of the Dadu River at that time. Although it has not shown a major reaction since the ancient Tibetan star-shaped towers have been built (between 200 and 1600 AD), and preliminary studies based on geological and geomorphological analyses incorporated with InSAR technology indicated that the landslide is deformable. Furthermore, these studies highlighted that the rate of deformation is gradually reducing from the head to the toe area of the landslide, with the deformation also exhibiting relationships with seasonal rainstorms. The state of the toe area is very important for stabilizing a landslide and minimizing damage. It can be expected that the coming impoundment of the reservoir will increase pore pressure of the rupture zone at the toe area, which will then reduce resistance and accelerate the deformation. Future measures for protection of the slope should be focused on toe erosion and some bank protection measures (i.e., rock armor) should be adopted in this area. Meanwhile, some long-term monitoring measures should be installed to gain a deep understanding on the stability of this important slope.

Graphical Abstract

1. Introduction

Landslides triggered by the impoundment of reservoirs have been widely reported in the literature [1,2,3,4,5,6,7,8]. For example, Jones et al. [1] reported that there were about 500 landslides caused by destabilization of the land from impoundment of Grand Coulee Dam in the United States during 1942–1953, while Müller [2] described the Vajont landslide in Italy in 1963, which claimed more than 2600 deaths and was the most catastrophic landslide trigged by reservoir impoundment. More recently, Xu et al. [8] reported that a large displacement landslide, the Shanshucao landslide, had taken place at 1:19 p.m. on 2 September 2014 in Zigui County, Hubei Province, Central China, which was about 42 km from the Three Gorges Dam.
Nowadays, there are many hydroelectric power plants and related reservoirs that have been or are being built in the world, especially in the newly industrialized countries (e.g., China). As a result, there have been multiple slope failures that have occurred from time to time due to reservoir impounding as mentioned above. Seventy-five percent of the 105 landslides that occurred in 50 reservoirs of six countries were found to be reactivation of ancient landslides, according to the analyses carried out by International Commission on Large Dams (ICOLD) [9]. The statistical results showed that large-scale catastrophic landslides occurred mainly as a part of or from the reactivation of ancient landslides. Therefore, to mitigate the hazards of reservoir landslides, it is important to recognize the previous occurrence of an ancient landslide before reservoir impounding. However, it is still a significant challenge to recognize the occurrence of an ancient landslide in advance.
Meanwhile, stability problems of partially submerged slopes are of great concern [10,11,12,13,14]. Studies in this field of research can be roughly grouped into three categories: designing engineering geological models [2,5,8,15,16,17,18], material property studies [19,20] and formulating mathematical models [21,22,23,24,25]. All these categories of studies are equally important and none of these can be excluded in evaluating the stability of a submerged slope. Due to geological complexity, it is most difficult and controversial to design a correct geological model. For example, despite the Vajont landslide having occurred over 60 years ago and the great scientific interest related to this catastrophic episode, many geological, hydrogeological and geotechnical aspects of the Vajont rockslide still remain unexplained [26]. Paronuzzi and Bolla [18] presented a detailed reconstruction of the entire structure of the prehistoric Vajont rockslide and updated the geological model.
In this paper, we focused on an important slope in the southwestern part of China, which would be partially submerged by a reservoir under construction nearby. This slope has 46 Tibetan star-shaped towers and a village with 40 inhabitants located on it. Therefore, it is clear that instability of the slope would threaten the safety of the towers and the inhabitants of the village. Through a detailed ground survey, we found that the slope has a thick loose deposit on the surface, which overlays on the base rock, with past development of some ground fissures and small landslides. To understand the formation of the slope, detailed geophysical prospecting, borehole drillings have been carried out. Based on the investigation and the regional geological analysis, we discovered the existence of an ancient landslide and presented its geological model, before giving a preliminary stability assessment and some countermeasures to prevent a major reaction.

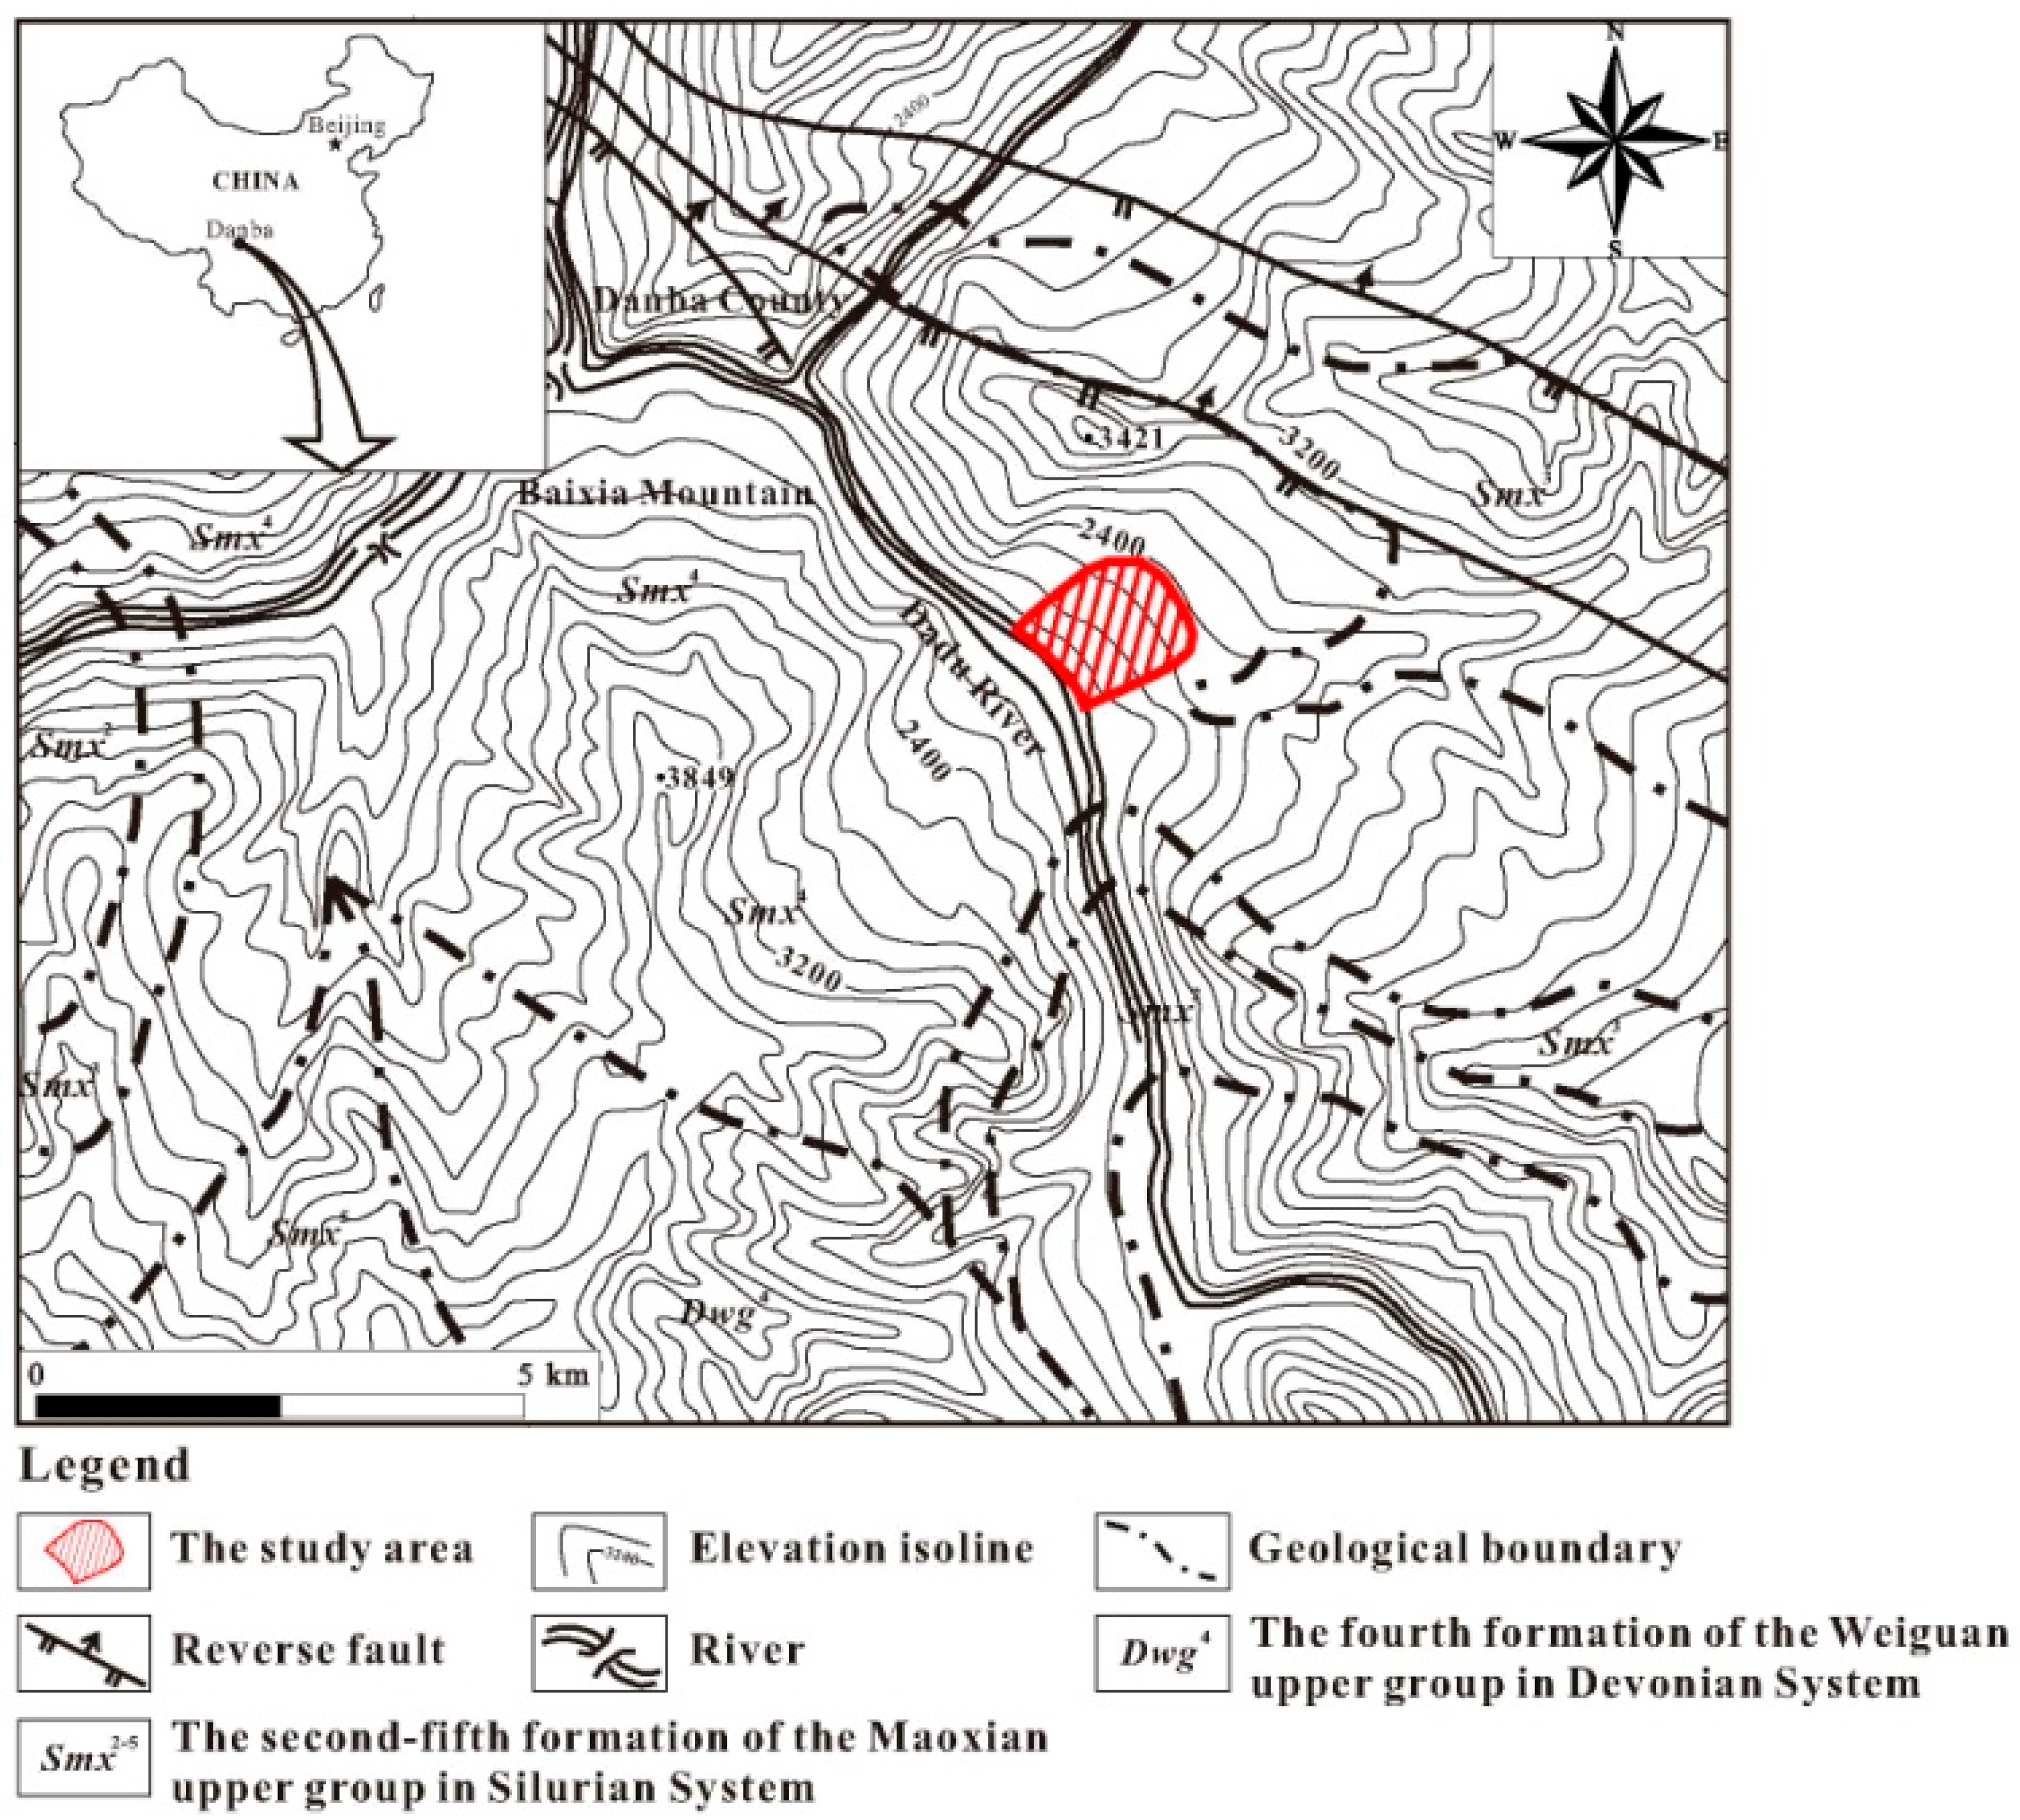
2. Geological Context Background and Geomorphological Analysis of the Slope

The study area is a huge slope located in the Eastern Qinghai-Tibet Plateau in the southwestern part of China, which has dimensions of 3.98 × 2.05 km and an area of about 7.00 km2 (Figure 1). There are no major faults in the study area. However, a reverse fault is located about 2 km northeast of the study site with a dip direction of 20°–30°. The Quaternary strata are widely distributed, with bedrock outcropping locally. The bedrock mainly is the fourth formation of the upper subgroup of the Maoxian group in Silurian system (Smx4), consisting mainly of metamorphosed soft rocks, i.e., micaceous schist and phyllite, which are vulnerable to weathering. The weathered rock is gradually transformed into argillite with an accompanying dramatic reduction in strength, which results in slope instability by sliding along bedding planes and cleavage. Besides the bedrock of the Maoxian group in Silurian system, the fourth formation of the Weiguan upper group in Devonian system (Smx4) also outcrops a little in the south, mainly consisting of metamorphosed soft rocks, i.e., the phyllite, the slate interlayered carbonate rock (see Figure 1). Investigations indicate that there are four well-developed joint sets as shown in Table 1 and Figure 2. Among these four joint sets, Joint Set 3 occurs most densely, with a dip angle of 70°–90°, a dip direction of 100°–115°, and a spacing of 100–300 mm. In addition to these joint sets, bedding planes and foliations are well-developed in the strata, with a dip direction of 270°–280°, a dip angle of 25°–40° and a spacing varying from extremely close (less than 20 mm) to close (60 mm –200 mm), according to the methods for quantitative description of discontinuities in a rock mass suggested by the International Society for Rock Mechanics (ISRM) [27]. Joint Set 4, the bedding plane joint, and the reverse fault nearby have a similar attitude, which may be formed under a same tectonic environment. Rock masses are shaped by joints and form various polyhedrons. Fractured rock mass is also one of the reasons for high occurrence of the landslides in the region.
The study area is surrounded by high mountains with elevations of 3400–4000 m, with snow persisting throughout the year on some mountain-tops in addition to some glaciers being developed in some distant mountains. The slope is located about 46 km upstream from the dam site of the Houziyan reservoir (Figure 1). The Dadu River flows along the toe from northwest to southeast at a level of 1835–1839 m during the non-flood season and 1840–1841 m during the flood season with a perennial flood level of 1844 m. The Sidao River, a branch of the Dadu River, begins downstream of the slope and flows into Dadu River in a south-southwestern direction (Figure 1).
The topography clearly shows evidence of three landslides in the vicinity of the investigated slope (Figure 3). The Chanong landslide is on the upstream side, which borders the slope cut by the Shuangyuan gully and activates every year during the rainy season. The Sidaokou landslide is located downstream and is manifested by flat and stable deposits with no deformation. The active Songda landslide developed on the opposite side of the river and frequently blocks the highway from Luding County to Danba County.
The investigated slope is almost completely covered by loose deposits, except at its upstream boundary where there is an outcropping of bedrock. The loose slope deposits consist mainly of soil detritus with a maximum block size of 10 × 10 × 2 m (Figure 4a).
The slope has a dip direction of 248° and a mean slope angle of 21°. The toe of the slope has a length of 1850 m along the Dadu River with a fluctuating water level, which reaches a maximum of 1847 m and can drop to a minimum of 1841 m (Figure 3). There are some small terraces with length of 60–150 m, width of 20–50 m and a slope of 8°–15°. The first one developed downstream of the slope toe with a width of 10–20 m. This presents as a typical river terrace with silt and silt clay in the upper part while there is rounded coarse sand and gravel in the lower part (Figure 3 and Figure 4b). The toe of the slope is convex to the river and has a cliff with a height of 18–20 m above the river (elevation of almost 1860 m). There is only a gentle slope above 2200 m, with a mean slope angle of 16° from 2200 to 3300 m. There are 6 large tablelands developed at elevations of 2200–2280 m, 2390–2480 m, 2600–2680 m, 2780–2880 m, 3000–3120 m, and 3200–3280 m, respectively. Generally, the tablelands are 100–200 m wide and 0.5–2.0 km long, with slopes of 6°–10°. There are two gullies developed. Shuangyuan Gully is at the upstream boundary of the slope, has a length of 1700 m and a maximum incision depth of 20–30 m with two headstreams. The other gully has developed in the middle of the slope, with a length of 1000 m and an incision depth of 1–10 m. Surface water from irrigation ditches continually flows in this gully.
Arc-shaped cracks are present in the southeastern part of the slope at an elevation of 2160–2178 m, which formed after rainstorms 15 years ago. One of these cracks divided a block of farmland into two blocks, with a scarp height of 1–2 m, length of over 500 m, and a width of 0.4–0.5 m (Figure 5a). Furthermore, some other cracks tilted powerline poles and trees nearby (Figure 5b). There is a small circular slump at the toe of the slope, with a width of about 30 m, a length of over 60 m and a scarp of 2–3 m (Figure 5c). Cracks with a maximum width of 5 cm developed in the house of a local resident at an elevation of 1970 m (Figure 5d).
As mentioned above, there are 46 Tibetan star-shaped towers located in the slope apart from the local inhabitants. The Tibetan star-shaped towers are the ancient stone buildings constructed at the high mountain area by ancient Tibetan people for living in and as a defense mechanism, using local slab stone as building material [28]. Their heights range from 30 m to 60 m, with structural outlines varying greatly to include shapes, such as triangular, square, pentagon, hexagon, octagon and complex thirteen corners (Figure 6a,b). The French explorer, Frederique Darragon, collected 108 samples and dated them using the isotope C14 carbon-dating technique. Her results confirm that these towers were built between 200 and 1600 AD [28,29]. The Tibetan star-shaped towers are key cultural relics under protection in the Sichuan Province and are also in the tentative lists of World Cultural Heritage in China.
According to ground investigations conducted at different times, most of Tibetan star-shaped towers on the slope are in good condition, but some of these towers have been damaged to different degrees. Some have already collapsed while some have become leaning towers. Most of these damages were caused by local uneven deformation of the slope (Figure 6c), resulting in tensile forces within the tower body and generating tension cracks, which destroyed and caused collapse of the whole structure.

3. Recognition of the Ancient Landslide

To understand the formation of the slope and to evaluate the impact of future reservoir flooding, 7 boreholes have been drilled in addition to a detailed ground survey as indicated in the previous section. Meanwhile, a high-density electric resistivity method was adopted to investigate the structure of the slope. Three cross-sections (electrode arrays) were placed perpendicular to the river (i.e., A0–A1434, B0–B1434, C0–C1434), while eight transverse sections (electrode arrays) were placed parallel to the river (i.e., D0–D894, E0–E894, F0–F714, G0–G714, H0–H714, I0–I714, J0–J714, K0–K714). This is shown in Figure 3, in which the subscript A denotes the cross-section, A0 denotes the electrode (marked as a circle in Figure 3), and the subscript denotes the distance of the electrode from the start electrode. Each cross-section has the same length of 1434 m, while each transverse section has a length of 714 m, except D0–D894 and E0–E894, which have lengths of 894 m.
Some results from the high-density electric resistivity method are presented in Figure 7 as contour maps of electrical resistivity. At the depth of 70–90 m, there exists an obvious continual layer marked in light green with an electrical resistivity of 250 Ω·m. The material above this layer has an electrical resistivity of 30–500 Ω·m and the material below the layer has an electrical resistivity of 250–3500 Ω·m in general. This is consistent with the constraints from the data of the boreholes. In other words, the slope consists of loose deposit and the bedrock of micaceous schist or phyllite from the fourth formation of the upper subgroup in the Maoxian group (Smx4). The loose deposit has an electrical resistivity of 30–500 Ω·m in general, while the bedrock has an electrical resistivity of 250–3500 Ω·m. The light green layer with an electrical resistivity of 250 Ω·m in the contour maps can be considered as a boundary between the loose deposit and bedrock.
According to the borehole data, the loose deposit consists of light yellow soil containing rubble gravel, gray yellow-black silt containing gravels and solitary boulders of phyllite, which has been depicted in the borehole logs shown in Figure 7a–e. Moving down the slope surface, all boreholes have a layer rich in clay at a depth of 45–95 m, with a thickness of 1–3 m. The main exception is borehole BH04, which has no layer rich in clay. Moving further down the slope surface, bedrock has developed with a disturbed zone at the top. In some boreholes (i.e., BH01, BH03), obvious sliding traces can be observed on the bedding plane of the base rock (Figure 8). Borehole BH04 is located at the toe area of the slope (Figure 3). In this borehole, fine silty sand is located at a depth of 44.57–48.91 m, while plant roots and charred wood presented at a depth of 48.16 m (Figure 9). A soil layer containing boulders, cobbles and gravel at a depth of 64.0–90.60 m was discovered with glaciofluvial facies, while the sand and gravel layer with fluvial facies presented at a depth of 72.17–75.07 m and 76.5–81.0 m respectively. The intact bedrock contains micaceous schist presenting below 90.60 m with a corresponding elevation of 1771 m, with this elevation is being over 50 m lower than the present riverbed. Therefore, it was hypothesized that the loose deposit is a result of an ancient landslide, leading to the buried plants and charred wood.
On the downstream side, there is a block of river terrace developed on the toe of the landslide as mentioned in Section 2 (Figure 4b), which means that the ancient landslide had formed before the first river terrace.

4. Boundary of the Ancient Landslide

The ancient landslide has experienced a change in landscape over a long period of time due to natural and artificial effects. There is no obvious main scarp that has developed, with the boundaries and scarp area being difficult to identify from the landscape nowadays. Therefore, we delineated the boundary using the results from the high-density electric resistivity method.
Figure 7a shows that the loose deposit has an almost identical thickness of 90 m in the cross-section of A0–A1434, as measured by both electrode A1434 and borehole BH13. From BH13 to A0, the thickness reduces gradually to 0 at an elevation of about 2250 m. Therefore, we can deduce that the crown (the term is after International Association of Engineering Geology and the Environment (IAEG) Commission’s Suggested Nomenclature for Landslides [30]) of the landslide is located at an elevation of about 2250 m in the cross-section of A0–A1434. Similarly, we can infer that the crown of the landslide is located at an elevation of about 2200 m in the cross-section of B0–B1434 (Figure 7b).
Figure 7c is obviously different from Figure 7a,b. This difference shows that the buried depth of the light green layer is decreasing gradually from the toe area to the upper part and almost crops out to the surface at an elevation of 2170 m. Thus, we can deduce that the crown area of the landslide has an elevation of 2170 m in the cross-section of C0-C1434 (Figure 7c). Similarly, the boundary between the upstream and downstream side can be delineated by the transverse sections of D0–D894, E0–E894, F0–F714, G0–G714, as shown in Figure 7d–g.
From the data of all boreholes and the results from the high-density electric resistivity method, it can be concluded that the landslide deposit gradually becomes thicker from the upslope to the downslope and from the upstream to the downstream area. Overall, there is a mean thickness of about 80–90 m (Figure 7).

5. Discussion of the Geological Model of the Landslide

To better understand the formation and build a geological model of the ancient landslide, we investigated the sporadically developed river terraces near the region and collected data from investigations of several dams under construction on the Dadu River. It has been noted that there is a layer of thick, loose glaciofluvial deposits in the Dadu River valley with a varied thickness of 70–130 m in the section from Luding to Danba (Figure 10), which is consistent with the data from borehole BH04 as mentioned in Section 3 (Figure 11). The river has been deeply incised throughout history, with the riverbed having been deeply buried over time.
Wang et al. [32] dated the Quaternary sediment from the Dadu Riverbed in Luding by Electron Spin Resonance (ESR) and found that the gravel and pebbles at the depth of 5 m in the borehole were formed 3000 ± 1000 years ago, while the muddy silt sand layers at depths of 40 m and 68 m were formed 17,000 ± 2000 years and 19,000 ± 2000 years ago, respectively. Sun et al. [33] dated the Quaternary sediment from the Dadu Riverbed in Danba by ESR and found that the sediment was formed 19,000 ± 2000 years ago as well. These imply that the rock surface of the valley bottom was formed 25,000 years ago by an intensive erosion event, which was related with the second interglacial era of the last glacial period [32,34]. Therefore, it can be inferred that the layer of thick loose glaciofluvial deposits located at a depth of 64–90.6 m had been formed during the last glaciation around the late part of the Pleistocene period (Q3).
The slope investigated is a consequent slope as indicated before, which is prone to sliding along the weak layer of micaceous schist. If the weak layer of micaceous schist was examined by deep incision of the intensive erosion, the landslide would have been initiated as a translational failure along the weak layer, and overlaid on the glaciofluvial deposit. Thus, we infer that the slope has a structure as shown in Figure 11 at the toe area.
Based on evidence above, we suggest that the landslide has experienced four stages: (1) the Dadu River deeply incised and the weak layer of the slope composed of micaceous schist was exposed; (2) the landslide occurred, resulting in its toe moving into the Dadu River and covered on the glaciofluvial deposits; (3) part of the toe was eroded by the river, with river facial sediments being deposited on the landslide toe; (4) the first river terrace was formed and covered on the toe of the landslide.

6. Preliminary Stability Analyses on the Landslide

Preliminary geological investigations indicated that the landslide has undergone some obvious deformation as indicated in Section 2. However, the two factors listed below are favorable to the stability.
(1)
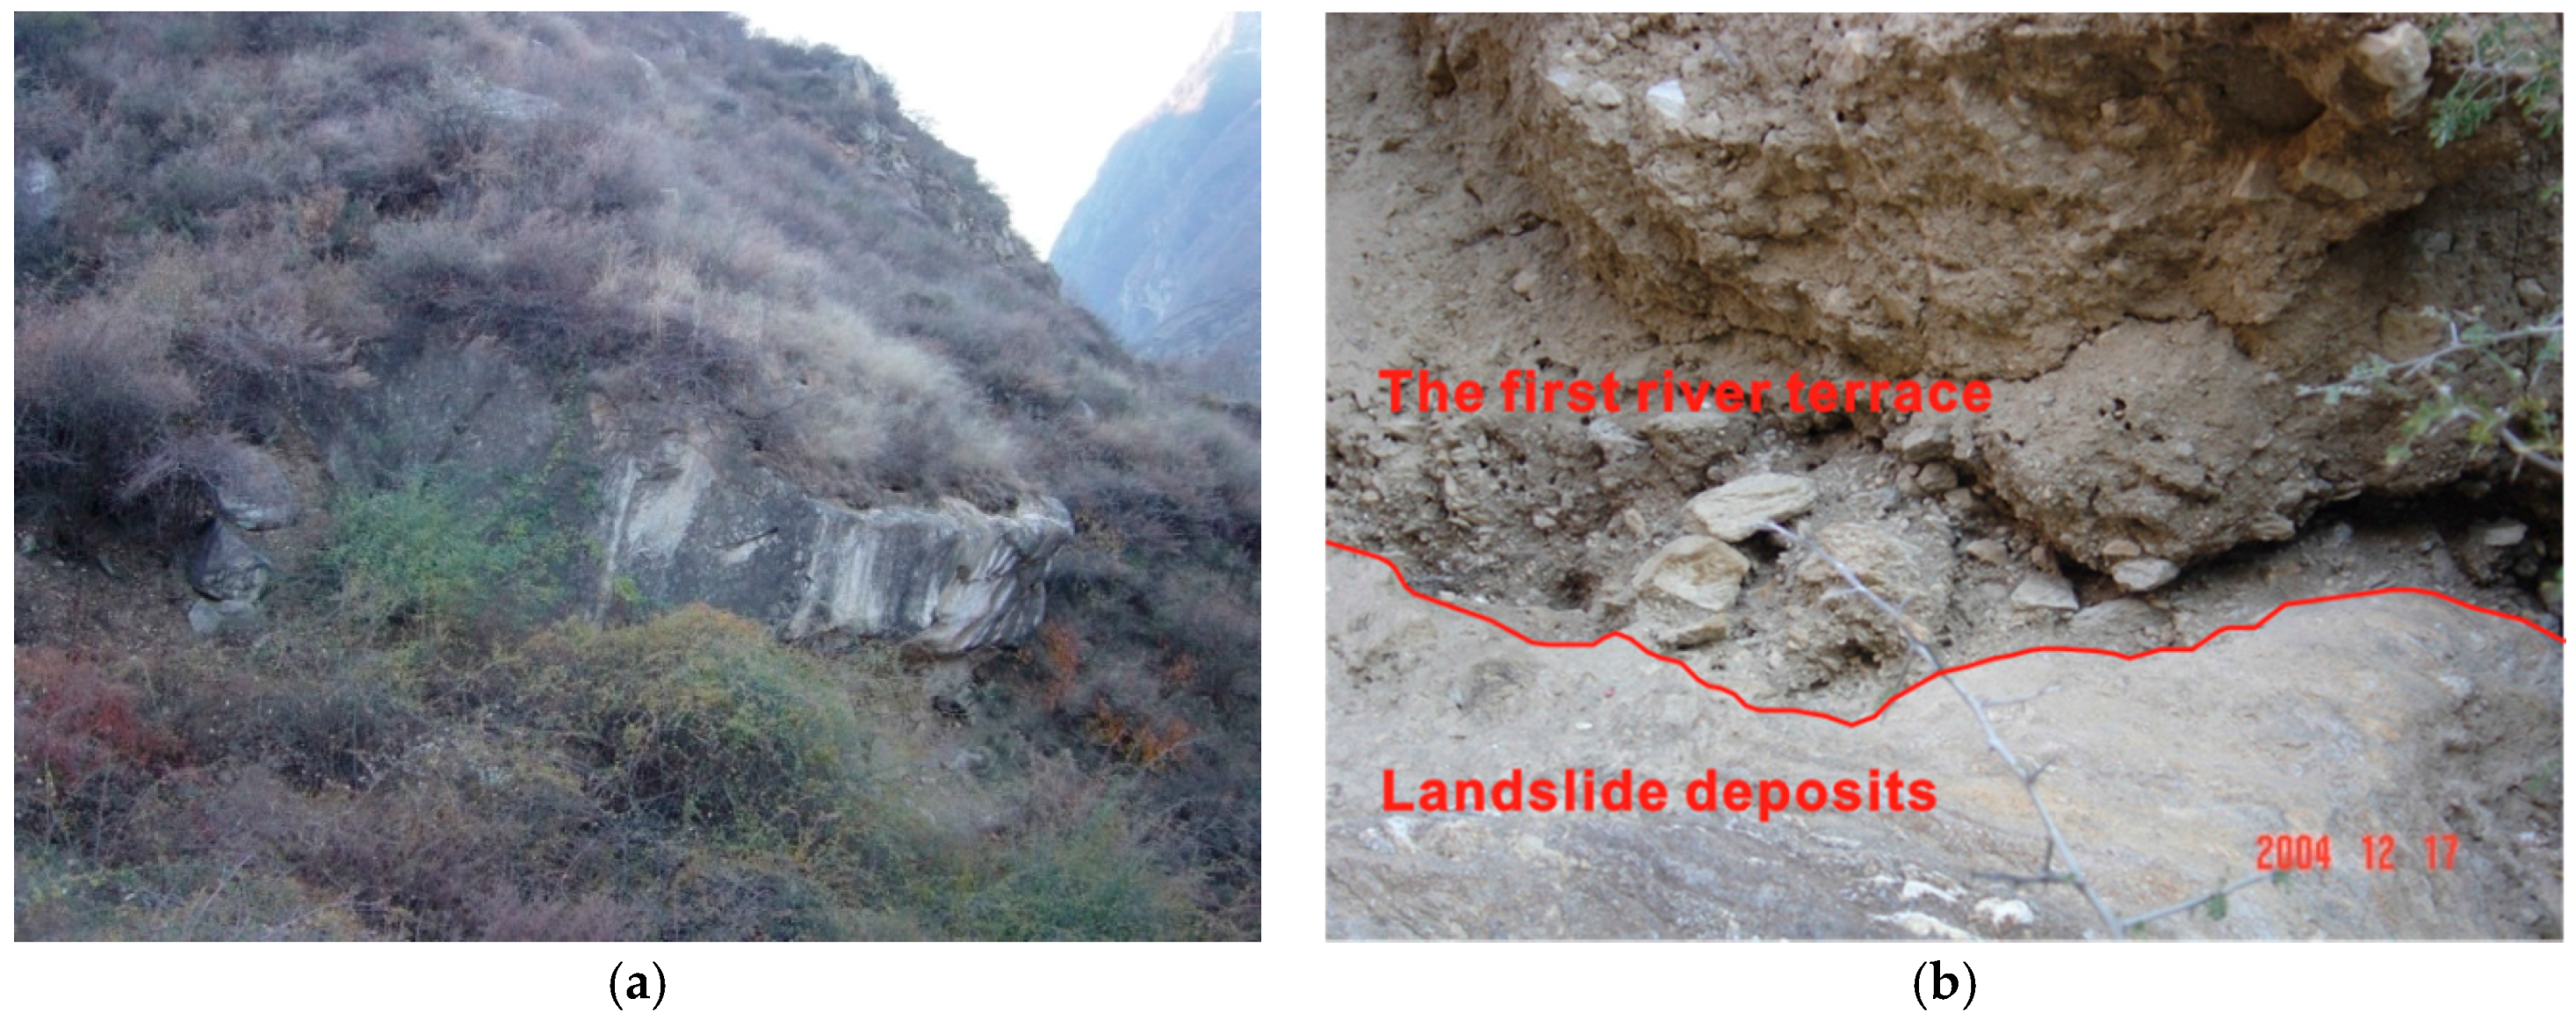
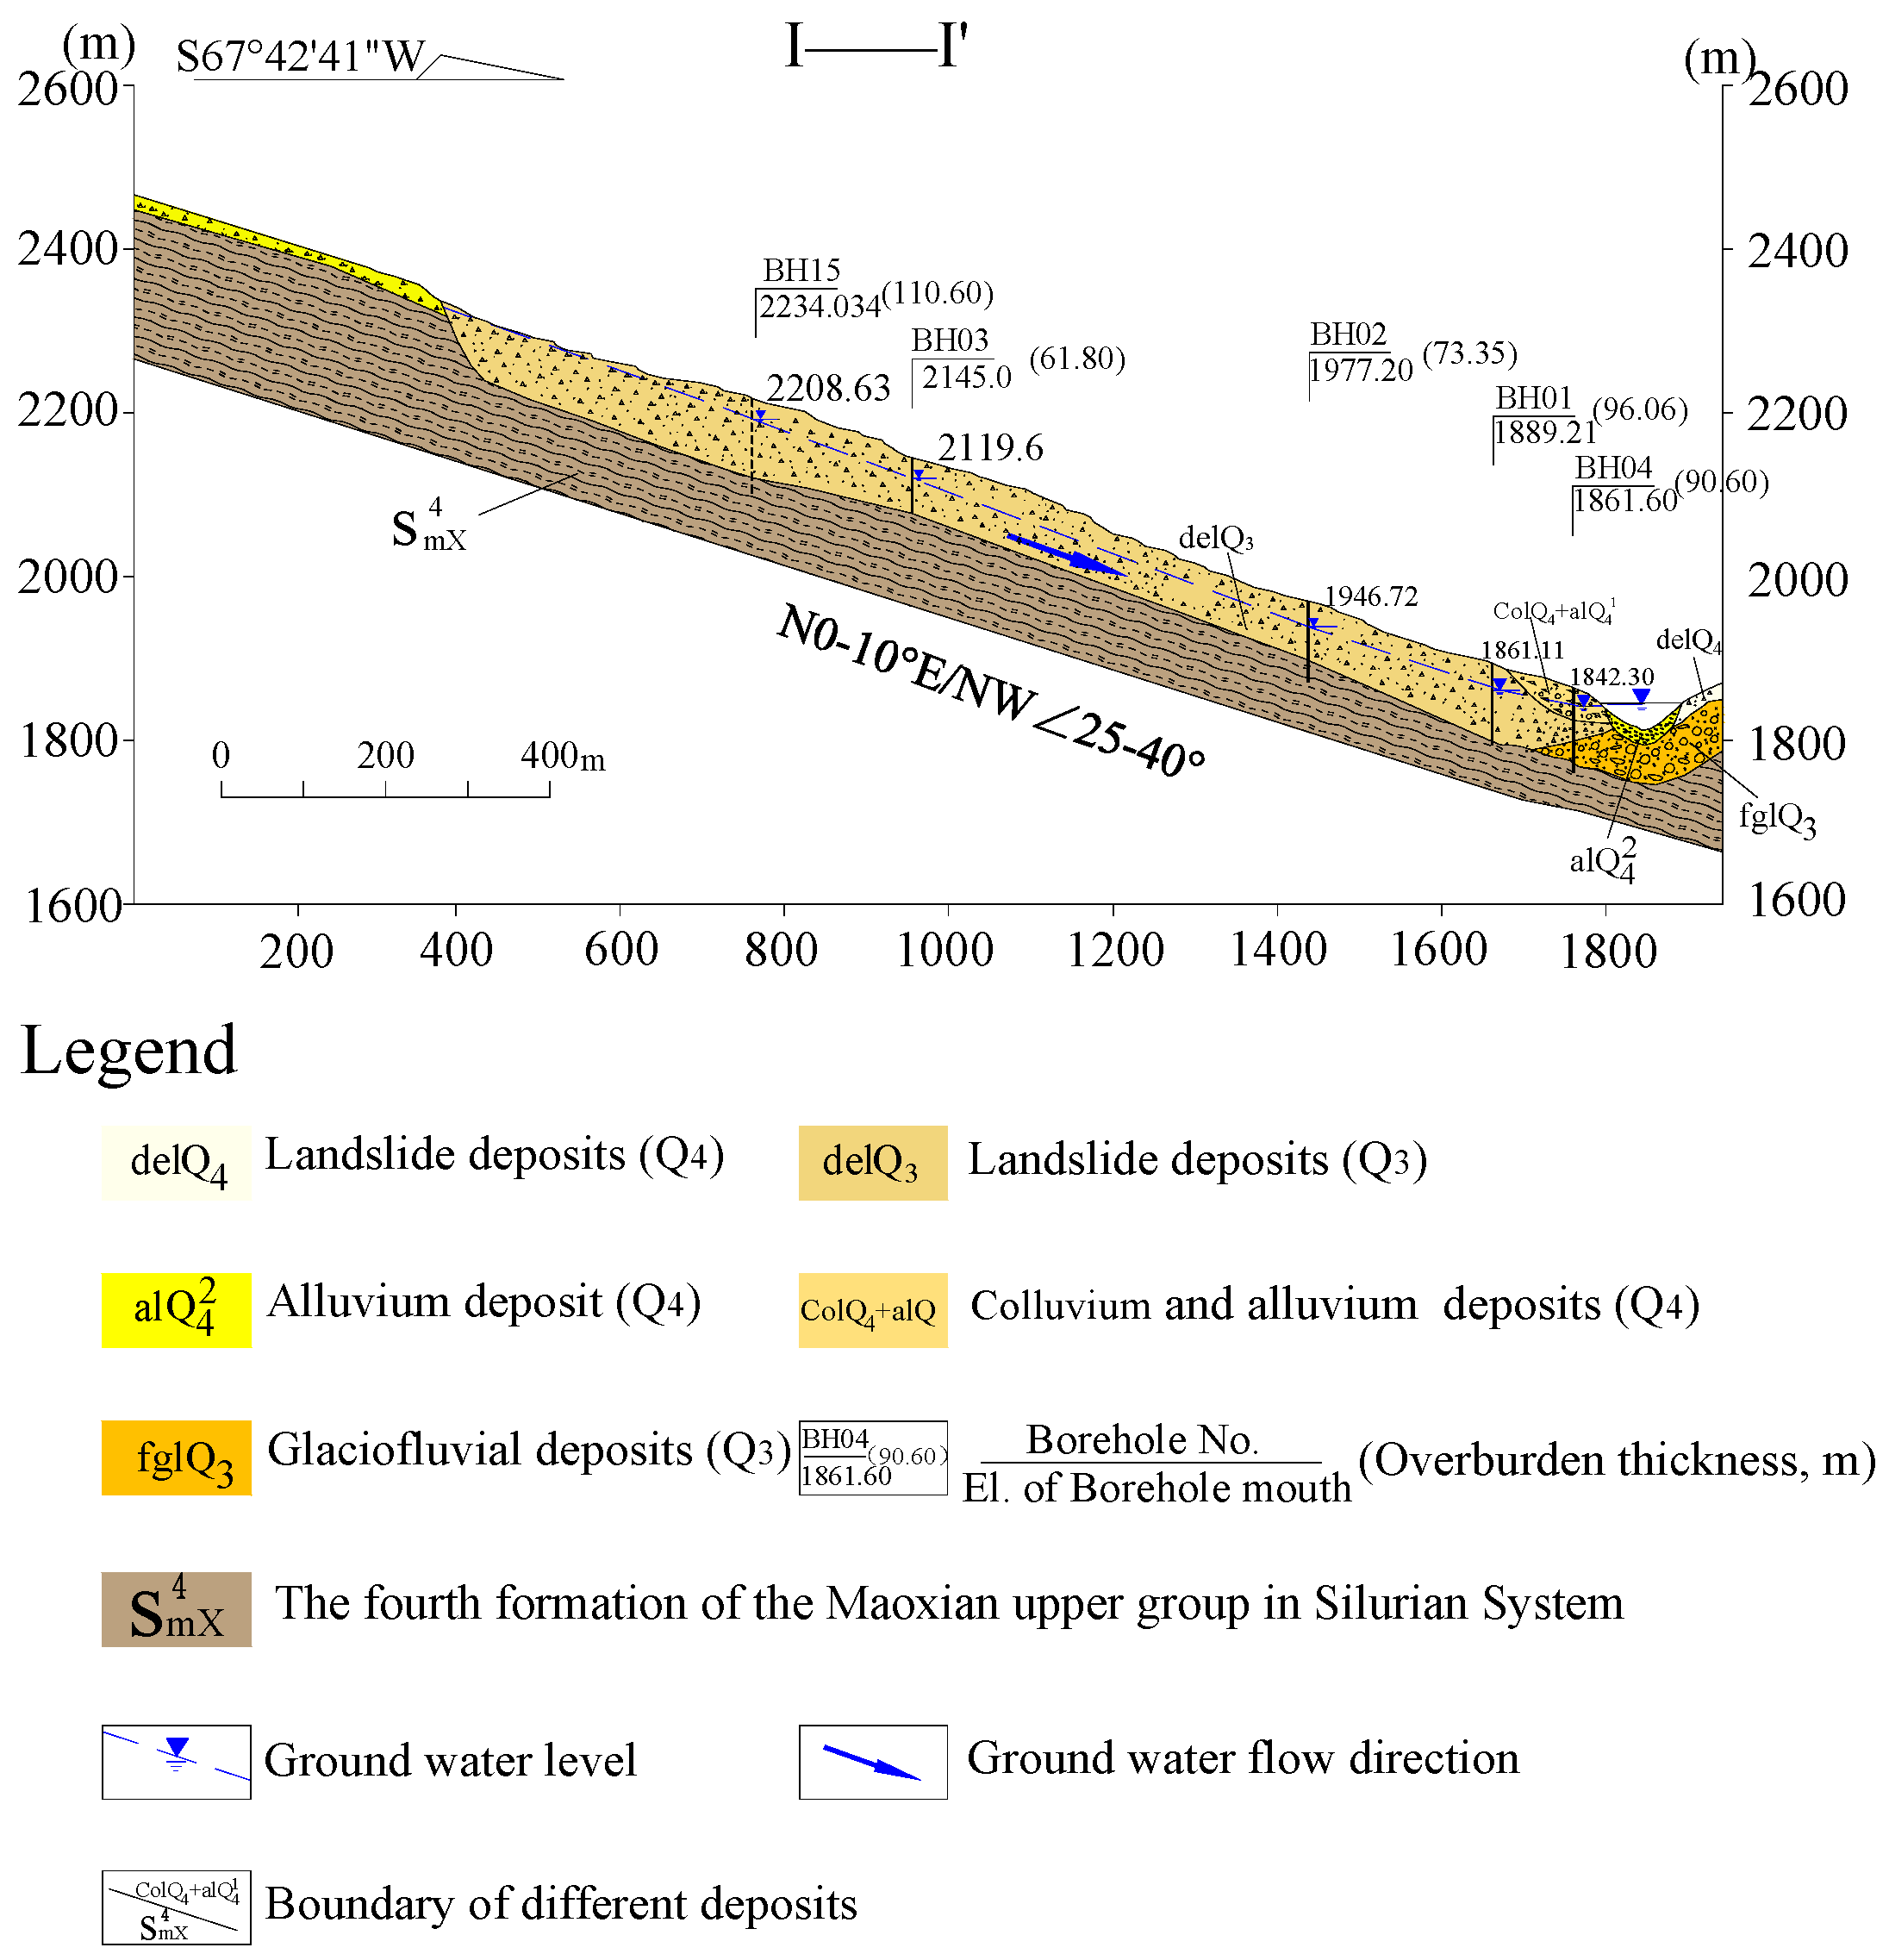
From Figure 11, it can be seen that the existing sliding zone was buried under the first river terrace, which resists shear forces that occur along the existing fracture zone at the toe of the landslide. Meanwhile, the stability of the river terrace indicates that the landslide has not undergone a major reaction since the terrace formed.
(2)
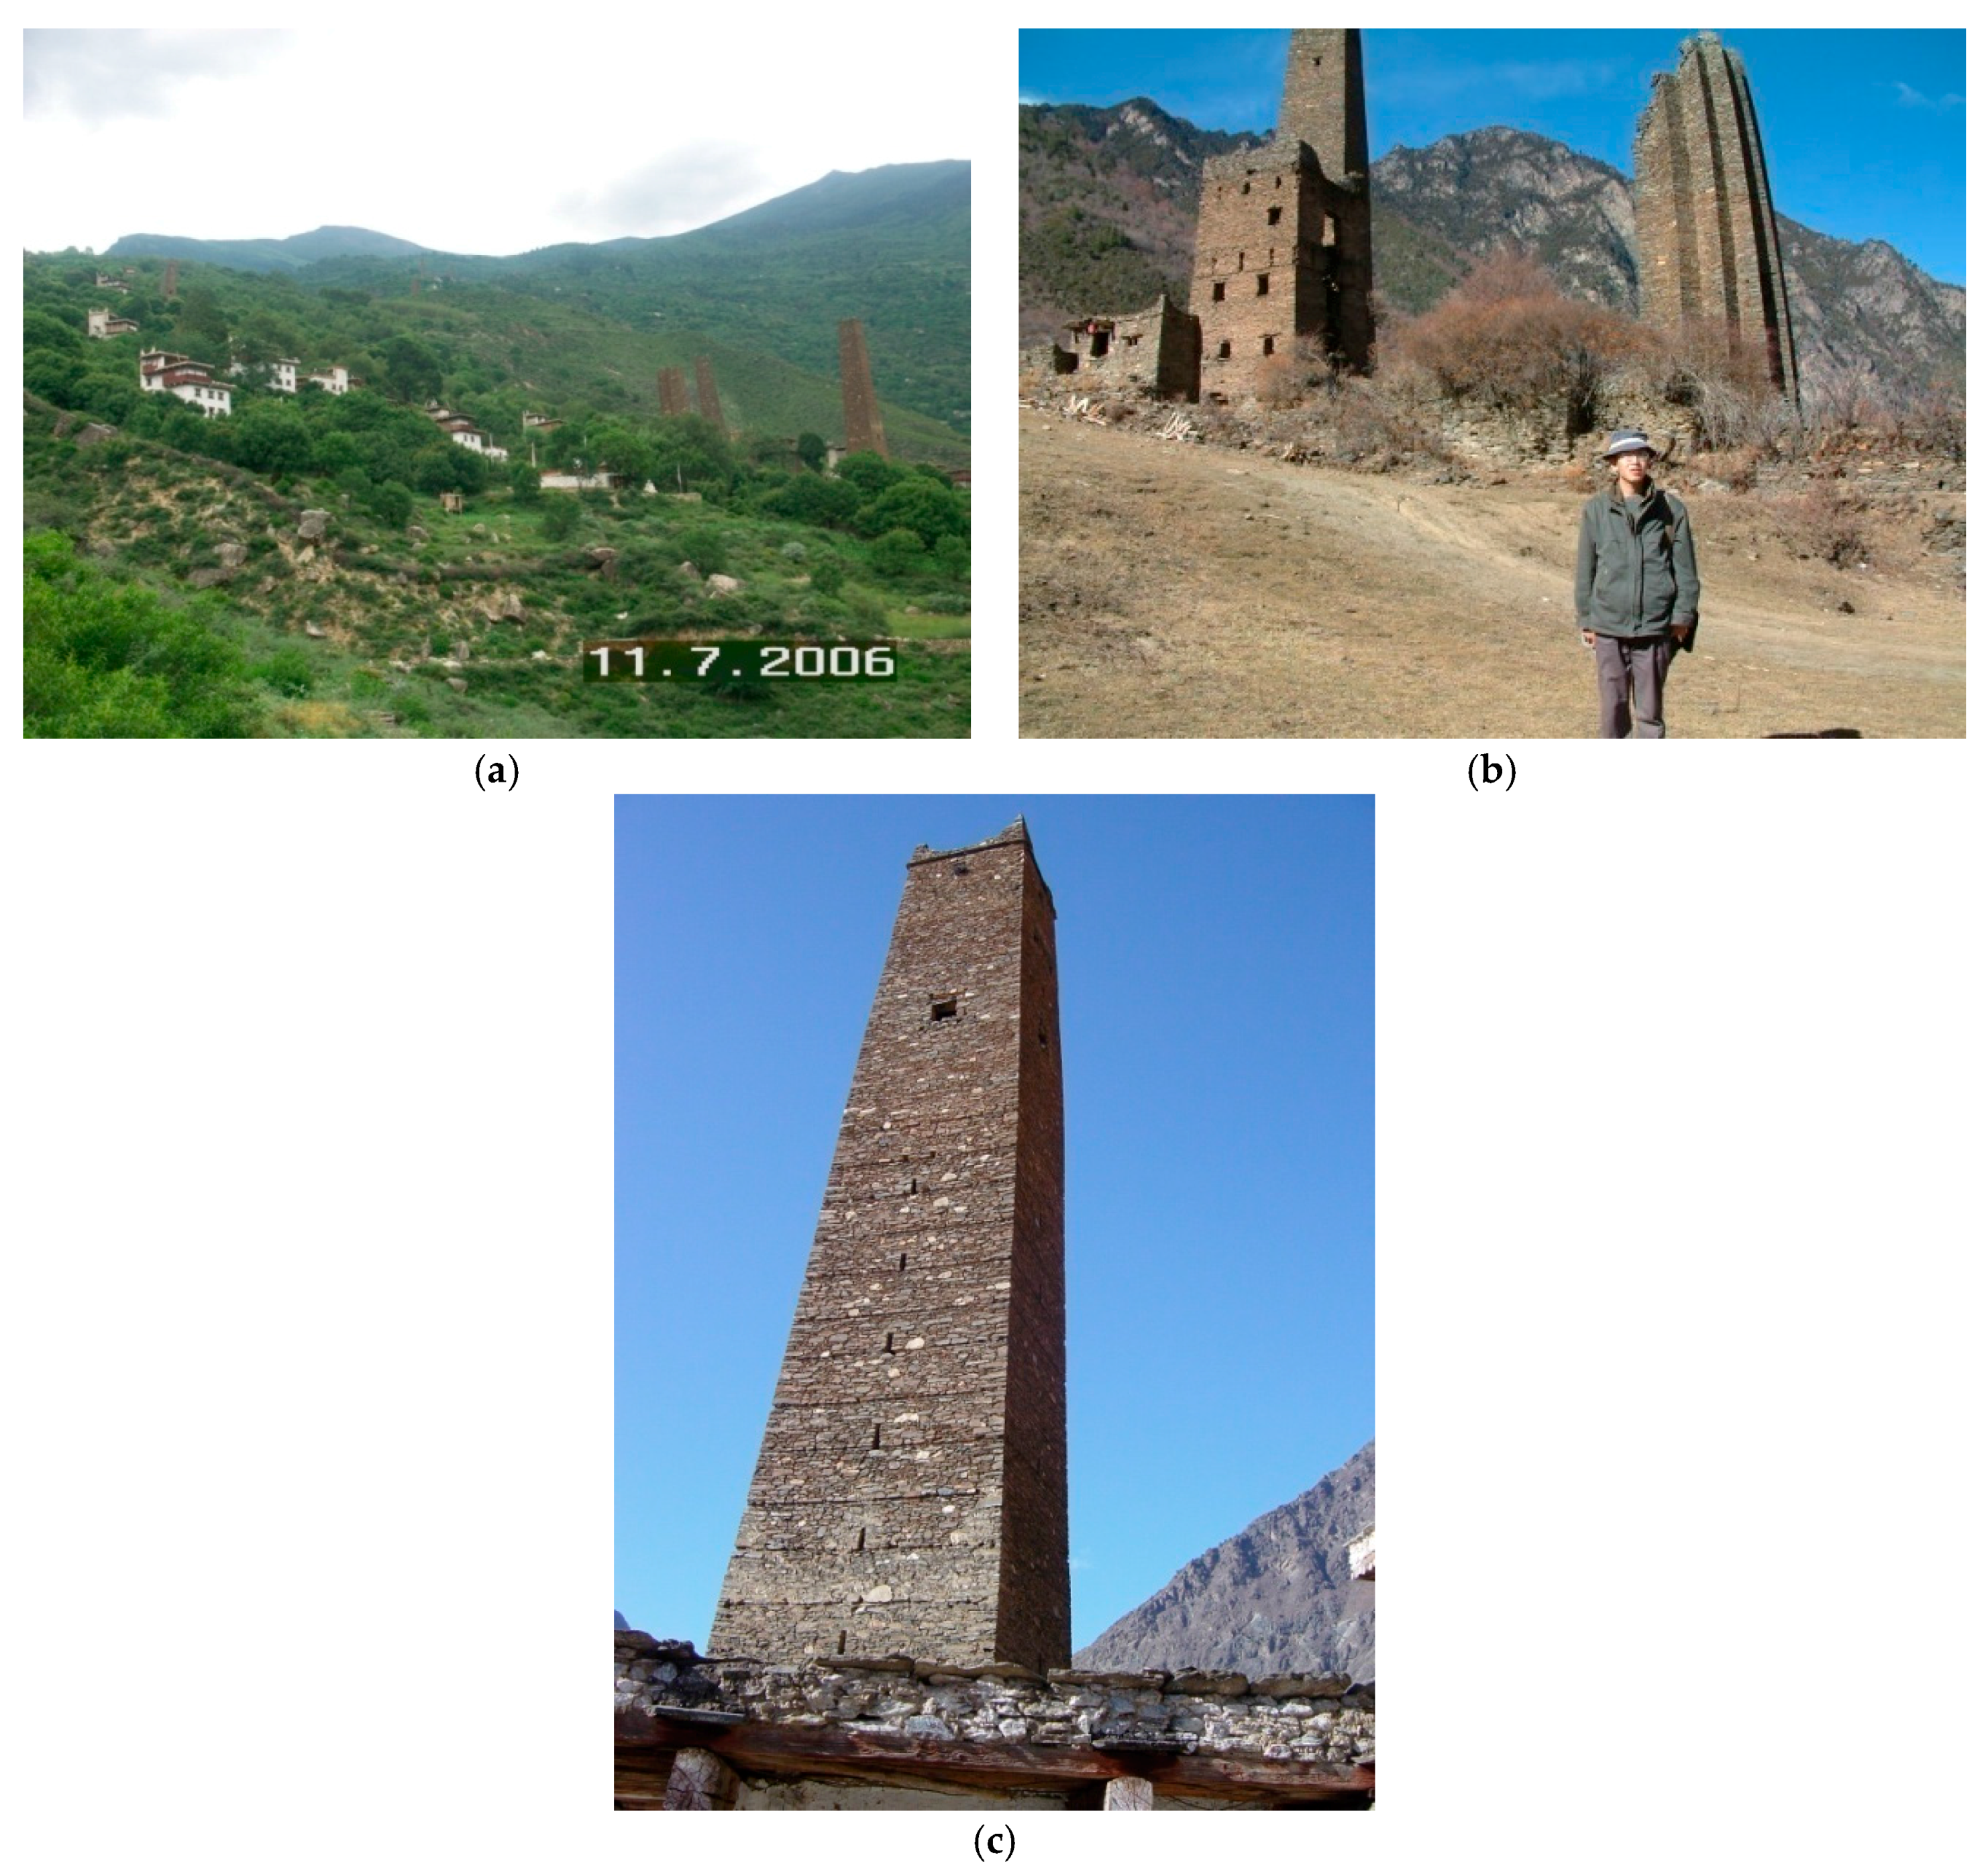
The ancient Tibetan star-shaped towers located on the landslide have a history of at least 800 years according to references and written records [28,29]. Most of the existing ancient Tibetan star-shaped towers are in good condition, which indicates that the landslide has not experienced complete reactivation since the ancient Tibetan star-shaped towers were constructed, even though there have been almost 80 earthquakes that have occurred during this period with magnitude scales above Ms 5.0, according to Chinese historical earthquake records [35] and annual rainstorms during the rainy season. This also implies that the landslide has not undergone a major reaction even under scenarios of rainstorms or earthquakes since the ancient Tibetan star-shaped towers were built on it.
Furthermore, to understand the stability and deformation of the landslide at present, InSAR technique was used. As it uses synthetic radar imaging theory and electromagnetic wave interferometric technology, differential synthetic aperture radar interferometry (DInSAR) is a powerful remote-sensing tool for ground deformation monitoring [36]. Conventional DInSAR mainly analyzes the interferometric phase of one pair of SAR images. Many studies have shown that the surface displacement of landslides can be derived with DInSAR when the interferometric pair maintains good coherence [37,38,39,40,41]. However, conventional DInSAR is often limited by some factors, such as inaccurate Digital Elevation Model (DEM), atmospheric disturbance, and vegetation changes [42], especially in landslide areas. After the introduction of time series analysis, many advanced DInSAR methods focusing on the phase information of highly coherent targets have been developed and applied [43,44,45,46].
We used 20 ALOS(Advanced Land Observing Satellite) PALSAR (Phased Array type L-band Synthetic Aperture Radar) images acquired in FBD (Fine Beam Dual Polarization) or FBS (Fine Beam Single Polarization), covering the time span from December 2006 to January 2011. With the image 20090930 selected as the super master image, the parameters of the dataset are shown in Table 2. SRTM (Shuttle Radar Topography Mission) DEM data with a resolution of about 30 m was used to remove the topographic phase. To deal with the ALOS PALSAR images, ENVI (the Environment for Visualizing Images) and SARscape (Synthetic Aperture Radar, SAR) software were applied. The Small Baseline Subsets (SBAS) method was applied to analyze the time series SAR data [43].
The SBAS processing strategy is concisely summarized as below.
(1)
Connection graph generation. The space, time and Doppler baselines of all possible image pairs were estimated. According to the principle of small baseline, a super master image and the retained pairs were decided. The temporal and perpendicular baseline was plotted as the connection graph.
(2)
Generation of differential interferograms. The other SAR images were co-registered to the super master image and interferometry was performed on the image pairs. Based on the satellite state vectors and DEM, we subtracted the parts of the interferometric phase due to viewing geometry and topography. After adapted filtering, the differential phases were simplified by the Minimum Cost Flow (MCF) algorithm.
(3)
Refinement of space baselines. Based on the selection of ground control points, the space baselines of all the pairs were refined and the differential interferograms were re-produced and re-unwrapped.
(4)
Selection of coherent pixels. According to the coherence maps of all interferometric pairs, the pixels with high coherence in the time series datasets were chosen as coherent pixels, whose phase information would be analyzed later on.
(5)
First inversion. Applying the linear movement model and singular value decomposition (SVD) algorithm, the deformation velocity and height error of coherent pixels were calculated. At the same time, the atmospheric phase screen (APS) of every pair was generated.
(6)
Second inversion. After the subtraction of APS and the residual phase corresponding to height error, the retained differential phases of coherent pixels were calculated again. Finally, the deformation history and the ensemble coherence in the time series datasets of all coherent pixels were produced. The FBD images are interpolated in order to get the same pixel size with FBS images. After this, all the images are co-registered to the super master image. While selecting the small baseline interferograms, the threshold for normal baseline was set to 8 percent of the critical baseline and the threshold for time baseline to 1200 days. At last, 54 interferometric pairs were processed for SBAS analysis.
It should be noted that the displacement results of InSAR are in direction of the line of sight. Thus, we have derived the relative deformation since 23 December 2006. In this paper, we listed four deformation maps of the landslide on 25 September 2007 (Figure 12A), 12 May 2008 (Figure 12B), 30 September 2009 (Figure 12C), and 3 October 2010 (Figure 12D), respectively. It can be seen that the deformation mainly occurred in the upstream side (above El. 2020 m) and the head area (above El. 2200 m). Meanwhile, there was a little stronger deformation zone at an elevation range of 2060–2100 m. In general, the deformation decreases gradually from the head area to the toe area. All these are consistent with the conclusion from the ground survey.
Then, the average deformation rate over the landslide from the acquired time 23 December 2006 to 3 January 2011 was successfully mapped, as shown in Figure 12E.
It can be seen that the deformation rate has a value in the range of 1–39 mm/yr, while the head area and the right side near the deep gully has a higher value of 26–35 mm/yr. This rate reduces gradually from the head to the toe area. All cracks located in the area have a higher deformation rate value (Figure 12). At the same time, we noticed that the deformation rate reached by the InSAR technique has a close relationship with local topography, as a steeper local slope resulted in a higher deformation rate. The deformation direction varied with local topography. All these may indicate that some potential small shallow landslides are developing on the deep-seated landslide, with the deep-seated landslide not showing a major and overall reaction along the sliding zone.
It should be pointed out that significant deformation can be still observed above an elevation of 2325 m, in the area outside of the landslide, with a maximum deformation rate of 39 mm/yr in Figure 12. According to field investigations, there are some small landslides developed in the loose deposits formed by continuous rock fall from the steep cliff, with an elevation of above 2325 m. Between the small landslides and the deep-seated landslide we discussed, there is a tableland developed, as mentioned in Section 2.
Two points of P1 (with an elevation of 2272 m) and P2 (with an elevation of 2060 m) were selected respectively, as marked in Figure 12, with the deformation variations from 23 December 2006 to 3 January 2011 from ALOS PALSAR data being shown in Figure 13. It can be seen that the two points have similar deformation courses, although the deformation of P1 is slightly larger than the corresponding value of P2, with the rate of the former also being slightly higher than that of the latter. P1 had its maximum deformation of 153.40 mm in October 2010, while correspondingly P2 has had a slightly smaller value of 131.17 mm, with a total difference of 22.23 mm.
The two points deformed downward continuously except the abnormal deformation from 12 May to 12 November in 2008. This abnormal deformation would have a close connection with the Wenchuan earthquake, occurred approximately 170 km away in the northeastern direction at that time [47]. The monitored data from InSAR was a little sparse in time series, i.e., there was no data between 25 September 2007 and 10 February 2008; meanwhile, the deformation was a little lagging behind the rainfall, so we can roughly deduce that the deformation of the study site has some relations to rainfall data. The deformation increases of these two points occurred during or immediately after the rainy season (August to February) were often larger than the corresponding values occurring from February to July, as the deformation of P1 had a sharp increase of 26.28 mm from 10 August to 25 September in 2007. This result means that the reaction has some correlations with precipitation. This is also consistent with the occurrences of the cracks immediately after the rainstorm events as mentioned in Section 2.
The InSAR result indicates differential displacements are common after a large landslide, while their pattern sheds light on the mechanical behavior of the unstable slope. This mechanical behavior involves the landslide being reactivated, with this reactivation having some relation to the seasonal rainstorm. Furthermore, the upslope, especially at an elevation over 2070 m is continuously deforming and is pushing on the downslope area to deform it gradually. Therefore, the state of the toe area is very vital for the stability of the whole landslide. It can be expected that the coming impoundment of the reservoir will increase the pore pressure of the rupture zone at the toe area, which will reduce the resistance and inevitably speed up the reaction of the landslide.

7. Conclusions

In summary, we have the following conclusions:
(1)
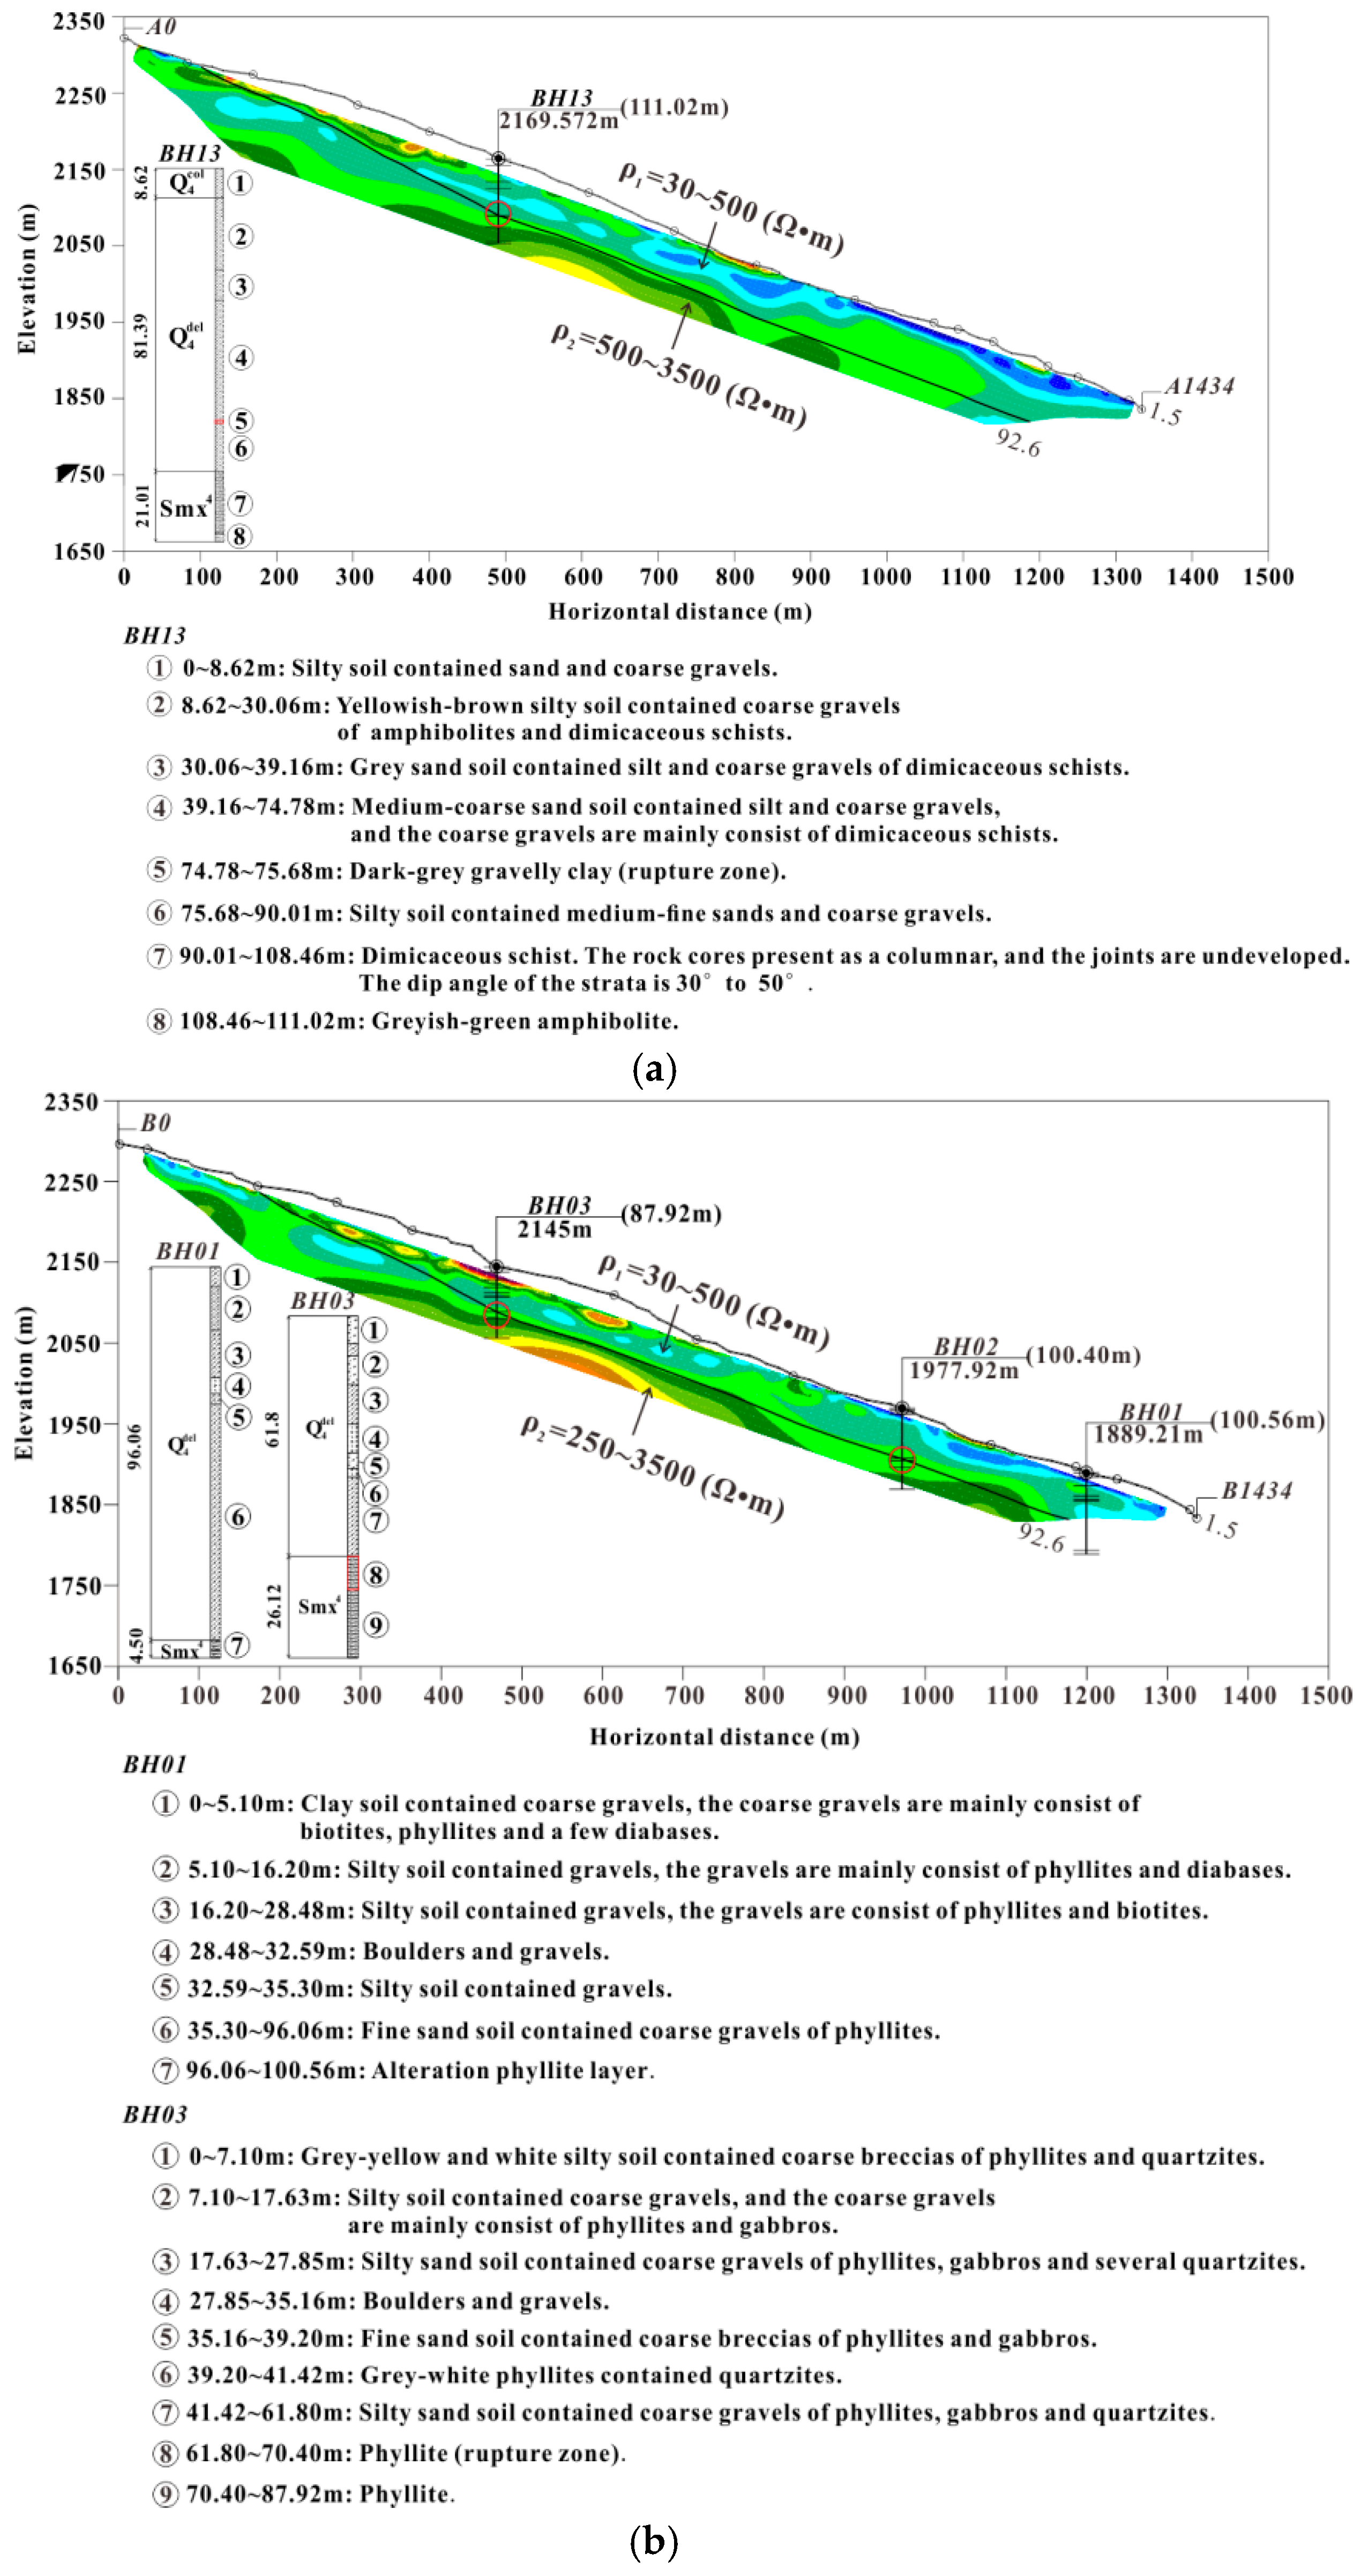
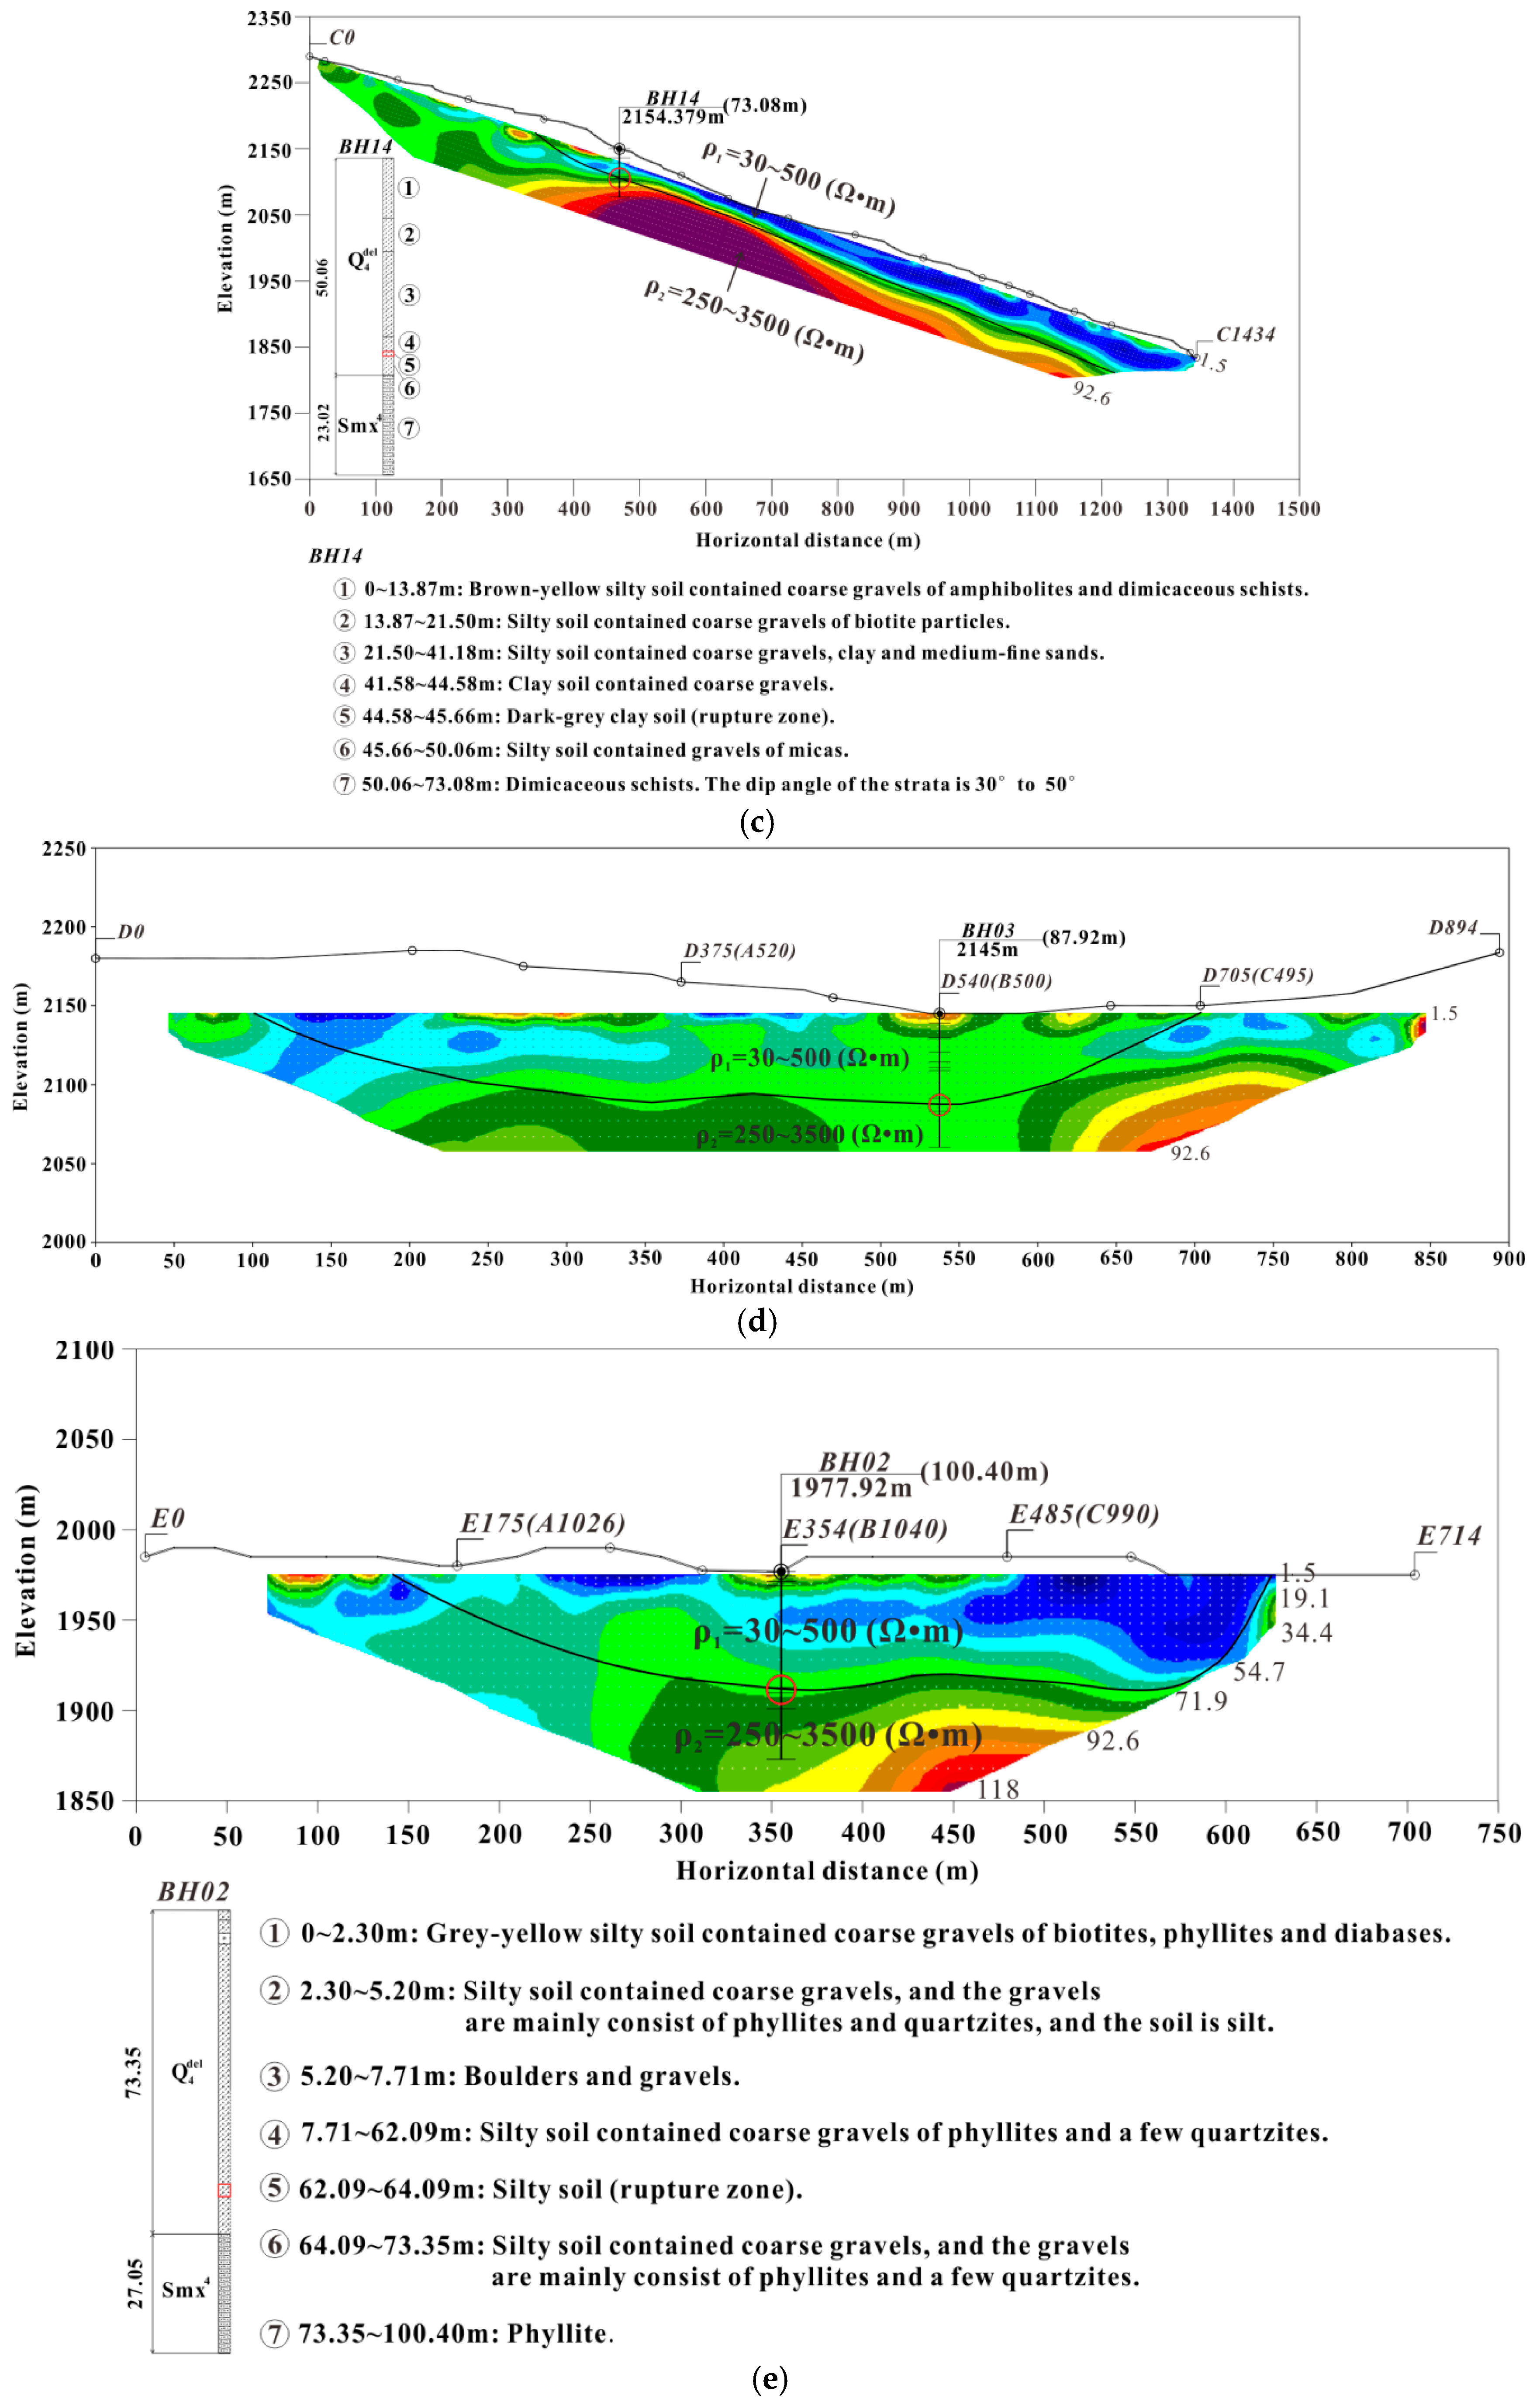
The slope investigated is covered by loose deposit, which has a thickness of 70–90 m. These thick loose deposits on the slope were formed by an ancient deep-seated landslide, which began along a weak layer of micaceous schist in the bedrock. The landslide probably occurred during the late era of the Pleistocene period about 10,000–30,000 years ago as a result of deep incision of the Dadu River.
(2)
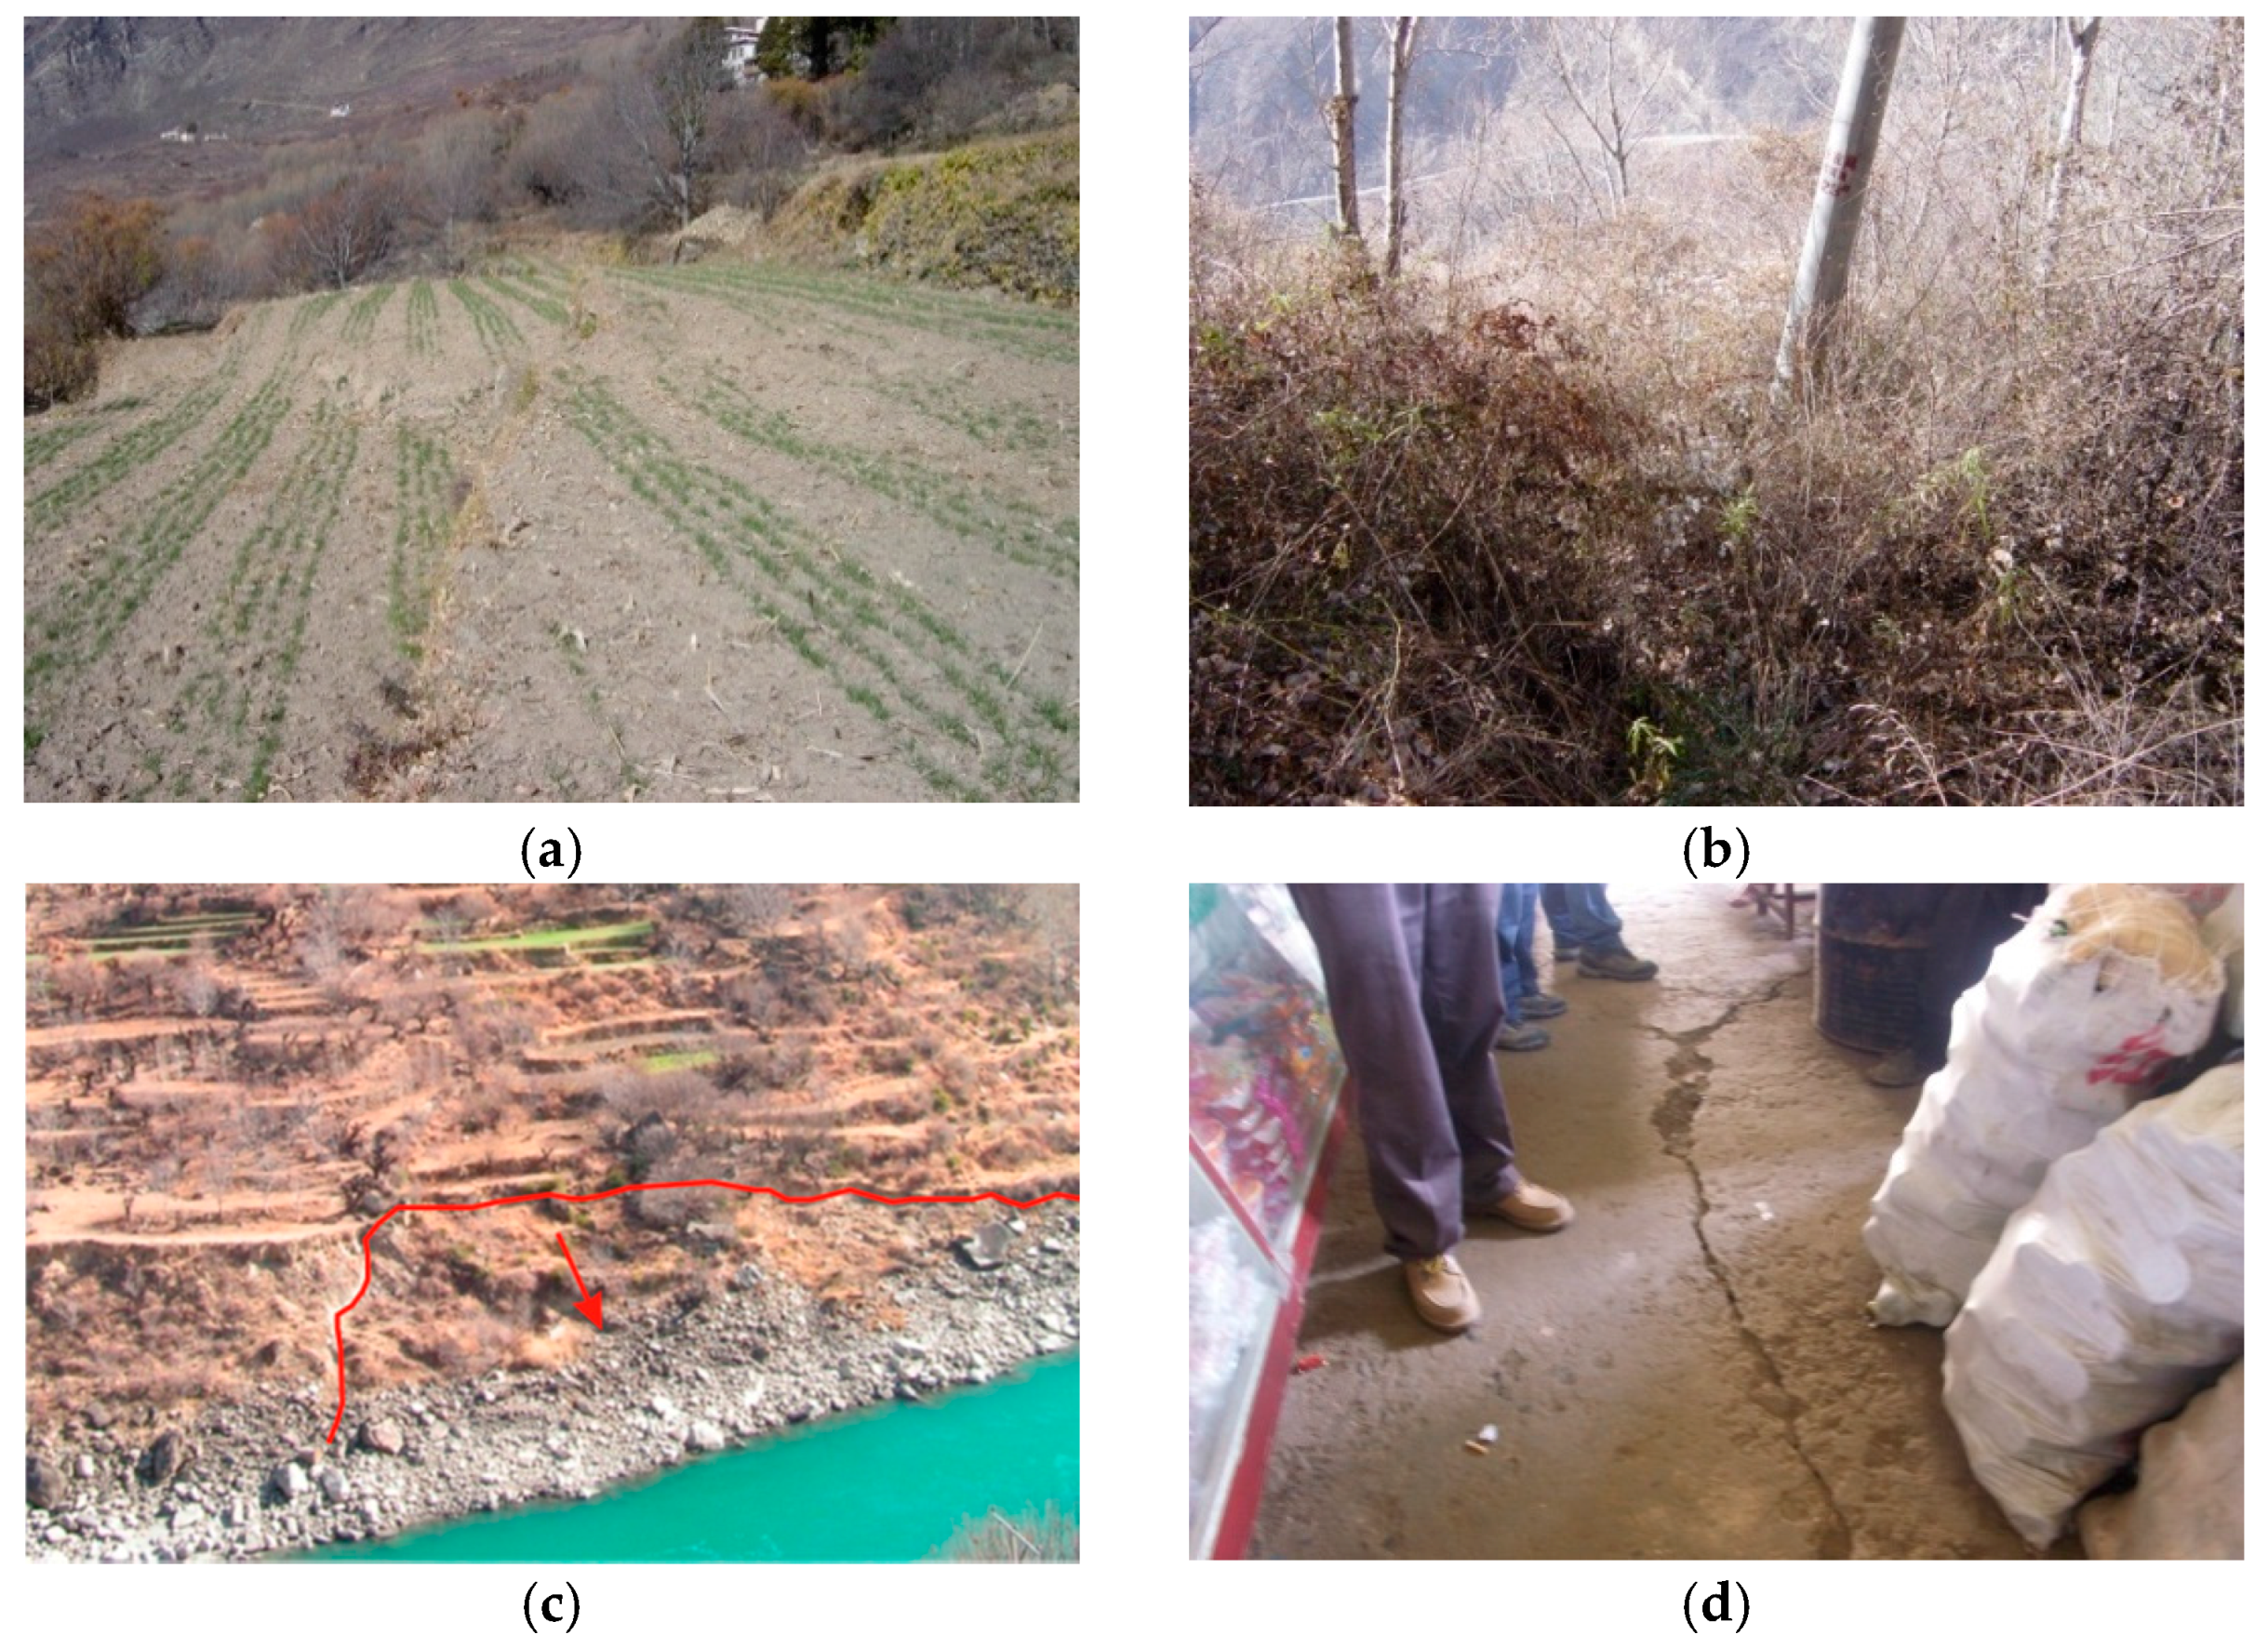
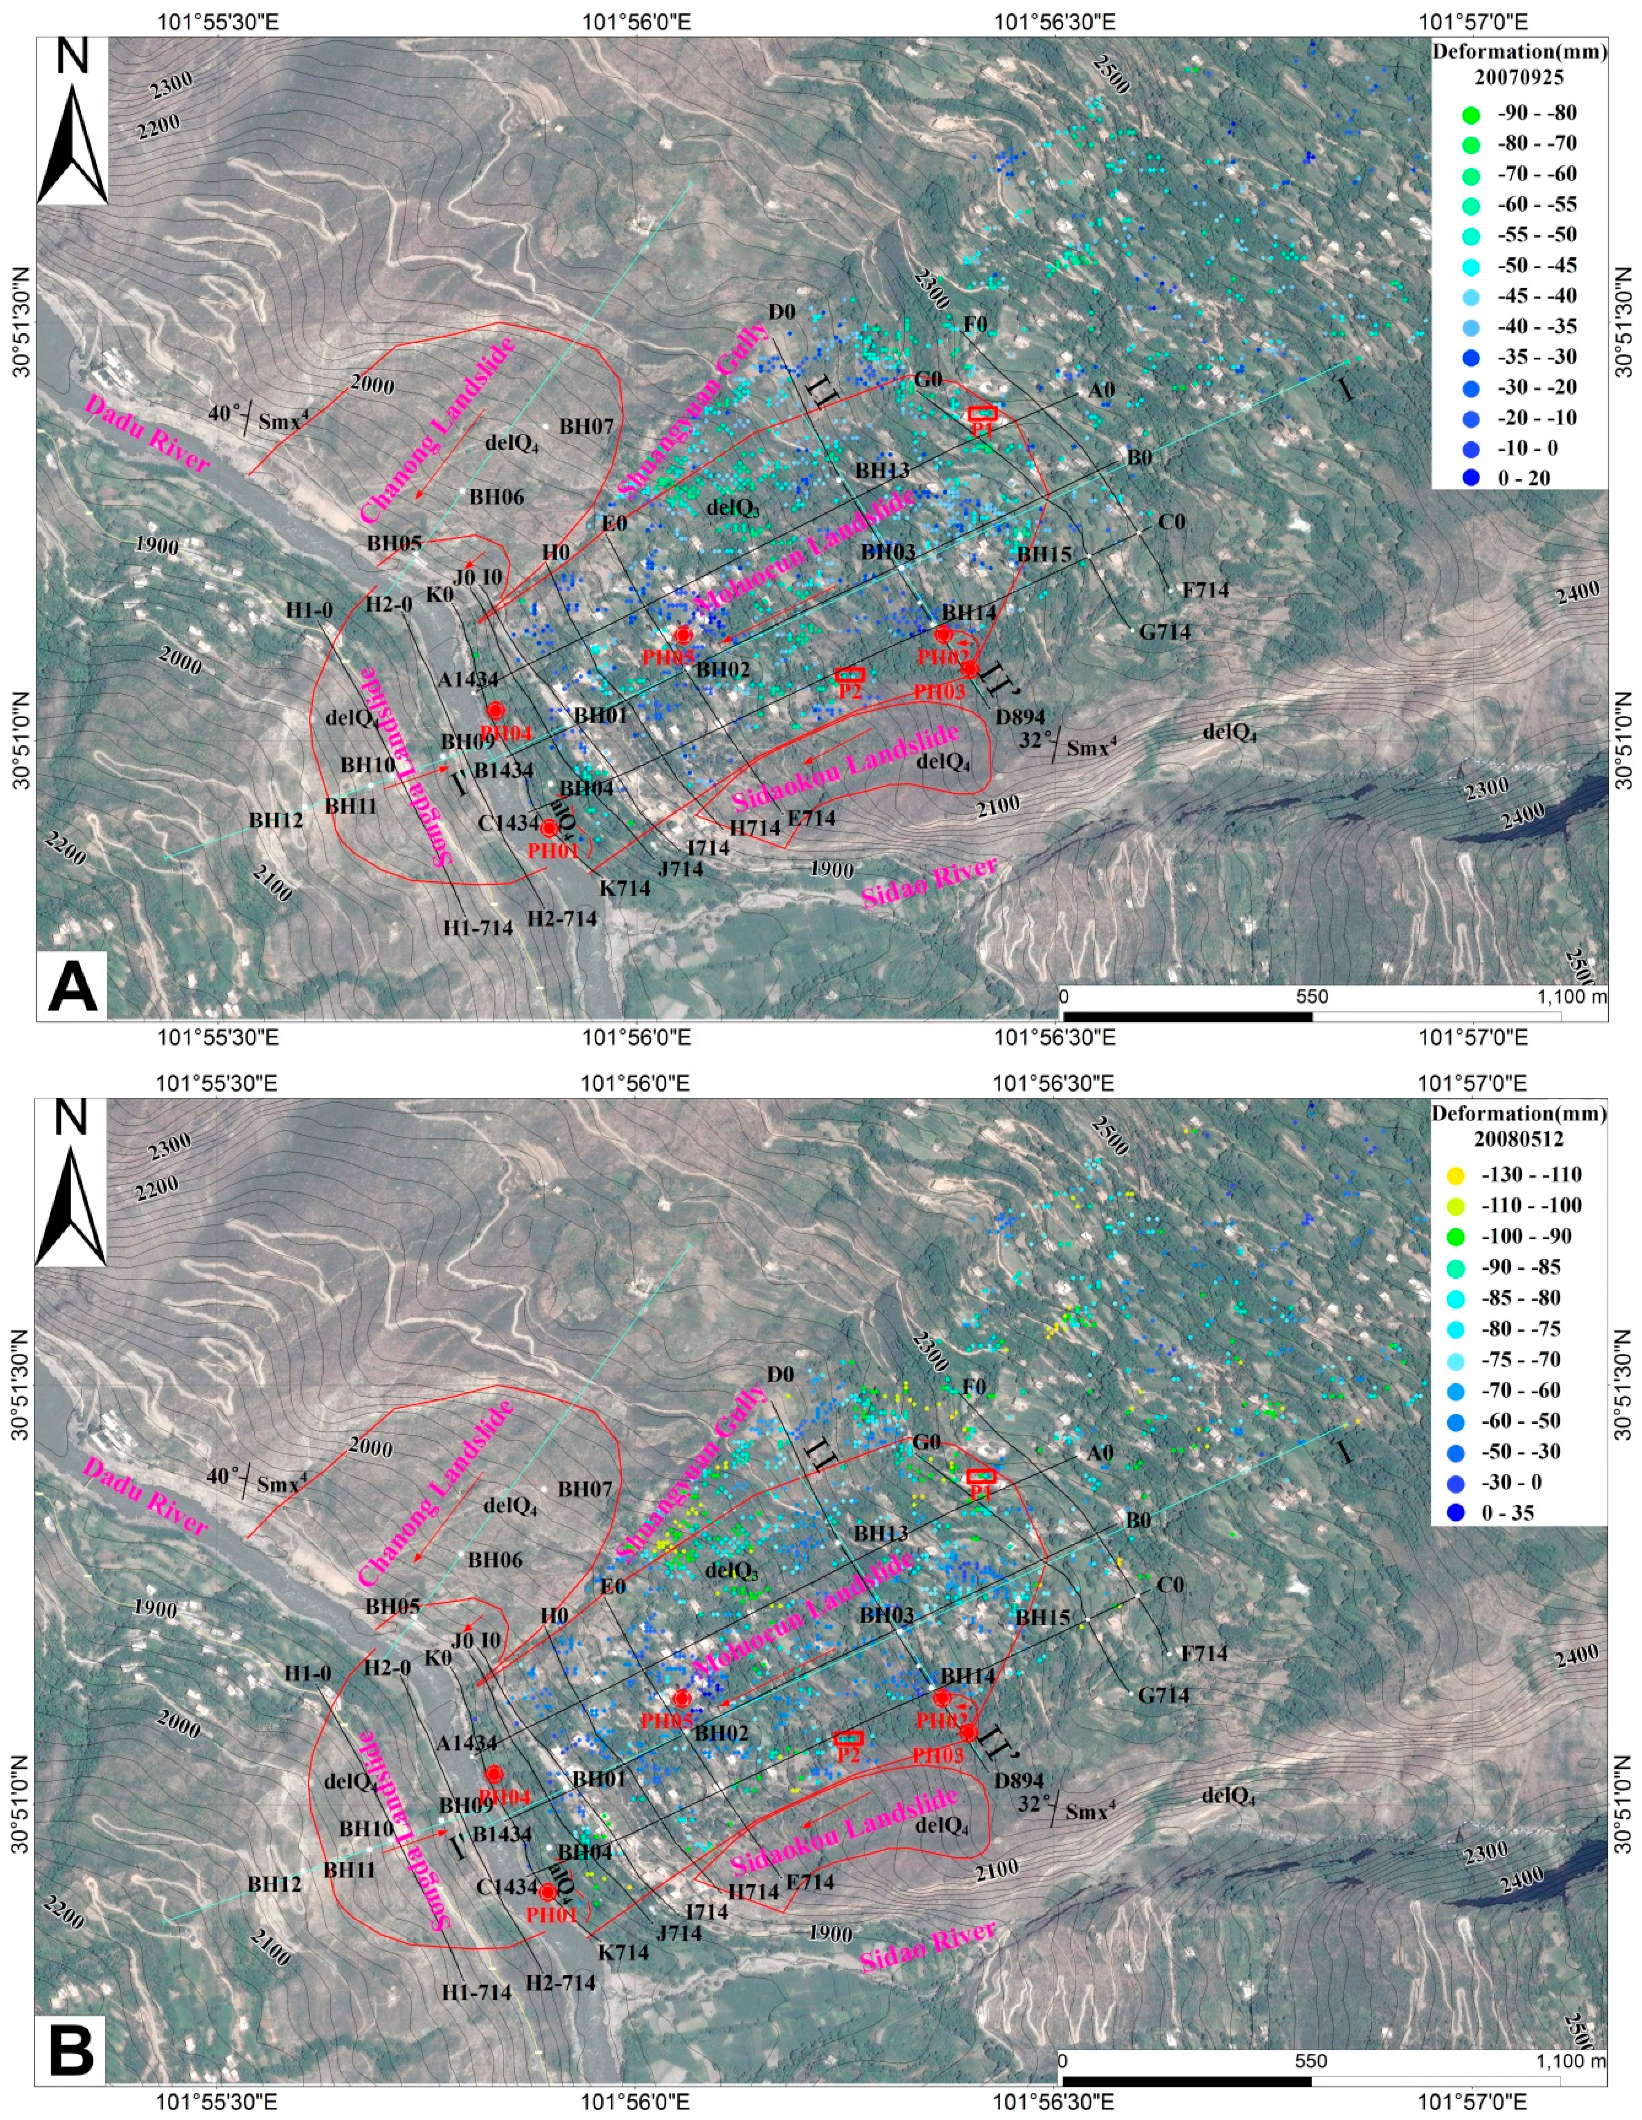
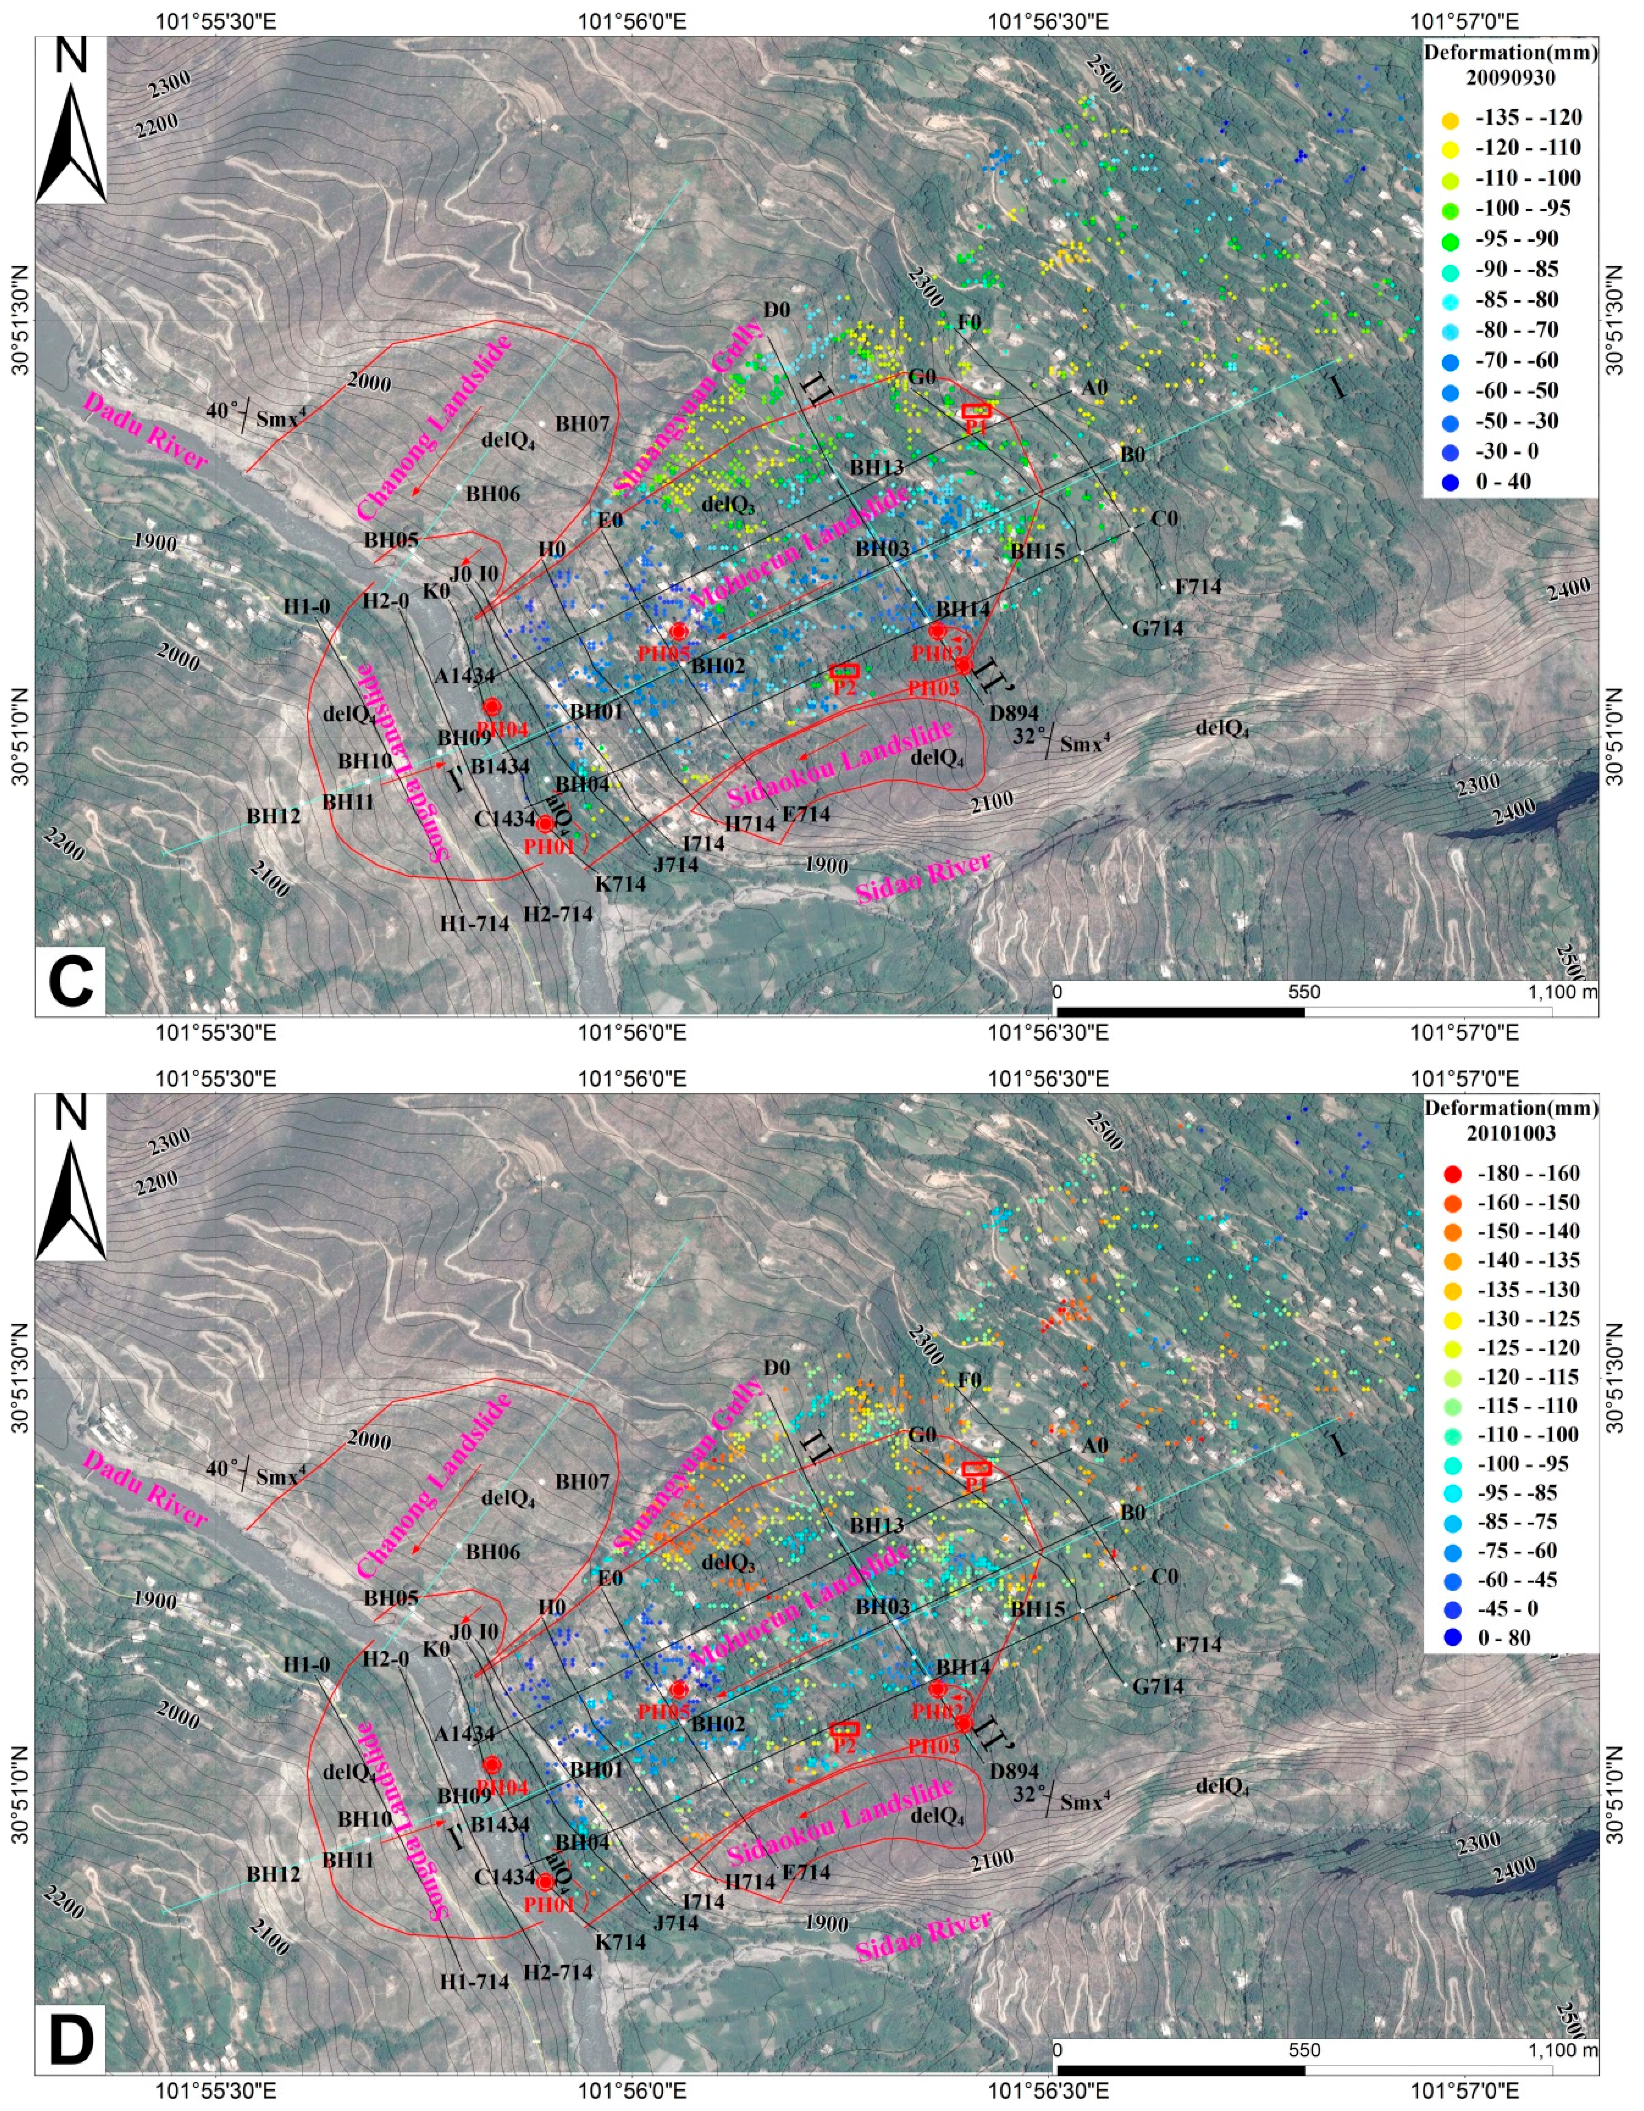
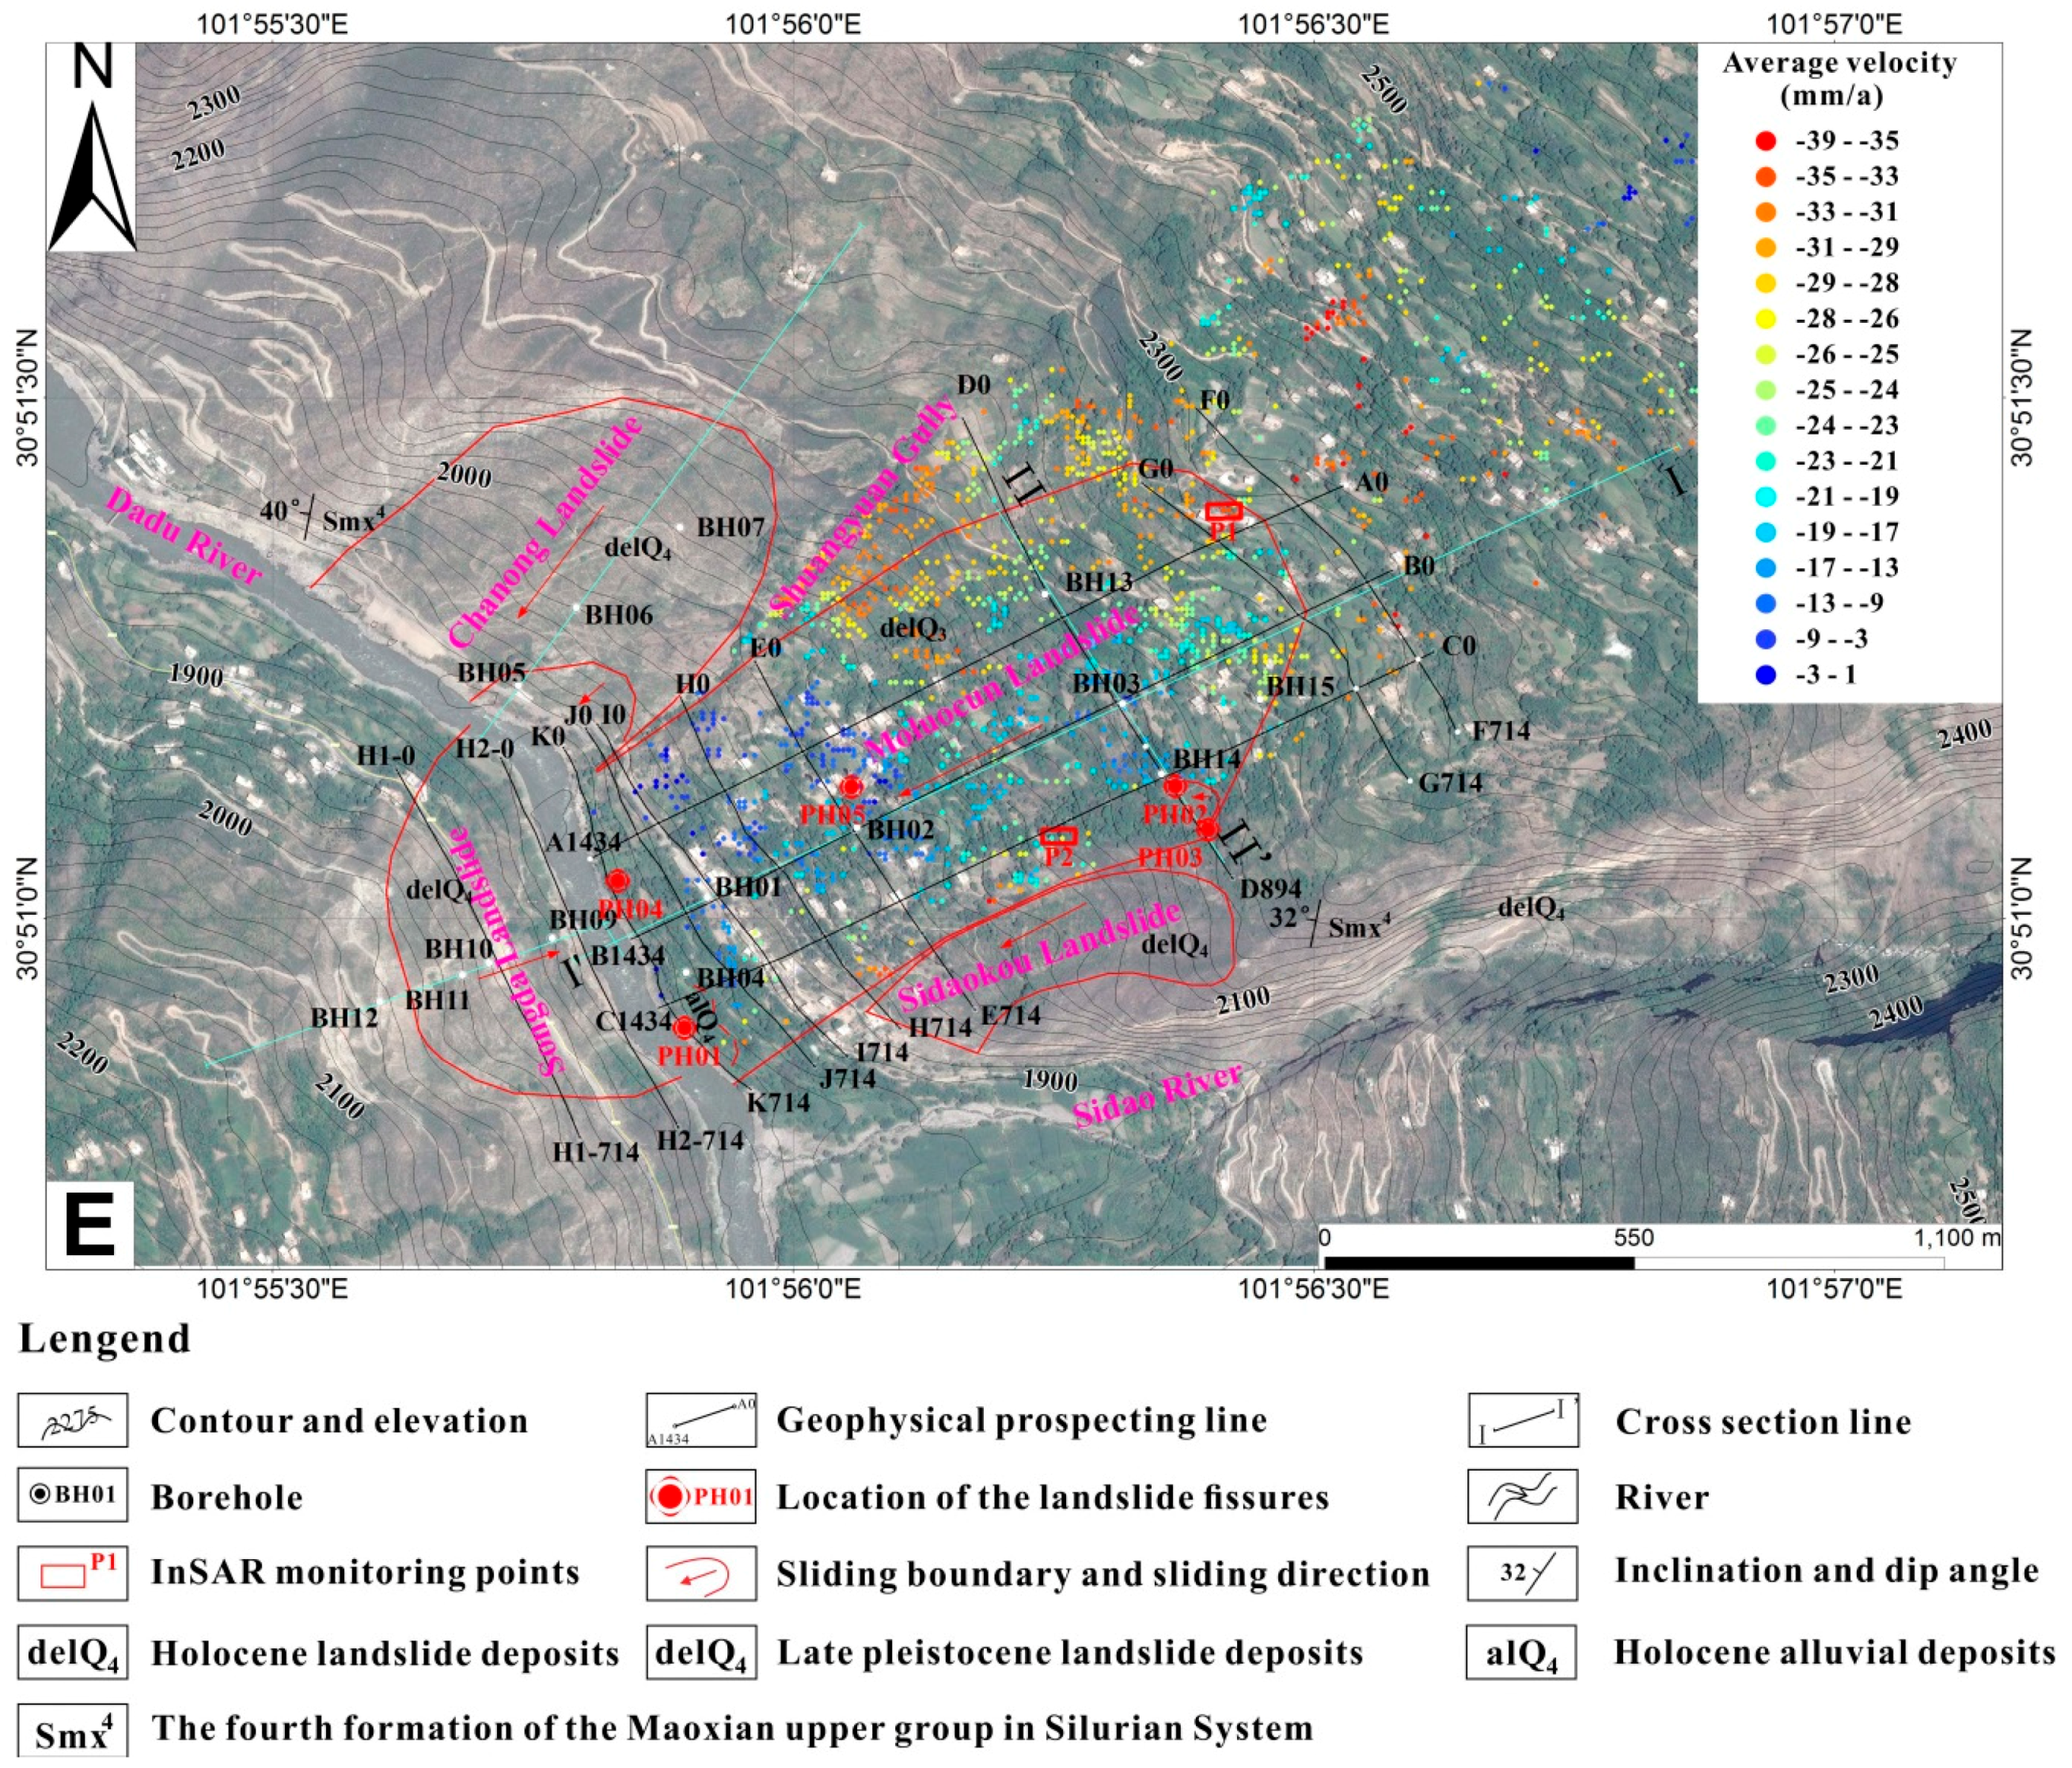
The results from geological and geomorphological analysis incorporated with InSAR technology indicated that the slope is deformable, although it has not shown a major reaction since the ancient Tibetan star-shaped tower were built. The reaction of the landslide is related to the seasonal rainstorm.
(3)
Some ancient star-shaped towers are tilted due to local uneven deformation of the landslide. To protect these valuable and unique cultural heritages, increased attention should be paid to prevent uneven deformation and the partial disaggregation of the landslide.
(4)
The toe of the landslide has a significant effect in preventing the major reaction of the landslide. Thus, it is important to protect the toe area from erosion due to unreasonable regulation and controlling, i.e., quick drawdown. Some bank protection measures, such as rock armor, should be adopted in this area. Some long-term monitor measures, such as benchmarks, borehole inclinometers, piezometers and rain gauges, should be installed to provide a deep understanding of the state of this important slope. Meanwhile, a further comprehensive stability study should be carried out after detailed analysis on the strength and permeability of the slope material, especially in the rupture zone.

Acknowledgments

The authors give thanks to three anonymous reviewers for their detail and constructive suggestions, which greatly improved the quality of the manuscript. The authors also give thanks to Profs. Zhang Nianxue and Qu Yongxing from the Institute of Geology and Geophysics, Chinese Academy of Sciences, and Prof. Li Wenggang from Chengdu Engineering Co Ltd., China Power, for their kind help during fieldwork, as well as engineers Chen Qiujin, Deng Shubin, and Xu Enhui from ESRI China Information Technology Co. Ltd., and Paolo Pasquali from the Switzerland SARMAP Company for ENVI and SARScape software test. This research is supported by funds from the National Natural Science Foundation of China under Grants Nos. 41322020 and 41672307 and the Chinese Academy of Science under Grants of KFJ-EW-STS-094.

Author Contributions

Shengwen Qi, Faquan Wu, Changgen Yan, Mingdong Zang, and Yu Zou conducted several field investigations; Shengwen Qi, Yu Zou, Mingdong Zang, and Shishu Zhang analyzed the regional geology, geomorphology, borehole data, and data from the high-density electric resistivity method; Jinghui Fan and Ruyi Wang analyzed the InSAR data; Shengwen Qi drafted the manuscript and prepared some of the figures; Yu Zou and Mingdong Zang prepared some of the figures.

Conflicts of Interest

The authors declare no conflicts of interest.

References

  1. Jones, F.O.; Embody, D.R.; Peterson, W.L.; Hazlewood, R.M. Landslides along the Columbia River Valley. Northeastern Washington, With a Section on Seismic Surveys; U.S. Geological Survey: Washington, DC, USA, 1961.
  2. Müller, L. The rock slide in the Vajont Valley. Rock Mech. Eng. Geol. 1964, 4, 148–212. [Google Scholar]
  3. Breth, H. The dynamics of a landslide produced by filling a reservoir. In Proceedings of the 9th International. Congress on Large Dams, Istanbul, Turkey, 4–8 September 1967; pp. 37–45. [Google Scholar]
  4. Jin, D.L.; Wang, G.F. Tangyanguang landslide in Zhexi Reservoir, Hunan Province, China. In Typical Landslides Occurred in China; Science Press: Beijing, China, 1988; pp. 301–307. (In Chinese) [Google Scholar]
  5. Wang, F.W.; Zhang, Y.M.; Huo, Z.T.; Matsumoto, T.; Huang, B.L. The July 14, 2003 Qianjiangping landslide, Three Gorges Reservoir, China. Landslides 2004, 1, 157–162. [Google Scholar] [CrossRef]
  6. Yin, Y.P.; Peng, X.M. Failure mechanism on Qianjiangping landslide in the Three Gorges Reservoir region. Hydrogeol. Eng. Geol. 2007, 34, 51–54, (In Chinese with English Abstract). [Google Scholar]
  7. Wang, F.; Zhang, Y.; Huo, Z.; Peng, X.; Wang, S.; Yamasaki, S. Mechanism for the rapid motion of the Qianjiangping landslide during reactivation by the first impoundment of the Three Gorges Dam reservoir, China. Landslides 2008, 5, 379–386. [Google Scholar] [CrossRef]
  8. Xu, G.; Li, W.; Yu, Z.; Ma, X.; Yu, Z. The 2 September 2014 Shanshucao landslide, Three Gorges Reservoir, China. Landslides 2015, 12, 1169–1178. [Google Scholar] [CrossRef]
  9. Committee on Reservoir Slope Stability Reservoir Landslides. Investigation and Management; International Commission on Large Dams (ICOLD): Paris, France, 2002. [Google Scholar]
  10. Schuster, R.L. Reservoir-induced landslides. Bull. Eng. Geol. Environ. 1979, 20, 8–15. [Google Scholar] [CrossRef]
  11. Liao, H.; Ying, J.; Gao, S.; Sheng, Q. Numerical analysis on slope stability under variations of reservoir water level. In Landslides, Risk Analysis and Sustainable Disaster Management; Sassa, K., Fukuoka, H., Wang, F., Wang, G., Eds.; Springer: Berlin, Germany, 2005; pp. 305–311. [Google Scholar]
  12. Zangerl, C.; Eberhardt, E.; Perzlmaier, S. Kinematic behaviour and velocity characteristics of a complex deep-seated crystalline rockslide system in relation to its interaction with a dam reservoir. Eng. Geol. 2010, 112, 53–67. [Google Scholar] [CrossRef]
  13. Barla, G.; Paronuzzi, P. The 1963 Vajont landslide: 50th anniversary. Rock Mech. Rock Eng. 2013, 46, 1267–1270. [Google Scholar] [CrossRef]
  14. Paronuzzi, P.; Rigo, E.; Bolla, A. Influence of filling-drawdown cycles of the vajont reservoir on Mt. Toc slope stability. Geomorphology 2013, 191, 75–93. [Google Scholar] [CrossRef]
  15. Semenza, E. The Vajont Gorge. Preliminary Geological Study; SADE: Venice, Italy, 1959. [Google Scholar]
  16. Chowdhury, R.N. Aspects of the Vajont slide. Eng. Geol. 1987, 24, 533–540. [Google Scholar] [CrossRef]
  17. Qi, S.; Yan, F.; Wang, S.; Xu, R. Characteristics, mechanism and development tendency of deformation of Maoping landslide after commission of Geheyan reservoir on the Qingjiang River, Hubei Province, China. Eng. Geol. 2006, 86, 37–51. [Google Scholar] [CrossRef]
  18. Paronuzzi, P.; Bolla, A. The prehistoric vajont rockslide: an updated geological model. Geomorphology 2012, s169–s170, 165–191. [Google Scholar] [CrossRef]
  19. Garga, V.K.; Brown, J.D.; Andresen, A.; Bishop, A.W.; Green, G.E. A new ring shear apparatus and its application to the measurement of residual strength. Géotechnique 1971, 21, 273–328. [Google Scholar]
  20. Sassa, K.; Dang, K.; He, B.; Takara, K.; Inoue, K.; Nagai, O. A new high-stress undrained ring-shear apparatus and its application to the 1792 Unzen–Mayuyama megaslide in Japan. Landslides 2014, 11, 827–842. [Google Scholar] [CrossRef]
  21. Moregenstern, N. Stability charts for earth slopes during rapid drawdown. Géotechnique 1963, 13, 121–131. [Google Scholar] [CrossRef]
  22. Desai, C.S. Drawdown analysis of slopes by numerical method. J. Geotech. Geoenviron. Eng. 1977, 103, 667–676. [Google Scholar]
  23. Cousins, B.F. Stability charts for simple earth slopes. J. Geotech. Eng. Div. 1978, 104, 267–279. [Google Scholar]
  24. Corbyn, J.A. Failure of a partially submerged rock slope with particular references to the Vajont rock slide. Int. J. Rock Mech. Min. Sci. Geomech. Abstr. 1982, 19, 99–102. [Google Scholar] [CrossRef]
  25. Lane, P.A.; Griffiths, D.V. Assessment of stability of slopes under drawdown conditions. J. Geotech. Geoenviron. Eng. 2000, 126, 443–450. [Google Scholar] [CrossRef]
  26. Paronuzzi, P. La lezione del Vajont: L’abbiamo veramente compresa? Geoitalia 2009, 29, 4–10. [Google Scholar]
  27. ISRM. International Society for Rock Mechanics commission on standardization of laboratory and field tests: Suggested methods for the quantitative description of discontinuities in rock masses. Int. J. Rock Mech. Min. Sci. Geomech. Abstr. 1978, 15, 319–368. [Google Scholar]
  28. Darragon, F. Secret Towers of the Himalayas; Shenzhen Newspaper Press: Shenzhen, China, 2005. [Google Scholar]
  29. Darragon, F. The star-shaped towers of the tribal corridor of southwest China. J. Camb. Stud. 2009, 4, 67–82. [Google Scholar]
  30. IAEG-International Association. Engineering Geology Commission on Landslides. Suggested Nomenclature for Landslides. IAEG Bull. 1990, 41, 13–16. [Google Scholar]
  31. Xu, Q.; Chen, W.; Jin, H.; Zhang, Z. Characteristics and distribution of thick overburdens along Dadu River Valley. Quat. Sci. 2010, 30, 30–36, (In Chinese with English Abstract). [Google Scholar]
  32. Wang, Y.; Huang, R.; Luo, Y.; Su, O. An intensive erosion event in the last glaciation in the west of China. J. Chengdu Univ. Technol. 2006, 33, 73–75, (In Chinese with English Abstract). [Google Scholar]
  33. Sun, Y.; Wang, Y.; Wu, J.; Wang, X.; Shao, H.; Hu, Q. Characteristics and genetic mechanism of a deep overlay and it associated unloading and relaxation zone in the base of river valley of a hydroelectric station in Southwestern China. Chin. J. Eng. Geol. 2008, 16, 169–172, (In Chinese with English Abstract). [Google Scholar]
  34. Porter, S.C.; An, Z. Correlation between climate events in the North Atlantic and China during the last glaciation. Nature 1995, 375, 305–308. [Google Scholar] [CrossRef]
  35. Institute of Geology, China Earthquake Administration. Research report of Earthquake Intensity Determination at the Houziyan Dam Site of the Dadu River 1994; Institute of Geology, China Earthquake Administration: Beijing, China, 1994. (In Chinese) [Google Scholar]
  36. Gabriel, A.K.; Goldstein, R.M.; Zebker, H.A. Mapping small elevation changes over large areas: Differential radar interferometry. J. Geophys. Res. 1989, 94, 9183–9191. [Google Scholar] [CrossRef]
  37. Jebur, M.N.; Pradhan, B.; Tehrany, M.S. Detection of vertical slope movement in highly vegetated tropical area of Gunung pass landslide, Malaysia, using L-band InSAR technique. Geosci. J. 2014, 18, 61–68. [Google Scholar] [CrossRef]
  38. Nikolaeva, E.; Walter, T.R.; Shirzaei, M.; Zschau, J. Landslide observation and volume estimation in central Georgia based on L-band InSAR. Nat. Hazards Earth Syst. Sci. 2014, 14, 675–688. [Google Scholar] [CrossRef]
  39. Peyret, M.; Djamour, Y.; Rizza, M.; Ritz, J.F.; Hurtrez, J.E.; Goudarzi, M.A.; Nankali, H.; Chery, J.; Le Dortz, K.; Uri, F. Monitoring of the large slow Kahrod landslide in Alborz mountain range (Iran) by GPS and SAR interferometry. Eng. Geol. 2008, 100, 131–141. [Google Scholar] [CrossRef]
  40. Rizzo, V.; Iodice, A. Satellite differential SAR interferometry for the evaluation of effects of hydrogeological disasters: Definition of a scale for damage evaluation. Ann. Geophys. 2006, 49, 253–260. [Google Scholar]
  41. Rott, H.; Schechl, B.; Siegel, A.; Grasemann, B. Monitoring very slow slope movements by means of SAR interferometry: A case study from a mass waste above a reservoir in the Ötztal Alps, Austria. Geophys. Res. Lett. 1999, 26, 1629–1632. [Google Scholar] [CrossRef]
  42. Hanssen, R.F. Radar Interferometry: Data Interpretation and Error Analysis; Kluwer Academic Publishers: Dordrecht, The Netherlands, 2001. [Google Scholar]
  43. Berardino, P.; Fornaro, G.; Lanari, R.; Sansosti, E. A new algorithm for surface deformation monitoring based on small baseline differential SAR interferograms. IEEE Trans. Geosci. Remote Sens. 2002, 40, 2375–2383. [Google Scholar] [CrossRef]
  44. Ferretti, A.; Prati, C.; Rocca, F. Permanent scatterers in SAR interferometry. IEEE Trans. Geosci. Remote Sens. 2001, 39, 8–20. [Google Scholar] [CrossRef]
  45. Hooper, A.; Zebker, H.; Segall, P.; Kampes, B. A new method for measuring deformation on volcanoes and other non-urban areas using InSAR persistent scatterers. Geophys. Res. Lett. 2004, 31, 1–5. [Google Scholar] [CrossRef]
  46. Lanari, R.; Mora, O.; Manunta, M.; Mallorqu, J.J.; Berardino, P.; Sansosti, U. A small-baseline approach for investigating deformations on full-resolution differential SAR interferograms. IEEE Trans. Geosci. Remote Sens. 2004, 42, 1377–1386. [Google Scholar] [CrossRef]
  47. Qi, S.; Xu, Q.; Lan, H.; Zhang, B.; Liu, J. Spatial distribution analysis of landslides triggered by 2008.5.12 Wenchuan Earthquake, China. Eng. Geol. 2010, 116, 95–108. [Google Scholar] [CrossRef]
Figure 1. Location of the study area.
Remotesensing 09 00383 g001
Figure 2. Stereonet projection of discontinuities in the bedrock (Equal Angle, Lower Hemisphere). Legend is as follows: 1 = bedding plane; 2 = J1—Joint Set 1; 3 = J2—Joint Set 2; 4 = J3—Joint Set 3; 5 = J4—Joint Set 4.
Remotesensing 09 00383 g002
Figure 3. Geological map of the slope.
Remotesensing 09 00383 g003
Figure 4. (a) Rock block with size of 10 × 10 × 2 m. (b) The structure of the first river terrace (from site of PH01 in Figure 3).
Remotesensing 09 00383 g004
Figure 5. (a) A block farmland sub-divided into two blocks by a crack (from site of PH02 in Figure 3); (b) tilted powerline poles and trees on the slope (from site of PH03 in Figure 3); (c) a small circular slump at the toe of the slope (from site of PH04 in Figure 3); (d) cracks developed at the ground surface in the house of a local resident, with maximum width of 5 cm (from site of PH05 in Figure 3).
Remotesensing 09 00383 g005
Figure 6. (a) Tibetan star-shaped towers on the slope; (b) Tibetan star-shaped towers with 13 outward-pointing corners; (c) a leaning tower caused by local uneven deformation of the landslide.
Remotesensing 09 00383 g006
Figure 7. The contour map of electrical resistivity determined from multi-electrode resistivity method: (ag) show the geophysical survey lines and their interpretations.
Remotesensing 09 00383 g007aRemotesensing 09 00383 g007bRemotesensing 09 00383 g007c
Figure 8. Landslides traces found in samples from (a) borehole BH01 at a depth of 95 m and (b) borehole BH03 at a depth of 62.8 m.
Remotesensing 09 00383 g008
Figure 9. Charred wood presented at a depth of 48.16 m in borehole BH04.
Remotesensing 09 00383 g009
Figure 10. Riverbed section of the Dadu River valley (Revised after Xu et al. [31]).
Remotesensing 09 00383 g010
Figure 11. Cross-section of I–I’.
Remotesensing 09 00383 g011
Figure 12. The relative deformation since 23 December 2006 on 25 September 2007 (A); 12 May 2008 (B); 30 September 2009 (C); 3 October 2010 (D). (E) The average deformation rate of the landslide from 23 December 2006 to 3 January 2011 from ALOS PALSAR data.
Remotesensing 09 00383 g012aRemotesensing 09 00383 g012bRemotesensing 09 00383 g012c
Figure 13. Variation in deformation (mm) of two points P1 and P2 in the slope from 23 December 2006 to 3 January 2011 from ALOS PALSAR data vs. monthly precipitation (mm).
Remotesensing 09 00383 g013
Table 1. Features of discontinuities in the bedrock.
Dip (°)Dip Direction (°)Spacing
Bedding plane25–40270–280<200 mm
Joint Set 150–60140–150200–600 mm
Joint Set 275–90210–220500–1000 mm
Joint Set 370–90100–115100–300 mm
Joint Set 445–60200–210>600 mm
Table 2. Parameters of the used ALOS PALSAR data.
No.Acquired TimeNormal Baseline (m)Time Baseline (d)Image Mode
12006122320131034.51−1012FBS
220070207−128.10−966FBS
320070810539.47−782FBD
420070925570.64−736FBD
5200802101814.88−598FBS
6200803271855.50−552FBS
7200805122333.52−506FBD
820080627−87.80−460FBD
920081112−1476.38−322FBS
1020081228−1461.09−276FBS
1120090212−802.85−230FBS
1220090630−350.02−92FBD
1320090815−422.68−46FBD
142009093000FBD
1520091231553.4892FBS
1620100215965.81138FBS
17201007031553.38276FBD
18201008181634.35322FBD
19201010031866.55368FBD
20201101032144.52460FBS

