Article

Quantifying Streamflow Variations in Ungauged Lake Basins by Integrating Remote Sensing and Water Balance Modelling: A Case Study of the Erdos Larus relictus National Nature Reserve, China

Key Laboratory of Water Cycle and Related Land Surface Processes, Institute of Geographic Sciences and Natural Resources Research, Chinese Academy of Sciences, Beijing 100101, China
Submission received: 12 March 2017 / Revised: 21 May 2017 / Accepted: 7 June 2017 / Published: 10 June 2017
(This article belongs to the Special Issue Remote Sensing of Climate Change and Water Resources)

Abstract

:
Hydrological predictions in ungauged lakes are one of the most important issues in hydrological sciences. The habitat of the Relict Gull (Larus relictus) in the Erdos Larus relictus National Nature Reserve (ELRNNR) has been seriously endangered by lake shrinkage, yet the hydrological processes in the catchment are poorly understood due to the lack of in-situ observations. Therefore, it is necessary to assess the variation in lake streamflow and its drivers. In this study, we employed the remote sensing technique and empirical equation to quantify the time series of lake water budgets, and integrated a water balance model and climate elasticity method to further examine ELRNNR basin streamflow variations from1974 to 2013. The results show that lake variations went through three phases with significant differences: The rapidly expanding sub-period (1974–1979), the relatively stable sub-period (1980–1999), and the dramatically shrinking sub-period (2000–2013). Both climate variation (expressed by precipitation and evapotranspiration) and human activities were quantified as drivers of streamflow variation, and the driving forces in the three phases had different contributions. As human activities gradually intensified, the contributions of human disturbances on streamflow variation obviously increased, accounting for 22.3% during 1980–1999 and up to 59.2% during 2000–2013. Intensified human interferences and climate warming have jointly led to the lake shrinkage since 1999. This study provides a useful reference to quantify lake streamflow and its drivers in ungauged basins.

1. Introduction

Despite only covering a small fraction of land surface, lakes have been the subject of great interest as not only important sources of water supply, but also sensitive indicators of natural and anthropogenic impacts on changing environments at both regional and global scales [1,2,3,4,5,6,7]. In recent years, variations in lake size and the water level have been widely documented all over the world [8,9,10,11,12]. Numerous studies have reported that many lakes around the world are undergoing drastic size reduction, and some even disappeared due to climate change and intense anthropogenic activities (agriculture, landscape modification, dam construction, reservoir operation, etc.) [13,14,15,16,17,18]. In terms of the causes of lake change, the current research issue focuses on how to quantitatively evaluate contributions of climate change and human activities to lake variation.
Hydrological predictions in ungauged basins (PUB during 2003–2012 and the new Scientific Decade (2013–2022)) [19,20,21] have been viewed as one of the most important research fields in hydrological sciences. The dynamic changes of gauged lakes or basins can be analyzed with long-term meteorological and hydrological time series. However, for some ungauged lakes or basins in remote and poor regions, it is difficult to quantitatively assess the lake variations and causes due to the lack of in-situ monitoring data. Remote sensing technology has been widely applied for monitoring lake and wetland dynamics [22,23,24,25,26,27], which has shown great potential for advancing the understanding of hydrological processes in such poorly-observed basins. The water balance model and empirical formula are useful ways to estimate lake streamflow [28,29,30,31,32,33]. The climate elasticity method [34] has gradually been developed and has proven to be an effective tool to evaluate the contributions of climate variation and intensifying anthropogenic activities to streamflow, and has been widely applied in many regions around the world [35,36,37,38,39,40,41,42,43]. The effective integration of these methods can enhance our ability to monitor and analyze the hydrological conditions of these widespread ungauged lakes and basins.
The Erdos Larus relictus National Nature Reserve (ELRNNR), located in the Ordos Plateau in northwest China, is a typical semi-desert plateau lake wetland ecosystem. The ELRNNR has been identified as the world’s No. 1148 wetland of international importance since 2002 due to its specific intent to protect Relict Gull (Larus relictus) habitats (https://rsis.ramsar.org/ris/1148), which have been seriously jeopardized by lake shrinkage in the ELRNNR [44,45,46,47,48,49,50,51,52,53]. The ELRNNR is located in a typical ungauged basin where long-term lake changes are difficult to monitor without hydrological or meteorological in-situ data. Some researchers have attempted to analyze the hydrologic settings of the ELRNNR including the basic hydrologic conditions [46], the water balance [46], the groundwater balance [54], the lake size dynamics [55], the eco-hydrological processes, and the critical hydrological conditions for wetland protection [31], and have concluded that the ELRNNR has suffered from severe water shortage caused by both climate change and human activities (i.e., water use, vegetation recovery, and dam construction). However, quantitative analyses to evaluate variation in lake stremflow and contributions of climate change and human activities have not yet been available due to the lack of a long sequence of lake streamflow data.
In this study, on the basis of remote sensing data, we propose an integrated approach to quantify lake streamflow and assess the impacts of climate change and human activities on lake streamflow in the ELRNNR. The integrated approach, effectively coupling an empirical formula, water balance model, and the climate elasticity method, could be expected to provide a useful reference to quantitative evaluation of lake streamflow and its driving forces in ungauged basins. This paper is structured as follows: Section 2 briefly describes the study area, data used in the present study, and methods, which presents how the remote sensing observations and water balance modelling were integrated to examine the streamflow variations within the lake basin. Section 3 and Section 4 are the results and discussion. Finally, the main conclusions are drawn in Section 5.

2. Materials and Methods
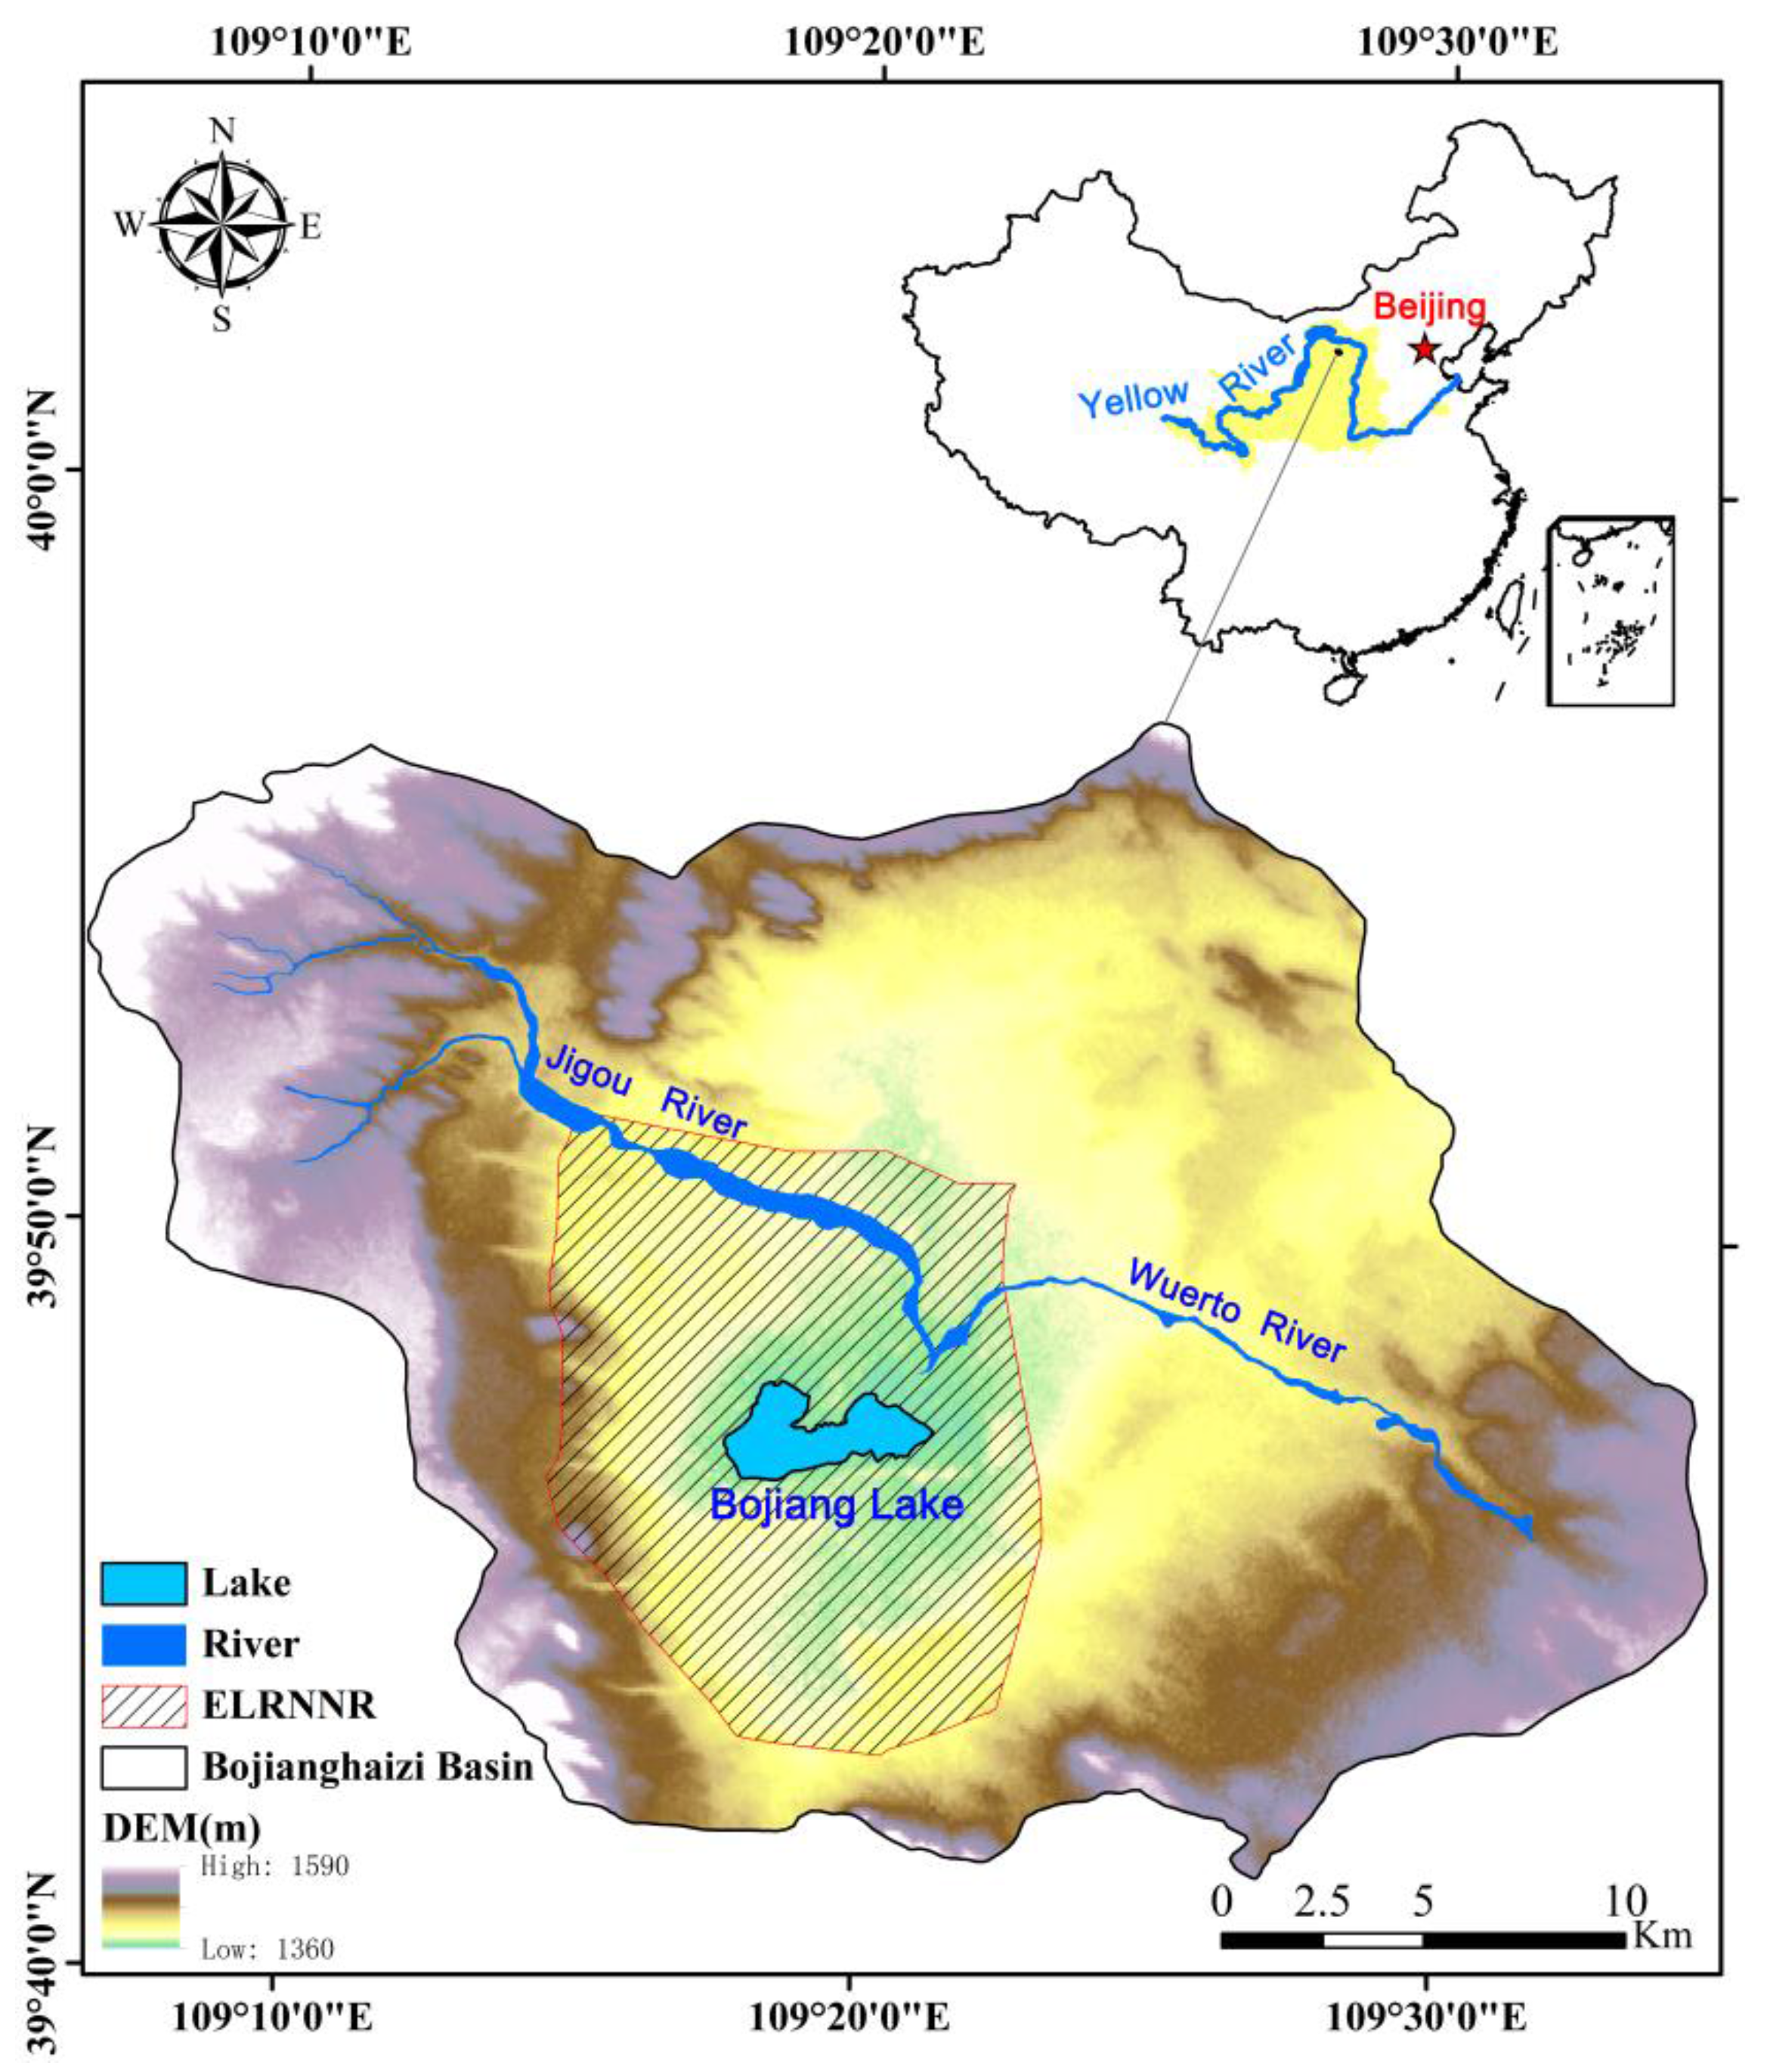
2.1. Study Area

The Erdos Larus relictus National Nature Reserve (ELRNNR) is located in Ordos City, Inner Mongolia Autonomous Region in China, in the latitude of 39°41′40″–39°56′2″N and the longitude of 109°6′30″–109°34′50″E. The ELRNNR is in a naturally closed Bojiang Lake basin (i.e., known as the Bojianghaizi basin by local people), with a drainage area of 744.6 km2. In the whole basin, there are three lakes, known as Bojiang Lake, Houjia Lake, and Sujiagebo Lake, of which the perennial Bojiang Lake is the largest and is the only breeding ground of the Relict Gull. Bojiang Lake is also known as Tiaolimiao-Alashan Lake by local people, and is located in the central basin, with two seasonal rivers, namely Jigou River and Wuertu River as its tributaries (Figure 1). The western Jigou River and eastern Wuertu River have a similar length of 21 km and an average width of 200 m, and there are no hydrometric stations in the two rivers. The Bojiang Lake basin is a closed basin with an elevation ranging from 1360 m to 1600 m, and the central Bojiang Lake has the lowest elevation of 1360 m [54]. Bojiang Lake is a hump-shaped shallow lake, with an average depth ranging from 1.0 to 1.5 m and a deepest point of more than 4.0 m [31,54]. The ELRNNR has a temperate continental climate with distinct seasonal variation: drought in spring, warm in summer, dry in autumn, and cold in winter. The average annual temperature is 5.2 °C. The average temperature in the hottest month, which is July, is 21.3 °C, while in the coldest month, December, it is −12.9 °C [46]. The average annual precipitation during 1973–2013 in the Bojiang Lake basin was about 330 mm, and precipitation concentrates in July and August, accounting for 65% of the annual precipitation. Shrubs and grassland are the primary vegetation types in the Bojiang Lake basin.

2.2. Data

Data used in this study include: (1) Landsat remote sensing images for extracting the lake water surface area and calculating the lake volume (Section 2.3.1); (2) Meteorological data (i.e., precipitation, air temperatures, wind speed, vapor pressure, and sunshine hours) for calculating lake streamflow and climate changes (i.e., expressed by precipitation and potential evapotranspiration); (3) Direct water abstraction from the basin (i.e., the water directly abstracted for irrigation and domestic uses) to present the direct effect of human activities on lake streamflow.
Landsat images were downloaded from the United States Geological Survey’s (USGS) remote sensing image database (http://earthexplorer.usgs.gov/). These images were obtained from Landsat sensors including MSS, TM/ETM+, and OLI, with a resolution of 60 m, 30m, and 30m, respectively. The images from 1974 to 2013 were used to measure the water surface area of Bojiang Lake, and the basic information of the used remote sensing images is shown in Table 1. The remote sensing images are used by clear or slight cloud contamination in the lake regions, so the mean cloudiness of most used images is 0%. Some of the images are difficult to extract due to satellite malfunctions, cloud cover, poor data quality, or no photographing in the study area. For the partial no data available for download during 1981–1986, human activity in this period was relatively weak and the lake size was mainly controlled by precipitation in the basin, so the missing lake area was linear interpolated according to the precipitation in August by comparing that with available remote sensing images data in the adjacent years.
Meteorological data products were used to help model the lake streamflow and climate change. Precipitation data were obtained from the monthly surface air temperature and precipitation dataset for 1974–2013 provided by China Meteorological Data Service Center (CMDC, http://data.cma.cn/en), with a spatial resolution of 0.5° × 0.5° in longitude and latitude. The dataset is interpolated based on 2472 base weather stations in China. In addition, the data of the Dongsheng weather station (39°49′23.50′′N, 109°57′50.68′′E), nearest to the study area, were from the National Climate Centre (NCC) of China Meteorological Administration (CMA). The meteorological data, including the daily precipitation, air temperatures, wind speed, vapor pressure, and sunshine hours, were used to calculate the potential evapotranspiration based on the Penman-Monteith method recommended by the Food and Agriculture Organization (FAO) [56].
Direct water abstraction data were used to represent the direct impact of human activities on streamflow. The statistical data were provided by the Administration Bureau of Erdos Larus relictus National Nature Reserve [46]. The averaged statistical direct water abstraction data (QHd, 104 m3) during the different periods were obtained by field investigation from the Administration Bureau of Erdos Larus relictus National Nature Reserve. When using QHd (m3) divided by the Bojiang Lake basin area (744.6 km2), QHd (m3) can be easily converted into QHd (mm), expressed by the runoff in depth (mm). Then, QHd (mm) values during the different periods are used for further analysis to quantitatively evaluate the contributions of direct human activities to the streamflow (see Equations (4) and (5)).

2.3. Methods

The integrated approach for quantifying lake streamflow variation and its drivers in the ELRNNR basin includes the remote sensing technique, empirical formula of the lake area-volume, water balance model, and climate elasticity method. These methods are integrated by the following four steps: Firstly, remote sensing technology was used to establish a set of data about the lake area from 1974 to 2013; secondly, the empirical formula of the lake area-volume was used to obtain the corresponding lake volume; thirdly, the water balance model was applied to calculate the lake streamflow; lastly, the climate elasticity method was used to quantify the contributions of climate change and human activities to lake streamflow variations during the different sub-periods.

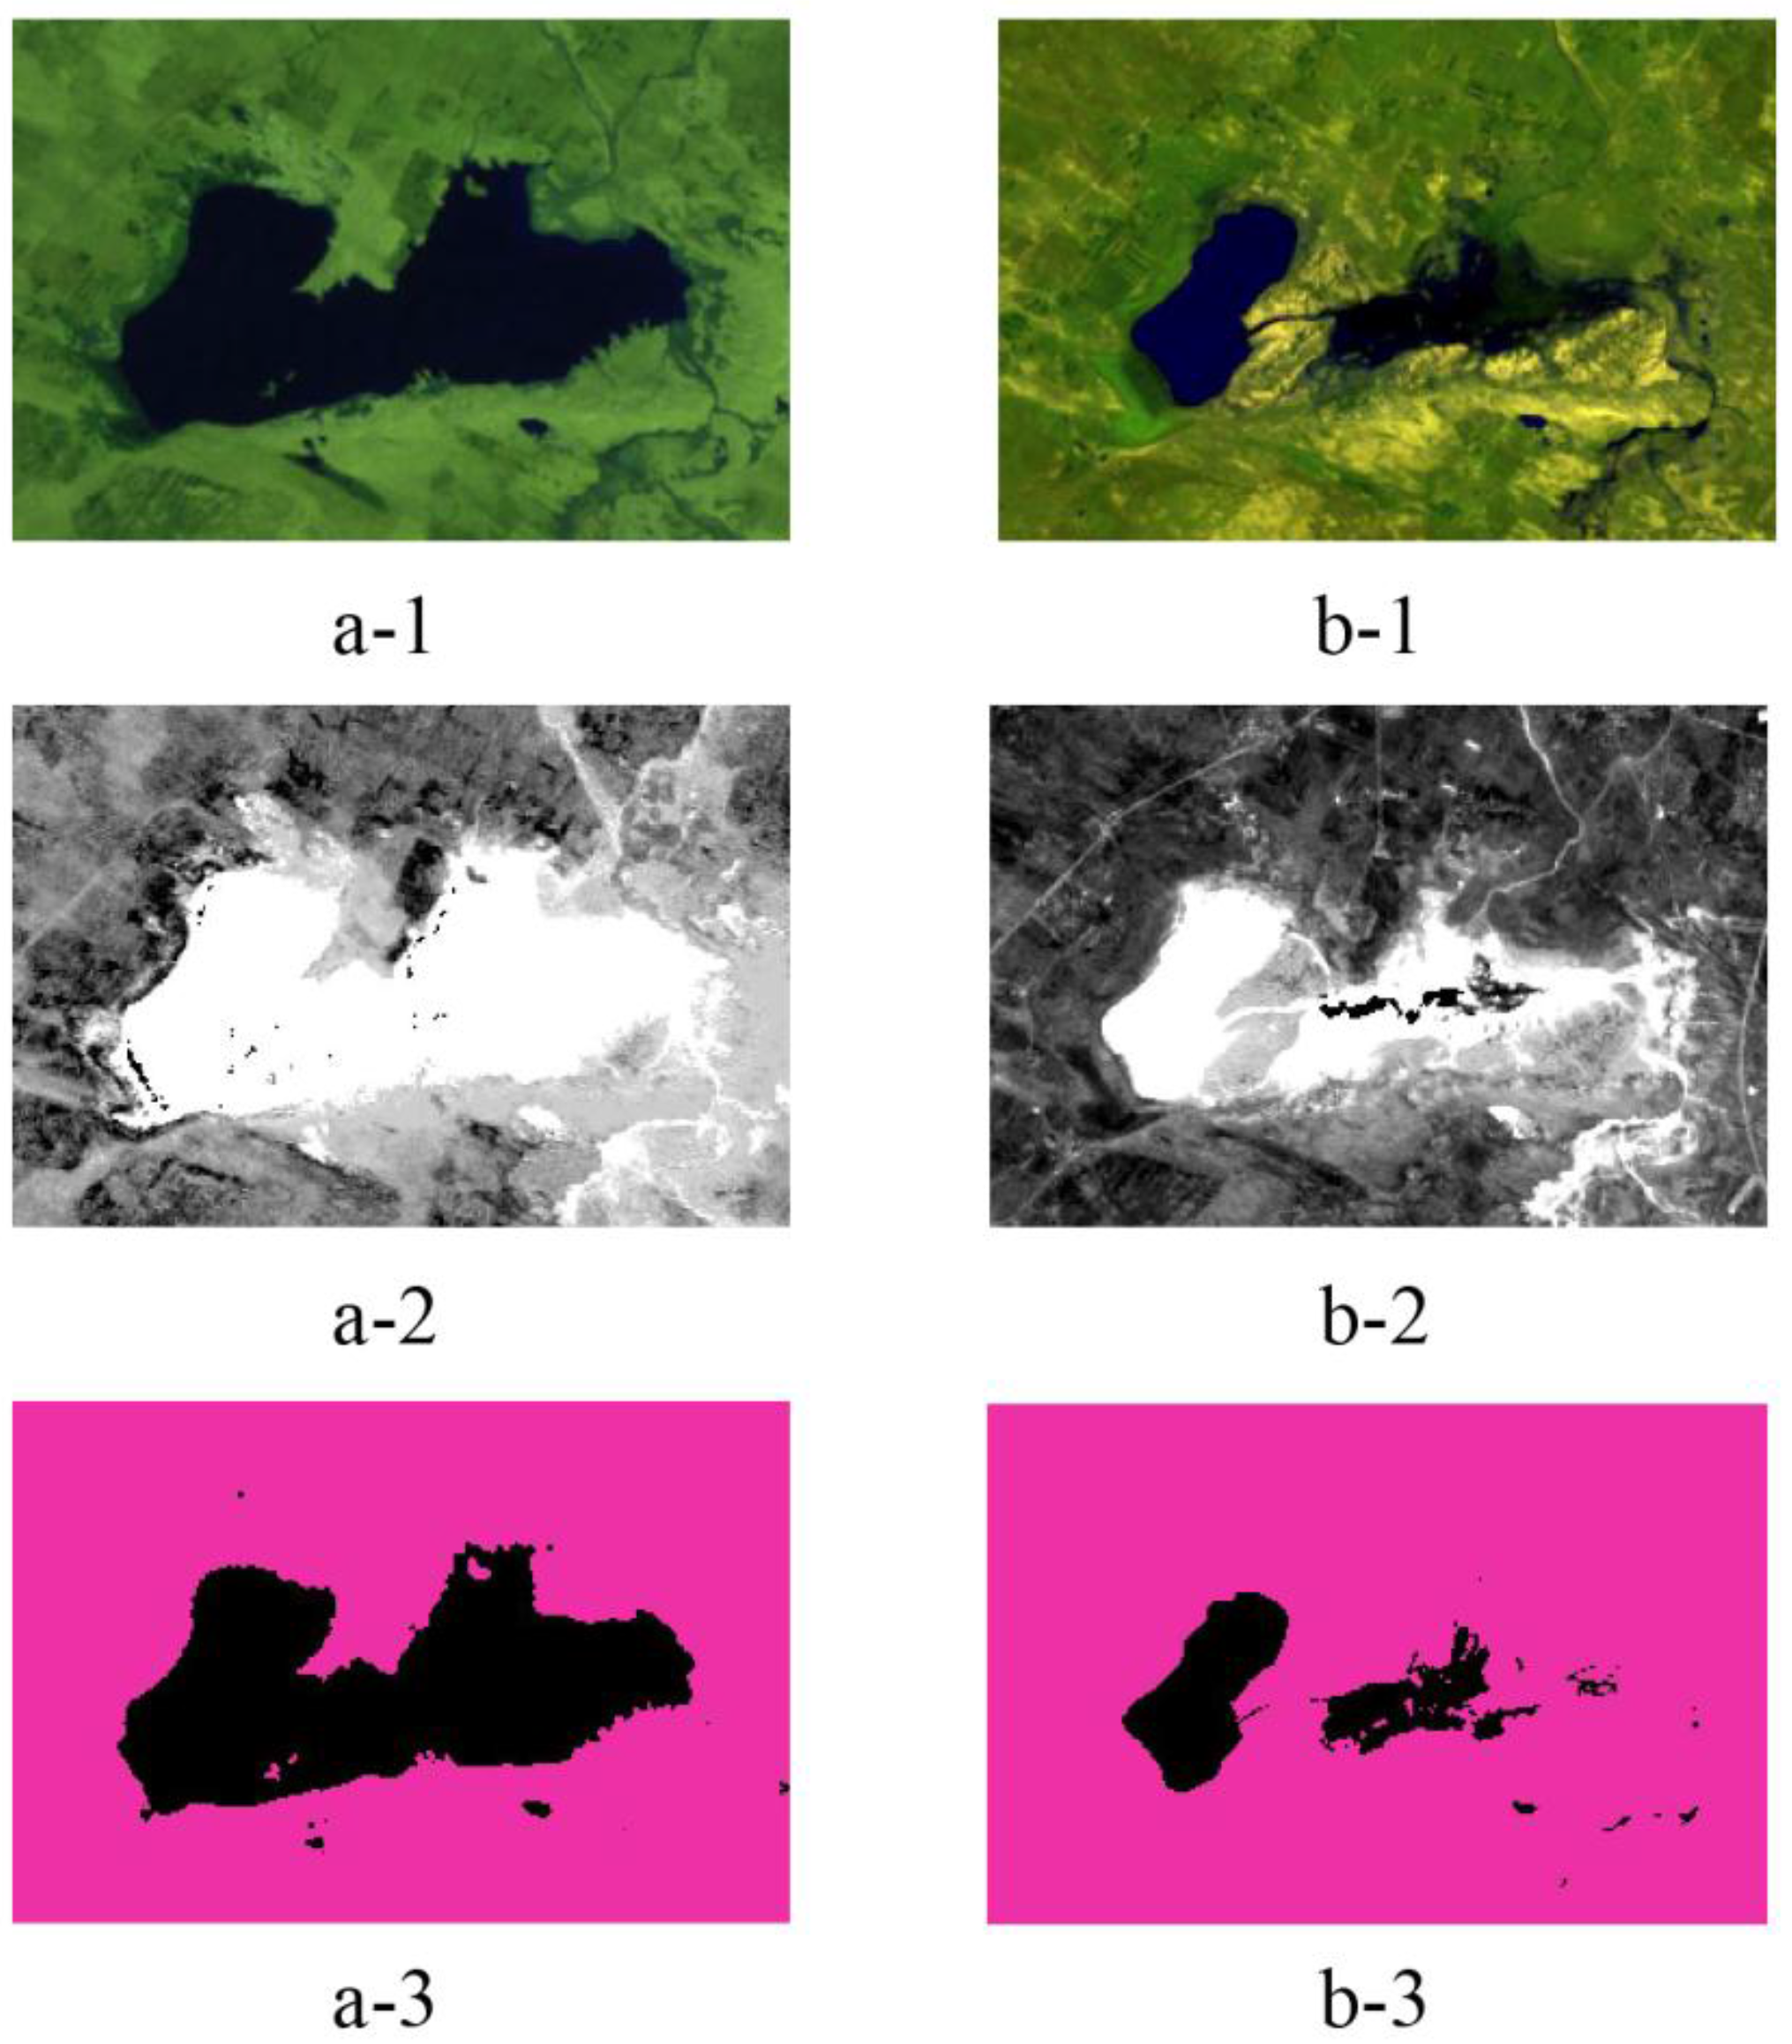
2.3.1. Estimation of Time Series of Lake Volume Variations Based on Remote Sensing Technique and Empirical Formula

Firstly, the remote sensing technique was used to ascertain the lake area, which was the key foundation of this study. Here, the Modified Normalized Difference Water Index (MNDWI) method proposed by Xu is adopted [57]. The MNDWI method is a modification of the Normalized Difference Water Index (NDWI) [58,59,60], which has been widely used and proved robust in extracting water bodies [61,62]. The MNDWI is expressed as:
M N D W I = G r e e n M I R G r e e n + M I R ,
The difference between NDWI and MNDWI is that the latter uses middle infrared bands (MIR) instead of near-infrared bands (NIR). Due to high absorption in the MIR band and high reflectance in the Green band, water features usually have positive MNDWI values, whereas the MNDWI values of non-water features are usually negative. In this study, MNDWI was used to measure the Bojiang Lake water area (AL) from Landsat MSS, TM/ETM+, and OLI images. A three-step procedure was used. Step 1 was the calculation of MNDWI for all used Landsat images, after the pretreatment of radiation calibration and atmospheric correction. Due to lack of MIR, Landsat MSS images were processed by the method of NDWI. In addition, there are two NIR bands (band 6 and 7) in the Landsat MSS image. Band 7 was used in this study, because it was better absorbed by water than band 6. Step 2 was the cropping of the Bojiang Lake region and the testing of the MNDWI threshold values using the reference of the false color composite image by SWIR2, SWIR1, and Green bands. In this study, the MNDWI threshold value of the Landsat MSS images was set as 0, and that of the Landsat TM/ETM+, OLI images was set as 0.35. For example, Figure 2(a-3) shows the calculated results of Landsat TM images, in which the black regions refer to the lake water surface with a threshold value greater than 0.35, while the outboard maroon regions refer to non-water features with a threshold value between −1 and 0.35. Step 3 included the manual corrections to some calculated results of the MNDWI. Bojiang Lake is a shallow lake, and tidal flats or marshes would appear during the processes of lake shrinkage, which can’t be accurately identified by the MNDWI method. Therefore, it is necessary to conduct manual correction for this situation. Figure 2(b-1,b-2,b-3) shows the representative results of manual correction.
Secondly, when the lake area (AL) was extracted by the previous remote sensing method, we could use the empirical formula of the lake area-volume (i.e., deduced from the area-volume rating curve) to calculate the lake water volume (i.e., the variable Vi in Equation (2)). The empirical formula for the area-volume curve of the Bojiang Lake was constructed by measuring the lake topography, which was carried out by the China Institute of Water Resources and Hydropower Research (IWHR) in December 2006. The empirical formula was expressed as [31]:
V i = 32.115 A L i 2 116.1 A L i + 231.91 ,
where Vi is the lake volume of the ith year (104 m3) and ALi is lake size of the ith year (km2), extracted by the previous remote sensing method.

2.3.2. Conceptual Model of Lake Water Balance

When the lake volume (Vi) was obtained by the empirical formula of the lake area-volume, we then successfully applied the water balance model to calculate the corresponding lake streamflow. As Bojiang Lake is a naturally closed lake, the annual water balance equation for the closed lake can be expressed as:
Δ V i = V i V i 1 = ( P L i E T L i ) A L i + Q i n i ,
where ∆Vi is the change of lake volume in the ith year (m3); Vi is the lake volume of the ith year (m3), which could be calculated by Equation (2); PLi and ETLi are the precipitation and evaporation in the lake (mm). ETLi was calculated by the Penman-Monteith method recommended by FAO [56], and the two coefficients were estimated by an optimized method for solar radiation [63]; ALi is the lake area (m2); and Qini is the streamflow into the lake in the ith year (m3). Because the other variables (i.e., ∆Vi, PLi, ETLi, and ALi) are known, the long series of annual Qini (m3) could be calculated by Equation (3). When using Qini (m3) divided by the Bojiang Lake basin area (744.6 km2), Qini (m3) can be easily converted into Qini (mm), expressed by the runoff in depth (mm). Then, the long series of annual Qini (mm) values are used for further analysis to quantitatively evaluate the contributions of climate change and human activities to the streamflow.

2.3.3. Climate Elasticity Method for Quantifying the Drivers of Lake Streamflow Variations

When the calculated lake streamflow (Qin) was obtained by previous Equations (2) and (3), and the statistical direct water abstracted for irrigation and domestic uses (QHd) was known, the “naturalized” streamflow (Qna) and its changes (ΔQna), needed by climate elasticity method, can be calculated by Equation (4). For the “naturalized” lake streamflow, both climate variability and human activities have an impact on it. In addition, the climate impacts could be usually expressed by changes of precipitation and potential evapotranspiration. While human activities could be further divided into two parts: “Indirect impact” (due to land use/cover change and soil conservation) and “direct impact” (i.e., the direct water abstracted for irrigation and domestic uses) [41]. Therefore, the changes of “naturalized” streamflow (ΔQna) can be expressed as:
Δ Q i n + Δ Q H d = Δ Q n a ,
Δ Q n a = Δ Q C + Δ Q H = ( Δ Q P + Δ Q E 0 ) + ( Δ Q H i n d + Δ Q H d ) ,
where ΔQin, ΔQHd, and ΔQna are the changes of “calculated” lake streamflow, “direct impacts”, and “naturalized” streamflow, respectively. ΔQC, ΔQH are the streamflow changes due to climate variability, human activities. ΔQP and ΔQE0 are the changes in streamflow due to changes of P (average annual precipitation) and E0 (average annual potential evapotranspiration), respectively. ΔQHind and ΔQHd are the streamflow changes due to the “indirect impact” of human activities and “direct impact” of human activities, respectively.
The streamflow changes due to climate variability (ΔQC) are then further calculated by the climate elasticity method, which can be expressed as [35,39,40,41,42,64,65]:
Δ Q C = Δ Q P + Δ Q E 0 = ( ε P Δ P / P + ε E 0 Δ E 0 / E 0 ) Q n a ,
where ε P and ε E 0 are the climate elasticity of streamflow with respect to P and E0, which are set to be 2.05 and −1.05 in the present study, respectively. ΔP and ΔE0 are the changes of P and E0 between the different periods, respectively. We applied the following equation [35,37] based on the Budyko hypothesis [66] to calculate ε P and ε E 0 :
ε P = 1 + φ F ( φ ) 1 F ( φ ) ,   and   ε P + ε E 0 = 1 ,
where φ is the aridity index (φ=E0/P), F(φ) is the function of φ, and F′(φ) is the derivative of F(φ). According to Zhang [67], F(φ) and F′(φ) are expressed as:
{ F ( φ ) = ( 1 + ω φ ) / ( 1 + ω φ + 1 / φ ) F ( φ ) = ( φ 2 + 2 ω φ 1 + ω + 1 ) / ( 1 + ω φ + 1 / φ ) 2 ,
where ω is plant-available coefficient relating to the vegetation type, which was set to 0.8 in this study for shrubs and grassland types.

2.3.4. Trend Analysis

Accumulative anomaly analysis is a method commonly used to diagnose the trends of time series data [68,69,70,71]. The accumulative anomaly (AA) for a time series [xi] is calculated using the following formula [70]:
A A = i = 1 t ( x i x ¯ )   ( t = 1 ,   2 ,   , n ) ,   and   x ¯ = 1 n i = 1 n x i ,
where x i is a single value in the time series and x ¯ is the average value of all the time series data. The time series data of the lake area, lake volume, streamflow into the lake, precipitation, and potential evapotranspiration were analyzed by accumulative anomaly analysis.
Linear regression analysis was used to analyze the trends and variation rate of the hydrological and meteorological variables in different periods [72,73]. The slope of the linear regression equation is regarded as the variation rate during the specific period.

3. Results

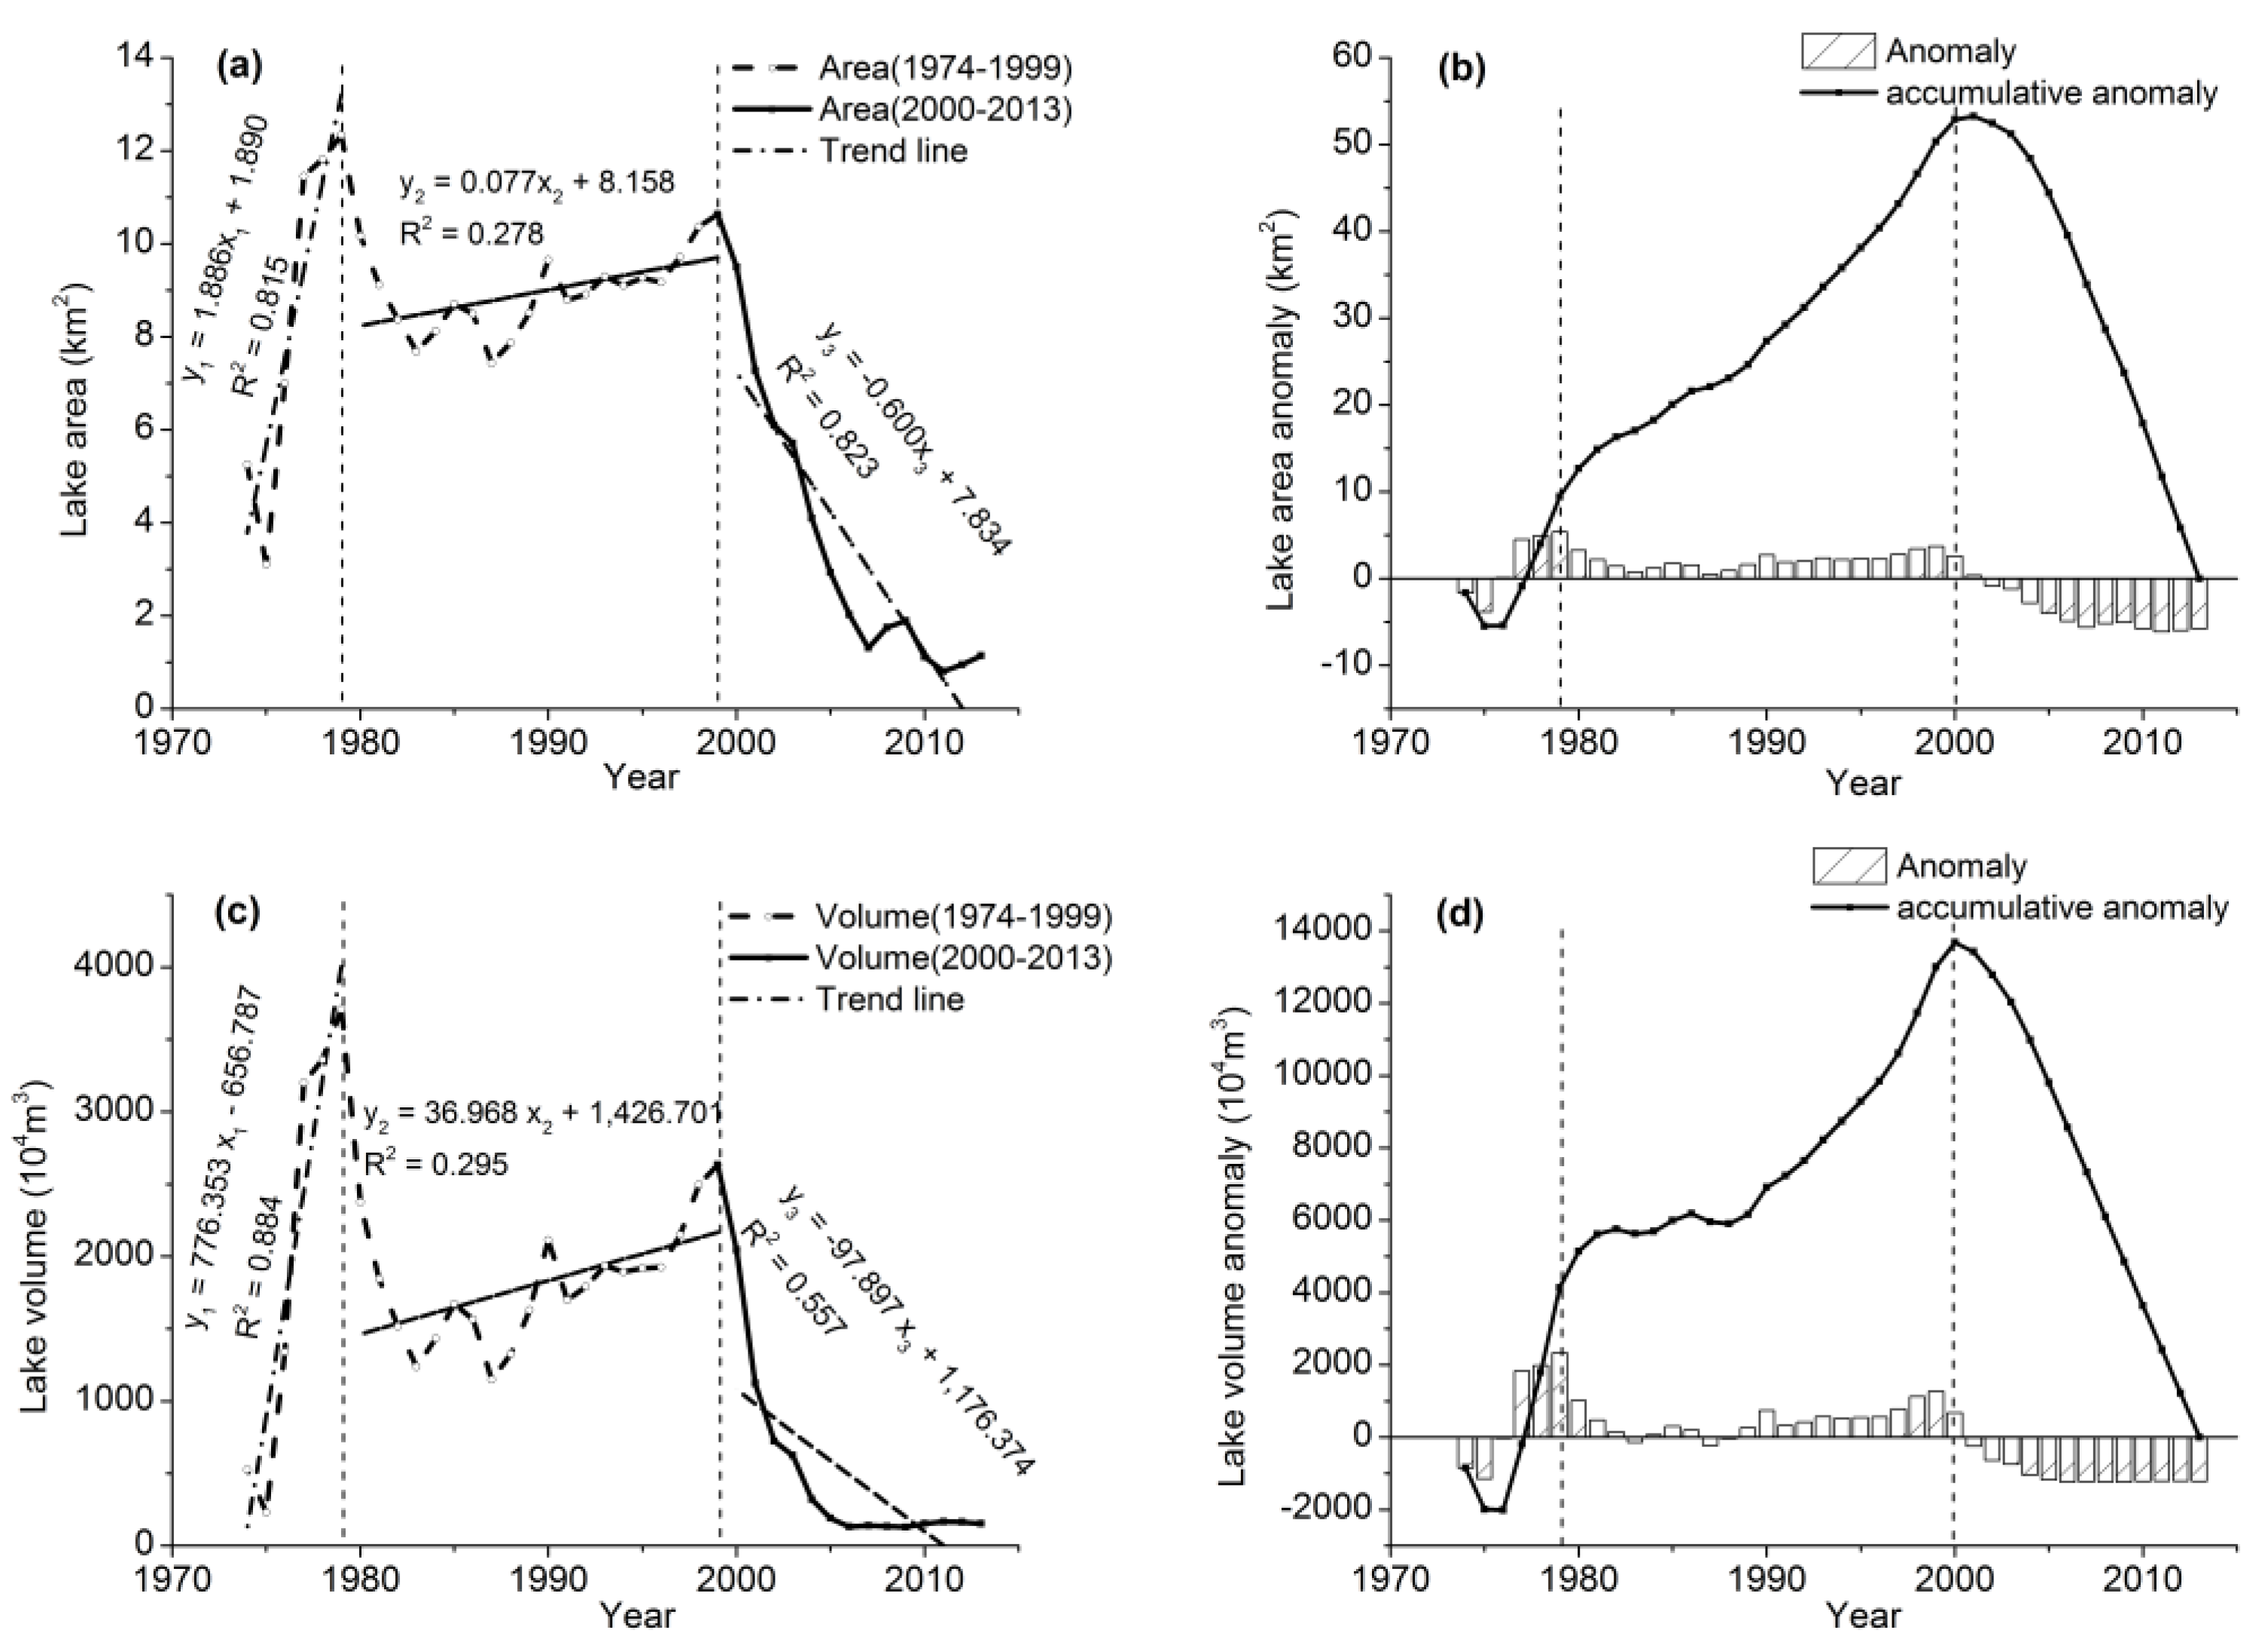
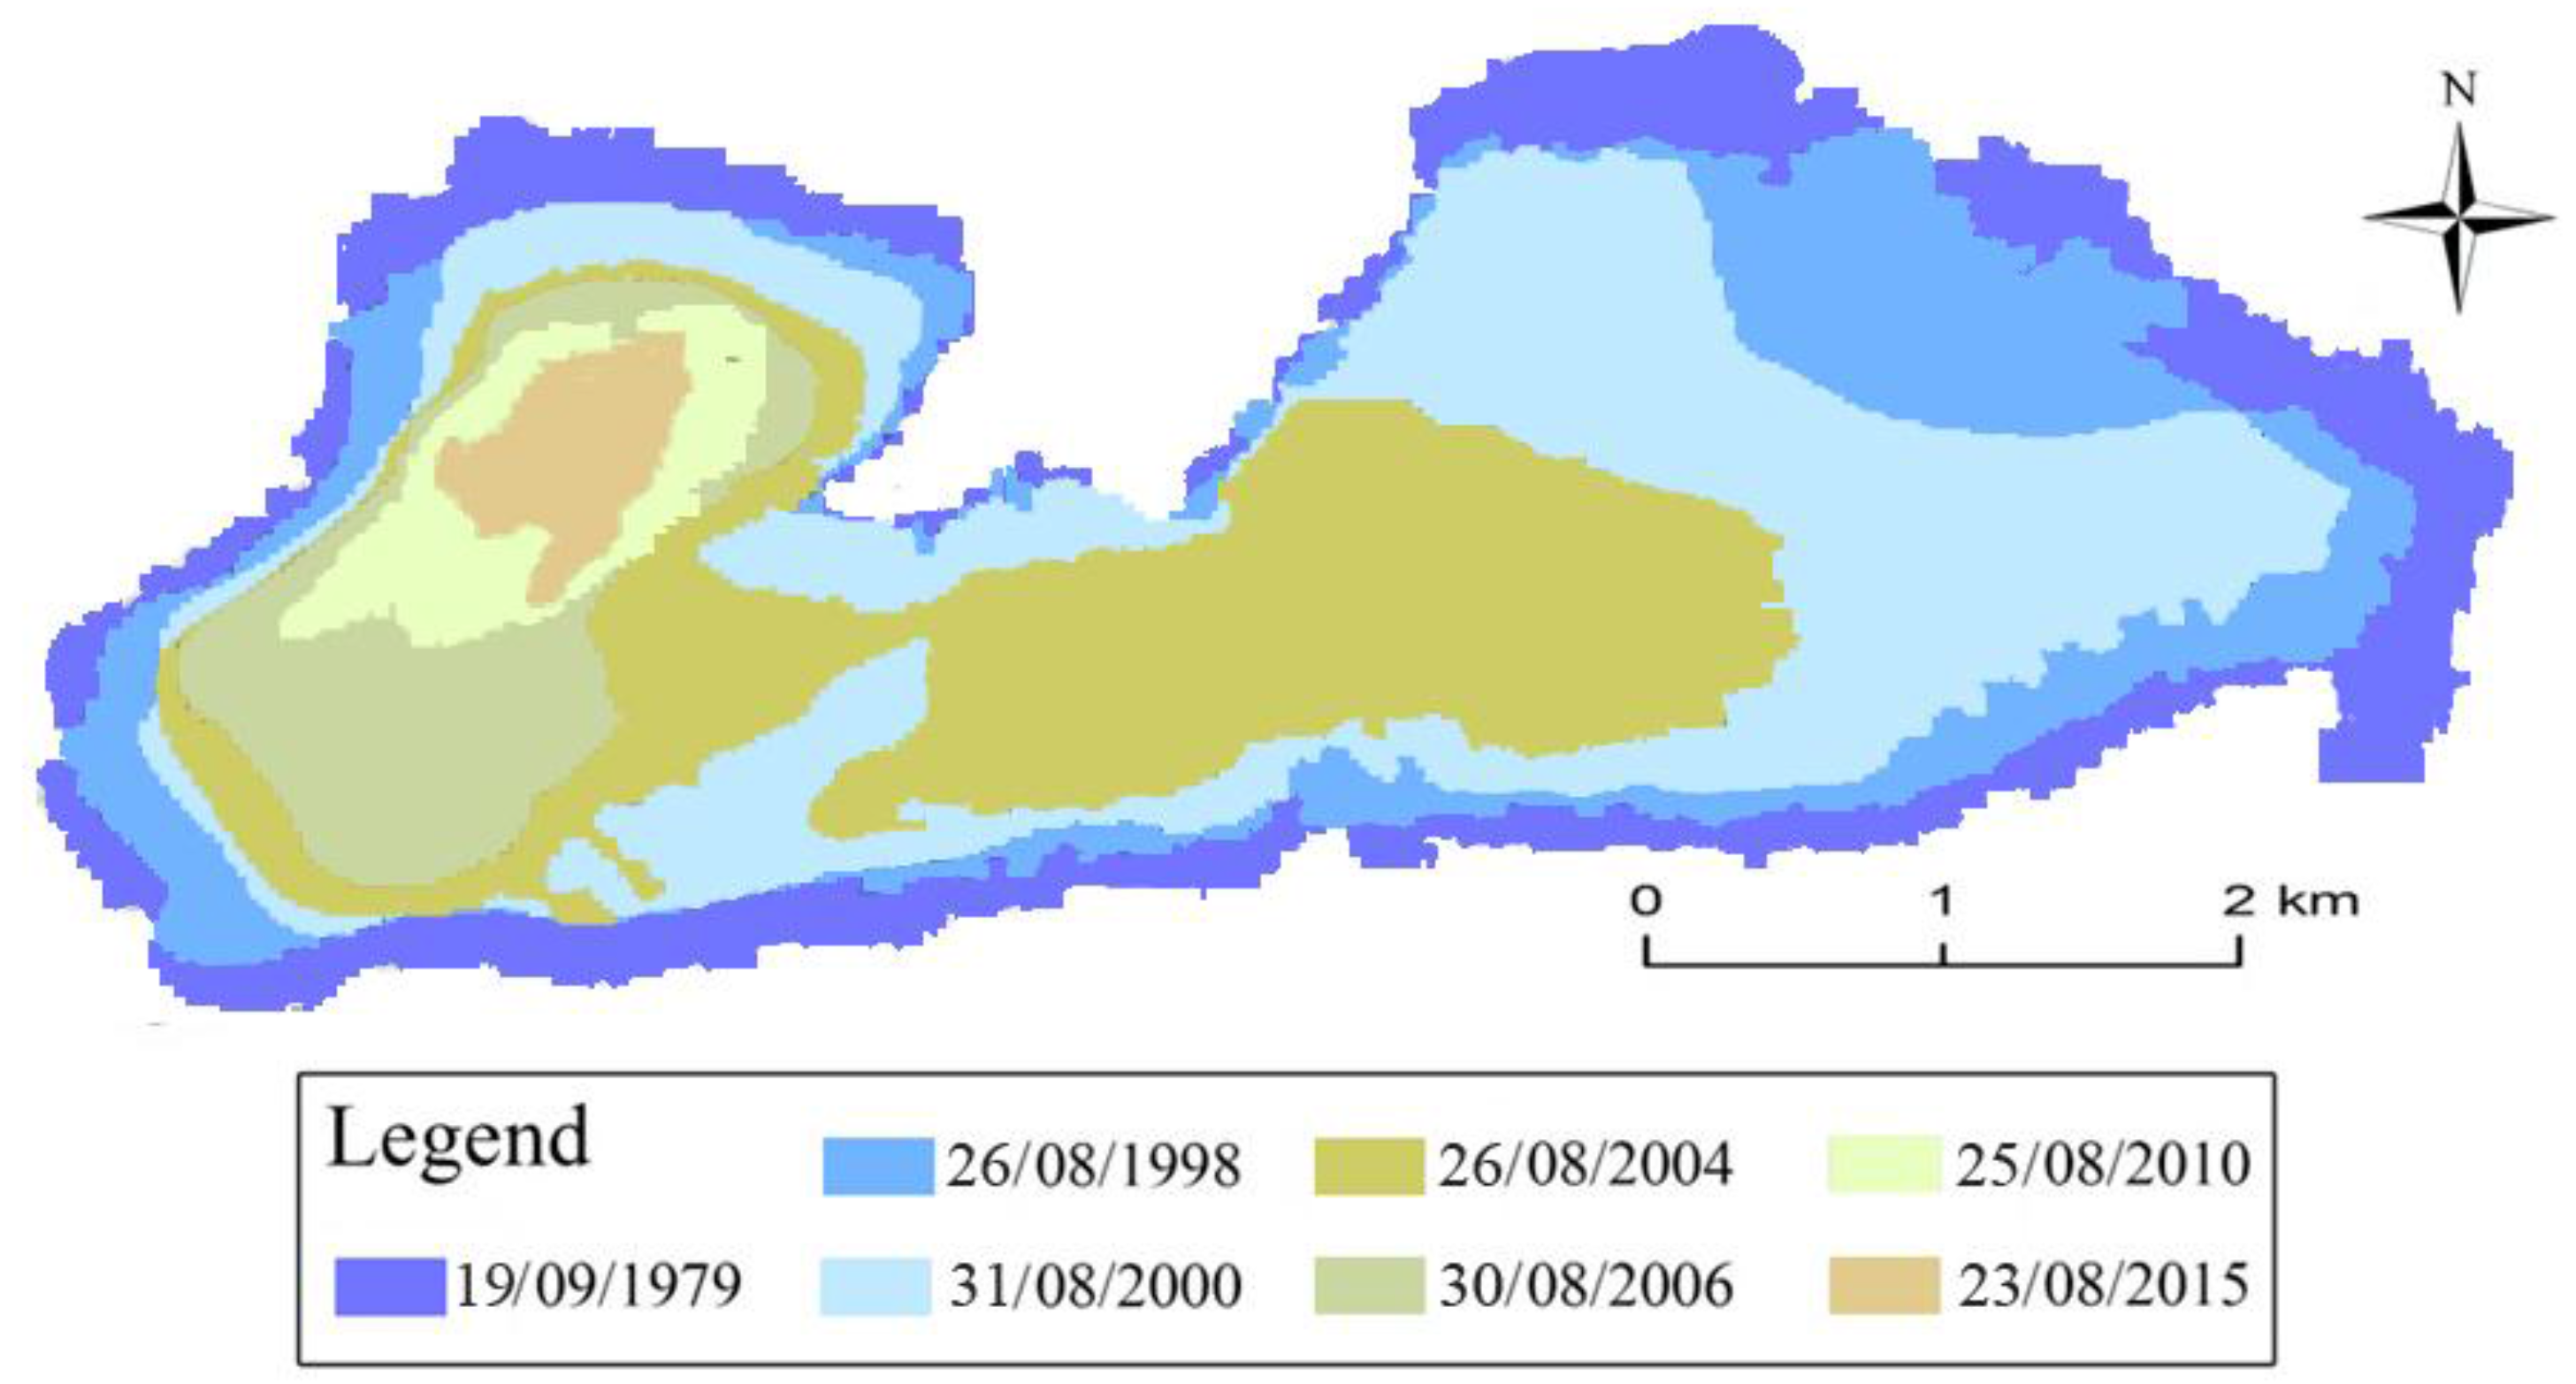
3.1. Changes in Lake Area and Lake Volume

The variations in the average annual lake area and its anomaly from 1974 to 2013 are shown in Figure 3a,b. The mean value and the standard deviations of the annual lake area during 1974–2013 are 6.92 km2 and 3.47 km2, respectively. The lake dynamic presents a large fluctuation, and the whole study period can be apparently split into three sub-periods: the first is a rapidly expanding sub-period (1974–1979), the second a relatively stable sub-period (1980–1999), and the third a dramatically shrinking sub-period (2000–2013). The range in the average annual lake area during 1974–1979 is from 3.106 km2 to 12.341 km2, with an average area value and standard deviations of 8.494 km2 and 3.91 km2, respectively, and the variation rate is approximately 1.886 km2/a. In the second sub-period (1980–1999), the average annual lake area varies from 7.435 km2 to 10.635 km2, with an average area value and standard deviations of 8.971 km2 and 0.87 km2, respectively, and the variation rate is about 0.077 km2/a. While in the third sub-period (2000–2013), the range in the annual average lake area is from 9.496 km2 to 0.806 km2, with an average area value and standard deviations of 3.329 km2 and 2.77 km2, respectively, and the variation rate is −0.600 km2/a.
The lake volume was calculated according to the empirical formula of the lake area-volume. Figure 3c,d show the variations in the lake volume and its anomaly. The lake volume maintains a relatively consistent trend, while more drastic fluctuation is seen in terms of the lake area. The mean value and standard deviations of the annual lake volume are 1371.253 ×104 m3 and 984.48 ×10⁴ m3, respectively. The periods of variation could also be divided into the same three sub-periods. The average annual lake volume during 1974–1979 is from 230.159×10⁴ m3 to 3710.074×104 m3, with an average value and standard deviations of 2060.450×104 m3 and 1544.86 ×104 m3, respectively, and the variation rate is approximately 776.353×10⁴ m3/a. In the second sub-period (1980–1999), the average annual volume varies from 1148.575×104 m3 to 2632.277×104 m3, with an average value and standard deviations of 1814.867×104 m3 and 402.43 ×10⁴ m3, respectively, and the variation rate is about 36.968×10⁴ m3/a. While in the third sub-period (2000–2013), the average annual volume is from 2042.685×104 m3 to 129.164×10⁴ m3, with an average value and standard deviations of 442.148×10⁴ m3 and 548.97 ×10⁴ m3, respectively, and the variation rate is −97.897×10⁴ m3/a.
As for the variations in the spatial distribution range of Bojiang Lake, the typical representative Landsat optical images were used to extract the boundaries of the lake (Figure 4). Bojiang Lake showed a sharp shrinkage from 1979 to 2015, and the narrowed region mainly concentrated in the eastern and southern parts, especially after 2006. Bojiang Lake only existed as a small entity in the western region after 2006.

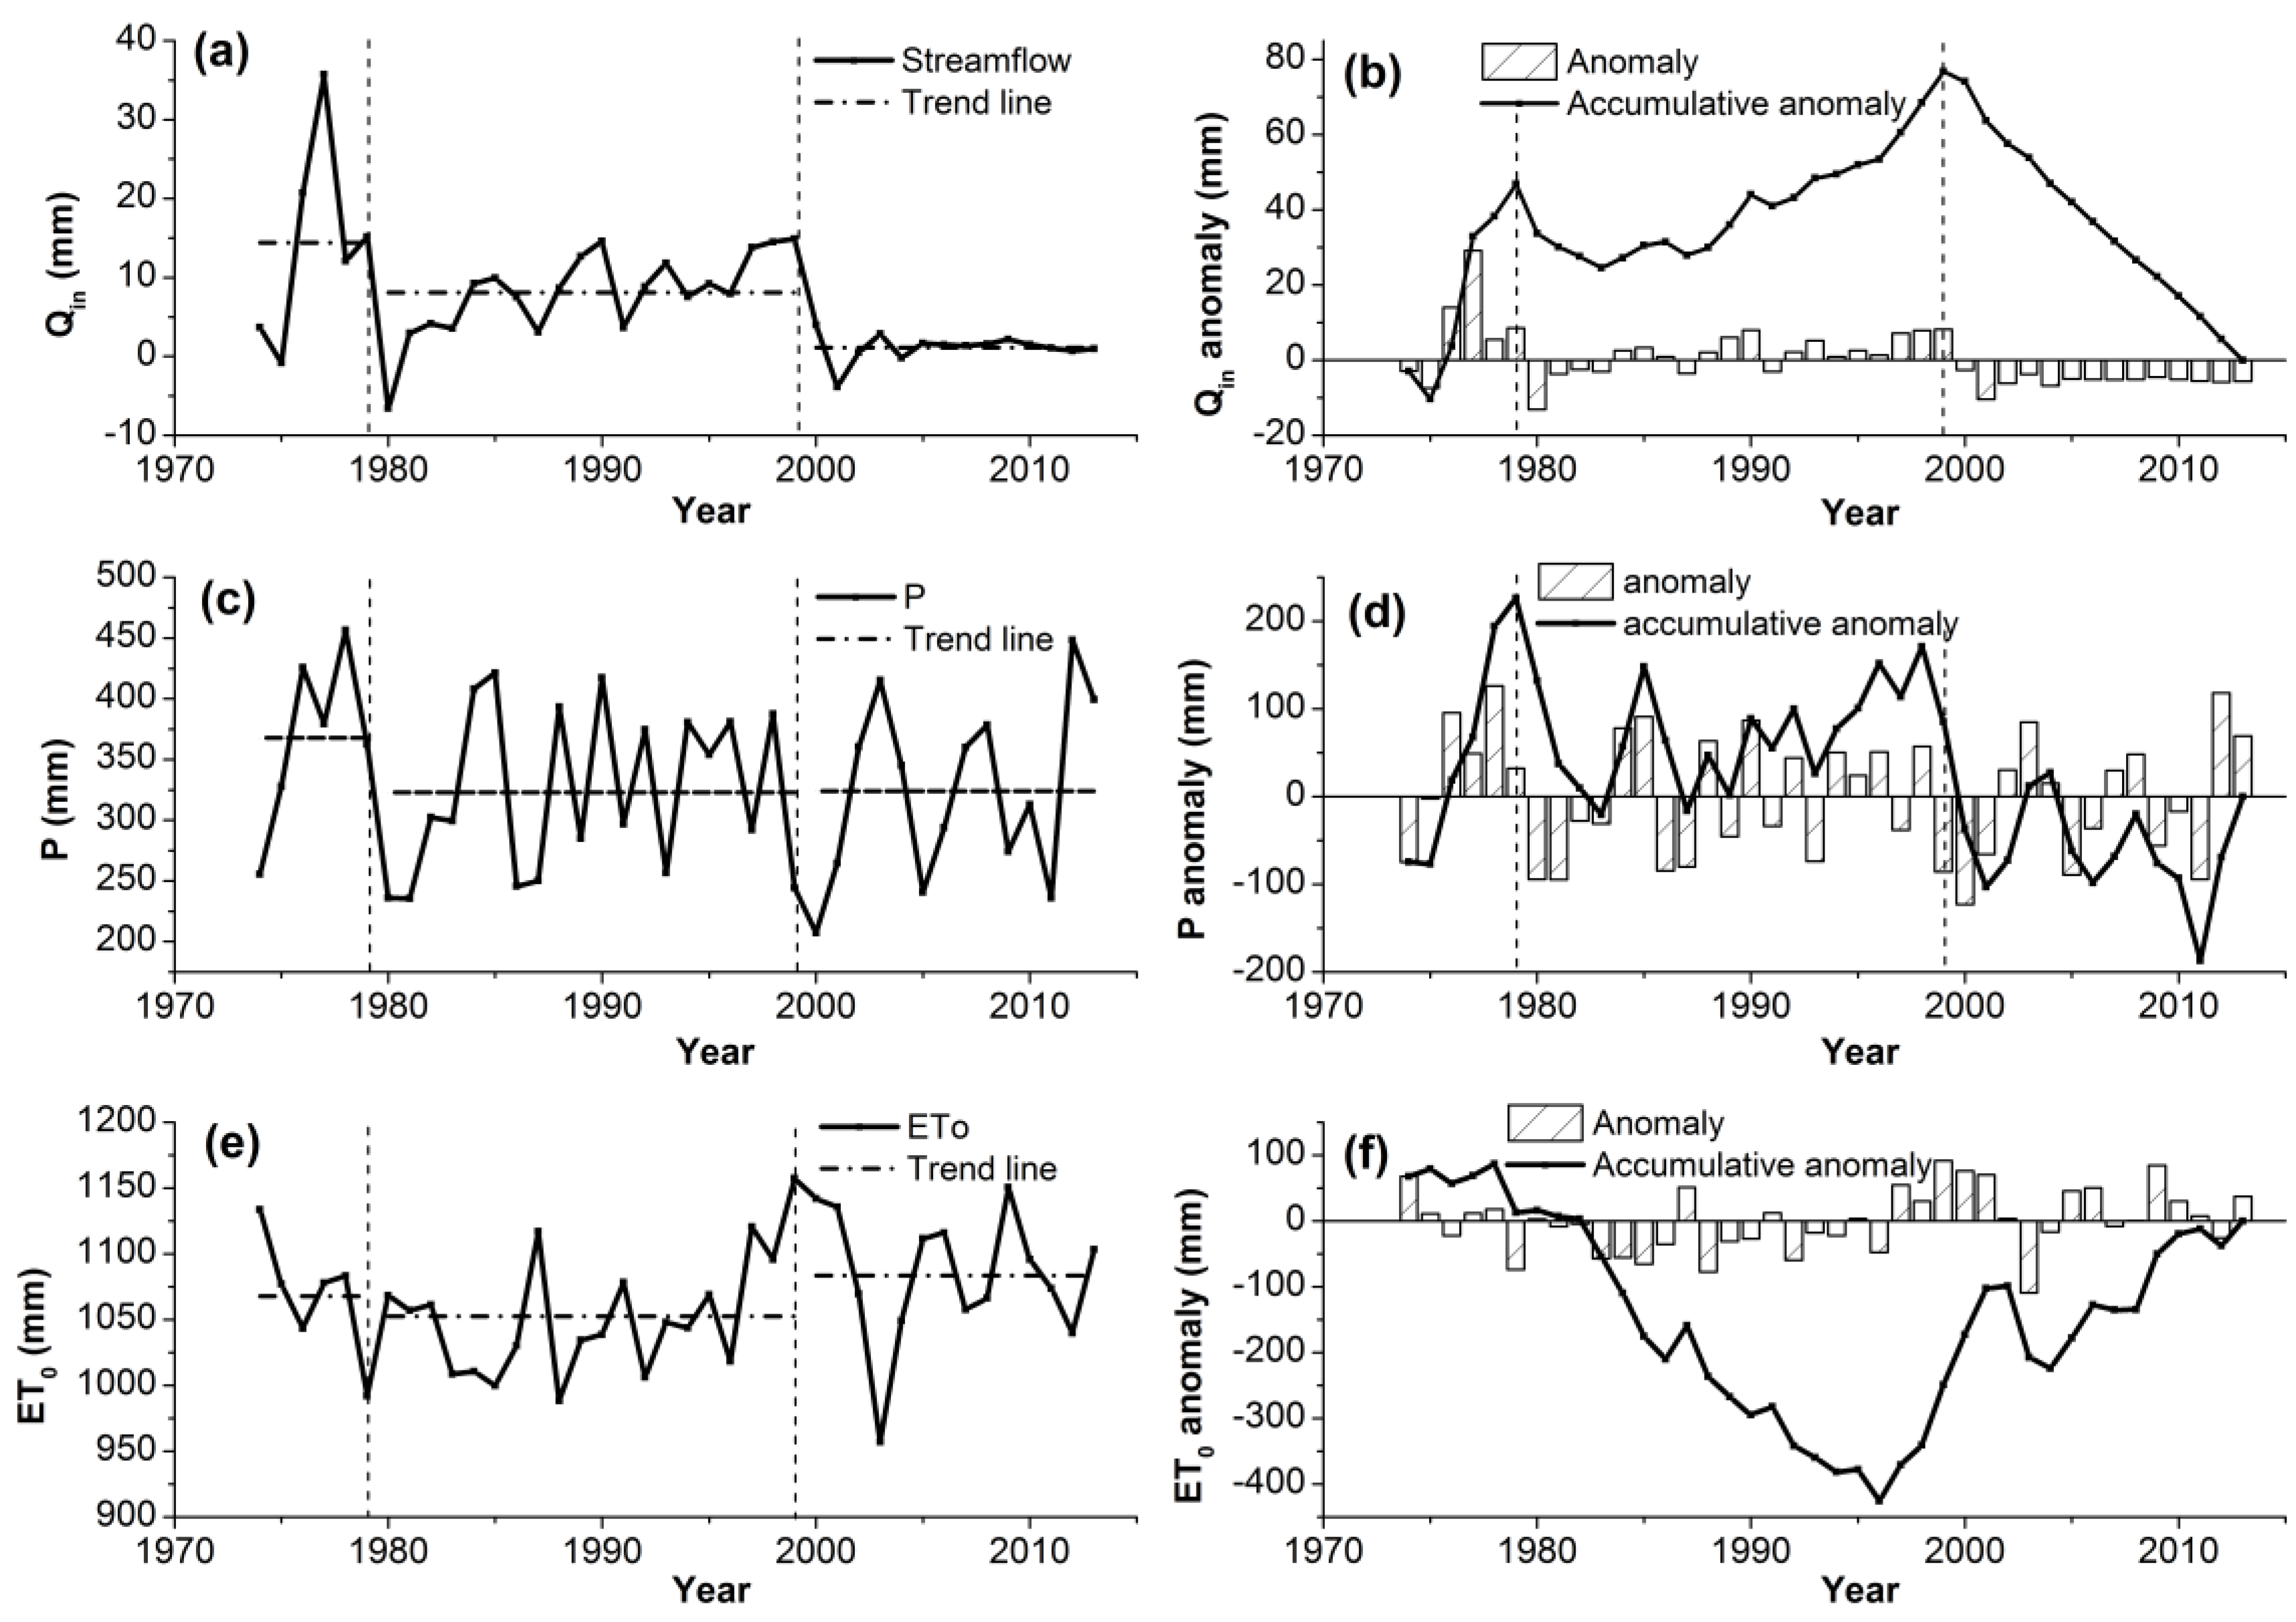
3.2. Changes of Streamflow, Precipitation, and Evapotranspiration

Figure 5a,b show the variations of streamflow and its anomaly. The mean value and standard deviations of the annual lake streamflow during 1974–2013 are 6.60 and 7.59 mm, respectively. The variation in the streamflow shows a distinct difference in the three sub-periods. In the first sub-period (1974–1979), the annual streamflow appears to be a rapidly expanding trend, for which the average streamflow is 14.42 mm with standard deviations of 13.02 mm, and the variation rate is approximately 3.17 mm/a. During 1980–1999, the annual streamflow shows a relatively slow increasing trend with avariation rate of 0.62 mm/a, and the average streamflow is 8.10 mm with standard deviations of 5.27 mm. While in the third sub-period (2000–2013), all of the annual streamflow has a low value of less than 4.0 mm, and the average value is 1.12 mm with standard deviations of 1.76 mm. Compared with the streamflow in the first sub-period, the streamflow in the second and third sub-periods, respectively, decreases by 43.86% and 92.26%. All of the streamflow anomalies during 2000–2013 are negative, which means that the lake suffers from an extreme lack of water for a long time.
Figure 5c,d show the variations of annual precipitation and its anomaly during the three sub-periods. The mean value and the standard deviations are 330.18 and 70.32 mm, respectively. The precipitation shows a naturally drastic fluctuation in the first and the third sub-periods (1974–1979 and 2000–2013), but has a relatively gentle fluctuation in the second sub-period (1980–1999). The variation range (average value) of annual precipitation in the three sub-periods is 255.7–456.6 mm (367.93 mm), 235.6–421.3 (323.13 mm), and 207.2–448.3 (324.09 mm), respectively. Compared with that in the first sub-period, the precipitation in the second and third sub-periods decreases by 44.80 mm and 43.84 mm, respectively. The variations of annual potential evapotranspiration and its anomaly (Figure 3e,f) decrease first, and then increase. The mean value and the standard deviations are 1065.72 and 48.11 mm, respectively. The variation range (average value) of annual potential evapotranspiration in the three sub-periods is 992.02–1133.49 mm (1067.90 mm), 988.38–1157.56 (1052.64 mm), and 957.02–1141.94 (1150.50 mm), respectively. Compared with that in the first sub-period, the potential evapotranspiration decreases by 15.26% in the second sub-period and increases by 15.58% in the third sub-period.

3.3. Impacts of Climate Variability and Human Activities on Streamflow into Lake

According to Equation (6), the 44.81 mm decrease of precipitation (P) in the second sub-period (1980–1999) resulted in a 5.23 mm decrease in streamflow, while the 15.26 mm decrease in potential evapotranspiration (E0) led to a 0.31 mm increase in streamflow. Therefore, the impacts of climate variation caused a 4.9 mm decrease in the annual streamflow (i.e., ΔQC), accounting for 77.7% of the streamflow decrease. Human activities (i.e., the sum of ΔQHind and ΔQHd) constituted 22.3% of the streamflow decrease (Table 2). Similarly, in the third sub-period (2000–2013), a 43.85 mm decrease in precipitation resulted in a 5.11 mm decrease in streamflow, while the 15.58 mm increase in E0 led to a 0.32 mm streamflow decrease. Changes of P and E0 together comprised 40.8% of the streamflow decrease, while human activities caused 59.2% of the decrease in streamflow. Obviously, the impact of human activities on the streamflow decrease became increasingly drastic.

4. Discussion

4.1. The Driving Factors of Bojiang Lake Area and Streamflow Changes and the Implications

In this study, the dynamics of the Bojiang Lake area and streamflow have similar trends. The variation processes could be divided into three sub-periods (i.e., 1974–1979, 1980–1999, and 2000–2013), and the main driving factors are distinguished in the different sub-periods. In the first and second sub-periods (1974–1979 and 1980–1999), when the human activities, mainly including direct water abstraction and land use/cover change, were gentle in the Bojiang Lake basin, the climate factors (i.e., precipitation and evapotranspiration) were undoubtedly the leading factors. During 1974–1979, the rapid increase of precipitation and relatively low evapotranspiration provided the lake with a large enough water supply and rapidly expanded to the maximum state. The drastic fluctuations of precipitation and evapotranspiration are reflected by the lake area and streamflow, which show similar intensive fluctuations during this period. From 1980 to 1999, the human activities increased slowly, yet were still gentle, so the climate factors were still the primary driving forces. The decrease of precipitation, weak decrease of evapotranspiration, and gentle increase of human activities jointly caused the lake area and streamflow to decline. Because the precipitation, as the water source of the lake, remained at a high level with a relatively stable variation, the lake area and streamflow during 1980–1999 exhibited gentle fluctuations and stayed at a relatively high level. Since the ELRNNR established in 1998, the enclosure for recovering vegetation has produced a good effect, and the vegetation in the Bojiang Lake basin witnessed comprehensive recovery, while an increase of vegetation transpiration and intercepting accordingly decreased the streamflow into the lake. In addition, some sediment-trapping dams were intensively built on the rivers after 2000 [46], so that direct streamflow into the lake was suddenly intercepted, blocking the water supply flowing into the lake. In the meantime, the direct water abstraction for irrigation and domestic uses increased by 200×104 m3 in the third sub-period compared with that in 1974–1979 [46]. Ecotourism after 2000 was also reasonably regarded as a possible cause of reserve devastation [74]. These factors of intensified human activities, along with decrease of precipitation and increase of evapotranspiration, causing the streamflow into the lake to markedly decline. Our results reveal that human activities became the main factor for the decrease in the annual streamflow in the third sub-period (2000–2013).
The present study has important implications for the protection of water resources in ELRNNR. In semi-arid regions, lake streamflow variation has a decisive role in the variations of lake size. Human disturbance is shown to have been a main factor for lake streamflow variation in ELRNNR since 1999, and the Relict Gull habitat has been seriously jeopardized. Therefore, some countermeasures should be immediately taken in order to protect ELRNNR and the Relict Gull habitat. Firstly, sediment-trapping dams need to be completely removed to allow more lake inflows in rainy seasons. A number of dams have been disabled by local authorities since 2009, but there are more to be removed to further recover the connectivity between Bojiang Lake and its inflow streams [48]. Secondly, water demand management should be promoted to reduce water consumption. Irrigation (including groundwater exploitation by pumping wells) and domestic water use need to be reduced by controlling agricultural land expansion and population overgrowth, and water saving technologies for irrigation and domestic water use also need to be promoted. Thirdly, an emergency water diversion project for ecological use should be carefully considered.

4.2. Quantification on Contributors of Lake Streamflow Variations in Ungauged Basins and the Uncertainties

The International Association of Hydrological Sciences (IAHS) decade on Predictions in Ungauged Basins (PUB during 2003–2012) [19,20], in combination with the new Scientific Decade (2013–2022) entitled “Panta Rhei-Everything Flows” [21], has always been one of the most important research fields in hydrological sciences. The Bojiang Lake basin, our study area in the paper, is a typical ungauged basin without monitoring data of the lake area, water level, and streamflow. By means of remote sensing technology, we obtained the long sequence of data for the lake area, and the lake volume was then calculated by the empirical formula of the lake area-volume constructed on the basis of the lake topography measurement and GIS analysis. Next, the lake streamflow was further calculated by the water balance method. So, the dynamics of the lake area, lake volume, and lake streamflow could be easily analyzed. Lastly, using the climate elasticity method, contributions of climate change and human activities to lake changes were quantitatively evaluated. These research ideas and this integrated approach could provide a useful and practical reference to a quantitative evaluation of lake streamflow and its driving forces in ungauged basins.
Several uncertainties exist in this study. Firstly, Landsat remote sensing image data include four formats with different spatial resolutions. The shortage of images in some months before 2000 results in the objective discontinuity of the lake area. Some images from the study region were of a poor quality, especially those in the 1970s and 1980s, due to objectively technical limitations, which make the data impossible to be considered at a “monthly” scale. There are no data available for download during 1981–1986, and the lake areas during this period were linear interpolated according to the precipitation, by comparing that with available remote sensing images data in the adjacent years, which affects the accuracy of the lake area to some extent. Secondly, we use the available images during the current month as the average value of the lake area, which leads to some deviation of the virtual conditionto a certain extent. Thirdly, the climate elasticity method assumes that climate variability and human activities are independent. However, climate variation and human activities are not totally independent. In fact, large-scale human activities, such as land use/cover change could affect the local climate system [75,76]. Lastly, due to the lack of exact long time series of continuous observation and investigation of specific human activities (water abstraction for irrigation and domestic uses, construction of sediment-trapping dams), we have to use the average value investigated in the different sub-periods instead of the actual water consumption.

5. Conclusions

The variation of Bojiang Lake streamflow and its driving forces from 1974 to 2013 were investigated using an integrated approach by integrating remote sensing, the water balance model, and climate elasticity method in this study. The main conclusions could be drawn as follows: (1) The processes of lake variation can be divided into three phases: A rapidly expanding sub-period (1974–1979), a relatively stable sub-period (1980–1999), and a dramatically shrinking sub-period (2000–2013). In the three sub-periods, the average annual lake areas were 8.494 km2, 8.971 km2, and 3.329 km2, respectively. Lake streamflow shares a similar trend with lake area, with annual average lake inflows of 14.42 mm, 8.10 mm, and 1.12 mm, respectively. During 1974–1979, the rapid increase of precipitation and relatively low evapotranspiration supplied the lake with a large enough water supply and rapidly expanded to the maximum state; during 1980–1999, the decrease of precipitation, weak decrease of evapotranspiration, and gentle increase of human activities jointly resulted in a decline of the lake area and streamflow; during 2000–2013, the intensified human activities, along with the decrease of precipitation and increase of evapotranspiration, caused the streamflow into the lake to markedly decline. (2) The main contributor of lake streamflow variations switches from climate variability to human activity after 2000. In the second sub-period (1980–1999), climate variation and human activities accounted for 77.7% and 22.3% of the total streamflow decrease, respectively, whereas they accounted for 40.8% and 59.2% of the total streamflow decrease in the third sub-period (2000–2013). Human activities, including the construction of sediment-trapping dams, ecotourism, and increase of direct water abstraction for irrigation and domestic uses, along with the decreasing precipitation and increasing evapotranspiration, are the main cause of the streamflow decrease in the third sub-period (2000–2013).

Acknowledgments

This research was supported by the National Natural Science Foundation of China project (Grant No. 41501032 and No. 41330529) and the Chinese Academy of Sciences Supported Consulting and Appraising Project “Water Security Assurance Strategy and Countermeasures of China”. Thanks for the anonymous reviewers’ valuable comments and thoughtful suggestions and the editor’s efforts in improving this manuscript.

Conflicts of Interest

The authors declare no conflict of interest. The founding sponsors had no role in the design of the study; in the collection, analyses, or interpretation of data; in the writing of the manuscript, and in the decision to publish the results.

References

  1. Downing, J.A.; Prairie, Y.T.; Cole, J.J.; Duarte, C.M.; Tranvik, L.J.; Striegl, R.G.; McDowell, W.H.; Kortelainen, P.; Caraco, N.F.; Melack, J.M.; et al. The global abundance and size distribution of lakes, ponds, and impoundments. Limnol. Oceanogr. 2006, 51, 2388–2397. [Google Scholar] [CrossRef]
  2. Talbot, M.R.; Delibrias, G. Holocene variations in the level of lake bosumtwi, ghana. Nature 1977, 268, 722–724. [Google Scholar] [CrossRef]
  3. Macdonald, G.M.; Edwards, T.W.D.; Moser, K.A.; Pienitz, R.; Smol, J.P. Rapid response of treeline vegetation and lakes to past climate warming. Nature 1993, 361, 243–246. [Google Scholar] [CrossRef]
  4. Williamson, C.E.; Saros, J.E.; Vincent, W.F.; Smold, J.P. Lakes and reservoirs as sentinels, integrators, and regulators of climate change. Limnol. Oceanogr. 2009, 54, 2273–2282. [Google Scholar] [CrossRef]
  5. Song, C.; Huang, B.; Richards, K.; Ke, L.; HienPhan, V. Accelerated lake expansion on the tibetan plateau in the 2000s: Induced by glacial melting or other processes? Water Resour. Res. 2014, 50, 3170–3186. [Google Scholar] [CrossRef]
  6. Tan, C.; Ma, M.; Kuang, H. Spatial-temporal characteristics and climatic responses of water level fluctuations of global major lakes from 2002 to 2010. Remote Sens. 2017, 9. [Google Scholar] [CrossRef]
  7. Ma, R.; Duan, H.; Hu, C.; Feng, X.; Li, A.; Ju, W.; Jiang, J.; Yang, G. A half-century of changes in china’s lakes: Global warming or human influence? Geophys. Res. Lett. 2010, 37, L24106. [Google Scholar] [CrossRef]
  8. Vanderhoof, M.K.; Alexander, L.C. The role of lake expansion in altering the wetland landscape of the prairie pothole region, united states. Wetlands 2016, 36, 309–321. [Google Scholar] [CrossRef]
  9. Wu, Q.; Lane, C.R. Delineation and quantification of wetland depressions in the prairie pothole region of north dakota. Wetlands 2016, 36, 215–227. [Google Scholar] [CrossRef]
  10. Wantzen, K.M.; Rothhaupt, K.-O.; Mörtl, M.; Cantonati, M.; G.-Tóth, L.; Fischer, P. Ecological effects of water-level fluctuations in lakes. Hydrobiologia 2008, 613, 1–4. [Google Scholar] [CrossRef]
  11. Song, C.; Huang, B.; Ke, L. Heterogeneous change patterns of water level for inland lakes in high mountain asia derived from multi-mission satellite altimetry. Hydrol. Processes 2014, 29, 2769–2781. [Google Scholar] [CrossRef]
  12. Yang, X.; Lu, X. Drastic change in china’s lakes and reservoirs over the past decades. Sci. Rep. 2014, 4, 6041. [Google Scholar] [CrossRef] [PubMed]
  13. Coe, M.T.; Foley, J.A. Human and natural impacts on the water resources of the lake chad basin. J. Geophys. Res. Atmos. 2001, 106, 3349–3356. [Google Scholar] [CrossRef]
  14. Assel, R.A.; Quinn, F.H.; Sellinger, C.E. Hydroclimatic factors of the recent record drop in laurentian great lakes water levels. Bull. Am. Meteorol. Soc. 2004, 85, 1143–1151. [Google Scholar] [CrossRef]
  15. Sellinger, C.E.; Stow, C.A.; Lamon, E.C.; Qian, S.S. Recent water level declines in the lake michigan-huron system. Environ. Sci. Technol. 2008, 42, 367–373. [Google Scholar] [CrossRef] [PubMed]
  16. Gao, H.; Bohn, T.J.; Podest, E.; Mcdonald, K.C.; Lettenmaier, D.P. On the causes of the shrinking of lake chad. Environ. Res. Lett. 2011, 6, 329–346. [Google Scholar] [CrossRef]
  17. Tao, S.; Fang, J.; Zhao, X.; Zhao, S.; Shen, H.; Hu, H.; Tang, Z.; Wang, Z.; Guo, Q. Rapid loss of lakes on the mongolian plateau. Proc. Natl. Acad. Sci. USA 2015, 112, 2281–2286. [Google Scholar] [CrossRef] [PubMed]
  18. Zhang, Q.; Liu, J.; Singh, V.P.; Gu, X.; Chen, X. Evaluation of impacts of climate change and human activities on streamflow in the poyang lake basin, China. Hydrol. Proc. 2016, 30, 2562–2572. [Google Scholar] [CrossRef]
  19. Hrachowitz, M.; Savenije, H.H.G.; Blöschl, G.; Mcdonnell, J.J.; Sivapalan, M.; Pomeroy, J.W.; Arheimer, B.; Blume, T.; Clark, M.P.; Ehret, U. A decade of predictions in ungauged basins (pub)—A review. Hydrol. Sci. J. 2013, 58, 1–58. [Google Scholar] [CrossRef]
  20. Sivapalan, M.; Takeuchi, K.; Franks, S.W.; Gupta, V.K.; Karambiri, H.; Lakshmi, V.; Liang, X.; McDonnell, J.J.; Mendiondo, E.M.; O’Connell, P.E.; et al. Iahs decade on prediction in ungauged basins (pub), 2003–2012: Shaping an exciting future for the hydrological sciences. Hydrol. Sci. J. 2003, 48, 857–880. [Google Scholar] [CrossRef]
  21. Montanari, A.; Young, G.; Savenije, H.H.G.; Hughes, D.; Wagener, T.; Ren, L.L.; Koutsoyiannis, D.; Cudennec, C.; Toth, E.; Grimaldi, S. Pantarhei-everything flows: Change in hydrology and society—The iahs scientific decade 2013–2022. Hydrol. Sci. J. 2013, 58, 1256–1275. [Google Scholar] [CrossRef]
  22. Birkett, C.M. The contribution of topex/poseidon to the global monitoring of climatically sensitive lakes. J. Geophys. Res. Atmos. 1995, 100, 25179–25204. [Google Scholar] [CrossRef]
  23. Frazier, P.S.; Page, K.J. Water body detection and delineation with landsat tm data. Photogramm. Eng. Remote Sens. 2000, 66, 1461–1468. [Google Scholar]
  24. Alsdorf, D.E.; Rodriguez, E.; Lettenmaier, D.P. Measuring surface water from space. Rev. Geophys. 2007, 45, RG2002. [Google Scholar] [CrossRef]
  25. Song, C.; Huang, B.; Ke, L. Modeling and analysis of lake water storage changes on the tibetan plateau using multi-mission satellite data. Remote Sens. Environ. 2013, 135, 25–35. [Google Scholar] [CrossRef]
  26. Mueller, N.; Lewis, A.; Roberts, D.; Ring, S.; Melrose, R.; Sixsmith, J.; Lymburner, L.; Mcintyre, A.; Tan, P.; Curnow, S. Water observations from space: Mapping surface water from 25years of landsat imagery across australia. Remote Sens. Environ. 2015, 174, 341–352. [Google Scholar] [CrossRef]
  27. Lane, C.R.; Anenkhonov, O.; Liu, H.; Autrey, B.C.; Chepinoga, V. Classification and inventory of freshwater wetlands and aquatic habitats in the selenga river delta of lake baikal, russia, using high-resolution satellite imagery. Wetl. Ecol. Manag. 2015, 23, 1–20. [Google Scholar] [CrossRef]
  28. Deus, D.; Gloaguen, R.; Krause, P. Water balance modeling in a semi-arid environment with limited in situ data using remote sensing in lake manyara, east african rift, tanzania. Remote Sens. 2013, 5, 1651–1680. [Google Scholar] [CrossRef]
  29. Pan, F.; Liao, J.; Li, X.; Guo, H. Application of the inundation area—lake level rating curves constructed from the srtmdem to retrieving lake levels from satellite measured inundation areas. Comput. Geosci. 2013, 52, 168–176. [Google Scholar] [CrossRef]
  30. Guo, M.; Wu, W.; Zhou, X.; Chen, Y.; Li, J. Investigation of the dramatic changes in lake level of the bosten lake in northwestern china. Theor. Appl. Clim. 2014, 119, 341–351. [Google Scholar] [CrossRef]
  31. Wang, F.; Liang, L.; Zhang, Y.; Gao, R. Eco-hydrological model and critical conditions of hydrology of the wetland of erdoslarusrelictus nature reserve. Acta Ecol. Sin. 2009, 29, 307–313. [Google Scholar] [CrossRef]
  32. Kebede, S.; Travi, Y.; Alemayehu, T.; Marc, V. Water balance of lake tana and its sensitivity to fluctuations in rainfall, blue nile basin, ethiopia. J. Hydrol. 2006, 316, 233–247. [Google Scholar] [CrossRef]
  33. Baup, F.; Frappart, F.; Maubant, J. Combining high-resolution satellite images and altimetry to estimate the volume of small lakes. Hydrol. Earth Syst. Sci. 2014, 18, 2007–2020. [Google Scholar] [CrossRef]
  34. Schaake, J.C. From climate to flow. In Climate Change and US Water Resources; WhileyInterscience: New York, NY, USA, 1990; pp. 177–206. [Google Scholar]
  35. Dooge, J.; Bruen, M.; Parmentier, B. A simple model for estimating the sensitivity of runoff to long-term changes in precipitation without a change in vegetation. Adv. Water Resour. 1999, 23, 153–163. [Google Scholar] [CrossRef]
  36. Sankarasubramanian, A.; Vogel, R.M.; Limbrunner, J.F. Climate elasticity of streamflow in the United States. Water Resour. Res. 2001, 37, 1771–1781. [Google Scholar] [CrossRef]
  37. Arora, V.K. The use of the aridity index to assess climate change effect on annual runoff. J. Hydrol. 2002, 265, 164–177. [Google Scholar] [CrossRef]
  38. Fu, G.; Charles, S.P.; Chiew, F.H. A two-parameter climate elasticity of streamflow index to assess climate change effects on annual streamflow. Water Resour. Res. 2007, 43, W11419. [Google Scholar] [CrossRef]
  39. Yang, H.; Yang, D. Derivation of climate elasticity of runoff to assess the effects of climate change on annual runoff. Water Resour. Res. 2011, 47, W07526. [Google Scholar] [CrossRef]
  40. Liu, X.; Liu, C.; Luo, Y.; Zhang, M.; Xia, J. Dramatic decrease in streamflow from the headwater source in the central route of china's water diversion project: Climatic variation or human influence? J. Geophys. Res. Atmos. 2012, 117, D06113. [Google Scholar] [CrossRef]
  41. Liang, K.; Liu, C.; Liu, X.; Song, X. Impacts of climate variability and human activity on streamflow decrease in a sediment concentrated region in the middle yellow river. Stoch. Environ. Res. Risk Assess. 2013, 27, 1741–1749. [Google Scholar] [CrossRef]
  42. Zhang, D.; Liu, X.; Liu, C.; Bai, P. Responses of runoff to climatic variation and human activities in the fenhe river, china. Stoch. Environ. Res. Risk Assess. 2013, 27, 1293–1301. [Google Scholar] [CrossRef]
  43. Zhao, C.; Liu, C.; Dai, X.; Liu, T.; Duan, Z.; Liu, L.; Mitrovic, S.M. Separation of the impacts of climate change and human activity on runoff variations. Hydrol. Sci. J. 2015, 60, 234–246. [Google Scholar] [CrossRef]
  44. Ramsar, C. The List of Wetlands of International Importance; RAMSAR Secretariat: Gland, Switzerland, 2004. [Google Scholar]
  45. He, F.; Melville, D.; Xing, X.; Ren, Y. A review on studies of the relict gull larusrelictus. Chin. J. Zool. 2002, 37, 65–70. (In Chinese) [Google Scholar]
  46. Xing, X.; Yu, X.; Bai, Z.; Jia, L. Analysis of water balance of the wetland in erdoslarusrelictus nature reserve. J. Arid Land Resour. Environ. 2009, 23, 100–103. (In Chinese) [Google Scholar]
  47. Duff, D.G.; Bakewell, D.N.; Williams, M.D. The relict gull larusrelictus in china and elsewhere. Forktail 1991, 6, 43–65. [Google Scholar]
  48. He, F.; Zhang, Y.; Wu, Y.; Gao, T. The distribution of the relict gull larusrelictus in maowusu desert, Inner Mongolia, China. Forktail 1992, 7, 151–154. [Google Scholar]
  49. He, F.; Ren, Y.; Bai, X. Preview of the no. 1148 ramsar site on the ordos upland of western inner Mongolia. Chin. Birds 2010, 1, 80–81. [Google Scholar] [CrossRef]
  50. He, F.; Ren, Y.; Guo, Y. Habitat succession and development of waterbird population in Tiaolimiao-Alashan lake in inner Mongolia. Wetl. Sci. Manag. 2015, 11, 54–58. (In Chinese) [Google Scholar]
  51. Zhang, Y.; Liu, C.; Tian, L.; Bu, H. Recent records of the relict gull larusrelictus in western neimongol autonomous region, China. Forktail 1991, 6, 66–67. [Google Scholar]
  52. Zhang, Y.; Ding, W.; Bu, H.; Tian, L. Breeding ecology of the relict gull larusrelictus in ordos, inner Mongolia, China. Forktail 1992, 7, 131–137. [Google Scholar]
  53. Zhang, Y.; He, F.A. Study of the breeding ecology of the relict gull larusrelictus at ordos, inner Mongolia, China. Forktail 1993, 8, 125–132. [Google Scholar]
  54. Liang, K.; Lou, H.; Cheng, C. Characteristics of groundwater flow in the ordoslarusrelictus reserve wetland. Resour. Sci. 2011, 33, 1089–1098. (In Chinese) [Google Scholar]
  55. Yan, G.; Lou, H.; Liang, K.; Zhang, Z. Dynamics and driving forces of bojiang lake area in Erdoslarusrelictus national nature reserve, China. Quat. Int. 2016, (in press). [Google Scholar]
  56. Allen, R.G.; Pereira, L.S.; Raes, D.; Smith, M. Crop evapotranspiration-guidelines for computing crop water requirements-fao irrigation and drainage paper 56. FAO Rome 1998, 300, D05109. [Google Scholar]
  57. Xu, H. Modification of normalised difference water index (NDWI) to enhance open water features in remotely sensed imagery. Int. J. Remote Sens. 2006, 27, 3025–3033. [Google Scholar] [CrossRef]
  58. Gao, B.C. SPIE’s 1995 Symposium on OE/Aerospace Sensing and Dual Use Photonics. In Normalized Difference Water Index for Remote Sensing of Vegetation Liquid Water from Space; International Society for Optics and Photonics, 1995; pp. 225–236. [Google Scholar]
  59. Jackson, T.J.; Chen, D.; Cosh, M.; Li, F.; Anderson, M.; Walthall, C.; Doriaswamy, P.; Hunt, E.R. Vegetation water content mapping using landsat data derived normalized difference water index for corn and soybeans. Remot. Sens. Environ. 2004, 92, 475–482. [Google Scholar] [CrossRef]
  60. McFeeters, S.K. The use of the normalized difference water index (NDWI) in the delineation of open water features. Int. J. Remote Sens. 1996, 17, 1425–1432. [Google Scholar] [CrossRef]
  61. Duan, Z.; Bastiaanssen, W. Estimating water volume variations in lakes and reservoirs from four operational satellite altimetry databases and satellite imagery data. Remote Sens. Environ. 2013, 134, 403–416. [Google Scholar] [CrossRef]
  62. Ji, L.; Zhang, L.; Wylie, B. Analysis of dynamic thresholds for the normalized difference water index. Photogramm. Engin. Remote Sens. 2009, 75, 1307–1317. [Google Scholar] [CrossRef]
  63. Liu, C.; Zhang, D.; Liu, X.; Zhao, C. Spatial and temporal change in the potential evapotranspiration sensitivity to meteorological factors in China (1960–2007). J. Geogr. Sci. 2012, 22, 3–14. [Google Scholar] [CrossRef]
  64. Milly, P.; Dunne, K. Macroscale water fluxes 2. Water and energy supply control of their interannual variability. Water Res. 2002, 38, 45–65. [Google Scholar] [CrossRef]
  65. Fu, G.; Charles, S.P.; Viney, N.R.; Chen, S.; Wu, J.Q. Impacts of climate variability on stream-flow in the yellow river. Hydro. Proc. 2007, 21, 3431–3439. [Google Scholar] [CrossRef]
  66. Budyko, M. Evaporation under natural conditions, gidrometeorizdat, leningrad. In Climate and Life; Academic Press: London, UK, 1974. [Google Scholar]
  67. Zhang, L.; Dawes, W.; Walker, G. Response of mean annual evapotranspiration to vegetation changes at catchment scale. Water Res. 2001, 37, 701–708. [Google Scholar] [CrossRef]
  68. Keyantash, J.; Dracup, J.A. The quantification of drought: An evaluation of drought indices. Bull. Am. Meteoriol. Soc. 2002, 83, 1167. [Google Scholar]
  69. Van Den Broeke, M.; Bamber, J.; Ettema, J.; Rignot, E.; Schrama, E.; van de Berg, W.J.; van Meijgaard, E.; Velicogna, I.; Wouters, B. Partitioning recent greenland mass loss. Science 2009, 326, 984–986. [Google Scholar] [CrossRef] [PubMed]
  70. Wei, F. Modern Climatic Statistical Diagnosis and Prediction Techniques, 2nd ed.; China Meteorological Press: Beijing, China, 2007. [Google Scholar]
  71. Yang, M.; Yao, T.; He, Y.; Thompson, L. Enso events recorded in the guliya ice core. Clim. Chan. 2000, 47, 401–409. [Google Scholar] [CrossRef]
  72. Gibbs, P.H. Introduction to linear regression analysis. Technometrics 2012, 25, 2775–2776. [Google Scholar] [CrossRef]
  73. Mislick, G.K.; Nussbaum, D.A. Linear Regression Analysis; John Wiley: Hoboken, NJ, USA, 2003; pp. 362–363. [Google Scholar]
  74. Ecotourism and Nature-Reserve Sustainability in Environmentally Fragile Poor Areas: The Case of the Ordos Relict Gull Reserve in China. Available online: http://0-search-proquest-com.brum.beds.ac.uk/openview/cb511451ad749ab1bc63b57fbe102f4e/1?pq-origsite=gscholar&cbl=136137 (accessed on 9 June 2017).
  75. Foley, J.A.; DeFries, R.; Asner, G.P.; Barford, C.; Bonan, G.; Carpenter, S.R.; Chapin, F.S.; Coe, M.T.; Daily, G.C.; Gibbs, H.K. Global consequences of land use. Science 2005, 309, 570–574. [Google Scholar] [CrossRef] [PubMed]
  76. Pielke, R.A.; Marland, G.; Betts, R.A.; Chase, T.N.; Eastman, J.L.; Niles, J.O.; Running, S.W. The influence of land-use change and landscape dynamics on the climate system: Relevance to climate-change policy beyond the radiative effect of greenhouse gases. Philos. Trans. A Math. Phys. Eng. Sci. 2002, 360, 1705–1719. [Google Scholar] [CrossRef] [PubMed]
Figure 1. Location of the Erdos Larus relictus National Nature Reserve (ELRNNR).
Remotesensing 09 00588 g001
Figure 2. Example of the remote sensing extracting water area of Bojiang Lake based on MNDWI. The date of used images in Figure a and b are 28/September/1995 and 28/August/2013, respectively. (a-1) and (b-1) show the false color composite images of Bojiang Lake by SWIR2, SWIR1, and Green bands. (a-2) and (b-2) show the calculated results of MNDWI. (a-3) and (b-3) show the lake water surface with the MNDWI threshold value of 0.35 (the black regions).
Remotesensing 09 00588 g002
Figure 3. Variations of (a) average annual lake area, (b) annual anomaly and accumulative anomaly, (c) average annual lake volume, and (d) anomaly and accumulative anomaly of volume in the Erdos Larus relictus National Nature Reserve (ELRNNR).
Remotesensing 09 00588 g003
Figure 4. Variations in the spatial distribution range of Bojiang Lake during different typical periods.
Remotesensing 09 00588 g004
Figure 5. Variations of (a) annual average lake streamflow, (b) annual anomaly and accumulative anomaly of streamflow, (c) annual average precipitation, (d) annual anomaly and accumulative anomaly of precipitation, (e) annual average potential evapotranspiration, (f) annual anomaly and accumulative anomaly of potential evapotranspiration in the Bojiang Lake basin.
Remotesensing 09 00588 g005
Table 1. Information of used remote sensing images in the Bojiang Lake basin during 1974–2013.
YearSensorPath/RowAcquisition Date (DD/MM)
1974MSS137/32, 138/3224/05, 11/06
1975MSS137/32, 138/3222/04, 28/05, 16/06, 21/07, 09/08, 14/09, 20/10
1976MSS137/32, 138/3216/04, 22/05, 28/06, 16/07, 21/08, 25/09
1977MSS137/32, 138/3229/04, 18/05, 23/06, 16/08, 20/09, 09/10
1978MSS137/32, 138/3228/04, 21/05, 26/06, 14/07, 20/08, 25/09, 12/10
1979MSS137/32, 138/3216/05, 21/06, 19/09, 25/10
1980MSS137/32, 138/3222/04, 10/05, 15/06, 21/07, 26/08, 13/09, 19/10
1981MSS-No data available for download, linear interpolation by precipitation in August
1982MSS-
1983MSS-
1984MSS/TM-
1985MSS/TM-
1986TM-
1987TM128/32, 127/3217/08, 24/10, 16/11, 18/12
1988TM128/32, 127/3217/04, 19/05, 20/06, 29/07, 14/08, 15/09, 17/10, 27/11, 20/12
1989TM128/32, 127/3229/05, 14/06, 09/07, 26/08, 27/09, 29/10, 30/11, 23/12
1990TM128/32, 127/3229/03, 23/04, 25/05, 26/06, 19/07, 29/08, 05/09, 16/10, 17/11, 10/12
1991TM128/32, 127/3204/01, 21/02, 26/04, 19/05, 20/06, 31/07, 23/08, 17/09, 26/10, 27/11
1992TM128/32, 127/3230/05, 22/06, 17/07, 25/08, 26/09, 12/10, 22/11, 24/12
1993TM128/32, 127/3226/02, 30/03, 15/04, 24/05, 18/06, 20/07, 22/09, 24/10, 27/12
1994TM128/32, 127/3224/03, 25/04, 27/05, 21/06, 14/07, 31/08, 25/09, 02/10, 28/11, 14/12
1995TM128/32, 127/3231/01, 16/02, 20/03, 21/04, 24/06, 26/07, 18/08, 28/09, 30/10, 15/11, 24/12
1996TM128/32, 127/3226/02, 23/04, 25/05, 17/06, 12/07, 29/08, 21/09, 23/10, 24/11
1997TM128/32, 127/3228/02, 16/03, 26/04, 02/05, 29/06, 31/07, 23/08, 24/09, 26/10, 27/11, 22/12
1998TM128/32, 127/3230/01, 28/03, 20/04, 31/05, 23/06, 09/07, 26/08, 27/09, 22/10, 30/11, 25/12
1999TM/ETM+128/32, 127/3227/02, 09/05, 26/06, 28/07, 22/08, 23/09, 25/10, 26/11, 28/12
2000TM/ETM+128/32, 127/3220/01, 21/02, 17/03, 18/04, 20/05, 21/06, 30/07, 31/08, 25/09, 27/10, 28/11, 30/12
2001TM/ETM+128/32, 127/3222/01, 23/02, 27/03, 21/04, 30/05, 24/06, 26/07, 27/08, 19/09, 21/10, 22/11, 16/12
2002TM/ETM+128/32, 127/3225/01, 26/02, 23/03, 24/04, 26/05, 27/06, 29/07, 30/08, 15/09, 17/10, 25/11, 20/12
2003TM/ETM+128/32, 127/3221/01, 22/02, 10/03, 11/04, 29/05, 21/06, 23/07, 24/08, 25/09, 27/10, 28/11, 30/12
2004TM/ETM+128/32, 127/3224/01, 25/02, 28/03, 29/04, 22/05, 23/06, 25/07, 26/08, 27/09, 29/10, 23/11, 25/12
2005TM/ETM+128/32, 127/3226/01, 27/02, 22/03, 23/04, 25/05, 19/06, 28/07, 29/08, 23/09, 25/10, 26/11, 27/12
2006TM/ETM+128/32, 127/3229/01, 21/02, 25/03, 26/04, 28/05, 29/06, 31/07, 30/08, 26/09, 28/10, 20/11, 22/12
2007TM/ETM+128/32, 127/3223/01, 24/02, 28/03, 29/04, 31/05, 25/06, 27/07, 28/08, 20/09, 21/10, 26/11, 27/12
2008TM/ETM+128/32, 127/3227/01, 28/02, 22/03, 23/04, 25/05, 26/06, 21/07, 22/08, 30/09, 25/10, 27/11, 28/12
2009TM/ETM+128/32, 127/3220/01, 21/02, 25/03, 26/04, 28/05, 29/06, 24/07, 25/08, 26/09, 28/10, 20/11, 22/12
2010TM/ETM+128/32, 127/3223/01, 24/02, 28/03, 29/04, 24/05, 25/06, 18/07, 25/08, 13/09, 15/10, 16/11, 18/12
2011TM/ETM+128/32, 127/3219/01, 20/02, 24/03, 25/04, 27/05, 28/06, 30/07, 31/08, 23/09, 24/10, 26/11, 28/12
2012ETM+128/32, 127/3222/01, 23/02, 26/03, 27/04, 20/05, 21/06, 23/07, 24/08, 25/09, 27/10, 28/11, 30/12
2013ETM+/OLI128/32, 127/3224/01, 25/02, 20/03, 21/04, 23/05, 24/06, 27/07, 28/08, 29/09, 22/10, 24/11, 26/12
Table 2. Impacts of climate change and human activities on streamflow in the Bojiang Lake basin estimated by the climate elasticity method*.
PeriodQinQHdQnaΔQnaΔQC ΔQH ΔQPΔQE0ΔQHindΔQHd
(mm)(mm)(mm)(mm)(mm)%(mm)%(mm)(mm)(mm)(mm)
I14.426.5320.95
II8.107.0515.15-6.33−4.9177.7−1.4322.3−5.230.31−0.89−0.52
III1.129.1910.31−13.31−5.4340.8−7.9159.2−5.11−0.32−5.21−2.66
*Period I, II and III are 1974–1979, 1980–1999, and 2000–2013, respectively. Qin, QHd and Qna are average annual “calculated” lake streamflow, “direct impact” of human activities, and “naturalized streamflow”. ΔQna is the changes of streamflow between period II (or III) and period I. ΔP is the difference of annual average precipitation. ΔE0 indicates the difference of average annual potential evapotranspiration. ΔQC, ΔQH, ΔQP, ΔQE0, ΔQHd, and ΔQHind are changes in the streamflow due to climate variability and human activities and their components (i.e., streamflow changes due to precipitation, potential evapotranspiration, “direct water abstraction”, and “indirect impact”), respectively.

