Article

Remotely Monitoring Ecosystem Water Use Efficiency of Grassland and Cropland in China’s Arid and Semi-Arid Regions with MODIS Data

1
Chongqing Key Laboratory of Karst Environment, School of Geographical Sciences, Southwest University, Chongqing 400715, China
2
Institute of Geographic Sciences and Natural Resources Research, Chinese Academy of Sciences, Beijing 100101, China
3
Nanjing Institute of Geography and Limnology, Chinese Academy of Sciences, Nanjing 210008, China
*
Authors to whom correspondence should be addressed.
Submission received: 27 April 2017 / Revised: 27 May 2017 / Accepted: 13 June 2017 / Published: 16 June 2017

Abstract

:
Scarce water resources are available in the arid and semi-arid areas of Northwest China, where significant water-related challenges will be faced in the coming decades. Quantitative evaluations of the spatio-temporal dynamics in ecosystem water use efficiency (WUE), as well as the underlying environmental controls, are crucial for predicting future climate change impacts on ecosystem carbon-water interactions and agricultural production. However, these questions remain poorly understood in this typical region. By means of continuous eddy covariance (EC) measurements and time-series MODIS data, this study revealed the distinct seasonal cycles in gross primary productivity (GPP), evapotranspiration (ET), and WUE for both grassland and cropland ecosystems, and the dominant climate factors performed jointly by temperature and precipitation. The MODIS WUE estimates from GPP and ET products can capture the broad trend in WUE variability of grassland, but with large biases for maize cropland, which was mainly ascribed to large uncertainties resulting from both GPP and ET algorithms. Given the excellent biophysical performance of the MODIS-derived enhanced vegetation index (EVI), a new greenness model (GR) was proposed to track the eight-day changes in ecosystem WUE. Seasonal variations and the scatterplots between EC-based WUE and the estimates from time-series EVI data (WUEGR) also certified its prediction accuracy with R2 and RMSE of both grassland and cropland ecosystems over 0.90 and less than 0.30 g kg−1, respectively. The application of the GR model to regional scales in the near future will provide accurate WUE information to support water resource management in dry regions around the world.

Graphical Abstract

1. Introduction

Recently, considerable attention has been given to the coupling relationship between carbon and water cycles in the context of profound influences on terrestrial ecosystems being exerted by the changing climate [1,2,3]. As an indicator of carbon-water interactions, ecosystem water use efficiency (WUE) is often defined as the amount of carbon fixed (gross primary productivity—GPP) per unit of water loss (evapotranspiration—ET) [4,5]. Therefore, the seasonal characteristics of WUE are essentially depending on the strength of coupled GPP and ET components, as well as individual responses to environmental controls, because climate affects carbon and water processes differently [6,7].
With the help of continuous observations of ecosystems-level carbon and water exchanges between the Earth’s biosphere and the atmosphere based on the eddy covariance (EC) technique, site-level evaluation or comparisons among multiple sites has been widely used to assess the WUE variability and its relationship with weather conditions across different time and space scales [8,9]. Previous studies have found that seasonal dynamics in WUE varied with vegetation types and climate variables, including radiation, temperature and precipitation [10,11]. Using flux measurements from four grasslands [12] and temperate deciduous forests [13] in northern mid- and high latitudes, WUE was found to reach its peak during the summertime, whereas Reichstein et al. [14] revealed WUE at three Mediterranean forests with the maximum in winter and the minimum in summer, and attributed it to the effects of drought during the growth period. Similar phenomena were also exhibited in northern subtropical forests [10,15]. Meanwhile, contrasting responses of GPP and ET to climate changes will yield significant consequences to the WUE variability under water-limited [16], light-limited [17], and thermal-limited environments [11,18]. Nevertheless, the knowledge about seasonal cycles of WUE, as well as the potential environmental influences remains insufficient for a variety of terrestrial ecosystems because these analyses are usually rely on spatially sparse site observations. Recently, the remote sensing approaches together with process-based ecosystem models have been developed to evaluate seasonal or long-term trends of WUE through GPP and ET estimates at regional to global scales [5,19,20]. However, large uncertainties in both components, thereby propagating to WUE, and the inconsistency of modeled and measured WUE on short and long timescales constrained its application [21]. It remains a challenge to accurately monitor seasonal variations in WUE over large areas for water resource management.
In the northwestern arid and semi-arid regions of China, natural grassland and irrigated agriculture are the main ecosystem types which play an important role in the regional carbon balance, hydrological patterns, and food supply [22,23]. However, few studies addressed the interactions between carbon and water cycles in this water-limited area owing to lack of eddy covariance measurements. The overall aim of this study was (1) to examine seasonal variations in GPP, ET and ecosystem WUE, as well as the dominant environmental controls at the two grassland and cropland flux sites; (2) to evaluate the performance of MODIS WUE estimates from GPP and ET products in capturing the EC-based WUE variability and the error sources; and (3) to propose an alternative method for improving the estimation accuracy directly depending on remotely-sensed data.

2. Materials and Methods
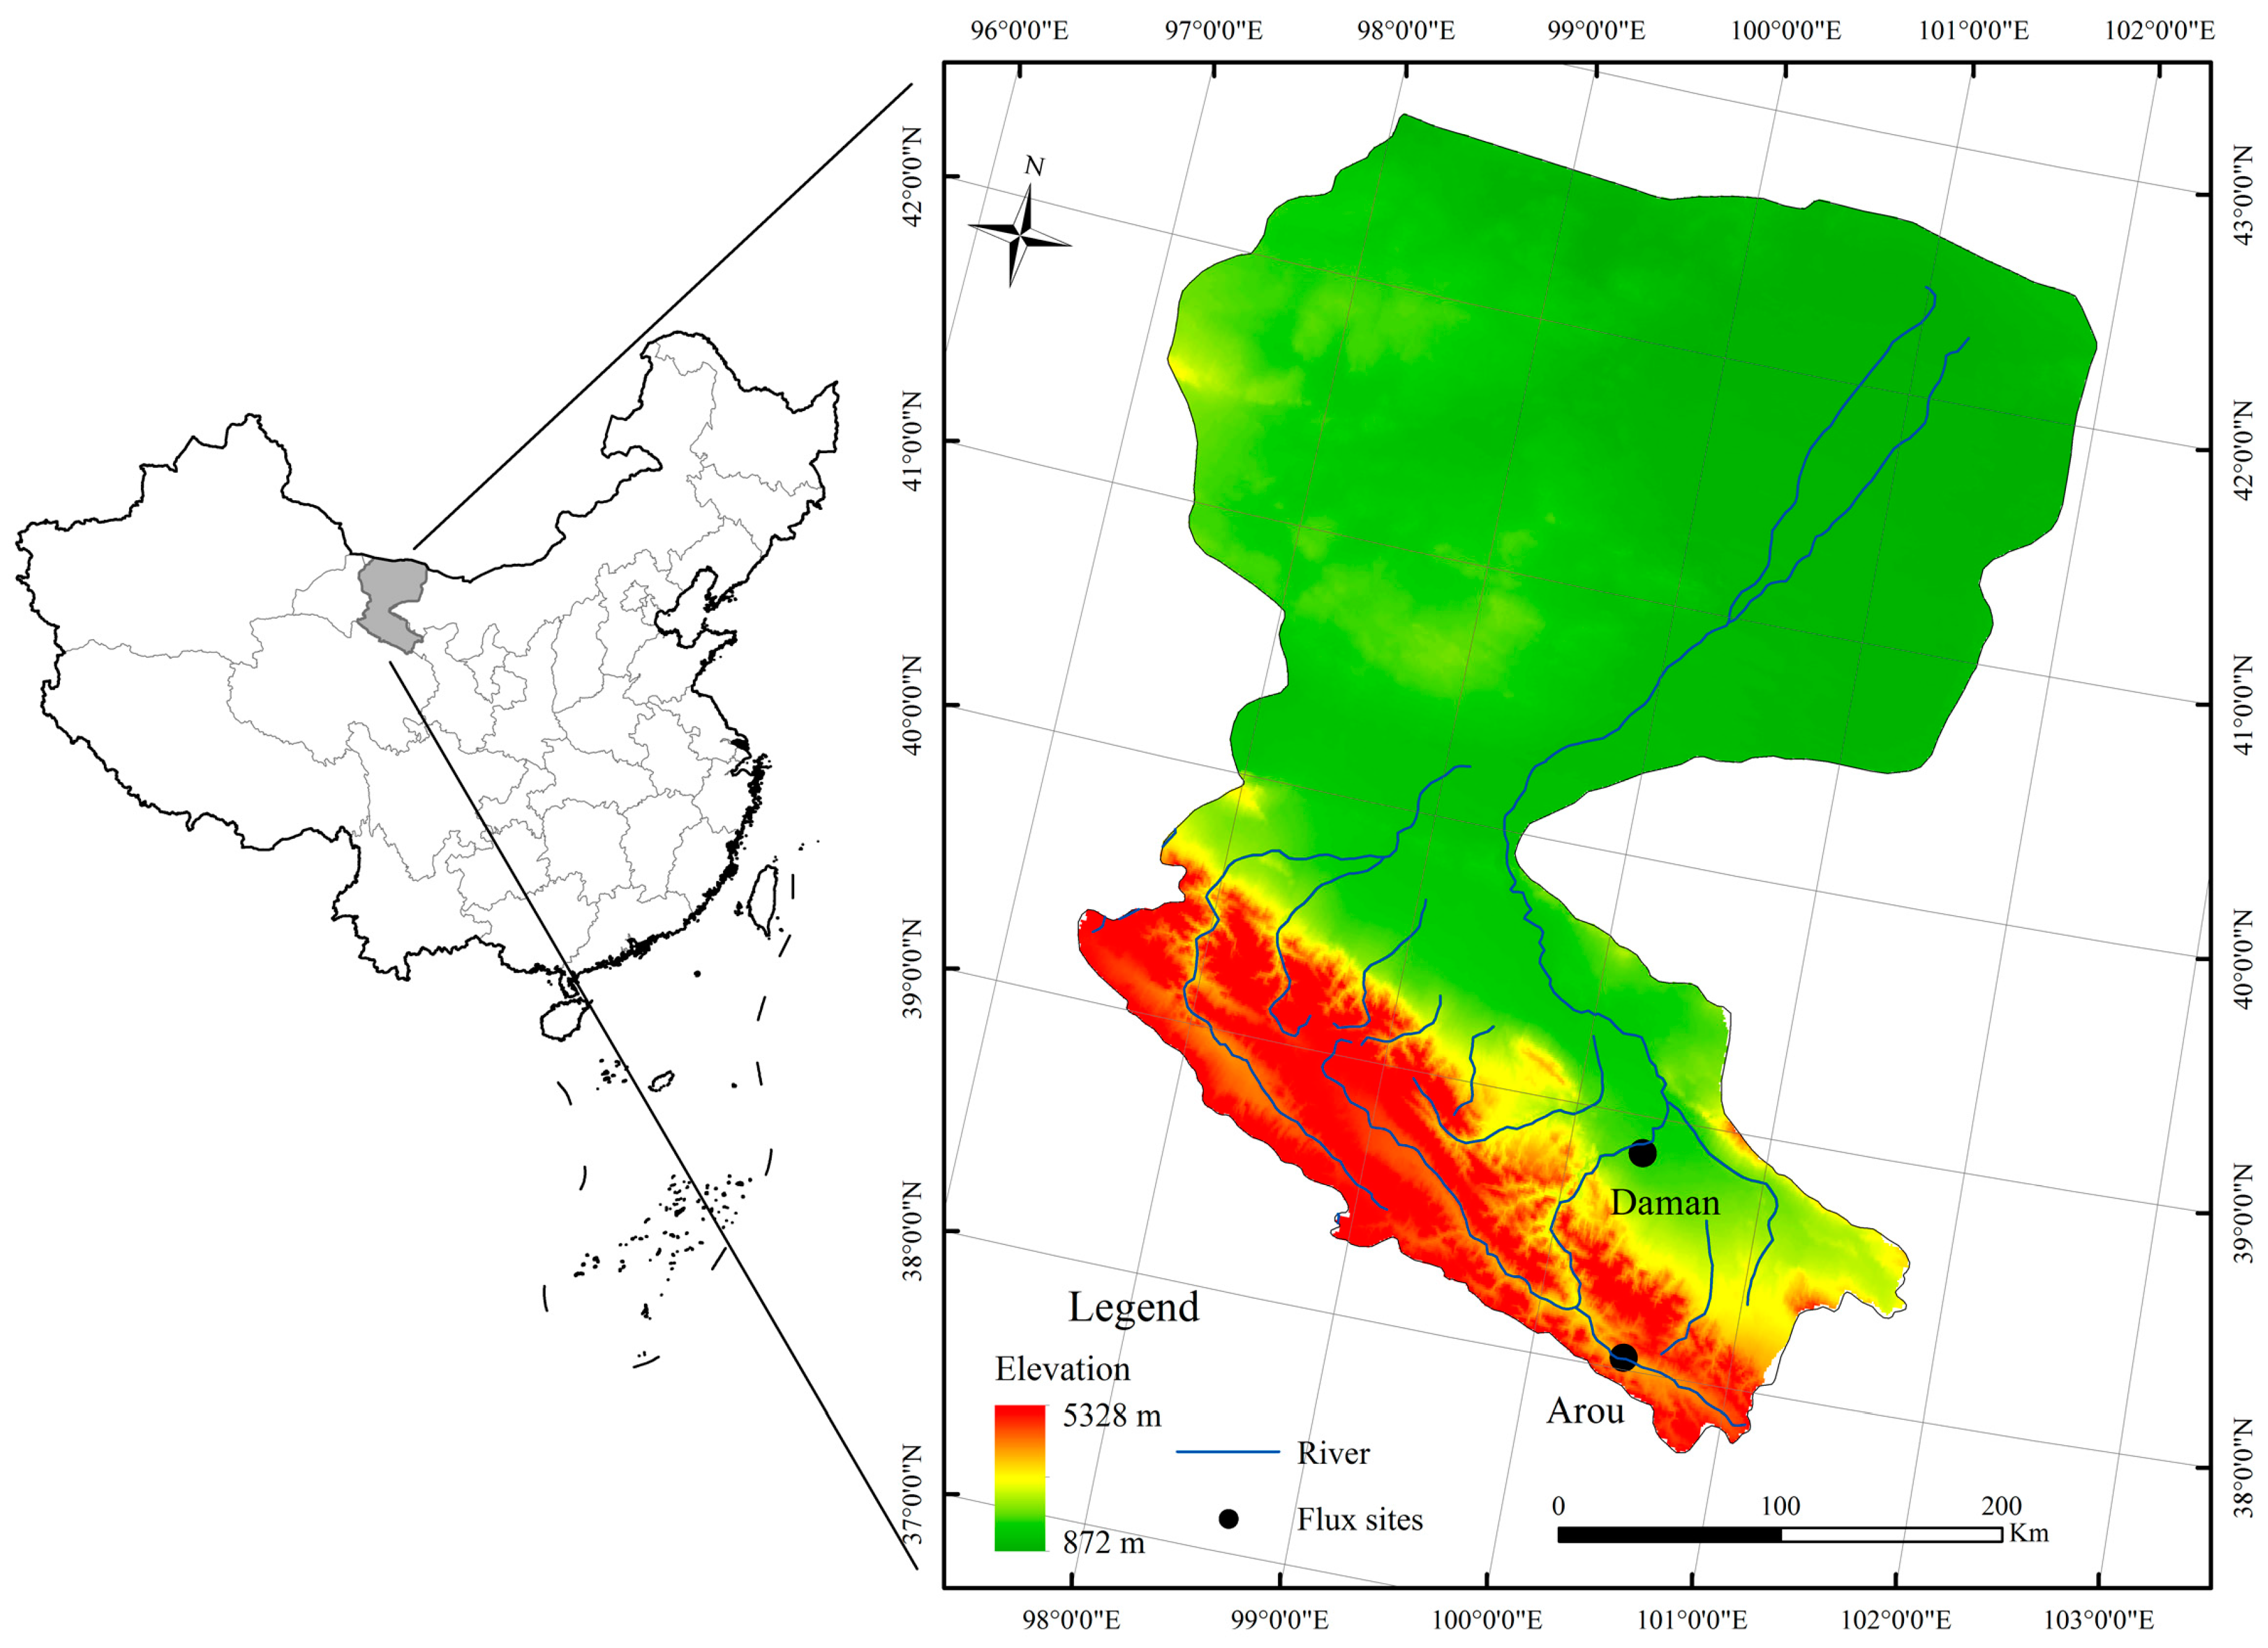
2.1. Study Sites

This study used the EC-based flux data from a grassland site (Arou) and an agricultural site (Daman) located in the Heihe River basin in the arid and semi-arid areas of Northwest China, which is part of the integrated research network entitled “Heihe Watershed Allied Telemetry Experimental Research” (HiWATER) that aims to improve our understanding of hydrological and ecological processes, to establish a world-leading watershed observing system, and to enhance the applicability of multi-source remotely-sensed data in managing scarce water resources in dry regions [22,24]. The Arou superstation has been set up since the end of 2012 to measure the land-atmosphere exchanges of carbon and water at the Alpine meadow ecosystem (the maximum height of grass is approximately 0.2–0.3 m during the summertime). This site is placed in a valley oriented in an east-west direction with a maximum width of 3 km from south to north in the upstream Heihe River, with mean annual temperature and annual total precipitation of 0.9 °C and 403.1 mm (1960–2000), respectively [25]. The terrain around Arou site is relatively flat with a gentle decline from the southeast to the northwest, and the soil texture is sand mixed with silt. However, the Daman site is located in the middle reaches of the Heihe River, with the total annual precipitation and average annual temperature of 126.7 mm and 7.2 °C from 1960 to 2000, respectively [26]. The EC system was installed in a typical oasis with very flat terrain, about 8 km southwest of Zhangye City, and started to work from September 2012. Maize is the dominant crop type in this area, which is generally sown in late April and harvested in the middle of September, with a maximum height of 1.8 m during the growing season. Silt loam is the main soil type. Both sites are distributed in the seasonally-frozen regions of China. More details about the two flux tower sites can be found in Figure 1 and Table 1.

2.2. Site-Level Flux and Meteorological Measurements

Both the EC system and automatic meteorological station (AMS) were mounted at the Arou grassland site and the Daman cropland site, which acquired the continuous observations (the whole periods during 2013–2015) of ecosystem CO2 and water fluxes, as well as the relevant weather conditions, including solar radiation (Rg), air and soil temperatures (Ta and Ts), relative humidity (RH), soil moisture profile (SM), precipitation (P), and vapor pressure deficit (VPD). The observation heights of the EC sensors were 3.5 m and 4.5 m above the ground for grass and maize ecosystems, respectively. Each EC system is comprised of a three-dimensional sonic anemometer (CSAT3, Campbell Scientific, Logan, UT, USA) and a Li-7500A open path CO2/H2O gas analyzer (LI-COR Inc., Lincoln, NE, USA). Raw data are continuously recorded at a frequency of 10 Hz on a CR5000 (Campbell Scientific) data logger. Then, the post-processing procedures including spike detection and despiking, two-dimensional coordinate rotation, time delay removal of H2O/CO2, virtual temperature correction, density effects (WPL correction) and frequency response corrections were completed using the improved EdiRe software package (developed by the University of Edinburgh) in order to produce half-hour flux dataset [27,28]. Currently, these data are released through the data management and sharing platform of the Environmental and Ecological Science Data Center for West China (http://westdc.westgis.ac.cn/). However, because of instrument malfunctions, power failure, and various poor weather conditions, about 25% of the one-year observation data are missing. Thus, it is necessary to fill these gaps with a standardized gap-filling algorithm in order to obtain daily-, monthly- or annually-integrated values. The mean diurnal variations (MDV) method proposed by Falge et al. [29], but also considering the temporal auto-correlation and the co-variation of these fluxes with meteorological variables [30], are implemented for gap filling.
This study used the daytime-based flux partitioning algorithm [31] to partition net CO2 exchange (NEE) into the main components: gross primary production (GPP) and ecosystem respiration (Re). This method applied a modified light-response curve based on the Lloyd and Taylor model [32] to explain the sensitivity of Re to temperature with the VPD limitation of GPP. The magnitudes of fluxes are calculated from daytime values, with only the parameters that define the temperature sensitivity of Re needing to be inferred from night-time data. Therefore, the estimates of Re based on the night-time measurements and GPP values estimated from the day-time observations are recognized as statistically independent. All of these works including gap-filling and flux partitioning were completed using the new R-based package maintained by the Max Planck Institute for Biogeochemistry (https://www.bgc-jena.mpg.de/bgi/index.php/Services/REddyProcWeb/). The half-hour GPP and ET data were then accumulated to daily and eight-day mean values to reflect the seasonal variations of each ecosystem (Arou and Daman). Plant WUE can be described in various ways according to different scientific disciplines and the spatio-temporal scales of research interest [1]. At the ecosystem level, WUE can be calculated as the ratio of GPP to ET [4,5]. In this study, the seasonal dynamics in WUE were described using eight-day average WUE (g kg−1). Ecosystem ET (mm/day) was derived from the EC-based latent heat observations (LE, w/m2) by means of the equation ET = LE/λ, where λ is the specific vaporization enthalpy of water (around 2454 kJ/kg).

2.3. Satellite-Derived MODIS Products and Processing

The Moderate Resolution Imaging Spectroradiometer (MODIS) GPP and ET products have been widely used to assess the regional or even global carbon sequestration and water consumption by terrestrial ecosystems [33,34]. Both MOD17A2 GPP (V5.5) and MOD16A2 ET (V1.05) were separately downloaded from the website http://www.ntsg.umt.edu/project/ (developed by the Numerical Terradynamic Simulation Group of the University of Montana) in eight-day composite and 1 km resolution from 2013 to 2015. Based on a simplified light-use efficiency (LUE) model, the MODIS GPP algorithm generated the first satellite-driven product to monitor vegetation productivity across Earth’s entire vegetated areas [35,36,37], and then experienced continuous improvements [38]. It mainly presumed that vegetation GPP was proportionally related with the amount of absorbed photosynthetically-active radiation (APAR) under ideal environmental conditions. The maximum LUE parameter was obtained from a biome-specific look-up table, the fraction of photosynthetically active radiation (FPAR) was from the MOD15A2 product, and the meteorology datasets were consistently derived from the NCEP/NCAR Reanalysis II. Meanwhile, two simple linear scalars are incorporated to account for the consequences of temperature and water stresses, respectively. The MODIS ET algorithm adopted a linear form of the Penman-Monteith equation [39] to estimate ET [40,41]. It includes the evaporation from wet and moist soils, the precipitation intercepted by the vegetation canopy, and the transpiration through stomata from plant leaves to stems. These improvements encompassed: (1) estimating the soil heat flux as the radiation partitioned from the land surface; (2) calculating the land surface evaporation as the sum of the saturated and moist soil surface; (3) separating the dry canopy from the wet that caused water evaporation due to the intercepted rain water and plant transpiration; (4) including the daytime and nighttime components; and (5) improving the estimation of canopy and aerodynamic resistances, and the vegetation cover fraction. Ecosystem WUE is then calculated by dividing GPP by ET according to the definition [5].
In addition, the eight-day composite Land Surface Reflectance product (MOD09A1, V5, with the resolution of 500 m) from a 3 × 3 pixel area centered on the two flux towers are downloaded from the Oak Ridge National Laboratory’s Distributed Active Archive Center (http://daac.ornl.gov/MODIS/). The enhanced vegetation index (EVI) developed by Huete et al. [42] has been demonstrated to be effective in monitoring large-scale vegetation phenology and growth status [43,44], ecosystem productivity [45], and evapotranspiration [46]. The detailed calculation method was described in Tang et al. [47]. The time-series MODIS EVI data are used to analyze the correlation with seasonal dynamics in ecosystem WUE, and to develop a new approach for monitoring grassland and cropland WUE in the dry regions of China.

2.4. Data Analysis

We first calculated the daily values of EC-based GPP, ET and ecosystem WUE, and then averaged to the eight-day values for analyzing the seasonal dynamics of each year. After revealing the environmental controls from biotic and abiotic factors at the two flux sites, this study aimed to establish a reliable method for tracking the grassland and cropland WUE patterns in near real-time. Meanwhile, performance of the indirect MODIS WUE estimates from GPP and ET products was also evaluated using the EC observations at eight-day time scale, and the main error sources were examined by comparison of both GPP and ET components. In total three years of data during 2013–2015 for each site (Arou and Daman) are obtained for analyses in this study, with 2/3 of these site-level data as the training set (2013 and 2014) and the remaining 1/3 as a validation set. All statistical analyses are performed using SPSS 19.0 (IBM, Chicago, IL, USA). Prediction performance is assessed using two widely-used indicators: the root-mean-square error (RMSE) and the coefficient of determination (R2). The equations of R2 and RMSE are as follows:
R 2 = 1 ( y ^ y ) 2 y 2
RMSE = ( y ^ y ) 2 n
where y and y ^ represent the observed and predicted values of GPP, ET, and ecosystem WUE, respectively; n is the total number of observations (eight-day periods).

3. Results

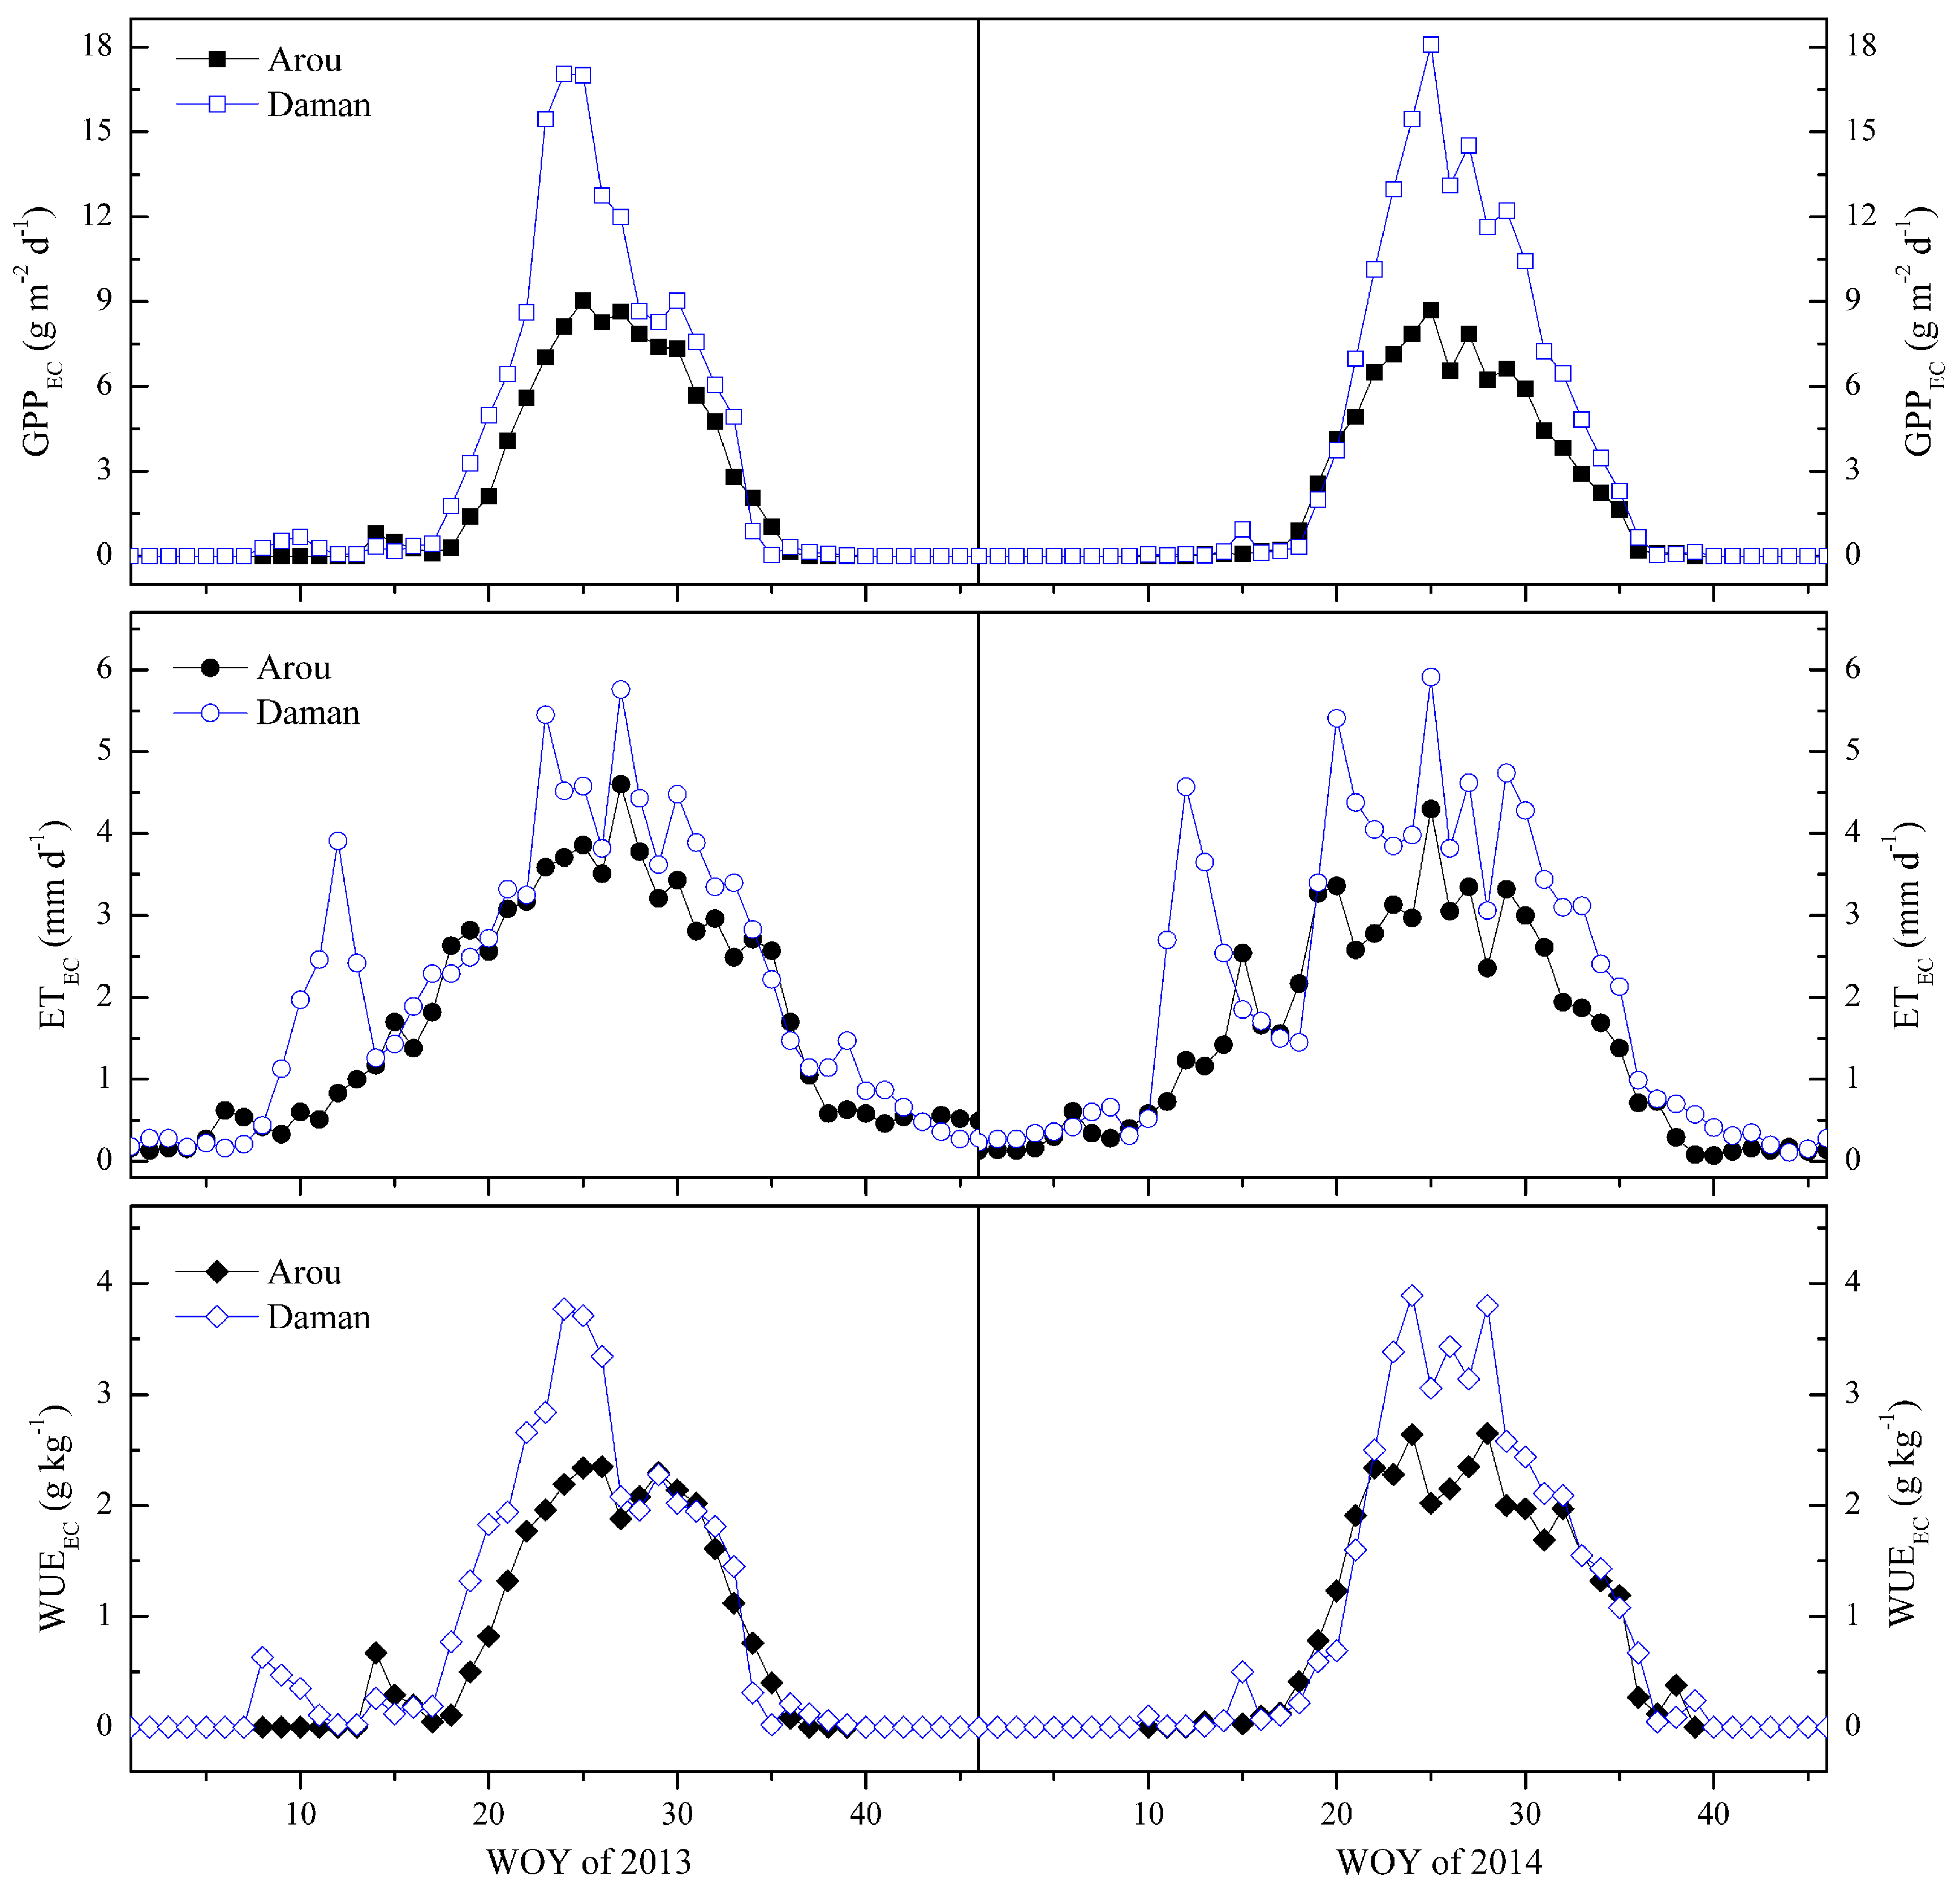
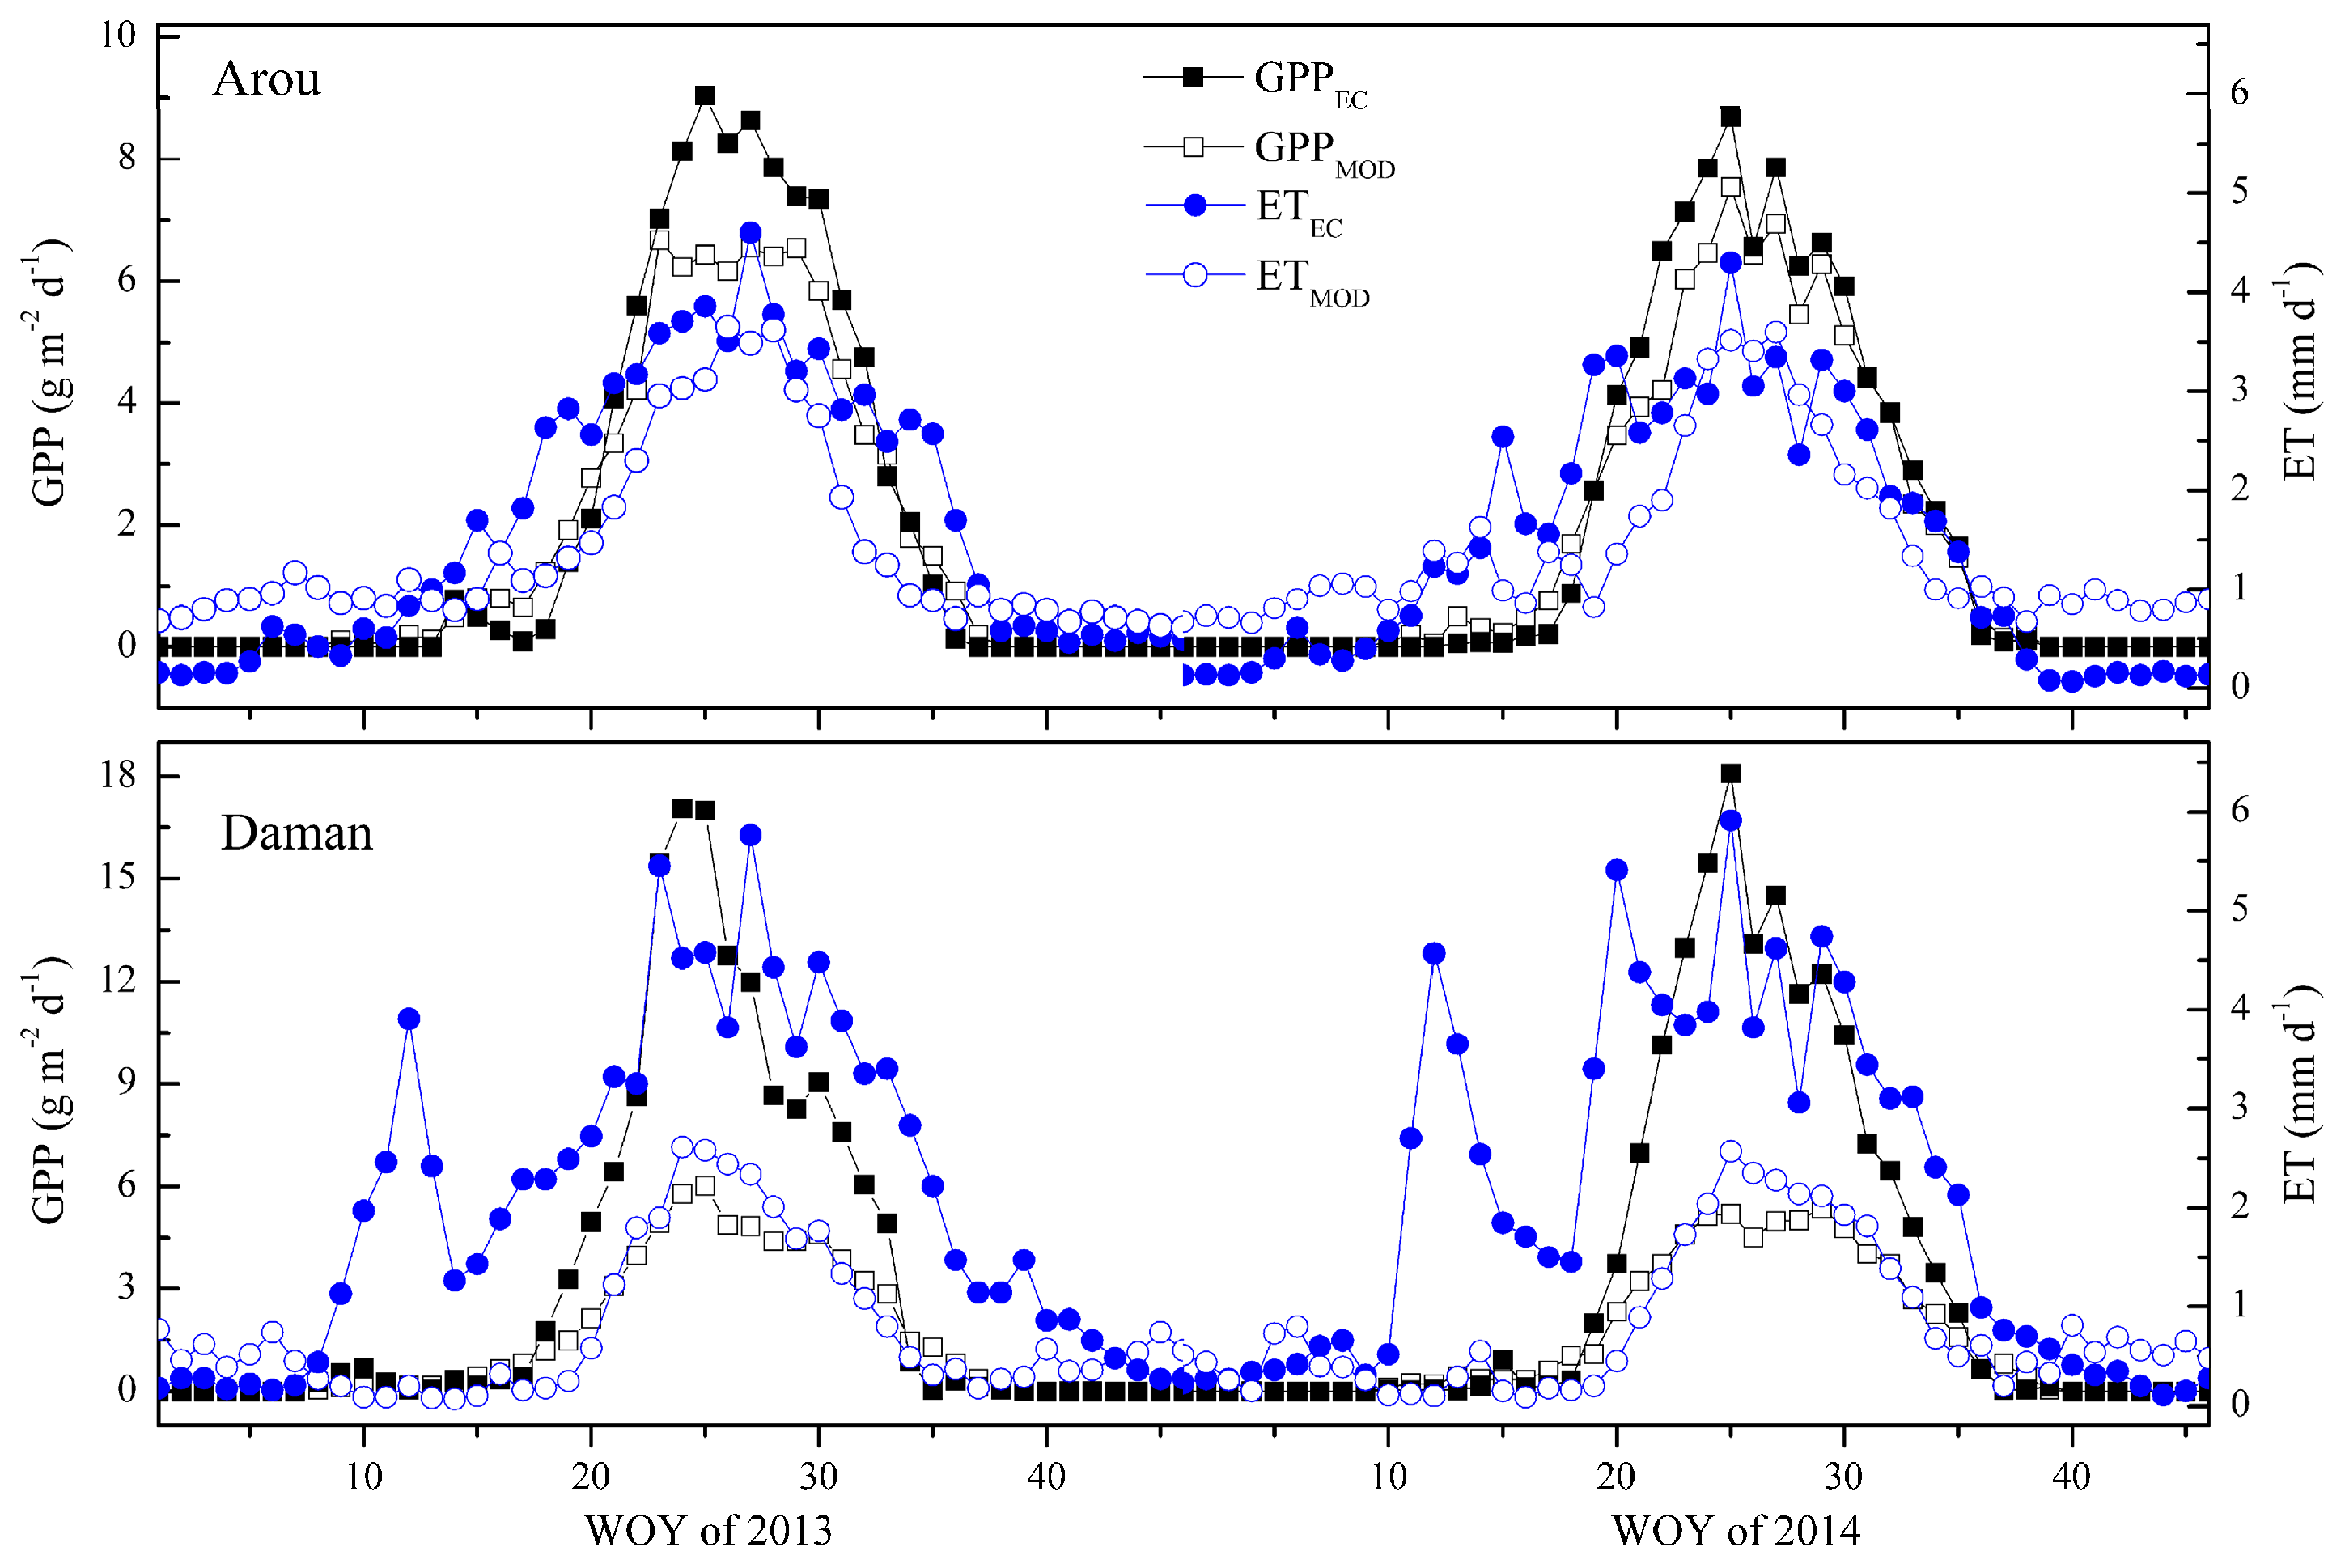
3.1. Seasonal Variations in GPP, ET and Ecosystem-Level WUE

The seasonal dynamics of GPP, ET, and WUE at the two stations, Arou and Daman, from 2013 and 2014 are shown in Figure 2. Distinct seasonal cycles are observed during the two-year measurements. Meanwhile, the changing trends in GPP, Re, and WUE at eight-day periods for both grassland and cropland are quite consistent in spite of the magnitudes. GPP generally increased quickly with plant growth, and reached the peak value at about WOY 25 (mid-to-late July). The maximum GPP values (averaged in 2013 and 2014) were 8.87 g m−2 d−1 and 17.57 g m−2 d−1 for the Arou grassland site and Daman cropland site, respectively. The seasonal variations in ET fluctuated relatively more than GPP variability, whereas the peak ET value exhibited one week later than the maximum GPP in the summertime with 4.45 mm d−1 (Arou site) and 5.84 mm d−1 (Daman site), respectively. Ecosystem WUE also had a similar seasonal variation pattern as GPP. However, there was an obvious trough during the peak growing season (at the end of July and start of August). The values of GPP, ET and WUE at the two sites were almost zero beyond the vegetative season, especially in winter owing to the frozen soil and bare land. Ecosystem WUE at the Arou grassland site during 2013 and 2014 were 0.63 g kg−1 and 0.73 g kg−1, respectively, while it is slightly higher at the Daman cropland station with approximately 0.84 g kg−1 and 0.90 g kg−1 across the two years.

3.2. Seasonal Dynamics of Environmental and Biological Controls

In order to explore the environmental restrictive factors of ecosystem WUE variability under water-limited conditions, this study illustrated the seasonal variations and statistically evaluated the correlations of WUE and its main components (GPP and ET) with the potential biotic and abiotic controls (Figure 3 and Table 2). Generally, local climate characteristics determine the vegetation growth and functional traits relevant to ecosystem carbon and water cycling. Figure 3 showed that all these variables including Rg, Ta and Ts, VPD, P and MODIS-derived EVI exhibited strong seasonal trends and co-varied with time-series GPP, ET and WUE. As the driving factor of plant photosynthesis and transpiration, Rg is one of the most important parameters affecting the coupling of carbon and water interactions. Owing to the spatial proximity, Rg values around the two-year observations were quite consistent at the two flux sites. It remained higher during the summertime but with slight fluctuations. However, the maximum Ta (mean value during 2013 and 2014) at the Arou site was obviously lower than that of Daman site, at about 12.8 °C and 22.1 °C, respectively. Ts also had similar features, which can be explained by altitude differences (3033 m at Arou vs 1556 m at Daman). During the growing season, the variations in Ta and Ts were very close, whereas Ts was apparently higher in cold winters. As the temperature rose in spring, the vegetation began to grow and the gross photosynthesis rate gradually increased accompanied by plant transpiration. A similar phenomenon as Rg in the growth period was found in VPD, but the mean VPD of the Daman site during 2013 and 2014 was almost two times that at the Arou site. Fortunately, rain and heat in this region were over the same period with approximately 94.2% and 96.1% of the annual precipitation falling within the growth season for Arou and Daman, respectively, but the overall amount of rain differs significantly between the sites. Among these environmental factors, Pearson correlation analysis (Table 2) revealed that the temperature was strongly and positively correlated to the variability in GPP, ET and the coupling effect-WUE. Particularly, Ts performed a closer correlation with WUE than Ta for both sites. The correlations between ecosystem WUE and Ts can reach 0.853 for the Arou grassland site and 0.734 for the Daman cropland site, respectively. Followed by the natural precipitation (P), P was also an important determining factor for WUE, with the correlation coefficients of 0.802 (Arou) and 0.715 (Daman), respectively. However, it seemed that the water condition controlled GPP more than ET in the arid and semi-arid areas. Rg and VPD were just the opposite. Both of them were more closely correlated to ET than GPP and ecosystem WUE. Furthermore, as an important biophysical parameter comprehensively reflecting the environmental conditions, time-series MODIS EVI data strongly influenced the seasonal variations in WUE and its components for both grassland and cropland ecosystems (Table 2). With the increase in EVI, ecosystem WUE also increased linearly. Correlation coefficients between site-level WUE and EVI reached up to 0.960 and 0.941 for Arou and Daman, respectively. Given to the complicated interactions among these environmental factors, this study explored the potential path analysis to directly characterize ecosystem WUE variability in the dry regions of Northwest China.

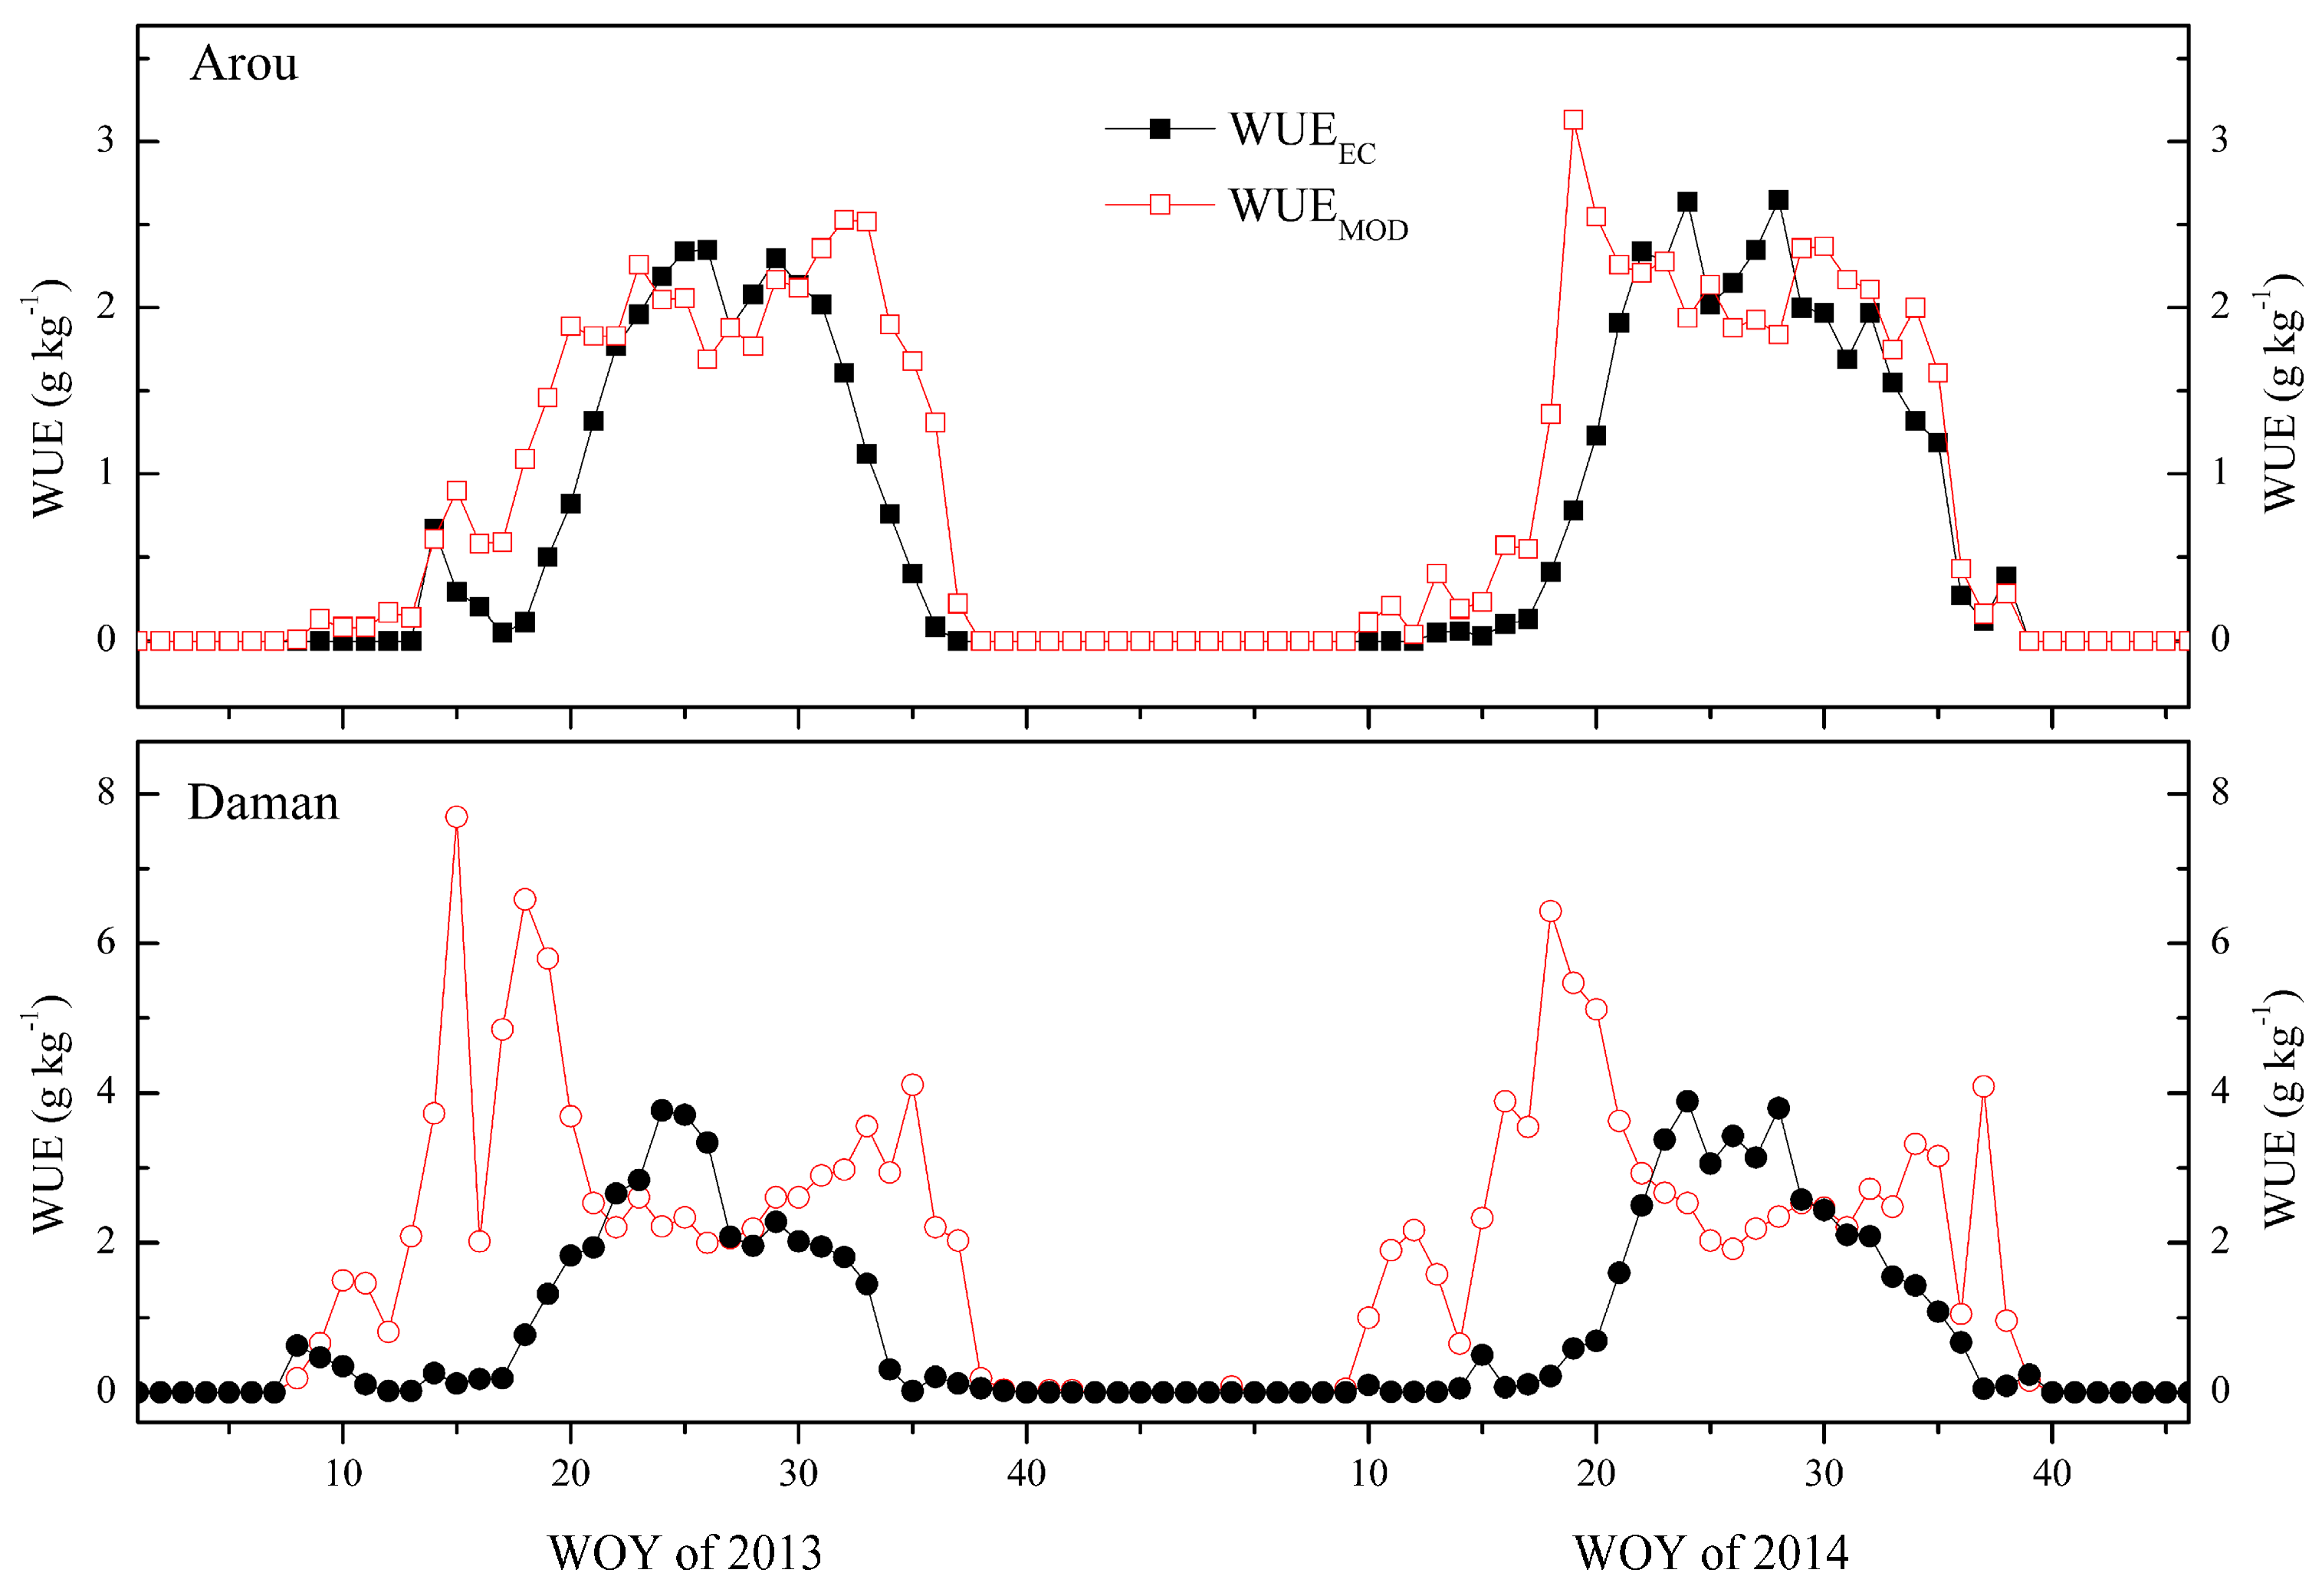
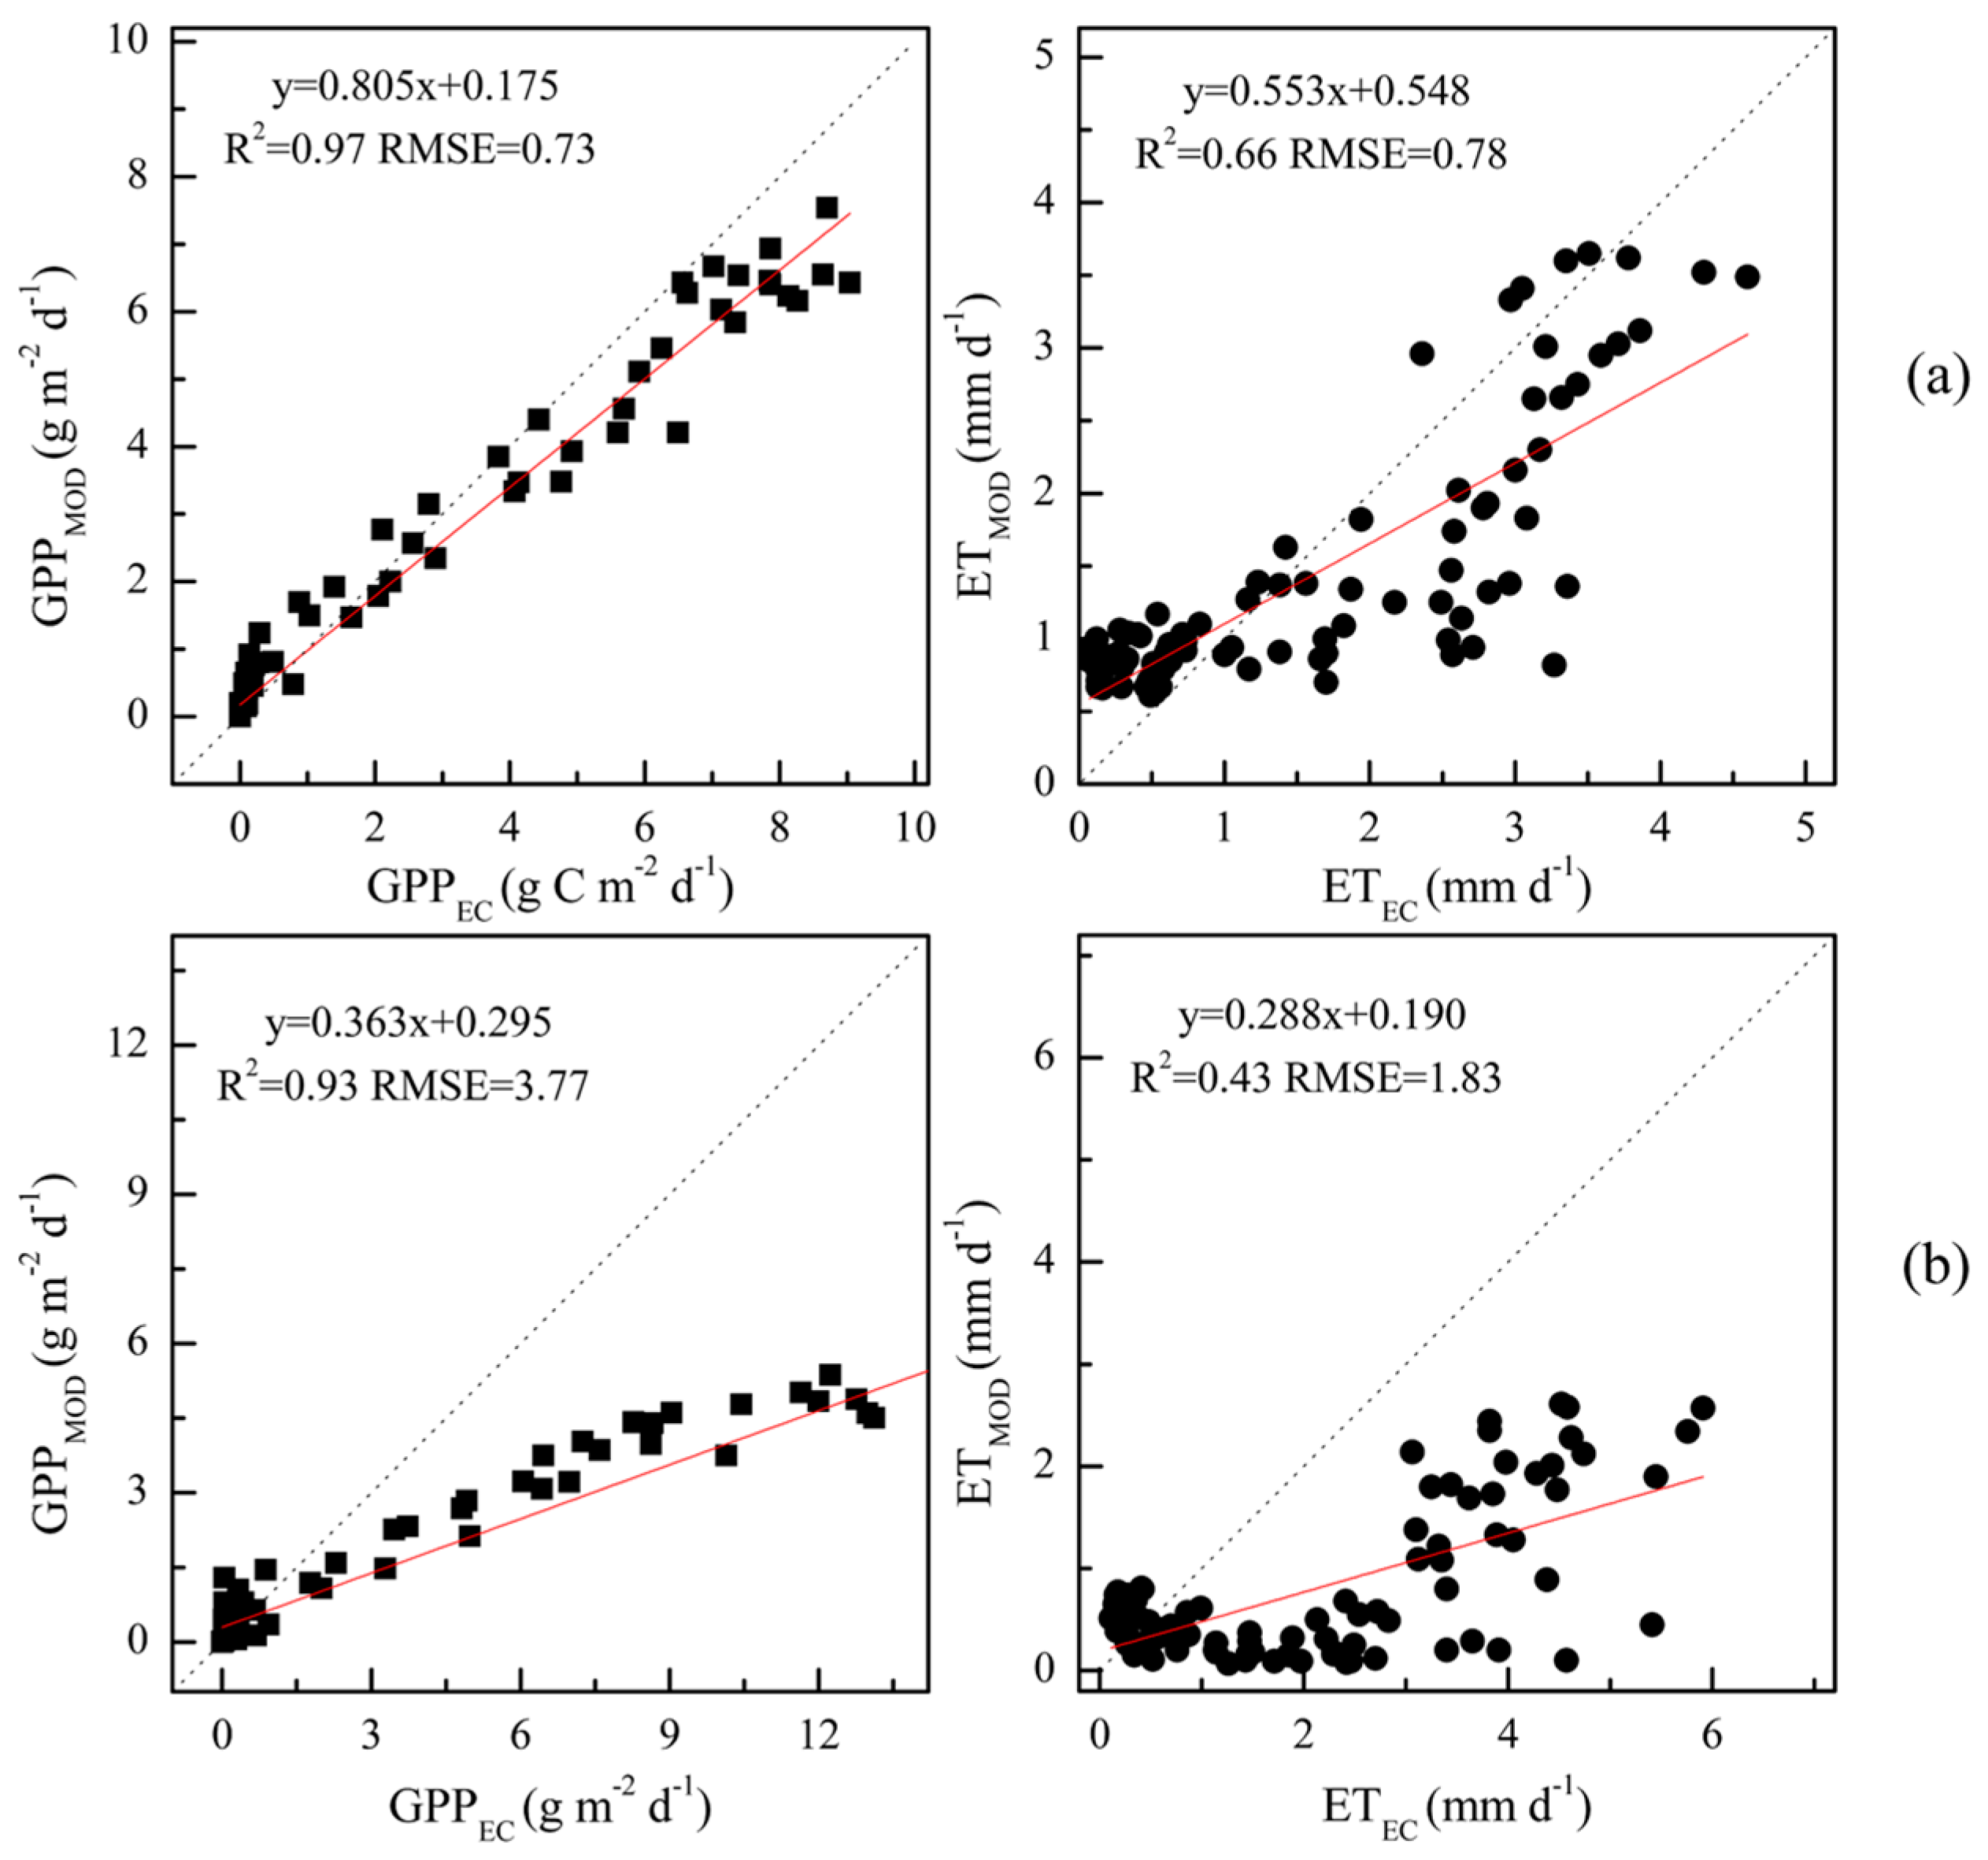
3.3. Performance of MODIS WUE Estimates from GPP and ET

Ecosystem WUE can be calculated through MODIS GPP and ET products, while the performance in the arid and semi-arid areas remains unclear. Comparisons of the WUE variability at the two sites from flux tower measurements (WUEEC) and the estimates from MODIS data (WUEMOD) of the eight-day periods were presented in Figure 4. The mean WUEEC during 2013 and 2014 at the Arou grassland site was relatively close to WUEMOD with 0.68 g kg−1 and 0.87 g kg−1, respectively. However, the mean WUEEC during the two-year observations at the Daman cropland site only half as severely overestimated WUEMOD with 0.87 g kg−1 and 1.77 g kg−1, respectively. As changes in WUEEC, seasonal variations in WUEMOD performed relatively consistent trends for both ecosystems, especially for the grassland site. However, two pronounced discrepancies still existed. Generally, the modeled WUEMOD severely overestimated WUEEC at the beginning and end of plant growth stages but with a large underestimation during the peak periods. The Daman cropland site was particularly remarkable with a size estimation bias for many eight-day periods in springtime by comparison with the Arou site. Thus, this study indicated that the MODIS estimates remain difficult to capture the short-term variability, such as eight-day periods in ecosystem WUE, accurately.

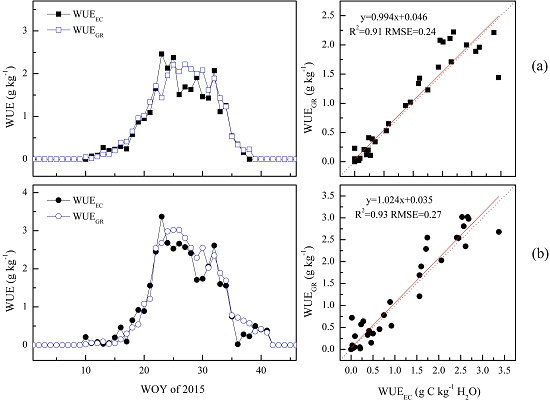
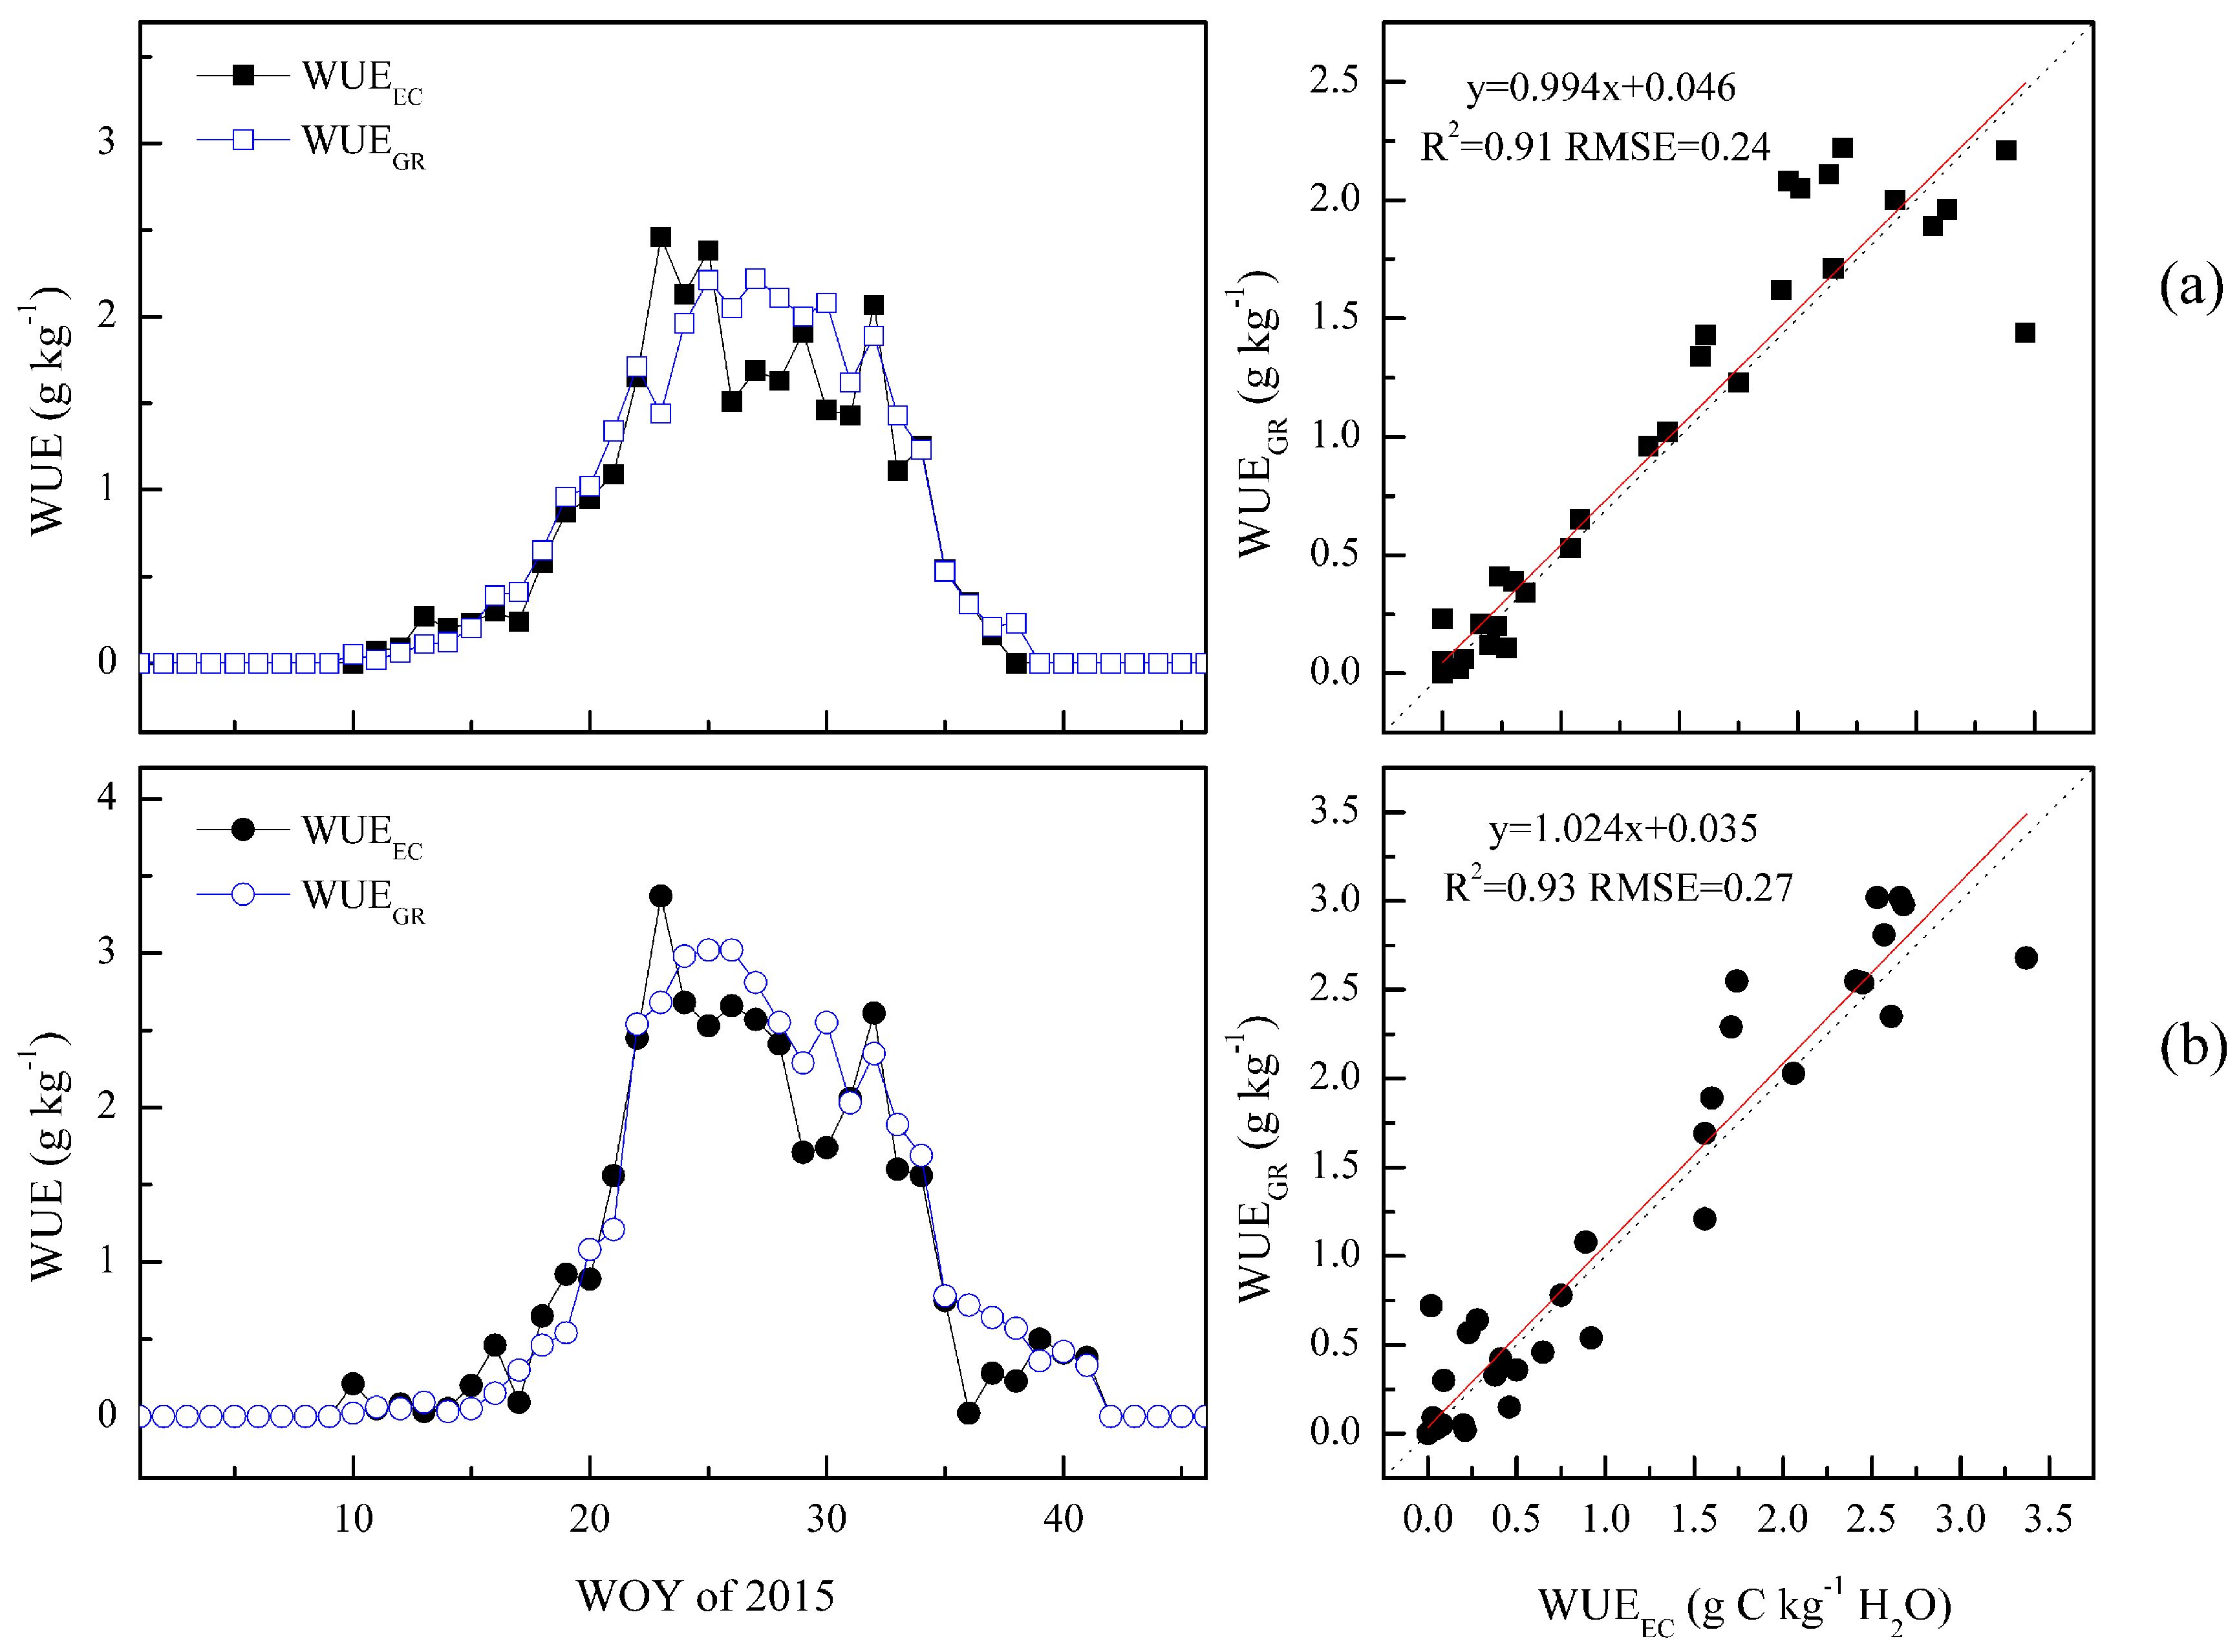
3.4. Potential of MODIS EVI Data to Track the Dynamics in WUE

The strong correlations between time-series MODIS EVI data and ecosystem WUE implied the possibility to extrapolate tower-based measurements to large-scale regions, which can also avoid the uncertainties in the indirect WUE estimates from MODIS GPP and ET products. Then, an alternative method that solely relied on eight-day EVI data (greenness model-GR) was developed to monitor seasonal dynamics of ecosystem WUE for grassland (Equation (3)) and maize cropland (Equation (4)) in the dry areas, respectively. R2 and RMSE of the grassland GR model reached 0.92 and 0.19 g kg−1, respectively; and for maize cropland, R2 and RMSE were 0.89 and 0.39 g kg−1, respectively. Thus, both had high accuracy.
WUE = 4.322 × EVI − 0.559
WUE = 7.211 × EVI − 0.652
However, the model’s performance still needs to be independently validated for regional-scale applications. Seasonal patterns and the scatterplots between tower-based WUEEC and MODIS estimates WUEGR were exhibited in Figure 5. It proved the GR model can accurately simulate eight-day composite GPP variability for both grassland and cropland ecosystems, except for individual periods. Generally, WUEGR agreed rather well with the in situ observations WUEEC, with the percentage deviation in annual mean values of 7.1% for the Arou site and 6.7% for the Daman site, respectively. The 1:1 line in the scatterplots also demonstrated that most points distributed close to the line. Meanwhile, a strong linear relationship was found between WUEEC and WUEGR. R2 and RMSE reached up to 0.91 and 0.93, and 0.24 g kg−1 and 0.27 g kg−1 for the Arou grassland site and the Daman cropland site in 2015, respectively. Therefore, this simple empirical GR model by exclusive use of MODIS EVI data has great potential to quantify ecosystem-level WUE, which is also an important attempt for terrestrial ecosystems in the arid and semi-arid areas.

4. Discussion

Natural grassland and irrigated cropland are the major ecosystem types in the arid and semi-arid areas of Northwest China. Currently, only a few flux sites in this region continuously measure ecosystem C and water exchanges between the biosphere and the atmosphere with limited site-years of data. However, it provided a direct and effective tool to monitor the flow of carbon, water and energy quantitatively across different time scales. Comparing with the results of Hu et al. [12] that WUE at the Dangxiong alpine meadow-steppe ecosystem with short, sparse vegetation and the Neimeng temperate steppe ecosystem under semi-arid climate, were 0.41 g kg−1 and 0.80 g kg−1, respectively, the values in this study (Arou site) just fell in between (Figure 2). Tang et al. [5] revealed the latitudinal trends in multi-year mean annual WUE of six cropland sites ranging from 1.05 g kg−1 and 2.36 g kg−1, it reflected that ecosystem WUE in the dry areas of China (Daman site) was apparently lower than that of other regions. Previous studies [47] also implied that under normal precipitation, C4 plant (maize) usually owned higher ecosystem WUE than C3 plant (soybean) because of different physiological pathways, at about 1.46 g kg−1 and 0.68 g kg−1, respectively.
Precipitation events, in terms of timing and amounts, generally affect the fluxes of CO2 and water vapor that consequently impact ecosystem WUE variability in different ways. Niu et al. [2] found that precipitation addition in a temperate steppe stimulated GPP and ET by 70.4% and 37.5% in dry 2007, and by 24.8% and 12.6% in normal 2008, respectively, leading to the increase in ecosystem WUE. Although few studies examined the response of grassland WUE to natural precipitation, positive correlations between rain-use efficiency and annual total rainfall over time have been reported in temperate grasslands in China [48]. There was also a clear trend for less WUE during the peak growing season (Figure 2), which can be explained by the poor soil moisture and high temperature in this period [8,10]. It predominantly reflected a sharp decrease in GPP, but no significant influence on ET, which resulted in the reduction of ecosystem WUE under a warm temperature. Because of stomatal regulation, lower GPP rates can generate a water-saving adaptive mechanism to a drier environment induced by warming climate [49]. In spite of a positive correlation between VPD and ecosystem WUE found in this study (Table 2), WUE declined obviously with the increase of VPD in many terrestrial ecosystems under well-watered conditions [5,50].
Global climate change has exerted considerable effects on the biogeochemical and hydrological processes in terrestrial ecosystems [51]. Especially in the arid and semi-arid regions of Northwest China, our understanding of climate change–terrestrial feedbacks must be improved to manage the fragile ecosystems in the face of extreme weather events. Meanwhile, increased frequency and intensity of drought events are among the prospects that we are facing. How ecosystem WUE and flux dynamics respond to and cope with droughts will be crucial in the terrestrial feedback to changing climate. Ecosystem responses to drought, however, are highly variable in time and space [52,53]. Lu and Zhuang [54] revealed that ecosystem WUE increased when the intensity of drought was moderate while it tended to decrease under severe drought. Tang et al. [55] also found that ecosystem WUE in continental boreal forest had an apparent reduction from 2.41 g kg−1 to 1.32 g kg−1 during an extreme drought year. Nevertheless, a contrasting response of WUE to drought between arid (WUE increased with drought) and semi-arid/sub-humid ecosystems (WUE decreased with drought), which was attributed to different sensitivities of ecosystem processes to changes in hydro-climatic conditions [56]. WUE variability in arid ecosystems is primarily controlled by physical processes (i.e., evaporation), whereas WUE variability in semi-arid/sub-humid regions is mostly regulated by biological processes (i.e., assimilation). In this study, owing to limited flux measurements under normal years, we can only reveal the positive relationship between ecosystem WUE and natural precipitation.
Large biases in the MODIS WUE estimates (Figure 4) essentially reflected great uncertainties in coupling the fluxes of carbon and water including MODIS GPP and ET products such as the algorithm structure, various upstream inputs and the biome-specific parameters in the fixed look-up tables [57,58]. Therefore, further analysis is required to explore whether the MODIS GPP or ET product caused the large discrepancies in seasonal dynamics of WUEMOD.
Figure 6 and Figure 7 compared the seasonal variations in GPP and ET from flux measurements and the corresponding MODIS estimates. During the two-year periods, GPPMOD at the Arou grassland site matched reasonably well to the EC-based observations with R2 and RMSE of 0.97 and 0.73 g m−2 d−1, respectively, whereas ETMOD exhibited a large overestimation in the dormant season and persistent underestimations during the growth period in spite of a small deviation of annual mean ETMOD and ETEC with about 9.1%. However, large biases existed in MODIS GPP and ET products at the Daman cropland site. Both were severely underestimated across the growing season. Although GPPMOD and GPPEC at Daman were strongly and linearly correlated with R2 of 0.93, the RMSE value reached up to 3.77 g m−2 d−1, about five times of that at the Arou site. Overall, annual mean GPPEC was underestimated by about 54.9%. Similar to the biases in GPP variability, most eight-day periods of ETEC were overly underestimated by ETMOD with steady changes. R2 and RMSE at the Daman site between ETEC and ETMOD were 0.43 and 1.83 mm d−1, respectively. The percentage deviation was up to 61.9%. Thus, the accuracies of the MODIS GPP and ET products constrained its performance on modeling the WUE variability of maize ecosystem in the arid and semi-arid regions. Nevertheless, Tang et al. [47] found that the MODIS ET product at an Americaflux site located in the humid area was quite consistent to the measured ET for both maize and soybean ecosystems with the percentage deviation of multi-year mean annual ETEC and ETMOD of less than 5%. The large bias of ET in this study can be ascribed to the necessary irrigation for maintaining crop growth in the dry regions while the MODIS ET algorithm neglected this part of the water supply. As shown in Figure 6, the peak of ETEC during about WOY 12 before sowing crops just experienced conventional irrigation. Annual rainfall at the Daman site was only 144.6 mm, whereas the amount of ET was 762.5 mm. Meanwhile, owing to a lack of effective distinction of C3 and C4 species, the MODIS GPP product contained large uncertainties in C4 crops, such as maize, thereby propagating to WUE estimation. Zhang et al. [59] indicated that the bias of MODIS-based WUE was partly derived from the uncertainties in eddy flux data because of gap-filling processes and an unbalanced surface energy issue. Jiang and Ryu [60] also directly evaluated MODIS products against the FLUXNET 2015 dataset and found that croplands exhibited the largest GPP RMSE (4.80 g m−2 d−1) and slight underestimation in ET (0.88 mm d−1). Then, by setting different parameters for C3 and C4 crops, the new Breathing Earth System Simulator (BESS) model achieved better GPP results than MODIS at different temporal and spatial resolutions.
The mismatch between the actual flux tower footprint with a 1 km2 approximation used in the comparisons to MODIS GPP and ET products is also an issue. Although the EC-based flux measurement has a larger footprint compared to the field measurements, it remains uncertain owing to random measurement errors, gap-filling errors, the energy balance disclosure issue and the variation in the footprint with wind speed and direction [61,62]. Spatially-averaged MODIS values from a 3 × 3 window over each tower location were used to reduce the effects of spatial heterogeneity, but may also introduce additional uncertainties through regional smoothing of MODIS retrievals relative to tower observations, especially over spatially-complicated vegetation and terrain [47,63]. Additionally, remote sensing data and flux data have different observation frequencies, so there are unavoidable errors in estimating daily/eight-day GPP and ET from both transient remote sensing data and half-hourly eddy flux data [64]. Zhang et al. [59] revealed that true ET values were usually underestimated by the eddy covariance measurements to a certain degree. Essentially, the GPP values were partitioned from EC-based NEE data relying on empirical models, which also included plenty of uncertainties [31,65]. All of these factors contributed to the uncertainty in estimated WUE at the eight-day time scale.
In this study, the proposed GR model solely based on time-series MODIS EVI data exhibited great potential in capturing the seasonal variations in ecosystem WUE for both grassland and cropland in the dry areas of Northwest China (Figure 5). Even so, we have to recognize that because of the diversity in community composition, climate conditions and external disturbances [47,66,67], it remains a challenge to propose a robust and general model for monitoring ecosystem WUE variability over large scales. In addition, Hill et al. [68] indicated that at least 5–10 years of flux observations are required for optimal model development. Given the significant role of vegetation in the water-limited environment, this study will help us to understand the coupling relationship between carbon-water interactions in this region.

5. Conclusions

As an important linkage coupling the global carbon and water cycles, a better understanding of terrestrial ecosystem WUE will help us track the responses in water-use strategies of ecosystems to environmental stress and adopt appropriate ecosystem management, especially in the arid and semi-arid areas with limited water resources. Fortunately, the development of the EC technique and frequent MODIS observations make it feasible from site-level evaluations to large-scale modeling, as well as the underlying mechanisms with environmental controls. Ecosystem WUE of both grassland and maize cropland in the Heihe River Basin of Northwest China exhibited distinct seasonal dynamics, but with troughs during the peak growing season in summertime. A sharp decrease in GPP, but no apparent changes in ET, jointly led to the reduction of ecosystem WUE under a warm temperature. Pearson correlation analysis revealed that local temperature (Ts and Ta) and precipitation are the two most important environmental factors in determining the coupled WUE variability. Time-series MODIS EVI data that comprehensively reflected the complicated climate conditions was strongly relevant to ecosystem WUE with strong correlation coefficients reaching up to 0.960 and 0.941, respectively. Given the large uncertainties in the MODIS WUE estimates from GPP and ET products especially for the cropland, an alternative method by exclusive use of time-series MODIS EVI data (GR) performed rather well in capturing eight-day variations in WUE at both Arou grassland and Daman cropland stations. Therefore, our findings have important implications for understanding climate change effects on the coupling of carbon and water interactions in dry regions. In spite of these improvements, more site-year data are still required for further investigation and larger scale extrapolation. Meanwhile, the responses of ecosystem WUE and flux dynamics to extreme climate events such as drought are also crucial in the terrestrial feedback to changing climate.

Acknowledgments

This study was jointly supported by the National Natural Science Foundation of China (41401221, 41371532), the Interdisciplinary Frontier Project of Nanjing Institute of Geography and Limnology, CAS (NIGLAS2016QY02), the Fundamental Research Funds for the Central Universities in China (SWU116088) and China Postdoctoral Science Foundation (2017M610109). This work used the original flux data of Arou grassland site and Daman cropland site acquired from Heihe Watershed Allied Telemetry Experimental Research (Hi-WATER). All technicians are acknowledged in site management and data collection. We also thank the principal contributors of the MODIS products, the Distributed Active Archive Center of the Oak Ridge National Laboratory, and the Earth Observing System Data for making these MODIS data available.

Author Contributions

X.T. designed this study, performed data analysis and wrote the manuscript. M.M., X.X. and L.S. contributed significantly to the discussion of results and manuscript refinement. Z.D., L.Y., X.H. and Q.G. helped to process the flux measurements and remote sensing data.

Conflicts of Interest

The authors declare no conflict of interest.

References

  1. Kuglitsch, F.G.; Reichstein, M.; Beer, C.; Carrara, A.; Ceulemans, R.; Granier, A.; Janssens, I.A.; Koestner, B.; Lindroth, A.; Loustau, D.; et al. Characterisation of ecosystem water-use efficiency of European forests from eddy covariance measurements. Biogeosci. Discuss. 2008, 5, 4481–4519. [Google Scholar] [CrossRef]
  2. Niu, S.L.; Xing, X.R.; Zhang, Z.; Xia, J.Y.; Zhou, X.H.; Song, B.; Li, L.H.; Wan, S.Q. Water-use efficiency in response to climate change: From leaf to ecosystem in a temperate steppe. Glob. Chang. Biol. 2011, 17, 1073–1082. [Google Scholar] [CrossRef]
  3. Zhu, X.J.; Yu, G.R.; Wang, Q.F.; Hu, Z.M.; Zheng, H.; Li, S.G.; Sun, X.M.; Zhang, Y.P.; Yan, J.H.; Wang, H.M.; et al. Spatial variability of water use efficiency in China’s terrestrial ecosystems. Glob. Planet Chang. 2015, 129, 37–44. [Google Scholar] [CrossRef]
  4. Beer, C.; Ciais, P.; Reichstein, M.; Baldocchi, D.; Law, B.E.; Papale, D.; Soussana, J.F.; Ammann, C.; Buchmann, N.; Frank, D.; et al. Temporal and among-site variability of inherent water use efficiency at the ecosystem level. Glob. Biogeochem. Cycles 2009, 23. [Google Scholar] [CrossRef]
  5. Tang, X.G.; Li, H.P.; Desai, A.R.; Nagy, Z.; Luo, J.H.; Kolb, T.E.; Olioso, A.; Xu, X.B.; Yao, L.; Kutsch, W.; et al. How is water-use efficiency of terrestrial ecosystems distributed and changing on Earth? Sci. Rep. 2014, 4. [Google Scholar] [CrossRef] [PubMed]
  6. Brummer, C.; Black, T.A.; Jassal, R.S.; Grant, N.J.; Spittlehouse, D.L.; Chen, B.; Nesic, Z.; Amiro, B.D.; Arain, M.A.; Barr, A.G.; et al. How climate and vegetation type influence evapotranspiration and water use efficiency in Canadian forest, peatland and grassland ecosystems. Agric. For. Meteorol. 2012, 153, 14–30. [Google Scholar] [CrossRef]
  7. Huang, M.T.; Piao, S.L.; Zeng, Z.Z.; Peng, S.S.; Ciais, P.; Cheng, L.; Mao, J.F.; Poulter, B.; Shi, X.Y.; Yao, Y.T.; et al. Seasonal responses of terrestrial ecosystem water-use efficiency to climate change. Glob. Chang. Biol. 2016, 22, 2165–2177. [Google Scholar] [CrossRef] [PubMed]
  8. Ponton, S.; Flanagan, L.B.; Alstad, K.P.; Johnson, B.G.; Morgenstern, K.; Kljun, N.; Black, T.A.; Barr, A.G. Comparison of ecosystem water-use efficiency among douglas-fir forest, aspen forest and grassland using eddy covariance and carbon isotope techniques. Glob. Chang. Biol. 2006, 12, 294–310. [Google Scholar] [CrossRef]
  9. Yang, B.; Pallardy, S.G.; Meyers, T.P.; Gu, L.H.; Hanson, P.J.; Wullschleger, S.D.; Heuer, M.; Hosman, K.P.; Riggs, J.S.; Sluss, D.W. Environmental controls on water use efficiency during severe drought in an Ozark forest in Missouri, USA. Glob. Chang. Biol. 2010, 16, 2252–2271. [Google Scholar] [CrossRef]
  10. Yu, G.R.; Song, X.; Wang, Q.F.; Liu, Y.F.; Guan, D.X.; Yan, J.H.; Sun, X.M.; Zhang, L.M.; Wen, X.F. Water-use efficiency of forest ecosystems in eastern China and its relations to climatic variables. New Phytol. 2008, 177, 927–937. [Google Scholar] [CrossRef] [PubMed]
  11. Guo, Q.; Hu, Z.M.; Li, S.G.; Yu, G.R.; Sun, X.M.; Zhang, L.M.; Mu, S.L.; Zhu, X.J.; Wang, Y.F.; Li, Y.N.; et al. Contrasting responses of gross primary productivity to precipitation events in a water-limited and a temperature-limited grassland ecosystem. Agric. For. Meteorol. 2015, 214–215, 169–177. [Google Scholar] [CrossRef]
  12. Hu, Z.M.; Yu, G.R.; Fu, Y.L.; Sun, X.M.; Li, Y.N.; Shi, P.L.; Wangw, Y.F.; Zheng, Z.M. Effects of vegetation control on ecosystem water use efficiency within and among four grassland ecosystems in China. Glob. Chang. Biol. 2008, 14, 1609–1619. [Google Scholar] [CrossRef]
  13. Zhu, X.J.; Yu, G.R.; Wang, Q.F.; Hu, Z.M.; Han, S.J.; Yan, J.H.; Wang, Y.F.; Zhao, L. Seasonal dynamics of water use efficiency of typical forest and grassland ecosystems in China. J. For. Res. 2014, 19, 70–76. [Google Scholar] [CrossRef]
  14. Reichstein, M.; Tenhunen, J.D.; Roupsard, O.; Ourcival, J.M.; Rambal, S.; Miglietta, F.; Peressotti, A.; Pecchiari, M.; Tirone, G.; Valentini, R. Severe drought effects on ecosystem CO2 and H2O fluxes at three Mediterranean evergreen sites: Revision of current hypotheses? Glob. Chang. Biol. 2002, 8, 999–1017. [Google Scholar] [CrossRef]
  15. Song, Q.H.; Fei, X.H.; Zhang, Y.P.; Sha, L.Q.; Liu, Y.T.; Zhou, W.J.; Wu, C.S.; Lu, Z.Y.; Luo, K.; Gao, J.B.; et al. Water use efficiency in a primary subtropical evergreen forest in Southwest China. Sci. Rep. 2017, 7. [Google Scholar] [CrossRef] [PubMed]
  16. Maselli, F.; Papale, D.; Puletti, N.; Chirici, G.; Corona, P. Combining remote sensing and ancillary data to monitor the gross productivity of water-limited forest ecosystems. Remote Sens. Environ. 2009, 113, 657–667. [Google Scholar] [CrossRef]
  17. Whitley, R.J.; Macinnis-Ng, C.M.O.; Hutley, L.B.; Beringer, J.; Zeppel, M.; Williams, M.; Taylor, D.; Eamus, D. Is productivity of mesic savannas light limited or water limited? Results of a simulation study. Glob. Chang. Biol. 2011, 17, 3130–3149. [Google Scholar] [CrossRef]
  18. Saito, M.; Kato, T.; Tang, Y. Temperature controls ecosystem CO2 exchange of an alpine meadow on the northeastern Tibetan Plateau. Glob. Chang. Biol. 2009, 15, 221–228. [Google Scholar] [CrossRef]
  19. Saurer, M.; Spahni, R.; Frank, D.C.; Joos, F.; Leuenberger, M.; Loader, N.J.; McCarroll, D.; Gagen, M.; Poulter, B.; Siegwolf, R.T.W.; et al. Spatial variability and temporal trends in water-use efficiency of European forests. Glob. Chang. Biol. 2014, 20, 3700–3712. [Google Scholar] [CrossRef] [PubMed]
  20. Liu, Y.B.; Xiao, J.F.; Ju, W.M.; Zhou, Y.L.; Wang, S.Q.; Wu, X.C. Water use efficiency of China's terrestrial ecosystems and responses to drought. Sci. Rep. 2015, 5. [Google Scholar] [CrossRef] [PubMed]
  21. Tang, X.G.; Ding, Z.; Li, H.P.; Li, X.Y.; Luo, J.H.; Xie, J.; Chen, D.Q. Characterizing ecosystem water-use efficiency of croplands with eddy covariance measurements and MODIS products. Ecol. Eng. 2015, 85, 212–217. [Google Scholar] [CrossRef]
  22. Li, X.; Cheng, G.D.; Liu, S.M.; Xiao, Q.; Ma, M.G.; Jin, R.; Che, T.; Liu, Q.H.; Wang, W.Z.; Qi, Y.; et al. Heihe watershed allied telemetry experimental research (HiWATER): Scientific objectives and experimental design. Bull. Am. Meteorol. Soc. 2013, 94, 1145–1160. [Google Scholar] [CrossRef]
  23. Ma, M.G.; Che, T.; Li, X.; Xiao, Q.; Zhao, K.; Xin, X.P. A prototype network for remote sensing validation in China. Remote Sens. 2015, 7, 5187–5202. [Google Scholar] [CrossRef]
  24. Song, L.S.; Liu, S.M.; Zhang, X.; Zhou, J.; Li, M.S. Estimating and validating soil evaporation and crop transpiration during the HiWATER-MUSOEXE. IEEE Geosci. Remote Sens. Lett. 2015, 12, 334–338. [Google Scholar] [CrossRef]
  25. Liu, S.M.; Xu, Z.W.; Wang, W.Z.; Jia, Z.Z.; Zhu, M.J.; Bai, J.; Wang, J.M. A comparison of eddy-covariance and large aperture scintillometer measurements with respect to the energy balance closure problem. Hydrol. Earth Syst. Sci. 2011, 15, 1291–1306. [Google Scholar] [CrossRef]
  26. Song, Y.; Jin, L.; Zhu, G.F.; Ma, M.G. Parameter estimation for a simple two-source evapotranspiration model using Bayesian inference and its application to remotely sensed estimations of latent heat flux at the regional scale. Agric. For. Meteorol. 2016, 230–231, 20–32. [Google Scholar] [CrossRef]
  27. Xu, Z.W.; Liu, S.M.; Li, X.; Shi, S.J.; Wang, J.M.; Zhu, Z.L.; Xu, T.R.; Wang, W.Z.; Ma, M.G. Intercomparison of surface energy flux measurement systems used during the HiWATER-MUSOEXE. J. Geophys. Res. Atmos. 2013, 118, 13140–13157. [Google Scholar] [CrossRef]
  28. Zhu, G.F.; Zhang, K.; Li, X.; Liu, S.M.; Ding, Z.Y.; Ma, J.Z.; Huang, C.L.; Han, T.; He, J.H. Evaluating the complementary relationship for estimating evapotranspiration using the multi-site data across north China. Agric. For. Meteorol. 2016, 230–231, 33–44. [Google Scholar] [CrossRef]
  29. Falge, E.; Baldocchi, D.; Olson, R.; Anthoni, P.; Aubinet, M.; Bernhofer, C.; Burba, G.; Ceulemans, G.; Clement, R.; Dolman, H.; et al. Gap filling strategies for long term energy flux data sets. Agric. For. Meteorol. 2001, 107, 71–77. [Google Scholar] [CrossRef]
  30. Reichstein, M.; Falge, E.; Baldocchi, D.; Papale, D.; Aubinet, M.; Berbigier, P.; Bernhofer, C.; Buchmann, N.; Gilmanov, T.; Granier, A.; et al. On the separation of net ecosystem exchange into assimilation and ecosystem respiration: Review and improved algorithm. Glob. Chang. Biol. 2005, 11, 1424–1439. [Google Scholar] [CrossRef]
  31. Lasslop, G.; Reichstein, M.; Papale, D.; Richardson, A.D.; Arneth, A.; Barr, A.; Stoy, P.; Wohlfahrt, G. Separation of net ecosystem exchange into assimilation and respiration using a light response curve approach: Critical issues and global evaluation. Glob. Chang. Biol. 2010, 16, 187–208. [Google Scholar] [CrossRef]
  32. Lloyd, J.; Taylor, J.A. On the temperature-dependence of soil respiration. Funct. Ecol. 1994, 8, 315–323. [Google Scholar] [CrossRef]
  33. Ryu, Y.; Baldocchi, D.D.; Kobayashi, H.; van Ingen, C.; Li, J.; Black, T.A.; Beringer, J.; van Gorsel, E.; Knohl, A.; Law, B.E.; et al. Integration of MODIS land and atmosphere products with a coupled-process model to estimate gross primary productivity and evapotranspiration from 1 km to global scales. Glob. Biogeochem. Cycles. 2011, 25. [Google Scholar] [CrossRef]
  34. Yang, Y.T.; Guan, H.D.; Shang, S.H.; Long, D.; Simmons, C.T. Toward the use of the MODIS ET product to estimate terrestrial GPP for nonforest ecosystems. IEEE Geosci. Remote Sens. Lett. 2014, 11, 1624–1628. [Google Scholar] [CrossRef]
  35. Monteith, J.L. Solar-radiation and productivity in tropical ecosystems. J. Appl. Ecol. 1972, 9, 747–766. [Google Scholar] [CrossRef]
  36. Running, S.W.; Nemani, R.R.; Heinsch, F.A.; Zhao, M.S.; Reeves, M.; Hashimoto, H. A continuous satellite-derived measure of global terrestrial primary production. Bioscience 2004, 54, 547–560. [Google Scholar] [CrossRef]
  37. Zhao, M.S.; Heinsch, F.A.; Nemani, R.R.; Running, S.W. Improvements of the MODIS terrestrial gross and net primary production global data set. Remote Sens. Environ. 2005, 95, 164–176. [Google Scholar] [CrossRef]
  38. Zhao, M.S.; Running, S.W. Drought-induced reduction in global terrestrial net primary production from 2000 through 2009. Science 2010, 329, 940–943. [Google Scholar] [CrossRef] [PubMed]
  39. Monteith, J.L. Evaporation and surface-temperature. Q. J. R. Meteorol. Soc. 1981, 107, 1–27. [Google Scholar] [CrossRef]
  40. Mu, Q.; Heinsch, F.A.; Zhao, M.; Running, S.W. Development of a global evapotranspiration algorithm based on MODIS and global meteorology data. Remote Sens. Environ. 2007, 111, 519–536. [Google Scholar] [CrossRef]
  41. Mu, Q.Z.; Zhao, M.S.; Running, S.W. Improvements to a MODIS global terrestrial evapotranspiration algorithm. Remote Sens. Environ. 2011, 115, 1781–1800. [Google Scholar] [CrossRef]
  42. Huete, A.; Didan, K.; Miura, T.; Rodriguez, E.P.; Gao, X.; Ferreira, L.G. Overview of the radiometric and biophysical performance of the MODIS vegetation indices. Remote Sens. Environ. 2002, 83, 195–213. [Google Scholar] [CrossRef]
  43. Guindin-Garcia, N.; Gitelson, A.A.; Arkebauer, T.J.; Shanahan, J.; Weiss, A. An evaluation of MODIS 8-and 16-day composite products for monitoring maize green leaf area index. Agric. For. Meteorol. 2012, 161, 15–25. [Google Scholar] [CrossRef]
  44. Wu, C.Y.; Gonsamo, A.; Gough, C.M.; Chen, J.M.; Xu, S.G. Modeling growing season phenology in north American forests using seasonal mean vegetation indices from MODIS. Remote Sens. Environ. 2014, 147, 79–88. [Google Scholar] [CrossRef]
  45. Maeda, E.E.; Heiskanen, J.; Aragao, L.E.O.C.; Rinne, J. Can MODIS EVI monitor ecosystem productivity in the Amazon rainforest? Geophys. Res. Lett. 2014, 41, 7176–7183. [Google Scholar] [CrossRef]
  46. Nagler, P.L.; Scott, R.L.; Westenburg, C.; Cleverly, J.R.; Glenn, E.P.; Huete, A.R. Evapotranspiration on western US rivers estimated using the enhanced vegetation index from MODIS and data from eddy covariance and Bowen ratio flux towers. Remote Sens. Environ. 2005, 97, 337–351. [Google Scholar] [CrossRef]
  47. Tang, X.G.; Li, H.P.; Griffis, T.J.; Xu, X.B.; Ding, Z.; Liu, G.H. Tracking ecosystem water use efficiency of cropland by exclusive use of MODIS EVI data. Remote Sens. 2015, 7, 11016–11035. [Google Scholar] [CrossRef]
  48. Bai, Y.F.; Wu, J.G.; Xing, Q.; Pan, Q.M.; Huang, J.H.; Yang, D.L.; Han, X.G. Primary production and rain use efficiency across a precipitation gradient on the Mongolia plateau. Ecology 2008, 89, 2140–2153. [Google Scholar] [CrossRef] [PubMed]
  49. Niu, S.L.; Wu, M.Y.; Han, Y.; Xia, J.Y.; Li, L.H.; Wan, S.Q. Water-mediated responses of ecosystem carbon fluxes to climatic change in a temperate steppe. New Phytol. 2008, 177, 209–219. [Google Scholar] [CrossRef] [PubMed]
  50. Tong, X.J.; Li, J.; Yu, Q.; Qin, Z. Ecosystem water use efficiency in an irrigated cropland in the North China Plain. J. Hydrol. 2009, 374, 329–337. [Google Scholar] [CrossRef]
  51. Mitchell, S.R.; Emanuel, R.E.; McGlynn, B.L. Land-atmosphere carbon and water flux relationships to vapor pressure deficit, soil moisture, and stream flow. Agric. For. Meteorol. 2015, 208, 108–117. [Google Scholar] [CrossRef]
  52. Kolb, T.; Dore, S.; Montes-Helu, M. Extreme late-summer drought causes neutral annual carbon balance in southwestern ponderosa pine forests and grasslands. Environ. Res. Lett. 2013, 8. [Google Scholar] [CrossRef]
  53. Wolf, S.; Eugster, W.; Ammann, C.; Hani, M.; Zielis, S.; Hiller, R.; Stieger, J.; Imer, D.; Merbold, L.; Buchmann, N. Contrasting response of grassland versus forest carbon and water fluxes to spring drought in Switzerland. Environ. Res. Lett. 2013, 8. [Google Scholar] [CrossRef]
  54. Lu, X.L.; Zhuang, Q.L. Evaluating evapotranspiration and water-use efficiency of terrestrial ecosystems in the conterminous United States using MODIS and Ameriflux data. Remote Sens. Environ. 2010, 114, 1924–1939. [Google Scholar] [CrossRef]
  55. Tang, X.G.; Li, H.P.; Ma, M.G.; Yao, L.; Peichl, M.; Arain, M.A.; Xu, X.B.; Goulden, M.L. How do disturbances and climate effects on carbon and water fluxes differ between multi-aged and even-aged coniferous forests? Sci. Total Environ. 2017, 599–600, 1583–1597. [Google Scholar] [CrossRef] [PubMed]
  56. Yang, Y.T.; Guan, H.; Batelaan, O.; McVicar, T.R.; Long, D.; Piao, S.L.; Liang, W.; Liu, B.; Jin, Z.; Simmons, C.T. Contrasting responses of water use efficiency to drought across global terrestrial ecosystems. Sci. Rep. 2016, 6. [Google Scholar] [CrossRef] [PubMed]
  57. Velpuri, N.M.; Senay, G.B.; Singh, R.K.; Bohms, S.; Verdin, J.P. A comprehensive evaluation of two MODIS evapotranspiration products over the conterminous United States: Using point and gridded FLUXNET and water balance ET. Remote Sens. Environ. 2013, 139, 35–49. [Google Scholar] [CrossRef]
  58. Tang, X.G.; Li, H.P.; Huang, N.; Li, X.Y.; Xu, X.B.; Ding, Z.; Xie, J. A comprehensive assessment of MODIS-derived GPP for forest ecosystems using the site-level FLUXNET database. Environ. Earth Sci. 2015, 74, 5907–5918. [Google Scholar] [CrossRef]
  59. Zhang, L.; Tian, J.; He, H.L.; Ren, X.L.; Sun, X.M.; Yu, G.R.; Lu, Q.Q.; Lv, L.Y. Evaluation of water use efficiency derived from MODIS products against eddy variance measurements in China. Remote Sens. 2015, 7, 11183–11201. [Google Scholar] [CrossRef]
  60. Jiang, C.; Ryu, Y. Multi-scale evaluation of global gross primary productivity and evapotranspiration products derived from Breathing Earth System Simulator (BESS). Remote Sens. Environ. 2016, 186, 528–547. [Google Scholar] [CrossRef]
  61. Turner, D.P.; Ritts, W.D.; Cohen, W.B.; Gower, S.T.; Zhao, M.S.; Running, S.W.; Wofsy, S.C.; Urbanski, S.; Dunn, A.L.; Munger, J.W. Scaling Gross Primary Production (GPP) over boreal and deciduous forest landscapes in support of MODIS GPP product validation. Remote Sens. Environ. 2003, 88, 256–270. [Google Scholar] [CrossRef]
  62. He, M.Z.; Kimball, J.S.; Running, S.; Ballantyne, A.; Guan, K.Y.; Huemmrich, F. Satellite detection of soil moisture related water stress impacts on ecosystem productivity using the MODIS-based photochemical reflectance index. Remote Sens. Environ. 2016, 186, 173–183. [Google Scholar] [CrossRef]
  63. Tang, X.G.; Wang, Z.M.; Liu, D.W.; Song, K.S.; Jia, M.M.; Dong, Z.Y.; Munger, J.W.; Hollinger, D.Y.; Bolstad, P.V.; Goldstein, A.H.; et al. Estimating the net ecosystem exchange for the major forests in the northern United States by integrating MODIS and Ameriflux data. Agric. For. Meteorol. 2012, 156, 75–84. [Google Scholar] [CrossRef]
  64. Cammalleri, C.; Anderson, M.C.; Gao, F.; Hain, C.R.; Kustas, W.P. Mapping daily evapotranspiration at field scales over rainfed and irrigated agricultural areas using remote sensing data fusion. Agric. For. Meteorol. 2014, 186, 1–11. [Google Scholar] [CrossRef]
  65. Campioli, M.; Malhi, Y.; Vicca, S.; Luyssaert, S.; Papale, D.; Penuelas, J.; Reichstein, M.; Migliavacca, M.; Arain, M.A.; Janssens, I.A. Evaluating the convergence between eddy-covariance and biometric methods for assessing carbon budgets of forests. Nat. Commun. 2016, 7. [Google Scholar] [CrossRef] [PubMed]
  66. Emmerich, W.E. Ecosystem water use efficiency in a semiarid shrubland and grassland community. Rangel. Ecol. Manag. 2007, 60, 464–470. [Google Scholar] [CrossRef]
  67. Wagle, P.; Gowda, P.H.; Xiao, X.; Anup, K.C. Parameterizing ecosystem light use efficiency and water use efficiency to estimate maize gross primary production and evapotranspiration using MODIS EVI. Agric. For. Meteorol. 2016, 222, 87–97. [Google Scholar] [CrossRef]
  68. Hill, T.C.; Ryan, E.; Williams, M. The use of CO2 flux time series for parameter and carbon stock estimation in carbon cycle research. Glob. Chang. Biol. 2012, 18, 179–193. [Google Scholar] [CrossRef]
Figure 1. Location of the flux tower sites used in this study. The base map is derived from the ASTER Global Digital Elevation Model (GDEM) data.
Remotesensing 09 00616 g001
Figure 2. Seasonal variations in gross primary production (GPPEC), evapotranspiration (ETEC), and ecosystem water use efficiency (WUEEC) at the two flux sites, Arou (grassland site) and Daman (cropland site), during the period of 2013 and 2014. The units of GPP, ET and WUE are g m−2 d−1, mm d−1 and g kg−1, respectively. For x-axis, the data refer to week of year (WOY, eight-day periods) ranging from 1–46.
Remotesensing 09 00616 g002
Figure 3. Seasonal dynamics of solar radiation (Rg), air/soil temperature (Ta and Ts), vapor pressure deficit (VPD), natural precipitation (P) and vegetation index (EVI) observed at the two flux tower sites during 2013 and 2014. The eight-day average values are used to represent Rg, Ta and Ts, VPD and MODIS-derived EVI, while natural precipitation (P) represents the total precipitation during eight-day periods.
Remotesensing 09 00616 g003
Figure 4. A comparison of seasonal variations of ecosystem water use efficiency from flux tower measurements (WUEEC) and the estimates from MODIS products (WUEMOD) at the two flux sites Arou and Daman during the period of 2013 and 2014.
Remotesensing 09 00616 g004
Figure 5. Seasonal patterns and the scatter plots of ecosystem water use efficiency between flux tower measurements (WUEEC) and the MODIS estimates (WUEGR) from time-series EVI data at the two flux sites in 2015. (a,b) represent the Arou grassland site and the Daman cropland site, respectively. The black dashed line and red line represent 1:1 line and linear fit, respectively.
Remotesensing 09 00616 g005
Figure 6. Comparisons of seasonal dynamics in gross primary production and evapotranspiration between flux tower measurements (GPPEC, ETEC) and MODIS estimates (GPPMOD, ETMOD) at the Arou grassland site and Daman cropland site.
Remotesensing 09 00616 g006
Figure 7. The scatterplots of eight-day average GPP and ET between flux tower measurements and MODIS products at the two flux sites during 2013 and 2014. (a,b) represent the Arou grassland site and the Daman cropland site, respectively. 92 periods of data are used in total. The black dashed line and red line represent 1:1 line and linear fit, respectively.
Remotesensing 09 00616 g007
Table 1. Description of the two flux tower sites located in the arid and semi-arid region of China.
SiteArouDaman
Location100.4643°E/38.0473°N100.37223°E/38.85551°N
Elevation (m)30331556
Climate zoneSemi-aridArid
Mean temperature (°C)0.97.2
Mean Precipitation (mm)403.1126.7
Precipitation during the three years (mm)392.5; 520.6; 400.8135.5; 144.6; 161.0
Soil typesand mixed with siltsilt loam
Vegetation typeAlpine meadowCropland (maize)
Canopy height (m)0.2~0.31.8
Observation height (m)3.54.5
Observation period2013~20152013~2015
Reference[22,25][26]
Table 2. Pearson correlation analysis between ecosystem water use efficiency and the controlling environmental factors at the two flux tower sites used in this study.
SiteFunctionRg (W/m2)Ta (°C)Ts (°C)VPD(h Pa)P(mm)EVI
Arou (grassland)GPP0.4640.7670.8270.4990.7310.946
ET0.7200.9010.9190.7220.6960.872
WUE0.4230.7940.8530.4750.8020.960
Daman (cropland)GPP0.6050.6810.7010.3730.6500.925
ET0.8130.8630.8610.6750.4820.759
WUE0.5830.7140.7340.3650.7150.941
Note: Correlation is significant at the 0.01 level in all cases. Rg, Ta and Ts, VPD and P are observed at the flux tower sites. Time-series EVI data are derived from the MOD09A1 product.

