Article

How Reliable Is Structure from Motion (SfM) over Time and between Observers? A Case Study Using Coral Reef Bommies

1
Department of Biological Sciences, Macquarie University, Sydney 2109, Australia
2
School of Environmental and Life Sciences, University of Newcastle, Ourimbah 2258, Australia
*
Author to whom correspondence should be addressed.
Submission received: 19 June 2017 / Revised: 30 June 2017 / Accepted: 12 July 2017 / Published: 18 July 2017
(This article belongs to the Section Ocean Remote Sensing)

Abstract

:
Recent efforts to monitor the health of coral reefs have highlighted the benefits of using structure from motion-based assessments, and despite increasing use of this technique in ecology and geomorphology, no study has attempted to quantify the precision of this technique over time and across different observers. This study determined whether 3D models of an ecologically relevant reef structure, the coral bommie, could be constructed using structure from motion and be reliably used to measure bommie volume and surface area between different observers and over time. We also determined whether the number of images used to construct a model had an impact on the final measurements. Three dimensional models were constructed of over twenty coral bommies from Heron Island, a coral cay at the southern end of the Great Barrier Reef. This study did not detect any significant observer effect, and there were no significant differences in measurements over four sampling days. The mean measurement error across all bommies and between observers was 15 ± 2% for volume measurements and 12 ± 1% for surface area measurements. There was no relationship between the number of pictures taken for a reconstruction and the measurements from that model, however, more photographs were necessary to be able to reconstruct complete coral bommies larger than 1 m3. These results suggest that structure from motion is a viable tool for ongoing monitoring of ecologically-significant coral reefs, especially to establish effects of disturbances, provided the measurement error is considered.

Graphical Abstract

1. Introduction

Coral reef ecosystems are under pressure globally due to human-induced climate change [1,2]. Record temperatures in early 2016 caused unprecedented levels of coral bleaching and mortality [3,4,5]. Despite these widespread perturbations on coral reefs, research conducted by Cinner et al. [6] has revealed many ‘bright spot’ and ‘dark spot’ reefs that, for unexplained reasons, are more or less resilient to climate change. To better understand bleaching and protect coral reefs in the future, understanding why certain reefs fare better or worse than others is imperative. Such an objective requires accurate monitoring of the reef over several spatial and temporal scales.
In the past, reef monitoring has routinely been conducted using broad aerial surveys or more detailed assessments on snorkel [7]. While such survey techniques are effective, they are limited by the precision of their measurements and the ease of directly comparing data from successive years or months. Recently, structure from motion has become prevalent as another tool for reef monitoring [8,9,10,11]. Structure from motion is an image processing technique that allows construction of accurate 3D models from overlapping successive photographs taken at various angles. While studies have quantified measurement errors that arise from using this technique compared to ‘true’ volume and surface area [12,13,14] or rugosity [10,14], no study has determined error margins for measurements obtained over time and across different observers. Moreover, no research has attempted to measure the volume and surface area of an ecologically-relevant reef feature often used in reef monitoring, the coral bommie [15,16,17]. Such 3D measurements of bommies are essential for our understanding of the reef’s capacity to support assemblages of fishes [18], assess their reef-building capacity [14,19], nutrient requirements [20], and to understand the extent of impacts, such as coral bleaching [21].
Structure from motion has garnered attention in the field of coral reef monitoring, however, its use has the potential to become widespread in other fields. For example, structure from motion has been used by geomorphologists to assess the scale of landslides [22] and the size of rivers [23]. Terrestrial ecologists have used this technique to assess forest cover [24], river restoration [25], vineyard growth [26], and determine tree structure [27]. The growing use of unmanned aerial vehicles for remote surveying has the potential to substantially increase the use of structure from motion for a variety of ecological fields [28], and large-scale marine assessments using this technique have recently become possible [29,30,31]. Since ecological assessments generally require multiple surveys conducted over large time periods and from multiple observers, research on the reliability of structure from motion across these factors is beneficial to numerous fields of research, and is an issue that has frequently been identified by geomorphologists [32].
This study determined whether structure from motion could reliably be used to measure volume and surface area of coral bommies over time and across different observers. Specifically, we wanted to understand if it is possible for independent surveyors to return to a reef multiple times, conduct concurrent structures from motion surveys, and reliably compare surface area and volume measurements in time and space. Our assessment included error margins within and between observers, and errors from the process of making 3D models in structure from motion. To achieve this, we assessed any inherent software variation resulting from stitching bommie models, if the number of images taken had an impact on measurements, and the relationship between error margin and the size of the measured bommie.

2. Materials and Methods

2.1. Study Site

Research was conducted on the reef flat on the southern side of Heron Island (23.4420′S, 151.9140′E), a coral cay on the southern end of the Great Barrier Reef, Australia. These reefs are characterised by patch sand and coral bommies, and are regularly separated from the ocean due to tidal activity. Data were collected from 30 March 2016–10 April 2016 from mid to high tide to allow sufficient depth for snorkelling. The chosen study site is dedicated to scientific research and has been studied extensively [33,34,35].

2.2. Surveys

2.2.1. Inter-Individual Variability in Documenting Coral Bommies

To determine the precision of observers recording volume and surface areas of bommies, fifty-two bommies typical of the area were haphazardly chosen on the reef flat. Bommies ranged from small (~300 cm3) to large (~8 m3) in size and included a range of coral species with different morphotypes (predominantly massive, branching, or a combination of both). Each bommie was marked with a nearby stake to allow easy identification by successive snorkelers, and was surveyed independently by five snorkelers with similar experience and training. Tabular corals were very rare on this reef flat and not included in this study, but other coral morphotypes were classified as ‘massive’, ‘massive/branching’ (bommies that had both morphotypes), or ‘branching’.
Images were captured using GoPro™ Hero 4 Black cameras set to continuously capture 12 MP JPEG images every 0.5 s as adapted from the method in Raoult et al. [8]. As structure from motion requires a reference object with known dimensions to accurately measure an object, a 1.5 kg dive weight with known dimensions was placed next to each bommie. This 3D measurement reference had defined edges that could easily be measured and was heavy enough to ensure no movement of the reference object during periods with higher water flow.
The image capturing process was adapted from Gutierrez-Heredia et al. [36] and Raoult et al. [8]. Individual snorkelers swam in a clockwise or anticlockwise direction that allowed spiralling around the bommie, taking overlapping photographs at three main angles to provide good coverage of the object: 45 degrees, planar, and top-down. These three capture angles were necessary to capture the sharp angles that occur in bommies. Planar image capture was sometimes difficult on snorkel due to the tide height. Where the spiral technique was insufficient to cover the vertical surface of the larger bommies, a u-shaped coverage pattern was used. The aim was to obtain ~80% overlap between images, which allowed good image alignment during image processing, and has previously been identified as a key problem area for constructing models [8]. There was no upper or lower limit to the number of images taken as the objective was to obtain complete photo coverage of the chosen bommie. Thus, the number of images per bommie ranged from 57 to 562, depending on the bommie size.

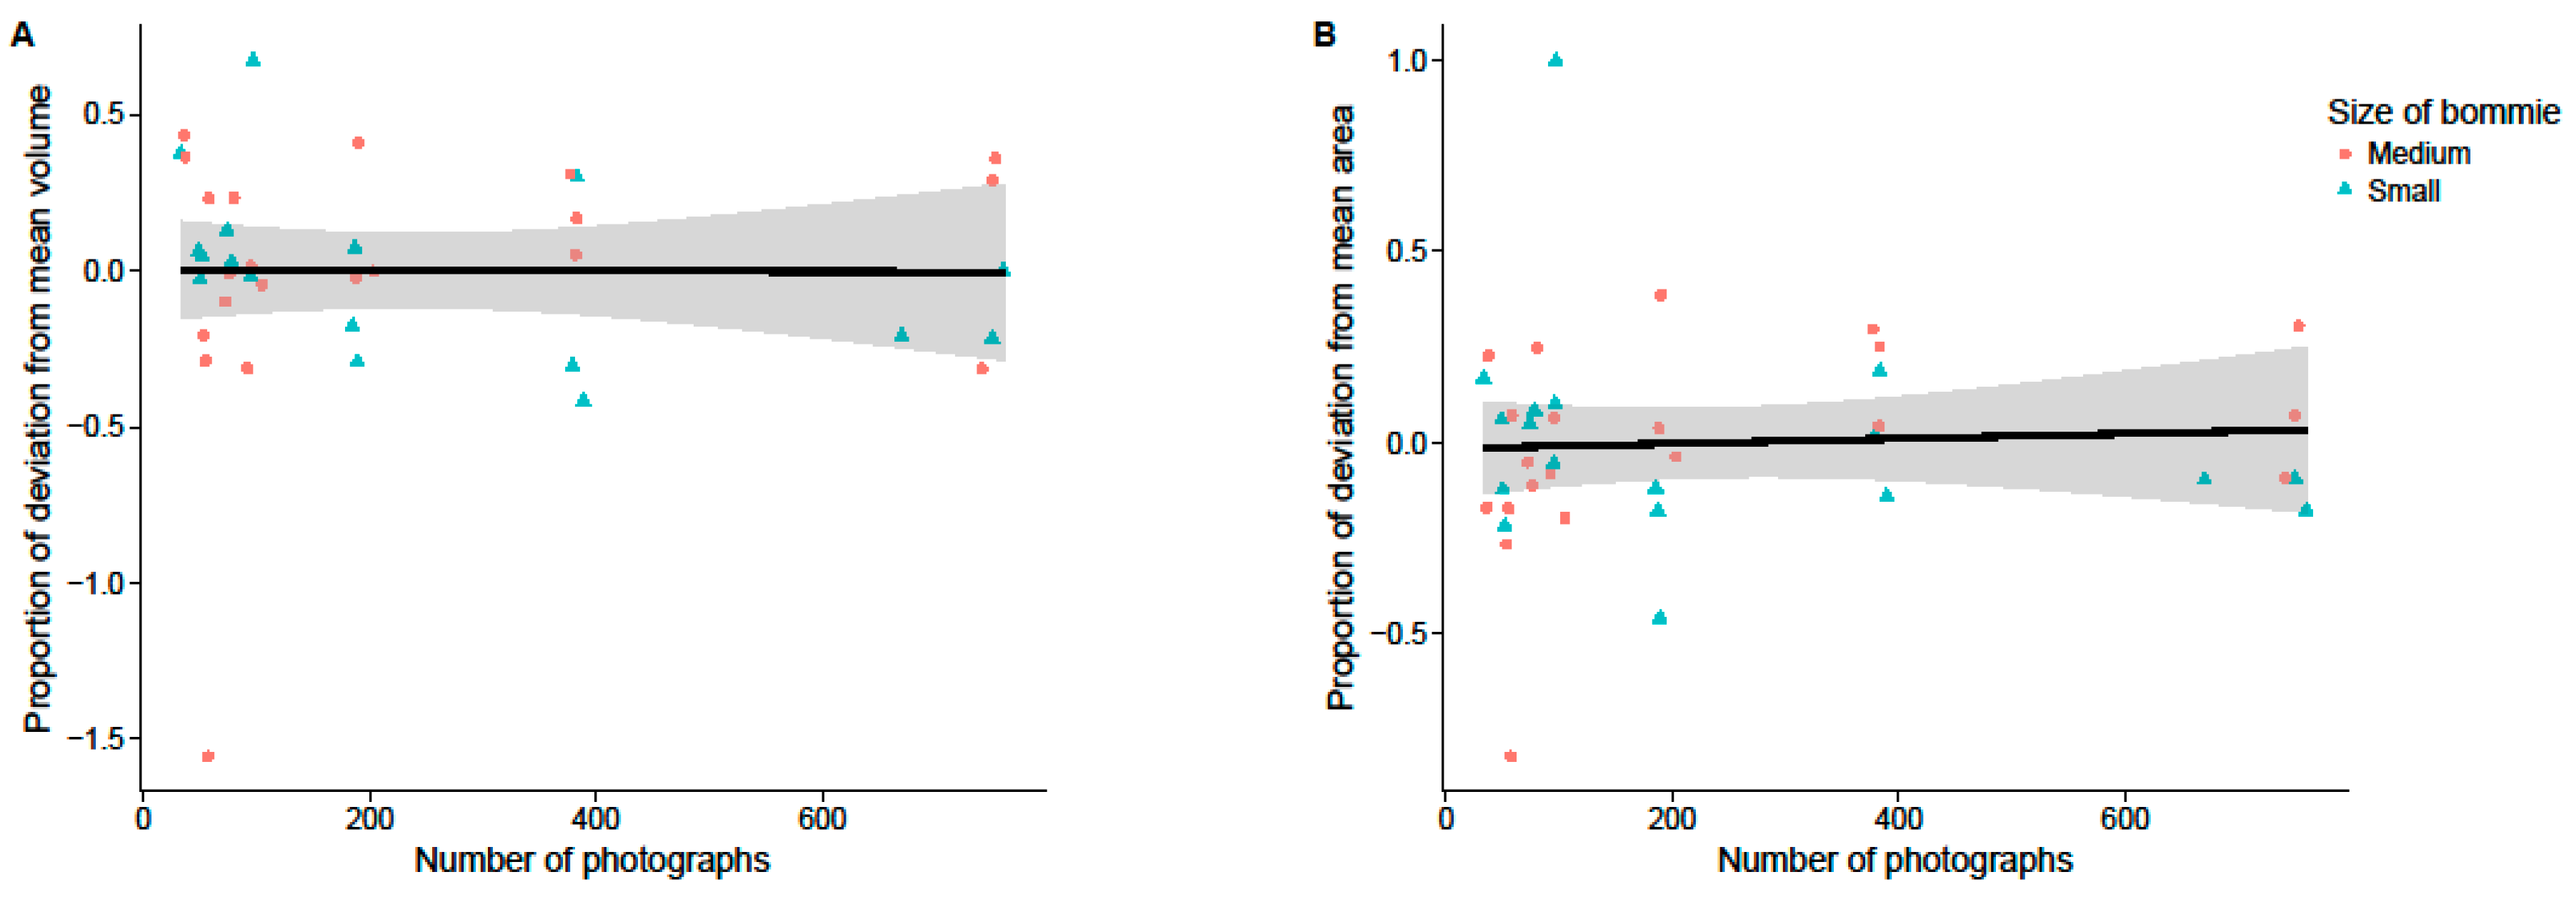
2.2.2. Relationship between the Number of Images and Bommie Size

To determine the effect of the number of photographs on measurement precision and their relationship with bommie size, nine bommies of three size classes were surveyed: three small, three medium, and three large. ‘Small bommies’ were roughly fist-sized, ‘medium bommies’ were less than one body length in diameter, and ‘large bommies’ were those that could not be seen in their entirety under water. Each of the three snorkelers assessed one bommie in each size class. The aim was to capture a complete model of each bommie using 50, 75, 100, 150, 200, 500, and 1000 images. The image capture pattern was identical to the technique used to measure observer effects. GoPros™ were set to 0.5 s images per second, and a timer was used to approximate the total numbers of pictures. This timer was operated by a second assistant snorkeler, who notified the photographer when they should start and stop their image capture.

2.2.3. Temporal Variability in Documenting Coral Bommies

To assess whether models of bommies were consistent over time, four separate snorkelers independently measured the same three bommies over three consecutive days and again on the fifth day. The same techniques for image capture were used as in the above inter-individual trials.

2.3. Analyses

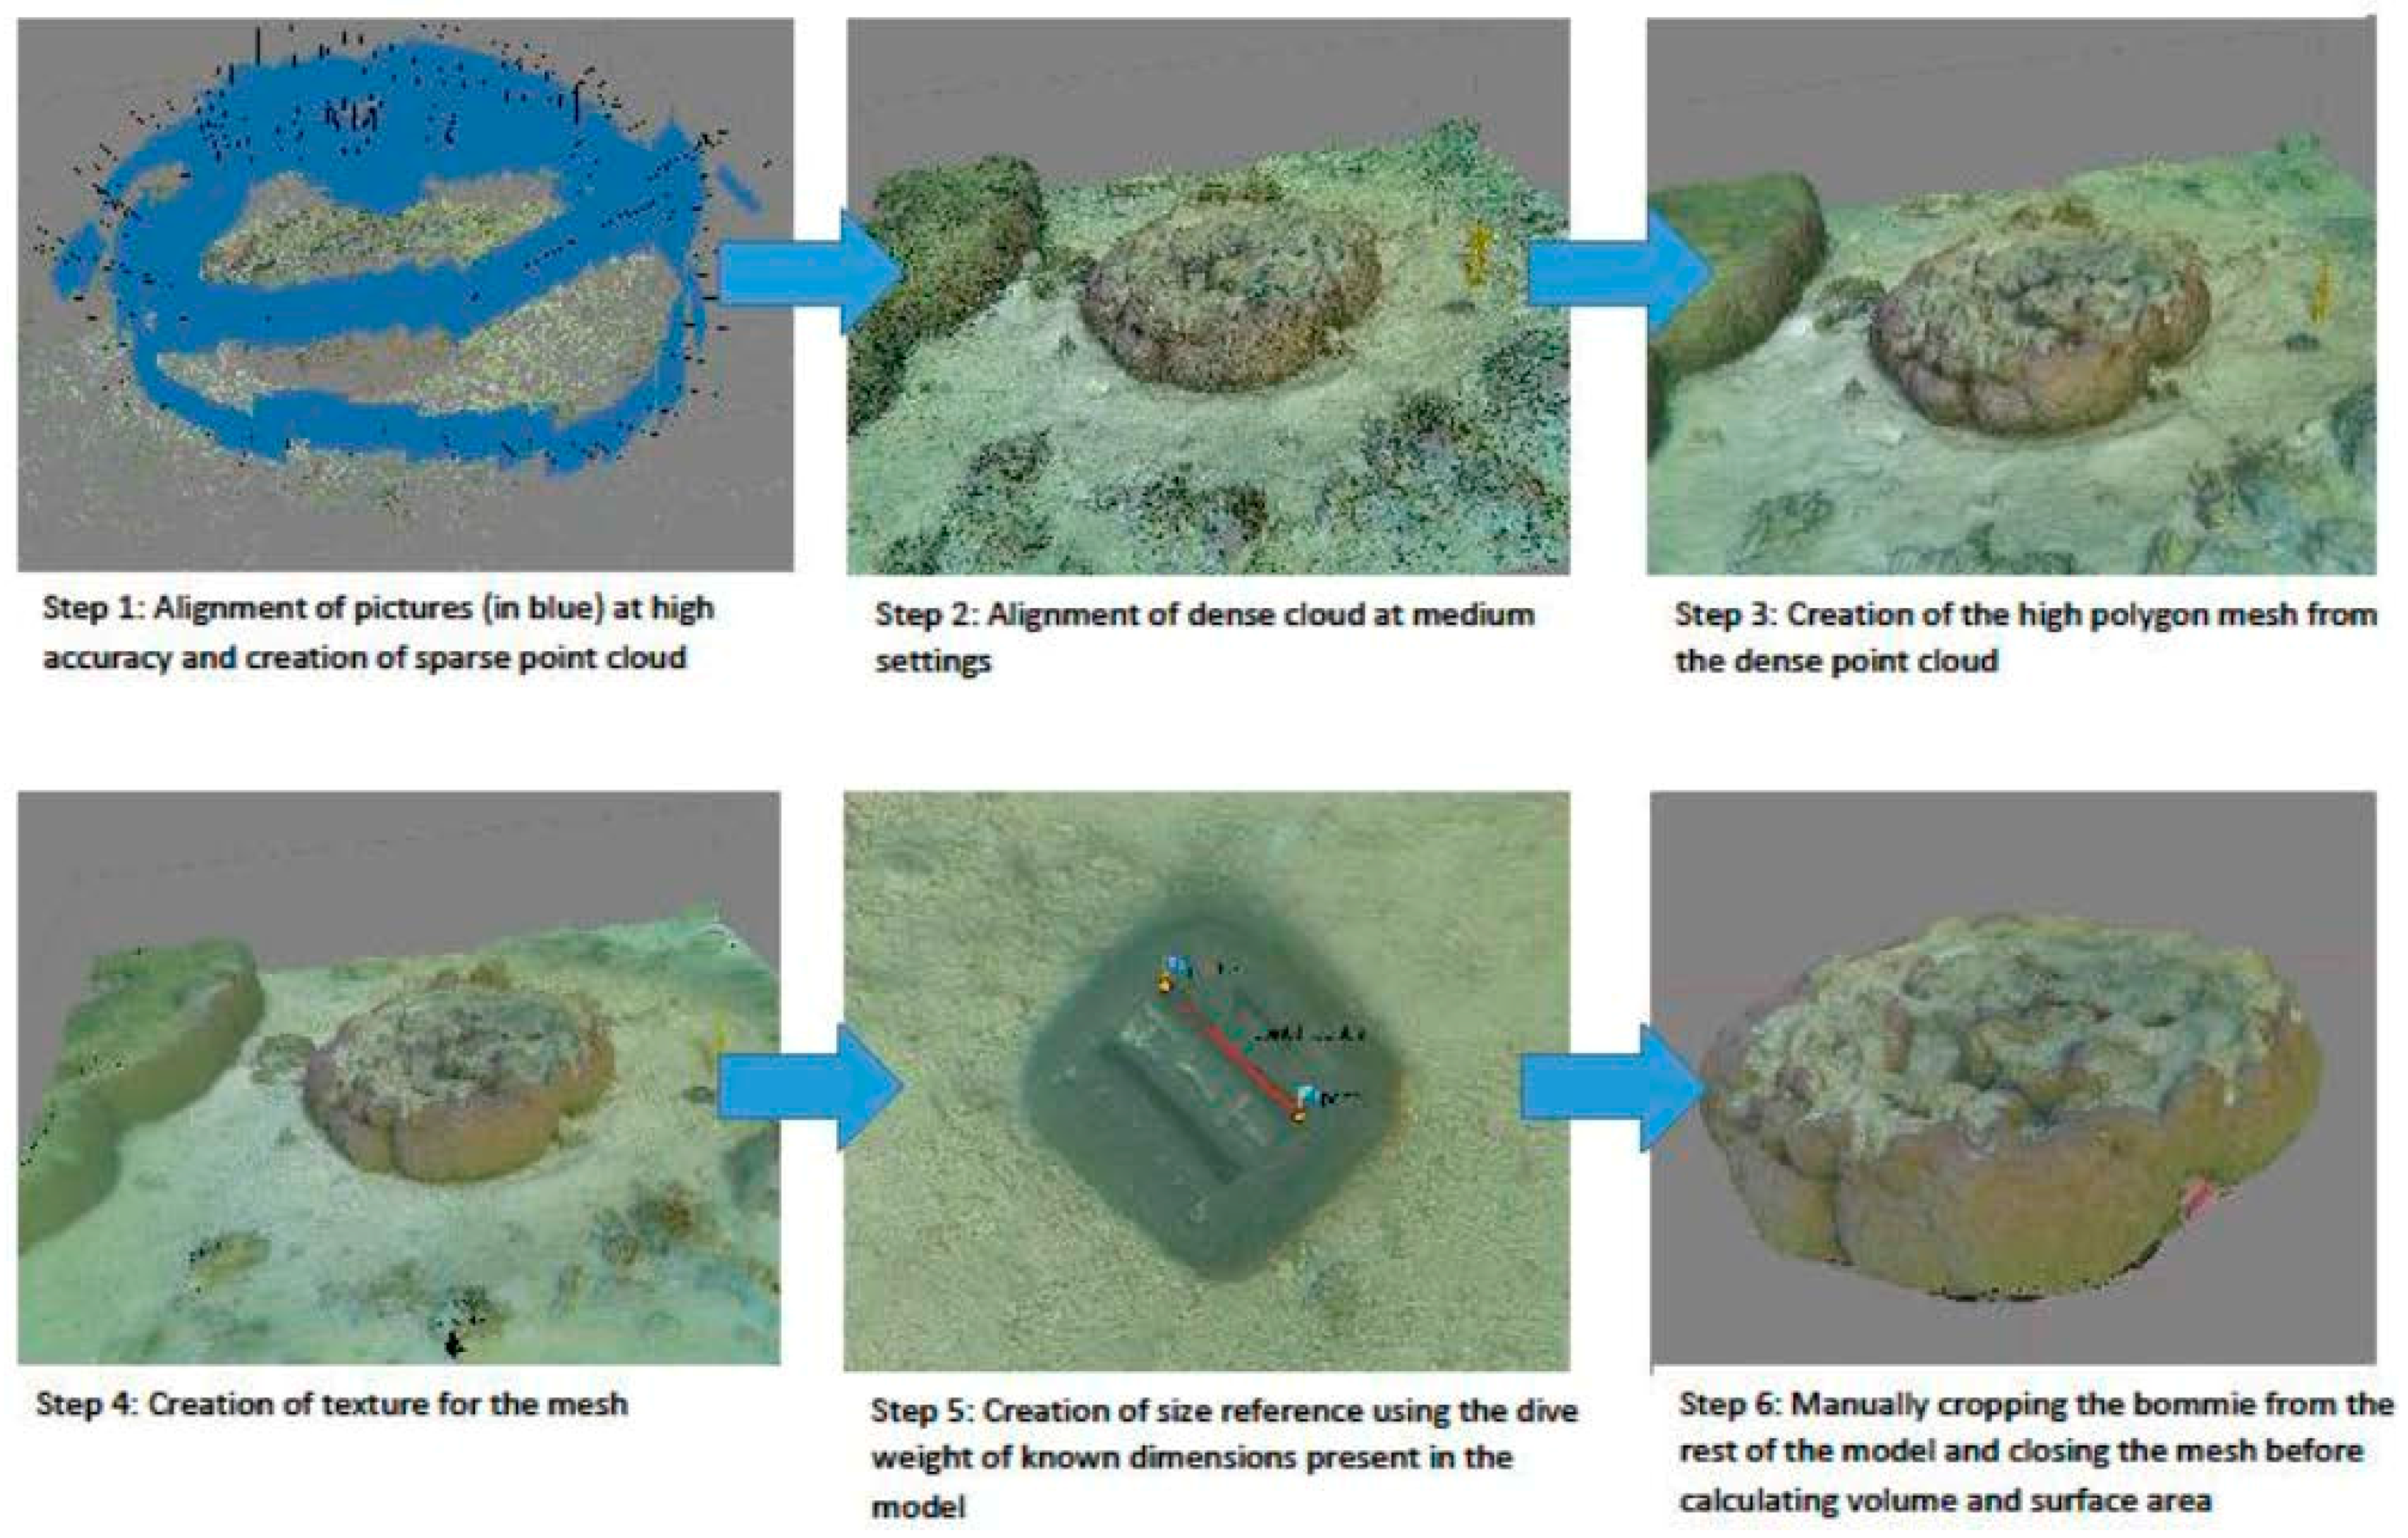
2.3.1. Image Processing

3D models were reconstructed using Agisoft Photoscan Professional Edition V. 1.2.5 (Agisoft LLC, St. Petersburg, Russia). Agisoft software is a relatively affordable and user-friendly package that automatically adjusts images for lens distortion, corrects image colours, performs structure-from-motion reconstructions, and allows measurements of length, volume, and surface area. This software has now been used in several coral reef studies [8,37,38,39].
Images were first aligned using the high accuracy setting as preliminary testing showed that this factor did not substantially increase processing time for the number of images in these assessments: datasets with larger image numbers (>1000) may consider medium accuracy to decrease processing time. To obtain the best balance between processing time and model quality, medium-quality dense clouds were constructed. Meshes were then constructed with a high polygon count and arbitrary depth map before building a texture using a generic mapping mode, a mosaic blending mode, and a texture size of 30,000. To set the reference size within models, the dive weight was measured by using the exact length of the upper entrance to the holes (to the nearest mm) used to attach the weights to a dive belt. Two points were placed on the limits of the chosen hole, and the points were then used to create a scale bar set to the actual measured length of the weight. The model of the bommie was then manually cropped from the rest of the mesh using the selection tools feature. The mesh was closed and the volume and surface area calculated using the measurement tools feature (Figure 1).

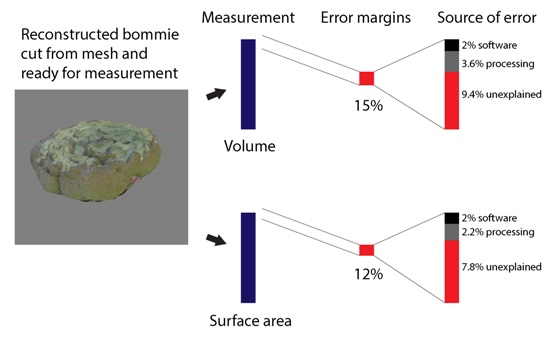
2.3.2. Software Measurement Error

Measurement errors inherent to structure-from-motion processing are well documented [37] and are often assessed by comparing measurements to GPS data [40]. In coral-based studies, precise GPS data are difficult to obtain and often not sufficiently precise for small-scale applications, and this means that a scale reference needs to be set within each model: inaccurate reference setting can, therefore, cause inaccuracies in measurements. To overcome this issue and assess measurement error, an underwater 3D model was constructed using the same method as the bommies, but focused on four dive weights of known dimensions. Fine scale measurements of the actual length of the dive weight upper holes were measured in situ to the nearest mm. Images of the weights were then taken and a 3D mesh containing all four weights reconstructed as per the protocols above. The weights were then measured by an individual using Agisoft Photoscan (as above) with the other weights in the image as references. The resulting measurements were compared to each other to determine the coefficient of variation that results from using successive weights as references. Coefficients of variation are frequently used to assess the precision of measurement methodologies [41].

2.3.3. Processing Effect

Preliminary processing showed that manual separation of a bommie from the flat mesh could lead to measurement errors. To assess the extent of this error, three bommies were processed using high image alignment and a high-quality dense cloud reconstruction. The same mesh for each bommie was then manually cropped ten separate times by the same individual. Each cropped bommie was then closed and the volume and area calculated as per the protocol outlined above. The coefficient of variation was then calculated for each of the three bommies, and the mean of these three was used as an estimate of the processing error since the only difference between each of the measurements was the cropping.

2.3.4. Impact of Coral Morphotype on Error

Previous research by Gutierrez-Heredia et al. [36] suggests that coral morphotype can have an effect on measurement variability. The coefficient of variation was calculated for each bommie, and a linear model was produced to determine whether there was a significant difference between the coefficient of variations of branching, branching/massive and massive coral morphotypes.

2.3.5. Inter-Individual Variability in Processing Images for 3D

Variation may be inherent in data collection at the level of an individual, or observer. Since structure from motion is primarily a software-based analysis, we expected inter-individual variation to be low: this is a critical aspect of an effective monitoring tool, where different observers need to produce comparable data. To determine whether there were inter-observer differences and analyse these data, the volume and area measurements were first log-transformed and tested for normality. A linear mixed effect model was calculated using volume and area as covariates, with the bommie as a fixed factor, and the observer as a random factor. Analyses were conducted in R (V. 3.3.1) using the lme4, RLRsim [42], and ggplot2 packages [43]. To obtain a p value and assess whether measurements of volume and surface area of the same coral bommies were significantly different between observers, a conservative restricted likelihood ratio test of the random effect (RLRT) was conducted on the same generalized linear mixed model. Mean coefficients of variation of volume and surface area measurements were then calculated to quantify error margins that could be expected between observers or successive measurements.

2.3.6. Temporal Effect

Over a period of five days, it is unlikely that coral bommies grow significantly, and structure from motion measurements should reflect this. To determine whether successive measurements of bommies across different days had a significant effect on the measurements of volume or surface area, temporal measurements were analysed using a MANOVA (Pillai test) with surface area and volume as covariates, and the bommie and day as fixed factors. As no significant inter-observer measurement errors occurred (see results), the observer was not included as a factor in this analysis.

2.3.7. Image Numbers

Processing times in structure from motion can be problematic for large numbers of images or high-quality images. Such images require higher-performance machines and longer processing times. We also predicted that larger image numbers would produce more consistent measurements. To determine the optimal number of images needed for precise measures of the bommies examined in this study, absolute portions of deviation from the mean volume and mean surface area were calculated for each bommie. Linear regression models using the lm function in R were then used to determine whether the image number had an effect on the absolute deviation from the mean area and volume.

2.3.8. Predicting Error Margins for Ecological Monitoring

For structure from motion to be a reliable tool for ecological monitoring, an estimate of total expected error between successive measurements of a fixed (i.e., non-changing) structure is necessary. Such precise and accurate estimates enable observers to measure thresholds of change that would be ecologically important and that may act as precursors for larger change. Coral growth rates range from 0.5% weight increase per year for massive, slow-growing corals, to 3% weight increase per year for branching, fast-growing corals [44], and some studies record annual productivity of nearly 30% in branching corals [45,46]. For structure from motion to be effective to monitor reef structures, the error margins need to be small enough to allow reliable comparisons in these timescales. We propose that the relationship between measurement error and bommie size would be similar to our inter-individual observations. The coefficient of variation calculated for error rates in area and volume measurements was used as a proxy for total error, and this coefficient of variation was then separated into sections using the error margins for each of the factors tested above with the mean values (likely scenario) and lower and higher error margins (best case and worst case scenario).

3. Results

3.1. Software Measurement Error

Setting scale reference points in structure from motion software to measure objects resulted in small errors. The mean proportion of error was 2.3%, with a mean standard deviation of 1.2 mm (Table 1).

3.2. Processing Effect

Manually cropping bommies from the same mesh produced some measurement error, regardless of size. The calculated volume’s mean coefficient of variation was 3.6%, and the calculated area’s mean coefficient of variation was 2.2% (Figure 2).

3.3. Morphotype Effect

There was no difference in measurement error between coral morphotypes. There was no significant difference between the coefficient of variation of massive (n = 5), branching/massive (n = 3), or branching corals (n = 14) for either area (df = 2, 18, F = 0.71, p > 0.05) or volume (df = 2, 18, F = 0.54, p > 0.05).

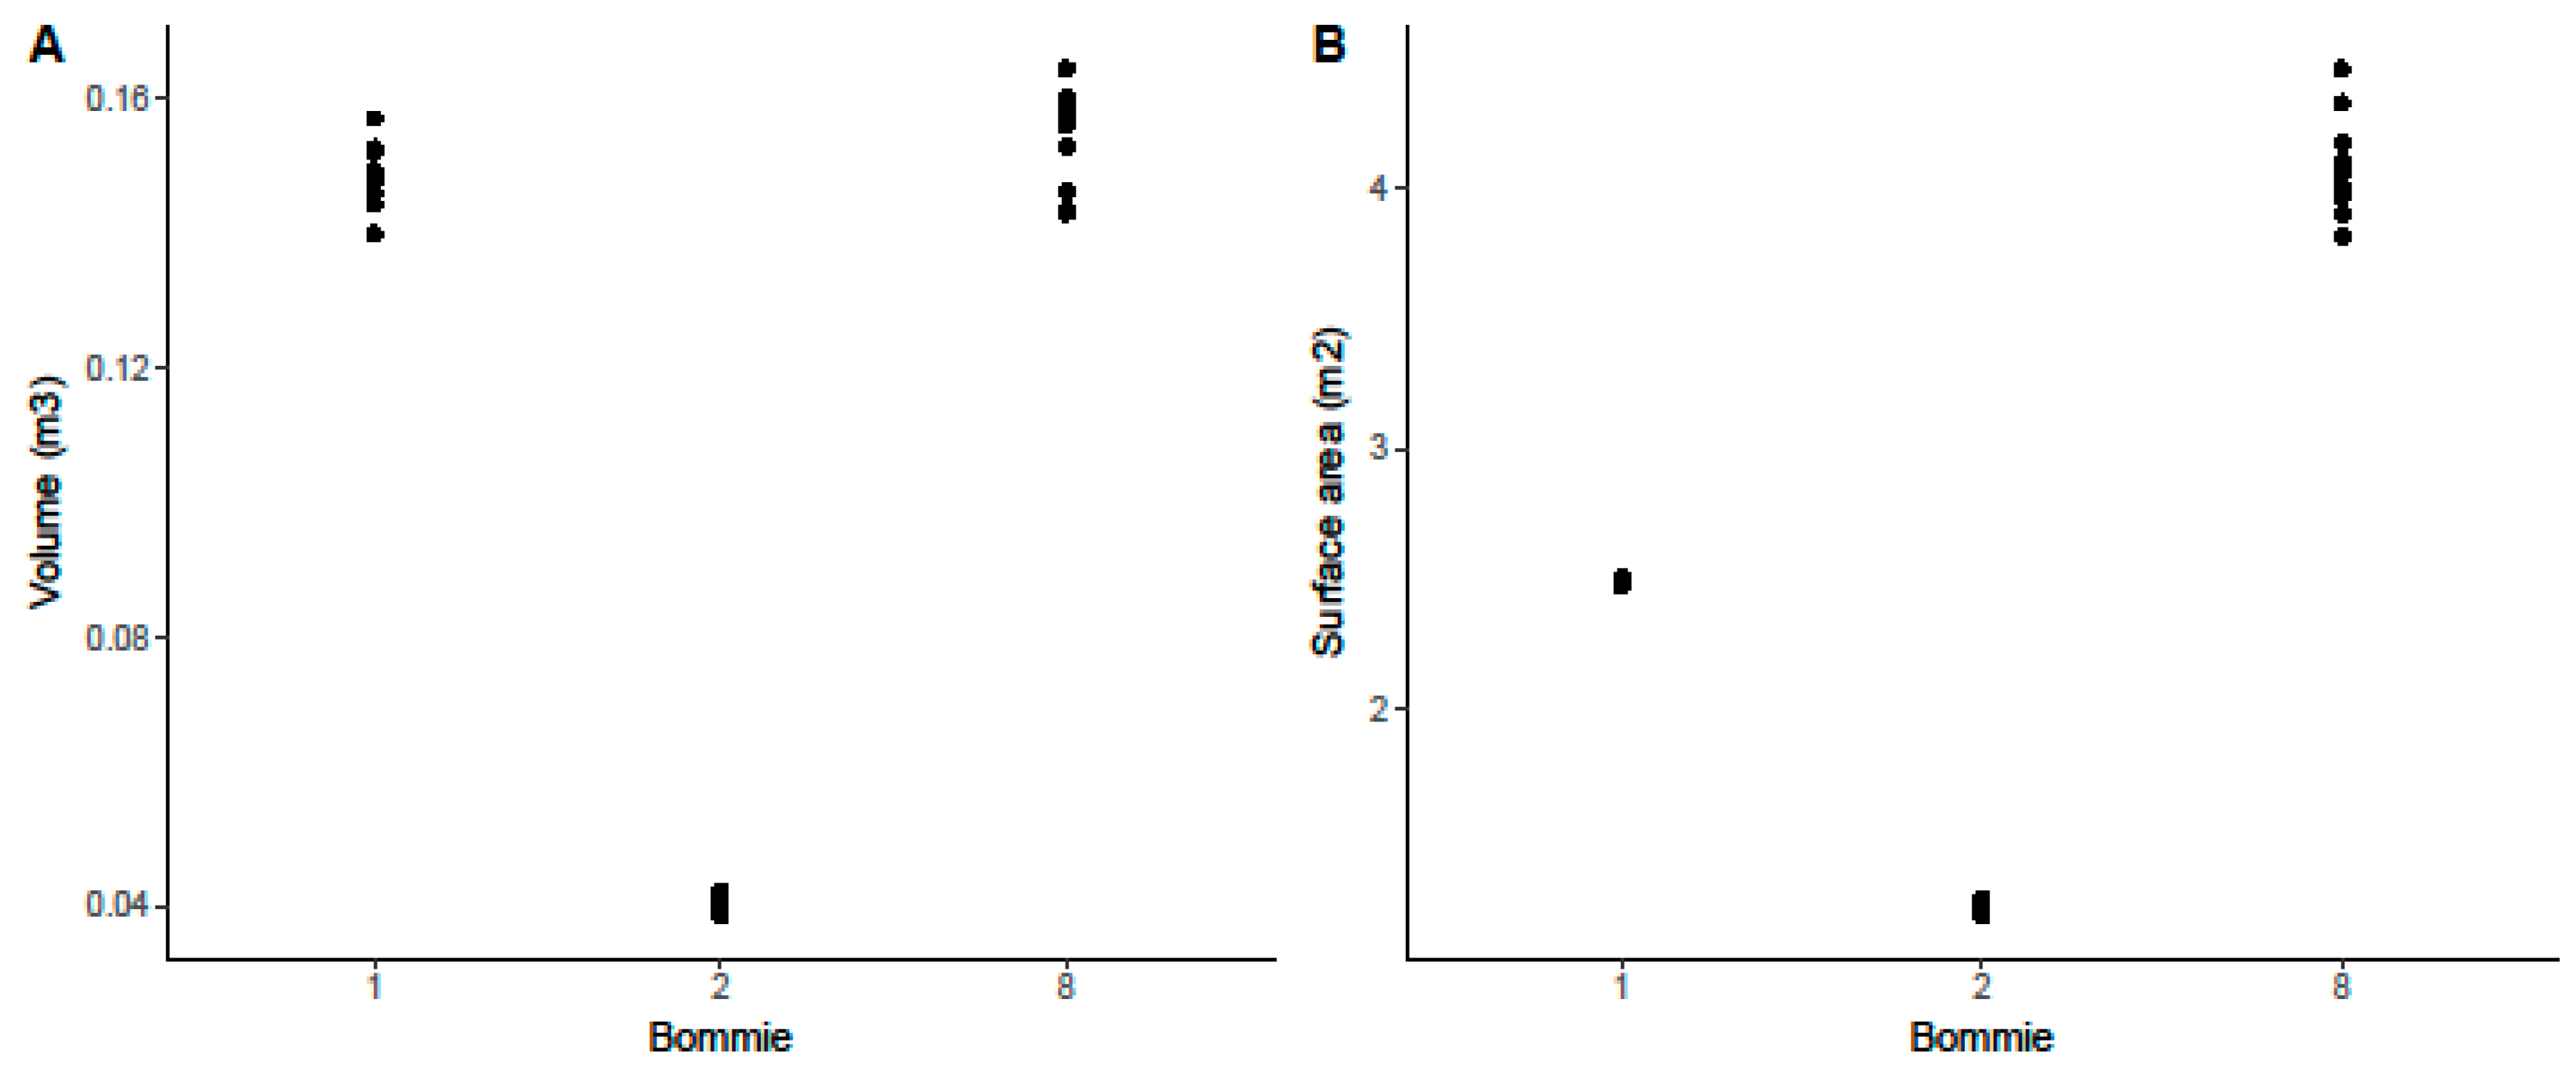
3.4. Inter-Individual Variability in Processing Images for 3D

There was no significant observer effect on the measurement of bommie volume or surface area (RLRT = 1.33, p = 0.09). Significant correlations were observed between mean bommie surface area, and volume, and standard deviation increased significantly with volume and surface area (linear regressions, df = 20, F = 97.3, p < 0.001; df = 20, F = 797.5, p < 0.001, respectively, Figure 3). There was no significant relationship between bommie size and the coefficient of variation in volume or area measurements (linear regressions, df = 20, F = 2.13, p > 0.1; df = 20, F = 1.29, p > 0.2, respectively). Across all the bommies, the mean coefficient of variation for volume measurements was 0.15 ± 0.02, and the mean coefficient of variation for area measurements was 0.12 ± 0.01. Due to clear, sunny conditions and shallow tides, many of the bommies captured during the third and fourth day of fieldwork could not be aligned across all observers due to a ripple effect and shadowing caused by sunlight in shallow waters. This reduced the total number of bommies surveyed for this section from 52 to 22.

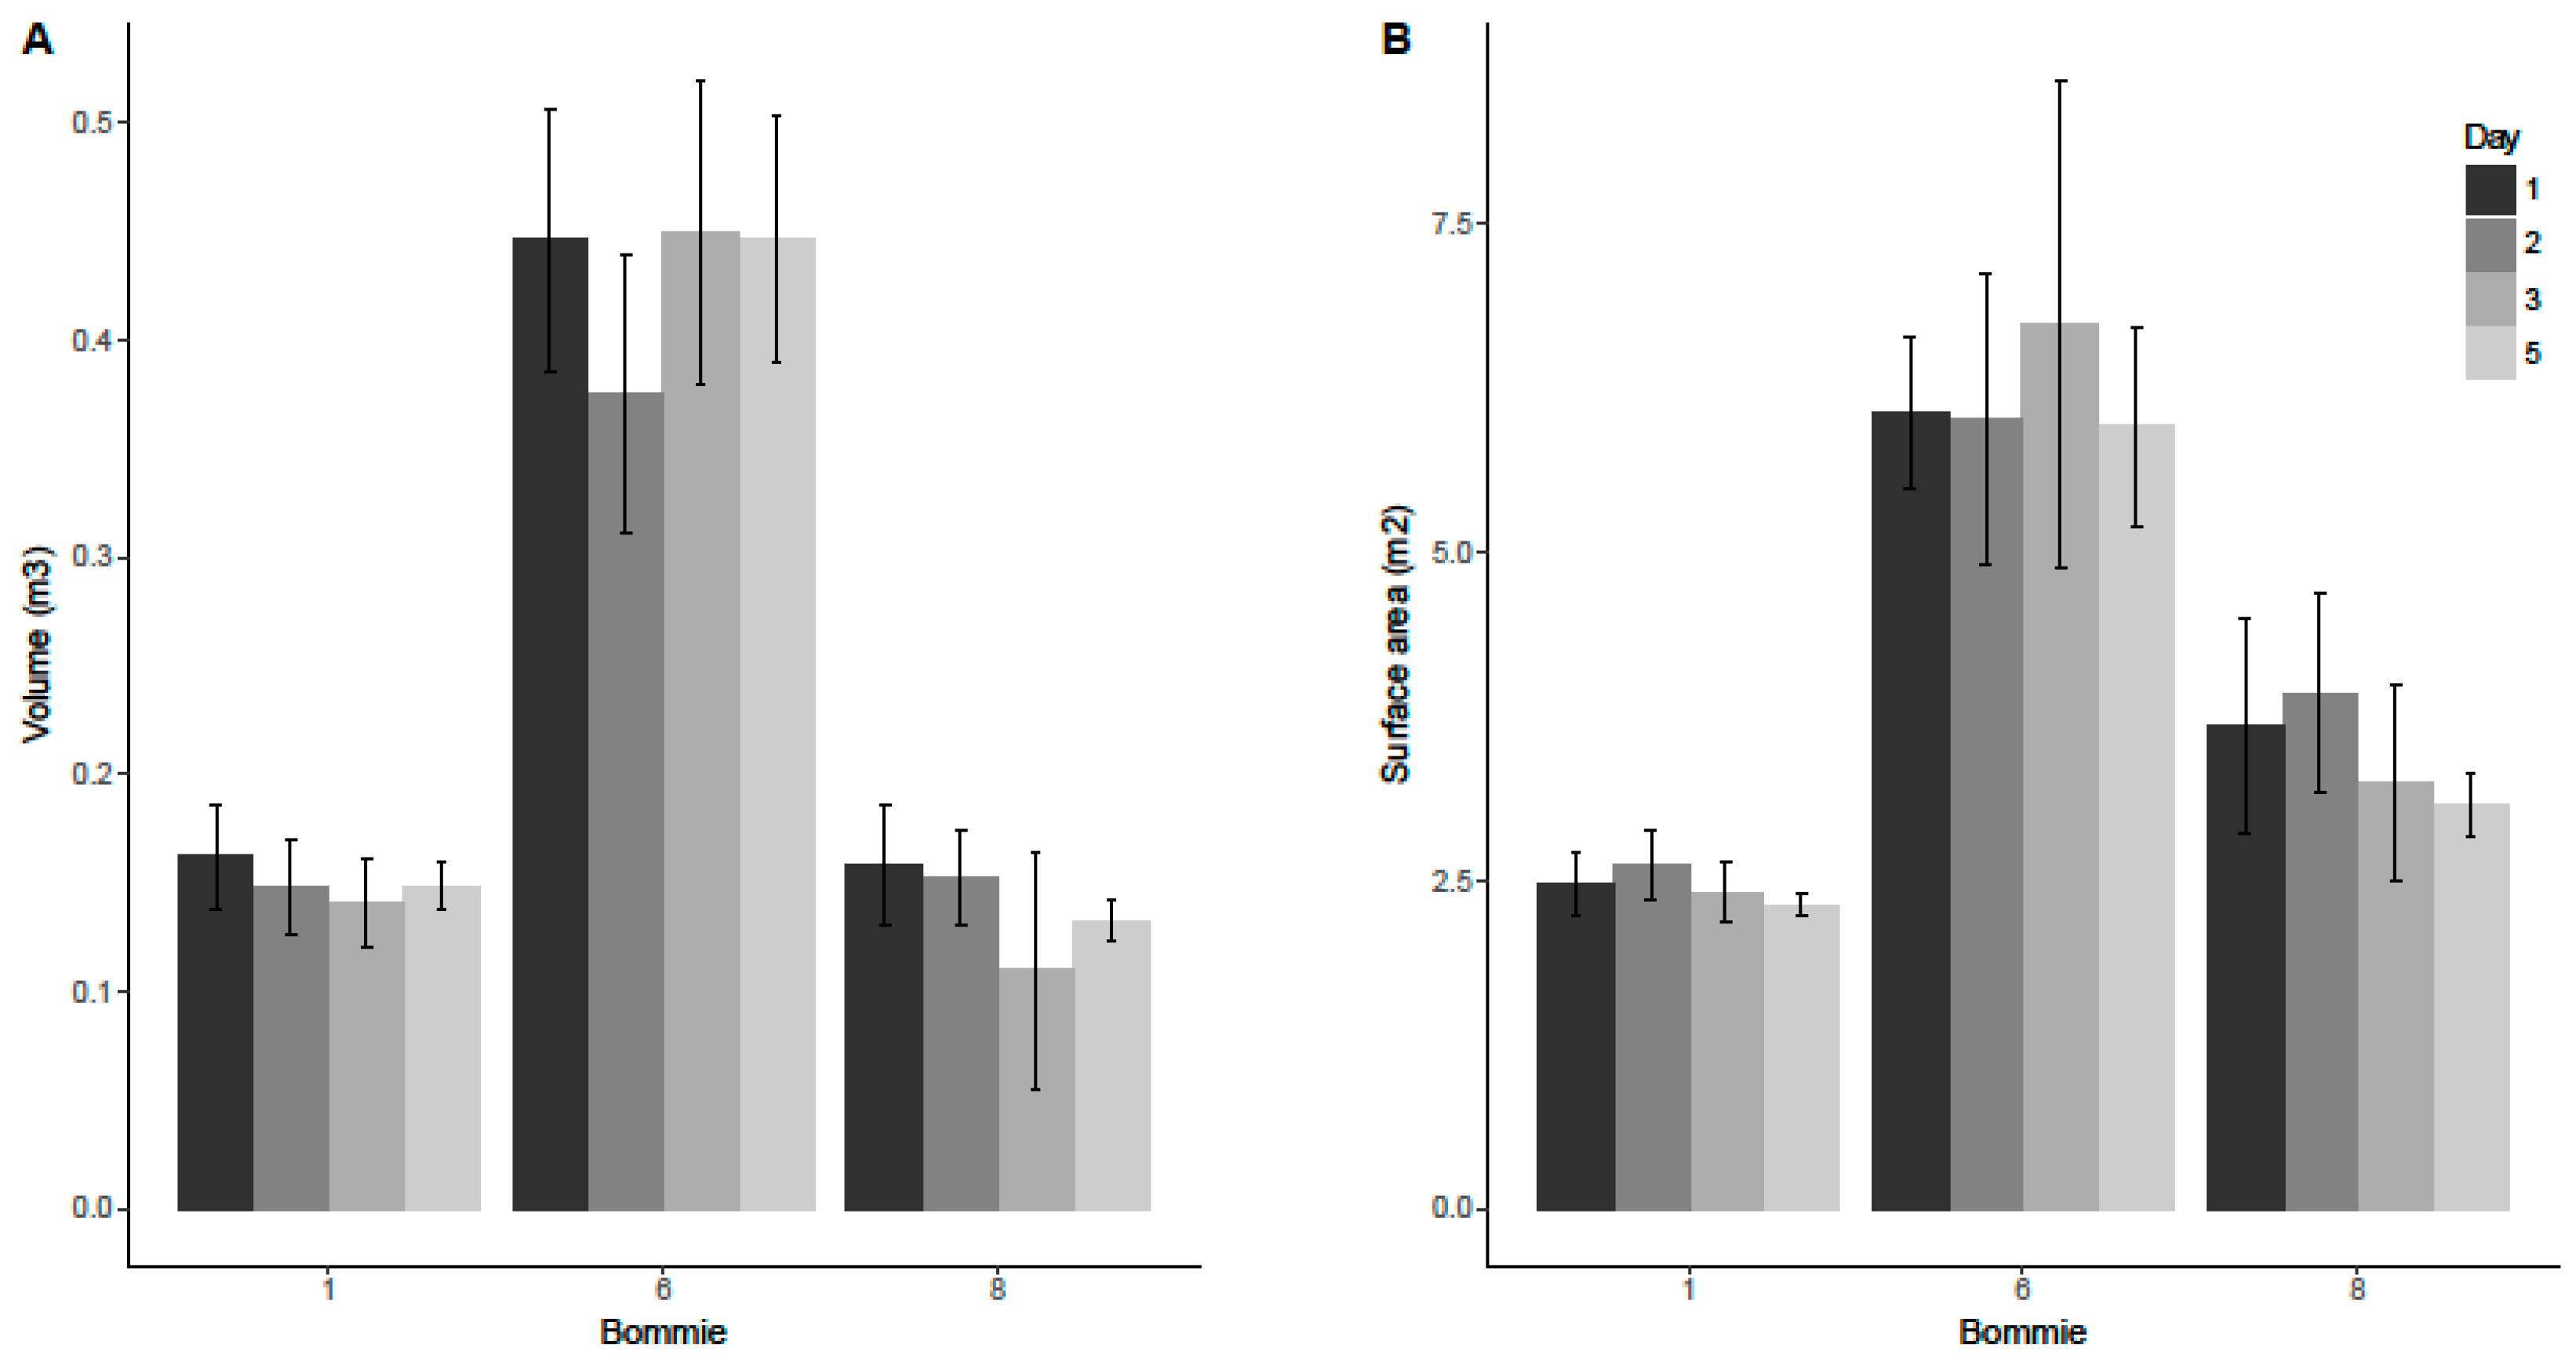
3.5. Temporal Effect

Day did not have a significant effect on the mean volume or surface area for any of the three bommies (MANOVA, df = 80, F = 1.11, p = 0.34; Figure 4).

3.6. Image Numbers

The number of images taken of bommies impacted the quality of models, and this was related to the size of the bommies. Larger bommies could only be measured in one of the three replicates, and only at the highest number of photos (n = 750). On three separate occasions, bommies in the ‘small’ and ‘medium’ classes could not be measured due to insufficient alignment of photographs to form a complete model (a model that covers the entire bommie structure and allows measurement within software). In these cases portions of the bommies could be constructed but not the whole structure. Although the number of outliers was higher at lower numbers of images, there was no significant correlation between photo number and the proportion of deviation from mean volume (df = 5 and 33, F = 1.61, p = 0.18) or surface area (df = 5 and 33, F = 1.39, p = 0.25; Figure 5).

3.7. Predicting Error Margins for Ecological Monitoring

Across all the bommies, the mean coefficient of variation for volume measurements, or mean total volume measurement error was 0.15 ± 0.02, and the mean coefficient of variation for area, or mean total area measurement error was 0.12 ± 0.01. The mean software measurement error was 0.02 ± 0.009. The mean manual processing error for volume measurements was 0.036, and the mean manual processing error for area measurements was 0.022. There was no apparent error from the factors ‘day’ or ‘numbers of photographs’. This resulted in an ‘unexplained’ error, or error that relates to the measurement accuracy of the technique, of 0.094 for volume measurements and 0.078 for area measurements. Thus, measurements using structure from motion of area are less prone to measurement error than volume measurements, and variations in measurements greater than 15% or 12% for volume and area measurements, respectively, are highly likely to indicate significant morphological changes in reef structure (Figure 6).

4. Discussion

Our study shows that while there are small errors associated with the process, structure from motion can be used to measure volume and surface area of coral bommies for ecological monitoring, provided that users account for probable error ranges of measurements. Measurements of bommies were consistent between observers and over time. More photographs were needed to obtain meshes of larger bommies, suggesting complete photographic coverage was more important than numbers of pictures. Measurement errors were present and partially explained by setting scale reference points and cropping bommies from their respective 3D meshes. The scale or type of measurement error did not differ between different coral morphotypes. These results suggest that the method presented in this study can be used to monitor coral reefs through precise measurements of reef characteristics.
The error margins measured in this study need to be placed in context to coral growth change rates to establish their efficacy. Depending on the species of coral, average growth rate can vary from ~5 to 30% total weight per year [46]. By comparison, and assuming the percent gained is analogous to the volume or surface area changes, our error margins of 15% and 12% for volume and surface area measurements sit in the middle of this range. This suggests that structure from motion would be unable to detect changes of massive/slow growing corals on an annual basis, but would most likely detect coral growth on a biennial measurement regime. Changes in coral volume and surface area of living corals impacted by disturbances, such as cyclones/hurricanes or bleaching events, are likely to change more than our measured error margins. Our methodology is, therefore, ideal for reef monitoring programs assessing at those temporal and spatial scales [47,48,49].
This is the first study to quantify measurement errors associated with the entire process of structure from motion in coral reef applications. Previous studies have used structure from motion techniques to obtain measurement data from coral reefs [12,36,37], and while some studies have quantified measurement error in relation to ‘true volume/surface area’ as determined by laser scanning or traditional methods [10,13], no attempt to verify whether the measurements obtained using structure from motion were reproducible until now. Volume and surface area are basic measurements, and the implications of this study should also apply to studies that assess rugosity or other structural characteristics using this technique [9,11,50].
Traditional methods of determining surface area or volume of coral require simple or complex geometrical analyses of individual coral colonies [51], or methods such as aluminium foil or paraffin wax coating (which can only be done ex situ), planar projection photography, 3D scanning [52], or spectrophotometry [53]. Comparing those techniques to ‘true’ measurements, as obtained by computer tomography (also requiring ex situ analysis), revealed that error margins of those techniques were much higher than that observed using structure from motion, and ranged from 0 to 900% depending on the technique and the morphotype [54]. Out of those methods, wax covering is the most accurate, where conversion factors can reduce measurement error to under 5% [55,56]. Wax covering can only be done ex situ, however, and is not applicable at ecologically-relevant scales. Comparably, structure from motion has low error margins relative to ‘true’ volume and surface area [12], yet allows in situ assessments of bommie volume and surface area (and presumably rugosity). The most similar study to ours is likely that of Bennecke et al. [13], which outlined potential error of up to 28% over eight years that resulted from the use of different or lower-quality cameras on measurements, or from inconsistent reference points. Since our study accounts for those two sources of error by having consistent reference points and cameras, our error estimations of up to 15% are more indicative of the optimal precision of structure from motion for these applications. It is likely that the wider availability of higher-resolution cameras (compared to the 12 megapixel sensor of GoPros) could reduce error margins further still.
Surprisingly, coral morphotype did not significantly affect the measurement error. This finding was contrary to previous studies [12,36], which generally found that higher measurement errors were apparent for branching coral morphotypes. It is possible that our small sample sizes and reliance on lagoon bommies led to this result. During our analyses, it became apparent that the branching corals were being ‘flattened’ to some degree, and the models produced were more like ‘spikey’ massive corals than true representations. This may have lowered the measurement error, despite not being true representations of the coral. While absolute inaccuracy is not ideal, the lack of significant difference suggests that structure from motion can still be used to monitor and compare branching coral morphotypes through time and space, as long as managers are aware that volume and surface area measurements are likely to be consistently overestimated or underestimated.
In summary, our results suggest that it should be possible to monitor coral reef health by obtaining successive chronological structure from motion surveys of a given bommie or reef. Once models are completed, they can be used to compare physical aspects of coral such as volume, proportion of surface area of living and/or dead coral, similarly to Burns et al. [50] or Ferrari et al. [9], while recognizing that changes that are lower than 15% for volumetric measurements and 12% for surface area measurements are likely due to structure from motion measurement errors and may not be indicative of true variation in the measurement.

4.1 Recommendations for Future Studies

To date, a range of software packages have been used to create 3D models of coral reefs, including 123D Catch [12,36], Agisoft Photoscan [8,11,37,50], and Visual SFM [57]. While 123D Catch and Visual SFM have the benefit of being open access and, thus, freely available for all to use, both have limitations when compared to Agisoft Photoscan. Autodesk 123D Catch has a 70 image limit whereas no software-side limit exists to the number of images that can be processed in Agisoft Photoscan or Visual SFM. The only limit for the latter two is that of the capacity of the operator’s hardware (i.e., 64 GB of RAM allows the reconstruction of models with over 1000 12MP images). While Visual SFM does not have this software limitation, it is not standalone software and requires additional 3D modelling tools for the same processes that the other two software packages can fulfil. Moreover, Visual SFM also requires additional software for any correction of lens distortion prior to analysis, thus making the process cumbersome, lengthy and at risk of substantial measurement error. In other research areas, Pix4D (a software suite similar to Agisoft Photoscan) has been popular, especially for UAV surveying [58,59]. We suggest that, at least for use in coral reefs, researchers use Agisoft Photoscan due to its more widespread adoption. Use of a single program would also give consistency across studies and allow direct comparison between results.
Although our research demonstrates that structure from motion is a viable measurement technique, there is the possibility of reducing the measurement errors recorded here. When using structure from motion, errors in surface area or volume measurements would be a result of errors in the placement of the point cloud on which the mesh is constructed or in geometric calculations [60,61], and the errors should be examined in that context. Inherent measurement errors from using Agisoft Photoscan were negligible (1.3 mm) relative to the size of the bommies that were measured (>1 m3), and are likely to be caused by user-end errors as the points used for creating a reference scale were placed manually: this error can be reduced by using a larger reference object. Cropping meshes for measuring is also manual and results in a relative error of ~2% of the total volume of the bommie. These two sources of error are unlikely to be solved in the near future and are, therefore, inherent measurement errors from using this technique. The rest of the measured error, or 9.4 and 7.8% for volume and surface area measurements respectively, is unexplained. Young et al. [14] found lower variation between fractal dimensions of structure from motion models (1–2%), however, they underline that their models had low height values and were re-creating small objects, whereas the bommies measured in this study were generally at least 30 cm high, and it is possible that fractal dimensions or rugosity is less prone to inter-model variation than surface area and volume. These error margins are possibly related to the resolution of the cameras, or their automatic light settings, and may be improved with the use of higher resolution cameras (some models now have 36 megapixel sensors) and either manual aperture settings or image post-processing. Future studies should aim to quantify and reduce the unexplained measurement error.
One measurement that can simply be improved is surface area. Using the ‘close mesh’ function in the Agisoft program to calculate volume and surface area would have created greater error for surface area measurements. We suggest that studies measuring surface area do not use the close mesh function. This error is made evident by the larger coefficient of variation in volume measurements compared to surface area measurements, as closing the mesh would cause greater volume error. To increase the accuracy of volume and surface area measurements, previous studies have added reference structures around the coral [12], though such methods are not practical for quantifying large bommies at ecologically-relevant scales. Surface area measurements do not require calculations of mesh closures and, therefore, should be more accurate than volume measurements, which require a degree of approximation from the software to create an enclosed object.
In some cases, it was not possible to create models of bommies that were surveyed during periods of intense sunlight, clear skies, and lower tide levels. This is counter-intuitive as one would expect such conditions to be ideal for structure from motion. The wave focusing caused by clear skies and lower tide levels, however, resulted in a lack of image alignment by Agisoft Photoscan due to rapid changes in colour. Higher turbidity, cloud cover, and depth are all factors that reduce this effect, and we recommend that this type of surveying be conducted in deeper waters, preferably on partially overcast days (though low light conditions may affect shutter speed and cause blurring of images). Since it is not possible to know whether images can be aligned until after fieldwork has been completed, this can be problematic. Post-fieldwork image analyses such as fluid lensing [31] may improve the success rate of such research, but the effects of post-processing on error margins are unknown. Previous research has identified the effects of weather and environmental conditions on image alignment and models [14] and is an area that warrants further research.

5. Conclusions

This study determined that structure from motion can be used as a coral reef monitoring tool over time and between different observers. While structure from motion has been used previously in coral reef studies, the potential effects of assessments performed by different observers and over time had never been assessed. Underwater structure from motion is likely to have lower accuracy for measurements due to a lack of GPS references available to improve image alignment relative to terrestrial or aerial studies that have such references available. Terrestrial and aerial studies should, therefore, also be able to monitor surface area and volume over time and between different observers, albeit with smaller error margins. Future studies should aim to assess the impacts of environmental variables on the accuracy and precision of models.

Acknowledgments

Many thanks to Kataya Barrett, Anthony Seward, and Alix Sylvester who helped conduct the bommie measurements. Thanks to the staff at Heron Island Research Station who facilitated this research. This research was conducted as part of a Master’s level research unit and funded by the Department of Biological Sciences and the Marine Ecology Group at Macquarie University.

Author Contributions

Vincent Raoult and Jane Williamson conceived and designed the experiment. Experiments were conducted by Vincent Raoult, Jane Williamson, Sarah Reid-Anderson, and Andreas Ferri. Vincent Raoult, Jane Williamson, Sarah Reid-Anderson, and Andreas Ferri conducted modelling and measurements. Vincent Raoult analysed the results. Vincent Raoult, Jane Williamson, and Sarah Reid-Anderson wrote the manuscript.

Conflicts of Interest

The authors declare no conflict of interest. The founding sponsors had no role in the design of the study; in the collection, analyses, or interpretation of data; in the writing of the manuscript, and in the decision to publish the results.

References

  1. Palumbi, S.R.; Barshis, D.J.; Traylor-Knowles, N.; Bay, R.A. Mechanisms of reef coral resistance to future climate change. Science 2014, 344, 895–898. [Google Scholar] [CrossRef] [PubMed]
  2. Pandolfi, J.M. Incorporating uncertainty in predicting the future response of coral reefs to climate change. Annu. Rev. Ecol. Evol. Syst. 2015, 46, 281–303. [Google Scholar] [CrossRef]
  3. Ainsworth, T.D.; Heron, S.F.; Ortiz, J.C.; Mumby, P.J.; Grech, A.; Ogawa, D.; Eakin, C.M.; Leggat, W. Climate change disables coral bleaching protection on the great barrier reef. Science 2016, 352, 338–342. [Google Scholar] [CrossRef] [PubMed]
  4. Lafratta, A.; Fromont, J.; Speare, P.; Schönberg, C. Coral bleaching in turbid waters of North-Western Australia. Mar. Freshw. Res. 2016, 68, 65–75. [Google Scholar] [CrossRef]
  5. Normile, D. El niño’s warmth devastating reefs worldwide. Science 2016, 352, 15–16. [Google Scholar] [CrossRef] [PubMed]
  6. Cinner, J.E.; Huchery, C.; MacNeil, M.A.; Graham, N.A.; McClanahan, T.R.; Maina, J.; Maire, E.; Kittinger, J.N.; Hicks, C.C.; Mora, C. Bright spots among the world’s coral reefs. Nature 2016, 535, 416–419. [Google Scholar] [CrossRef] [PubMed]
  7. Berkelmans, R.; Oliver, J. Large-scale bleaching of corals on the great barrier reef. Coral Reefs 1999, 18, 55–60. [Google Scholar] [CrossRef]
  8. Raoult, V.; David, P.A.; Dupont, S.F.; Mathewson, C.P.; O’Neill, S.J.; Powell, N.N.; Williamson, J.E. Gopros™ as an underwater photogrammetry tool for citizen science. PeerJ 2016, 4, e1960. [Google Scholar] [CrossRef] [PubMed]
  9. Ferrari, R.; Bryson, M.; Bridge, T.; Hustache, J.; Williams, S.B.; Byrne, M.; Figueira, W. Quantifying the response of structural complexity and community composition to environmental change in marine communities. Glob. Chang. Biol. 2016, 22, 1965–1975. [Google Scholar] [CrossRef] [PubMed]
  10. Figueira, W.; Ferrari, R.; Weatherby, E.; Porter, A.; Hawes, S.; Byrne, M. Accuracy and precision of habitat structural complexity metrics derived from underwater photogrammetry. Remote Sens. 2015, 7, 16883–16900. [Google Scholar] [CrossRef]
  11. Storlazzi, C.D.; Dartnell, P.; Hatcher, G.A.; Gibbs, A.E. End of the chain? Rugosity and fine-scale bathymetry from existing underwater digital imagery using structure-from-motion (sfm) technology. Coral Reefs 2016, 35, 889–894. [Google Scholar] [CrossRef]
  12. Lavy, A.; Eyal, G.; Neal, B.; Keren, R.; Loya, Y.; Ilan, M. A quick, easy and non-intrusive method for underwater volume and surface area evaluation of benthic organisms by 3D computer modelling. Methods Ecol. Evol. 2015, 6, 521–531. [Google Scholar] [CrossRef]
  13. Bennecke, S.; Kwasnitschka, T.; Metaxas, A.; Dullo, W.-C. In situ growth rates of deep-water octocorals determined from 3D photogrammetric reconstructions. Coral Reefs 2016, 35, 1227–1239. [Google Scholar] [CrossRef]
  14. Young, G.; Dey, S.; Rogers, A.; Exton, D. Cost and time-effective method for multi-scale measures of rugosity, fractal dimension, and vector dispersion from coral reef 3D models. PLoS ONE 2017, 12, e0175341. [Google Scholar] [CrossRef] [PubMed]
  15. Brown, A.L.; Carpenter, R.C. Water flow influences the mechanisms and outcomes of interactions between massive porites and coral reef algae. Mar. Biol. 2015, 162, 459–468. [Google Scholar] [CrossRef]
  16. Wheeler, S.; Robbins, W.; McIllwain, J. Reef sharks clean up with a novel inshore mutualistic interaction. Coral Reefs 2013, 32, 1089. [Google Scholar] [CrossRef]
  17. Poray, A.; Carpenter, R. Distributions of coral reef macroalgae in a back reef habitat in moorea, french polynesia. Coral Reefs 2014, 33, 67–76. [Google Scholar] [CrossRef]
  18. Graham, N.A.; Wilson, S.K.; Jennings, S.; Polunin, N.V.; Bijoux, J.P.; Robinson, J. Dynamic fragility of oceanic coral reef ecosystems. Proc. Natl. Acad. Sci. USA 2006, 103, 8425–8429. [Google Scholar] [CrossRef] [PubMed]
  19. Cocito, S.; Sgorbini, S.; Peirano, A.; Valle, M. 3-D reconstruction of biological objects using underwater video technique and image processing. J. Exp. Mar. Biol. Ecol. 2003, 297, 57–70. [Google Scholar] [CrossRef]
  20. Hoegh-Guldberg, O.; Williamson, J. Availability of two forms of dissolved nitrogen to the coral pocillopora damicornis and its symbiotic zooxanthellae. Mar. Biol. 1999, 133, 561–570. [Google Scholar] [CrossRef]
  21. Ferrari, R. The hidden structure in coral reefs. Coral Reefs 2017, 36, 445. [Google Scholar] [CrossRef]
  22. Lucieer, A.; Jong, S.M.D.; Turner, D. Mapping landslide displacements using structure from motion (sfm) and image correlation of multi-temporal UAV photography. Prog. Phys. Geogr. 2014, 38, 97–116. [Google Scholar] [CrossRef]
  23. Javernick, L.; Brasington, J.; Caruso, B. Modeling the topography of shallow braided rivers using structure-from-motion photogrammetry. Geomorphology 2014, 213, 166–182. [Google Scholar] [CrossRef]
  24. Wallace, L.; Lucieer, A.; Malenovský, Z.; Turner, D.; Vopěnka, P. Assessment of forest structure using two uav techniques: A comparison of airborne laser scanning and structure from motion (sfm) point clouds. Forests 2016, 7, 62. [Google Scholar] [CrossRef]
  25. Marteau, B.; Vericat, D.; Gibbins, C.; Batalla, R.J.; Green, D.R. Application of structure-from-motion photogrammetry to river restoration. Earth Surf. Process. Landf. 2017, 42, 503–515. [Google Scholar] [CrossRef]
  26. Mathews, A.J.; Jensen, J.L. Visualizing and quantifying vineyard canopy lai using an unmanned aerial vehicle (UAV) collected high density structure from motion point cloud. Remote Sens. 2013, 5, 2164–2183. [Google Scholar] [CrossRef]
  27. Morgenroth, J.; Gomez, C. Assessment of tree structure using a 3d image analysis technique—A proof of concept. Urban For. Urban Green. 2014, 13, 198–203. [Google Scholar] [CrossRef]
  28. Anderson, K.; Gaston, K.J. Lightweight unmanned aerial vehicles will revolutionize spatial ecology. Front. Ecol. Environ. 2013, 11, 138–146. [Google Scholar] [CrossRef]
  29. Mitra, A.; Castellani, C.; Gentleman, W.C.; Jónasdóttir, S.H.; Flynn, K.J.; Bode, A.; Halsband, C.; Kuhn, P.; Licandro, P.; Agersted, M.D. Bridging the gap between marine biogeochemical and fisheries sciences; configuring the zooplankton link. Prog. Oceanogr. 2014, 129, 176–199. [Google Scholar] [CrossRef]
  30. Ventura, D.; Bruno, M.; Lasinio, G.J.; Belluscio, A.; Ardizzone, G. A low-cost drone based application for identifying and mapping of coastal fish nursery grounds. Estuar. Coast. Shelf Sci. 2016, 171, 85–98. [Google Scholar] [CrossRef]
  31. Chirayath, V.; Earle, S.A. Drones that see through waves-preliminary results from airborne fluid lensing for centimetre-scale aquatic conservation. Aquat. Conserv. Mar. Freshw. Ecosyst. 2016, 26, 237–250. [Google Scholar] [CrossRef]
  32. Smith, M.; Carrivick, J.; Quincey, D. Structure from motion photogrammetry in physical geography. Prog. Phys. Geor. 2016, 40, 247–275. [Google Scholar] [CrossRef]
  33. Georgiou, L.; Falter, J.; Trotter, J.; Kline, D.I.; Holcomb, M.; Dove, S.G.; Hoegh-Guldberg, O.; McCulloch, M. pH homeostasis during coral calcification in a free ocean CO2 enrichment (foce) experiment, heron island reef flat, great barrier reef. Proc. Natl. Acad. Sci. USA 2015, 112, 13219–13224. [Google Scholar] [CrossRef] [PubMed]
  34. Kline, D.I.; Teneva, L.; Schneider, K.; Miard, T.; Chai, A.; Marker, M.; Headley, K.; Opdyke, B.; Nash, M.; Valetich, M. A short-term in situ CO2 enrichment experiment on heron island (GBR). Sci. Rep. 2012, 2, 413. [Google Scholar] [CrossRef] [PubMed]
  35. Williamson, J.E.; Byrnes, E.E.; Clark, J.A.; Connolly, D.M.; Schiller, S.E.; Thompson, J.A.; Tosetto, L.; Martinelli, J.C.; Raoult, V. Ecological impacts and management implications of reef walking on a tropical reef flat community. Mar. Pollut. Bull. 2017, 114, 742–750. [Google Scholar] [CrossRef] [PubMed]
  36. Gutierrez-Heredia, L.; Benzoni, F.; Murphy, E.; Reynaud, E.G. End to end digitisation and analysis of three-dimensional coral models, from communities to corallites. PLoS ONE 2016, 11, e0149641. [Google Scholar] [CrossRef] [PubMed]
  37. Leon, J.X.; Roelfsema, C.M.; Saunders, M.I.; Phinn, S.R. Measuring coral reef terrain roughness using ‘structure-from-motion’close-range photogrammetry. Geomorphology 2015, 242, 21–28. [Google Scholar] [CrossRef]
  38. Burns, J.; Delparte, D.; Gates, R.; Takabayashi, M. Integrating structure-from-motion photogrammetry with geospatial software as a novel technique for quantifying 3D ecological characteristics of coral reefs. PeerJ 2015, 3, e1077. [Google Scholar] [CrossRef] [PubMed]
  39. Burns, J.; Delparte, D.; Gates, R.; Takabayashi, M. Utilizing underwater three-dimensional modeling to enhance ecological and biological studies of coral reefs. Int. Arch. Photogramm. Remote Sens. Spat. Inf. Sci. 2015, 40, 61. [Google Scholar] [CrossRef]
  40. Fonstad, M.A.; Dietrich, J.T.; Courville, B.C.; Jensen, J.L.; Carbonneau, P.E. Topographic structure from motion: A new development in photogrammetric measurement. Earth Surf. Process. Landf. 2013, 38, 421–430. [Google Scholar] [CrossRef]
  41. Bland, J.M.; Altman, D.G. Statistics notes: Measurement error proportional to the mean. BMJ 1996, 313, 106. [Google Scholar] [CrossRef] [PubMed]
  42. Scheipl, F.; Greven, S.; Kuechenhoff, H. Size and power of tests for a zero random effect variance or polynomial regression in additive and linear mixed models. Comput. Stat. Data Anal. 2008, 52, 3283–3299. [Google Scholar] [CrossRef]
  43. Wickham, H. Ggplot2: Elegant Graphics for Data Analysis; Springer: New York, NY, USA, 2009. [Google Scholar]
  44. Manzello, D.P.; Enochs, I.C.; Kolodziej, G.; Carlton, R. Coral growth patterns of montastraea cavernosa and porites astreoides in the florida keys: The importance of thermal stress and inimical waters. J. Exp. Mar. Biol. Ecol. 2015, 471, 198–207. [Google Scholar] [CrossRef]
  45. Lirman, D.; Schopmeyer, S.; Galvan, V.; Drury, C.; Baker, A.C.; Baums, I.B. Growth dynamics of the threatened caribbean staghorn coral acropora cervicornis: Influence of host genotype, symbiont identity, colony size, and environmental setting. PLoS ONE 2014, 9, e107253. [Google Scholar] [CrossRef] [PubMed]
  46. Buddemeier, R.W.; Maragos, J.E.; Knutson, D.W. Radiographic studies of reef coral exoskeletons: Rates and patterns of coral growth. J. Exp. Mar. Biol. Ecol. 1974, 14, 179–199. [Google Scholar] [CrossRef]
  47. Hughes, T.P. Catastrophes, phase shifts, and large-scale degradation of a caribbean coral reef. Sci. AAAS Wkly. Pap. Ed. 1994, 265, 1547–1551. [Google Scholar] [CrossRef] [PubMed]
  48. Van Woesik, R.; De Vantier, L.; Glazebrook, J. Effects of cyclone‘joy’on nearshore coral communities of the great barrier reef. Mar. Ecol. Prog. Ser. 1995, 128, 261–270. [Google Scholar] [CrossRef]
  49. Vega Thurber, R.L.; Burkepile, D.E.; Fuchs, C.; Shantz, A.A.; McMinds, R.; Zaneveld, J.R. Chronic nutrient enrichment increases prevalence and severity of coral disease and bleaching. Glob. Chang. Biol. 2014, 20, 544–554. [Google Scholar] [CrossRef] [PubMed]
  50. Burns, J.; Delparte, D.; Kapono, L.; Belt, M.; Gates, R.; Takabayashi, M. Assessing the impact of acute disturbances on the structure and composition of a coral community using innovative 3D reconstruction techniques. Methods Oceanogr. 2016, 15–16, 49–59. [Google Scholar] [CrossRef]
  51. Holmes, G.; Ortiz, J.; Kaniewska, P.; Johnstone, R. Using three-dimensional surface area to compare the growth of two pocilloporid coral species. Mar. Biol. 2008, 155, 421–427. [Google Scholar] [CrossRef]
  52. Reichert, J.; Schellenberg, J.; Schubert, P.; Wilke, T. 3D scanning as a highly precise, reproducible, and minimally invasive method for surface area and volume measurements of scleractinian corals. Limnol. Oceanogr. Methods 2016, 14, 518–526. [Google Scholar] [CrossRef]
  53. Hoegh-Guldberg, O. A method for determining the surface area of corals. Coral Reefs 1988, 7, 113–116. [Google Scholar] [CrossRef]
  54. Naumann, M.S.; Niggl, W.; Laforsch, C.; Glaser, C.; Wild, C. Coral surface area quantification–evaluation of established techniques by comparison with computer tomography. Coral Reefs 2009, 28, 109–117. [Google Scholar] [CrossRef]
  55. Holmes, G. Estimating three-dimensional surface areas on coral reefs. J. Exp. Mar. Biol. Ecol. 2008, 365, 67–73. [Google Scholar] [CrossRef]
  56. Veal, C.; Carmi, M.; Fine, M.; Hoegh-Guldberg, O. Increasing the accuracy of surface area estimation using single wax dipping of coral fragments. Coral Reefs 2010, 29, 893–897. [Google Scholar] [CrossRef]
  57. Agudo-Adriani, E.A.; Cappelletto, J.; Cavada-Blanco, F.; Croquer, A. Colony geometry and structural complexity of the endangered species acropora cervicornis partly explains the structure of their associated fish assemblage. PeerJ 2016, 4, e1861. [Google Scholar] [CrossRef] [PubMed]
  58. Bollard-Breen, B.; Brooks, J.D.; Matthew, R.; Jones, L.; Robertson, J.; Betschart, S.; Kung, O.; Cary, S.C.; Lee, C.K.; Pointing, S.B. Application of an unmanned aerial vehicle in spatial mapping of terrestrial biology and human disturbance in the mcmurdo dry valleys, east antarctica. Polar Biol. 2015, 38, 573. [Google Scholar] [CrossRef]
  59. Zainuddin, K.; Jaffri, M.; Zainal, M.; Ghazali, N.; Samad, A. Verification test on ability to use low-cost uav for quantifying tree height. In Proceedings of the 2016 IEEE 12th International Colloquium on Signal Processing & Its Applications (CSPA), Malacca City, Malaysia, 4–6 March 2016; pp. 317–321. [Google Scholar]
  60. Surový, P.; Yoshimoto, A.; Panagiotidis, D. Accuracy of reconstruction of the tree stem surface using terrestrial close-range photogrammetry. Remote Sens. 2016, 8, 123. [Google Scholar] [CrossRef]
  61. Harwin, S.; Lucieer, A. Assessing the accuracy of georeferenced point clouds produced via multi-view stereopsis from unmanned aerial vehicle (UAV) imagery. Remote Sens. 2012, 4, 1573–1599. [Google Scholar] [CrossRef]
Figure 1. Simplified measurement pipeline with Agisoft Photoscan Professional, from image alignment to volume and surface area measurements. The model can be viewed and manipulated online at https://skfb.ly/6n6Hy.
Remotesensing 09 00740 g001
Figure 2. Measurements resulting from successive manual cropping of (A) volume and (B) surface area of a single mesh constructed once for three bommies.
Remotesensing 09 00740 g002
Figure 3. Mean (A) volume and (B) surface area ± 95% CI for the bommies used to compare observer effects. Bommies sorted according to mean volume and surface area, respectively.
Remotesensing 09 00740 g003
Figure 4. Mean (A) volume and (B) surface area ± 95% CI for three bommies measured four separate times over five days.
Remotesensing 09 00740 g004
Figure 5. Relationship between the number of photographs taken and the deviation from the mean (A) volume and (B) surface area of measured bommies (n = 9). The shaded area represents 95% confidence interval of linear regression (black line).
Remotesensing 09 00740 g005
Figure 6. Summary of explained and unexplained measurement error for volume and surface area measurements of structures using structure from motion.
Remotesensing 09 00740 g006
Table 1. Measurement matrix (in mm), standard deviation, and proportion of error of reference weight measurements used in this study.
Weight True MeasurementReference Weight 1Reference Weight 2Reference Weight 3Reference Weight 4Standard DeviationProportion of Error
150.00 51.9449.3649.301.510.03
255.0052.95 52.2652.200.410.01
354.0054.7156.83 53.941.500.03
454.0054.7756.8954.06 1.470.03
Mean1.220.02

