Transferability of Economy Estimation Based on DMSP/OLS Night-Time Light

1
College of Engineering, Peking University, Beijing 100871, China
2
College of Urban and Environmental Sciences, Peking University, Beijing 100871, China
*
Author to whom correspondence should be addressed.
Remote Sens. 2017, 9(8), 786; https://0-doi-org.brum.beds.ac.uk/10.3390/rs9080786
Submission received: 29 May 2017
/
Revised: 14 July 2017
/
Accepted: 28 July 2017
/
Published: 31 July 2017
(This article belongs to the Special Issue Recent Advances in Remote Sensing with Nighttime Lights)
Abstract
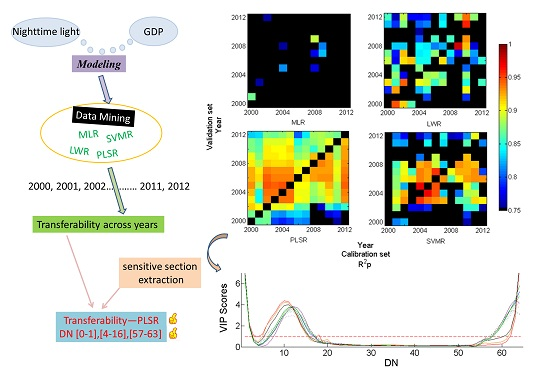
:Despite the fact that economic data are of great significance in the assessment of human socioeconomic development, the application of this data has been hindered partly due to the unreliable and inefficient economic censuses conducted in developing countries. The night-time light (NTL) imagery from the Defense Meteorological Satellite Program’s Operational Linescan System (DMSP/OLS) provides one of the most important ways to evaluate an economy with low cost and high efficiency. However, little research has addressed the transferability of the estimation across years. Based on the entire DN series from 0 to 63 of NTL data and GDP data in 31 provinces of mainland China from 2000 to 2012, this paper aims to study the transferability of economy estimation across years, with four linear and non-linear data mining methods, including the Multiple Linear Regression (MLR), Local Weighted Regression (LWR), Partial Least Squares Regression (PLSR), and Support Vector Machine Regression (SVMR). We firstly built up the GDP estimation model based on the NTL data in each year with each method respectively, then applied each model to the other 12 years for the evaluation of the time series transferability. Results revealed that the performances of models differ greatly across years and methods: PLSR (mean of ) and SVMR (mean of ) are superior to MLR (mean of ) and LWR (mean of ) for model calibration; only PLSR (mean of , mean of ) holds a strong transferability among different years; the frequency of three DN sections of (0–1), (4–16), and (57–63) are especially important for economy estimation. Such results are expected to provide a more comprehensive understanding of the NTL, which can be used for economy estimation across years.

1. Introduction
Regional and global economic data are important indicators of the assessment of human societal development, and most countries conduct economic censuses every year for the evaluation of national economy strength [1]. However, problems may occur in the case that the statistical data are not available in some places. Furthermore, the economic census always requires a long period of time with low efficiency and high costs, which is especially serious in developing countries with weak government statistical infrastructure [2]. These problems have hindered the understanding of the real status of the economy. Therefore, surveying the economy by technical methods is of great significance as an alternative supplementation to the traditional economic census [3].
With the rapid development of science and technology, remote sensing has gradually gained attention, which is an efficient approach for the observation of earth on a global scale based on the optical images from the satellite sensors in the outer space. It can also provide us with a real-time mirror of the human activities and the socioeconomic status, making it relatively cheaper and far more efficient than the traditional economic census. Thus, surveying the regional or global economy with remote-sensing technology has been a hotspot in this field in recent years [4,5]. Meanwhile, the most widely used remotely-sensed data source for economy investigation is the night-time light (NTL) imagery from the Defense Meteorological Satellite Program’s Operational Linescan System (DMSP/OLS). The stable NTL data mainly contains the lights from cities, towns, and other facilities with persistent lighting with occasional noise removed, such as fire, or sunlight, moonlight, aurora, and cloud impact [6]. The digital number (DN) value of the stable NTL data ranges from 1 to 63 according to the annual average light intensity, with 0 representing the background or ephemeral lighting [7]. With a reasonable temporal coverage on a global scale since 1992 [8,9], the NTL has a great advantage in revealing the distribution and quality of the human activities that are closely associated with economy status.
An early study by Elvidge et al. [10] found a strong correlation between NTL luminosity and the Gross Domestic Product (GDP). After this, a wealth of research has confirmed similar principles in different areas. For example, Ma et al. [11] presented the responses to socioeconomic activity and the potential utility of NTL data by investigating the quantitative correspondence between them. This study [11] found that NTL data was strongly correlated with GDP. Bustos et al. [12] used a regression analysis to examine the links between NTL and the change in socioeconomic indicators over time in Europe, which suggested that the extent of human settlement was closely related to the GDP. Various light indexes were proposed for regression or calibration with the socioeconomic indicators, such as the TNL (total night-time light) [1], SOL (sum of light) [13,14], AL (area lit) [15,16], NTM (night light mean), NTSD (night light standard deviation), PTNL (proportion of total night light) [17], ULI (urban light index) [18], CNLI (compounded night light index) [19] and so on. However, there may be three issues to consider in the previous studies. Firstly, these extractions of the NTL data and the formation of the light indexes may bring risks due to the loss of the majority of the information from the original data and the generation of second-hand data for analysis. As the light indexes could only contain segmental features of the NTL from particular aspects, they do not make full use of the NTL data, which has an entire DN series that ranges from 0 to 63. Secondly, the majority of studies preferred to use linear regressions (including the log-linear relationship) for the lights–economy model [5,10]. Bickenbach et al. [20] found a non-linear relation between night-time lights and economic status, which was ascribed to the censored nature of the night lights. Nonetheless, only a few studies have tried to build up a non-linear regression between these two variables to ensure the coverage of complex features of the data. Thirdly, a considerable number of studies focused on the relationship between NTL and economy in a specific year and discussed the transferability between regions of different scales [21,22], but little research has addressed the transferability between years. Nordhaus et al. [23] analyzed the time series errors in the estimation of NTL as a proxy for economy, but the exploration of a universal model that can be used for different years still remains a difficult challenge.
The objective of this study was to explore the possibility of establishing a transferable economy estimation model across multiple years with different data-mining methods, based on the DMSP/OLS night-time light data from 2000 to 2012. In this case, the frequency table of the entire DN series from 0 to 63 was adopted to form 64 independent variables, which might help us make better use of the full information from the NTL data. This made a closer approximation of the original lights with in the advantage of being able to deeply excavate the inner relationship between the lights and economy (the dependent variable). Both linear and non-linear data-mining methods were taken into consideration, including the Multiple Linear Regression (MLR), Local Weighted Regression (LWR), Partial Least Squares Regression (PLSR), and Support Vector Machine Regression (SVMR). A comparison of the modeling performances of these different methods was conducted. Furthermore, the estimation model from a single year with a single method was applied to the other 12 years for the evaluation of the time series transferability. The performance of each model transfer was analyzed in detail. From this analysis, we will be able to obtain a clear view of the capability of these four methods to establish a transferable economy estimation model across years.
2. Data and Methods
2.1. Data Sources and Preprocessing
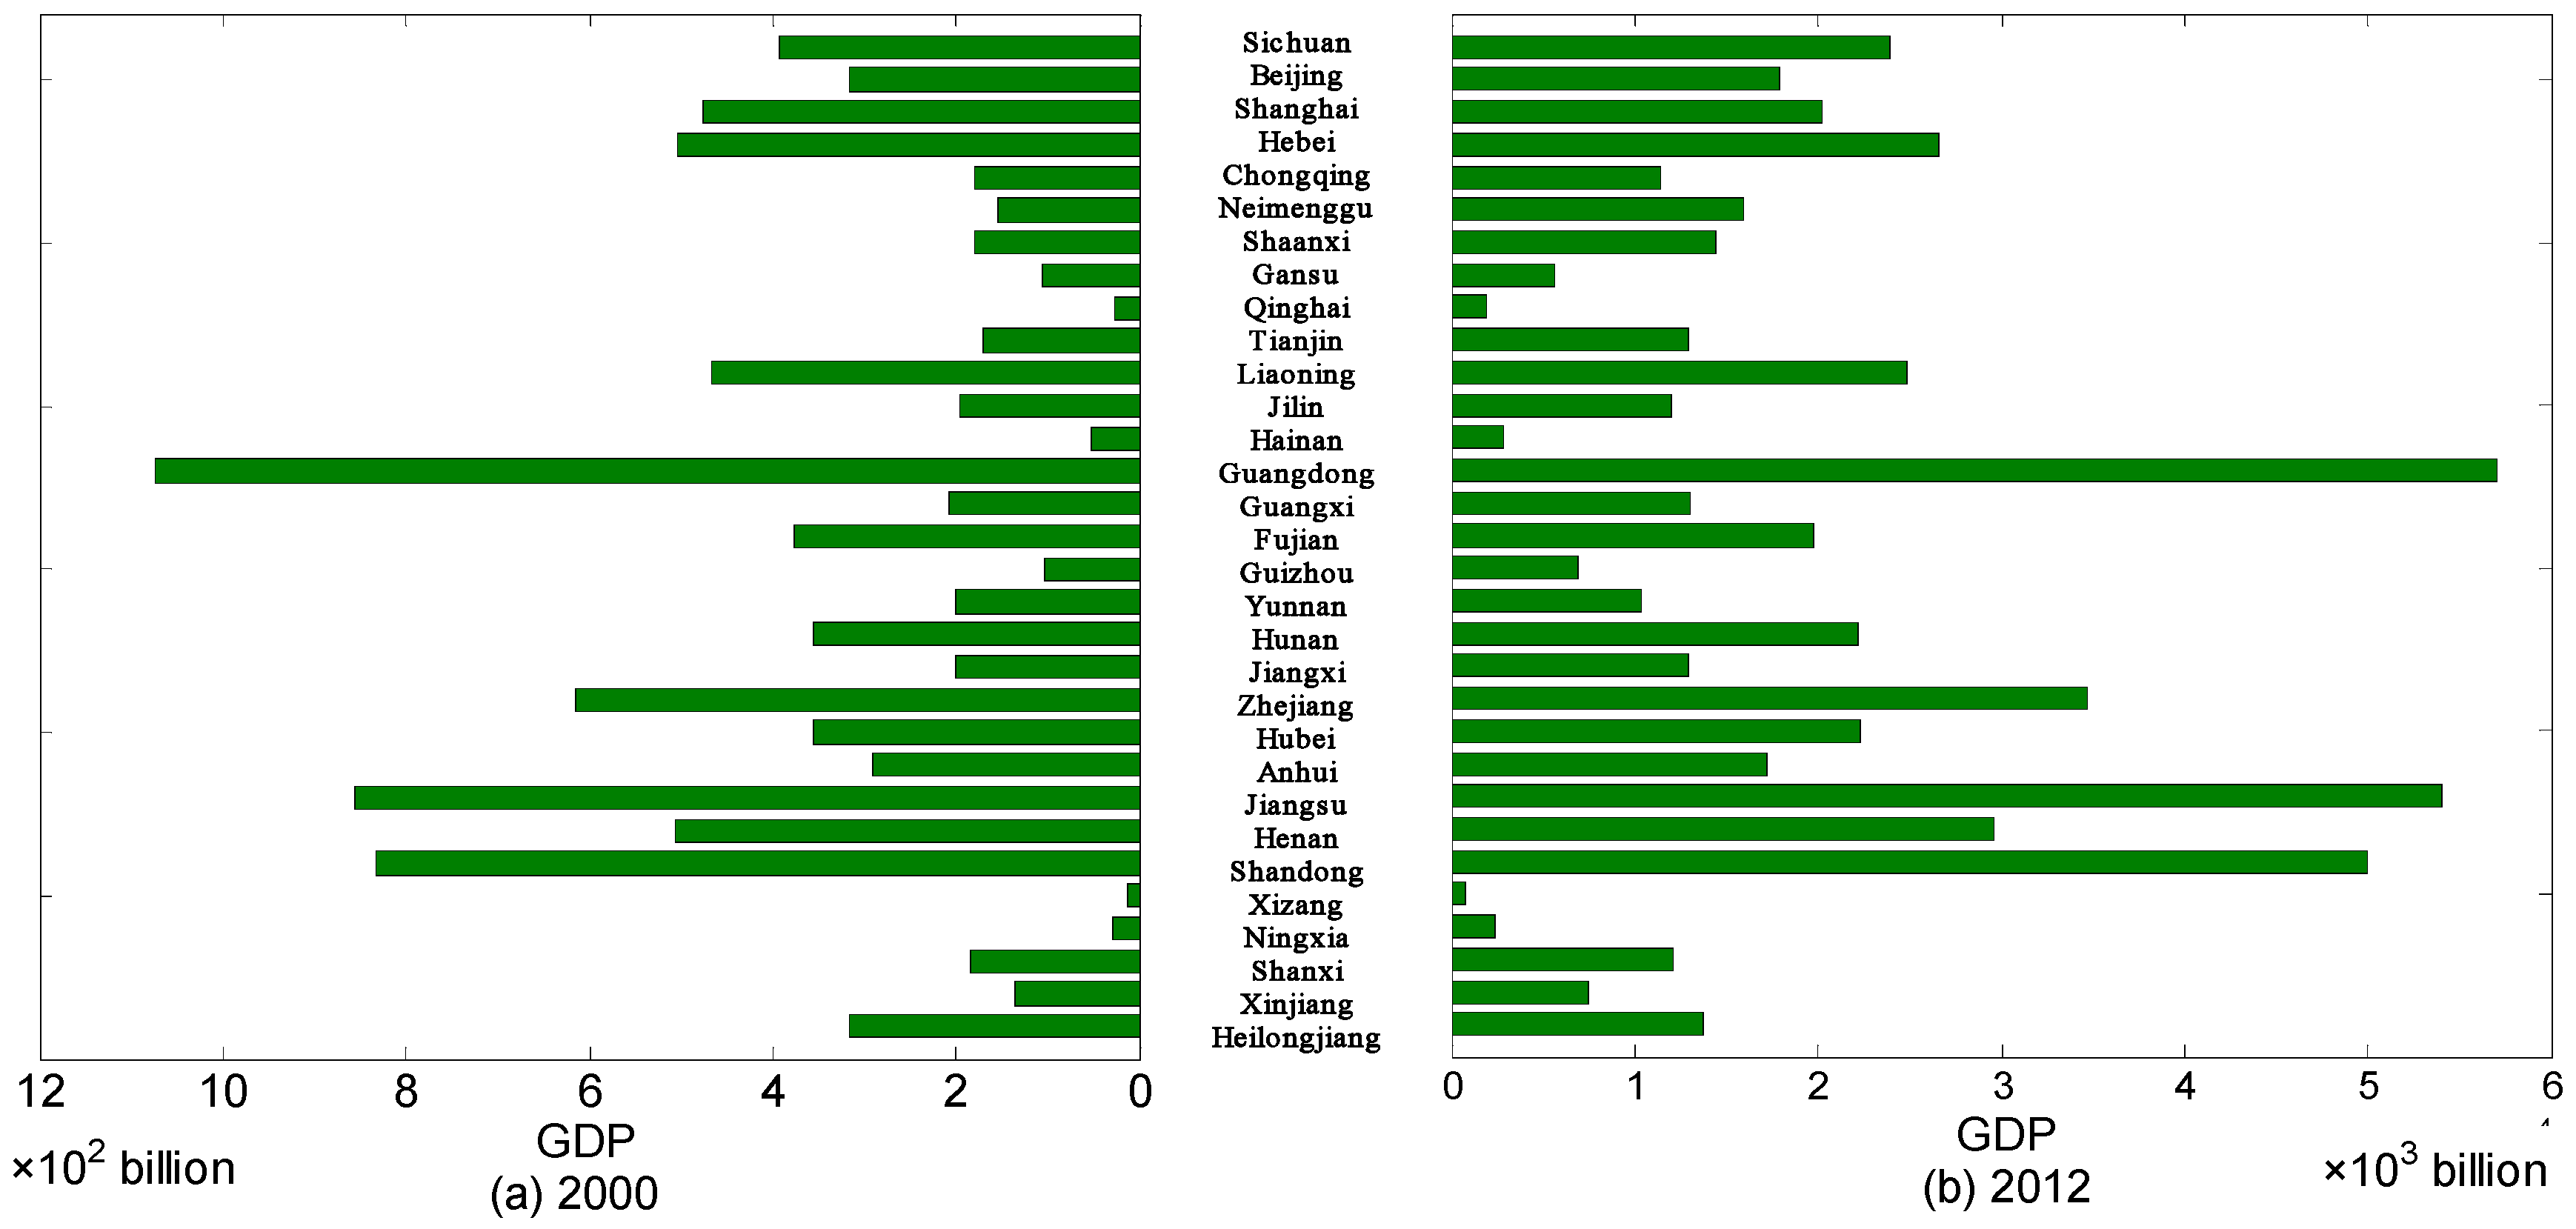
The economic data of China was derived from the National Bureau of Statistics (http://data. stats.gov.cn/). The GDP data of 31 mainland provinces (except for Hong Kong, Macau, and Taiwan) from 2000 to 2012 were used in this paper. The Chinese currency unit of the GDP is Yuan. Figure 1 shows the distribution of GDP in 2000 and 2012.
The annual stable night-time light data from 2000 to 2012 of China were obtained from the National Oceanic and Atmospheric Administration (NOAA) of the National Centers for Environmental Information (NCEI) website (http://ngdc.noaa.gov/eog/dmsp/downloadV4composit es.html). It was collected by the Air Force Weather Agency (AFWA) and then processed by NOAA to constitute 30 geographic grids, which cover the majority of the surface of the earth except for the high latitude regions.
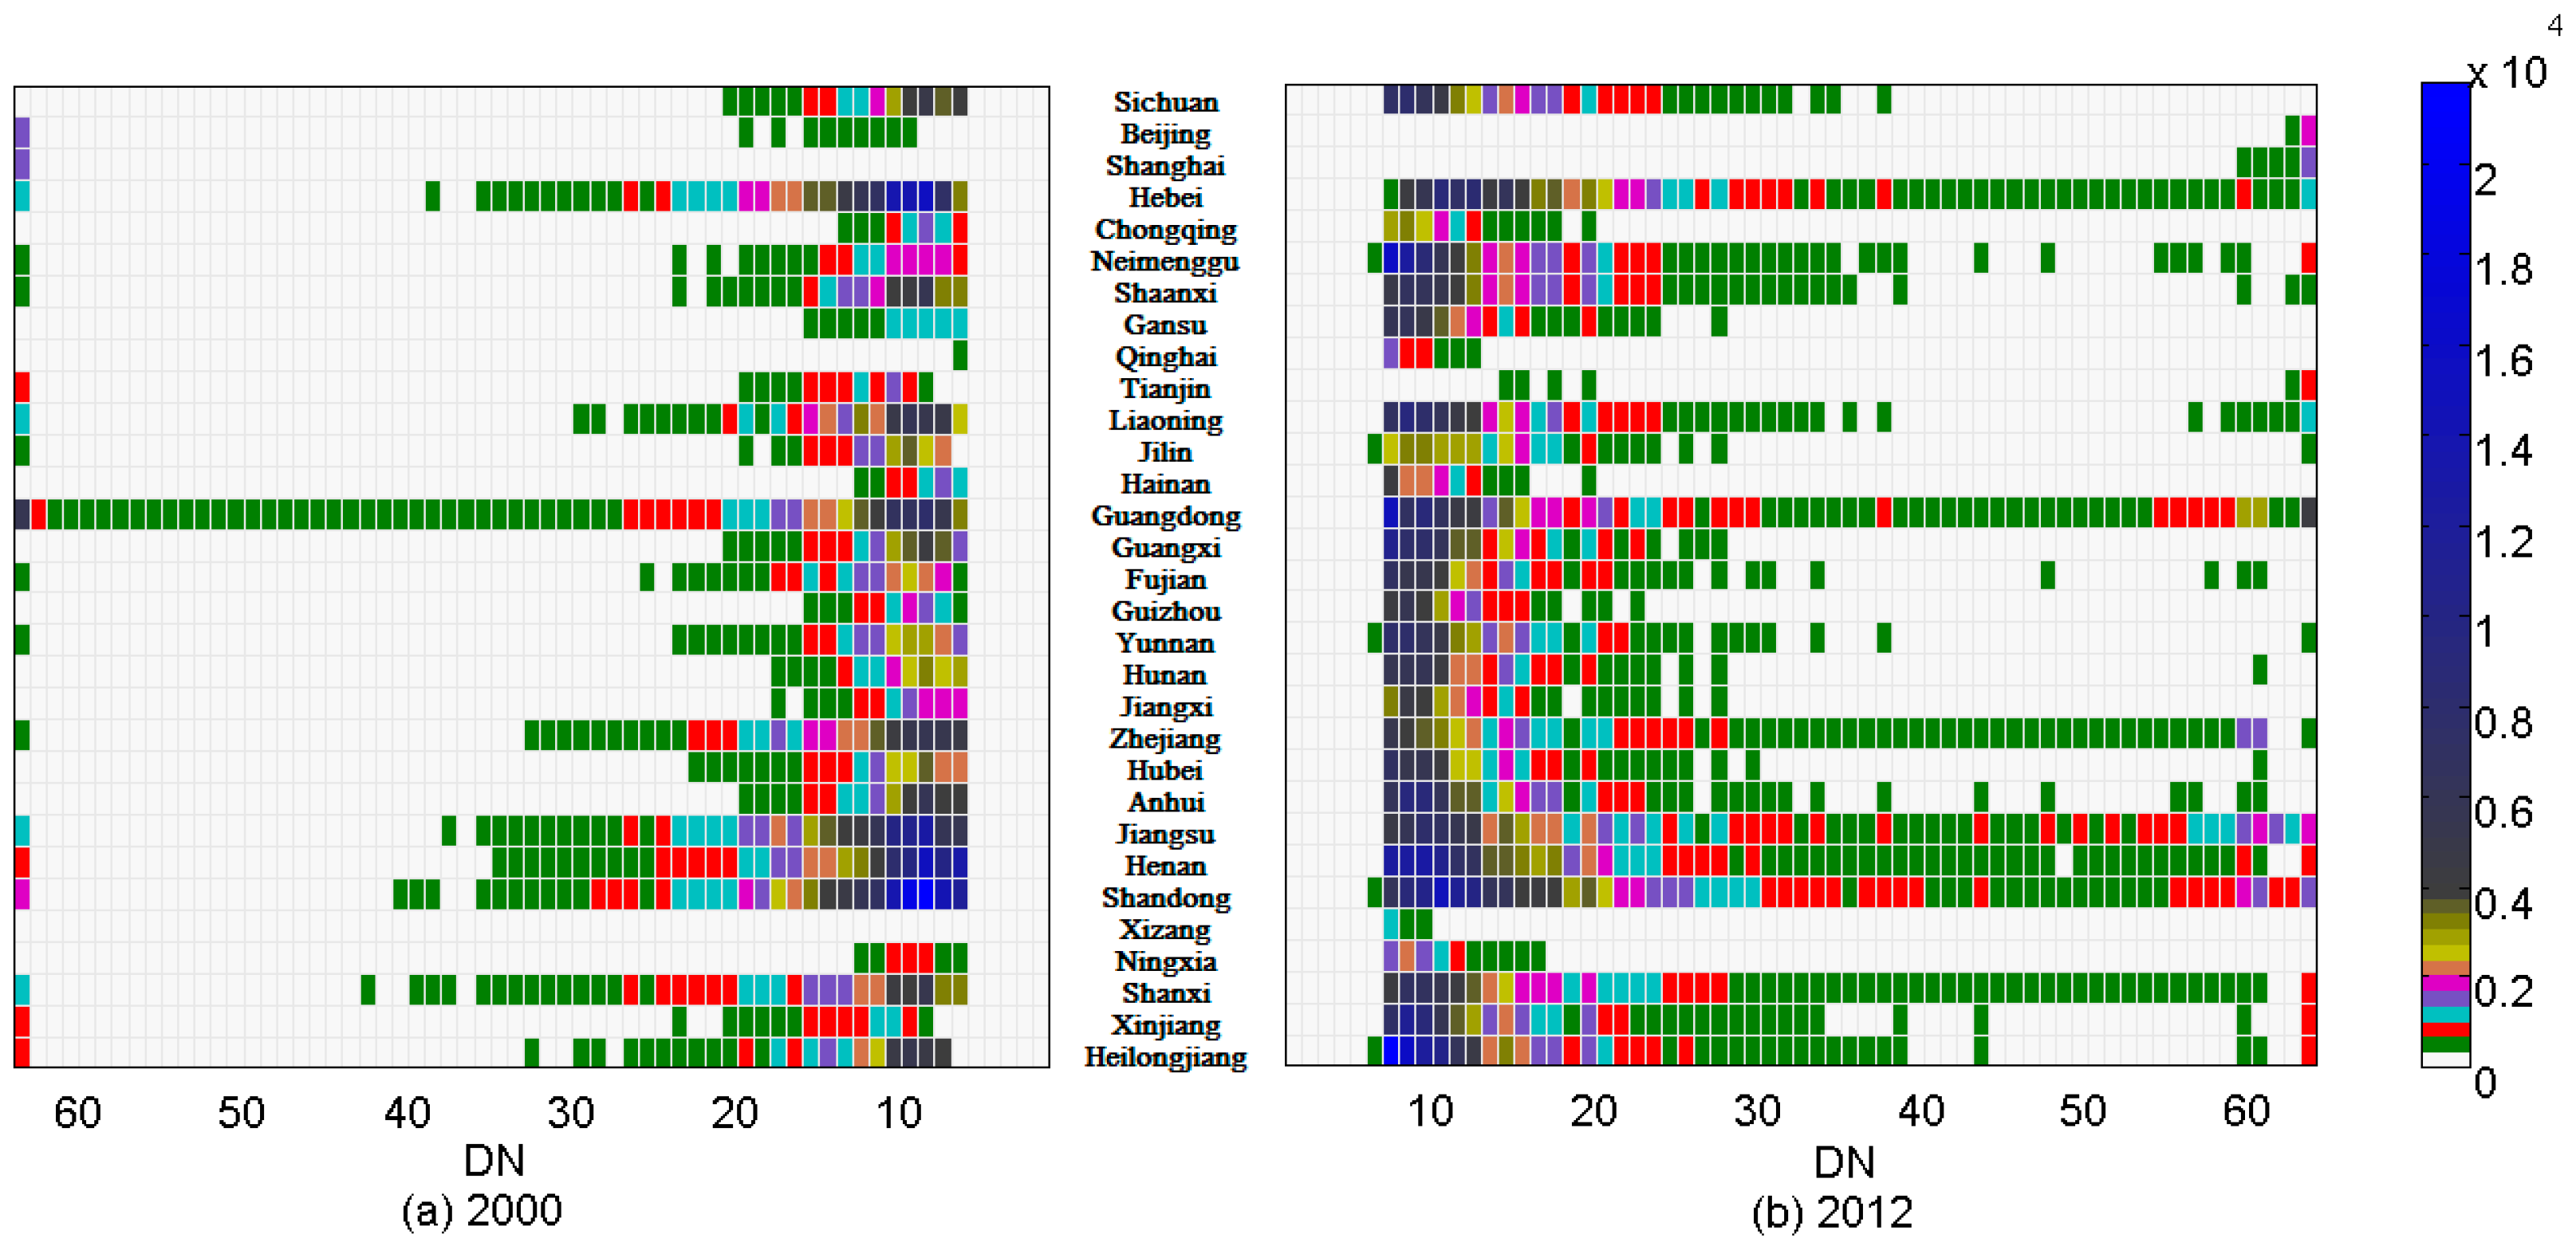
With the aim to fully utilize night-time light for data mining, we created a workflow to preprocess the data, which involves the following steps: (1) project the NTL data to the Lambert Azimuthal Equal Area projection for map matching [24]; (2) improve the continuity and comparability of the NTL data with systematic correction carried out according to the method proposed by Liu [25], which involved steps of intercalibration, intra-annual composition, interannual series correction, and so on; (3) extract NTL imagery for each province of each year according to the Chinese administrative boundary; and (4) conduct a count for each DN value from 0 to 63 in the imagery from each province in order to create the frequency table of the entire DN series. Figure 2 shows the results of 2000 and 2012, where the frequency number within (0, 340) was colored white, (341, 680) was colored green, (681, 1020) was colored red, and so on. It is important to note that the frequency number for DN 0 was out of the color bars and thus, was not displayed.
2.2. Data Mining Methods
For the multiple linear regression (MLR), as one phenomenon may be often interpreted by a series of factors, it will be much more effective to predict the dependent variable with an optimal combination of multiple variables, which is why it is MLR. In this case, the frequencies of the entire DN series from 0 to 63 were adopted to estimate GDP with MLR in order to fully utilize the entire information contained in the NTL data. The calibration mechanism is more sophisticated than the previous Simple Linear Regression (SLR) with the added advantage of being able to deeply excavate the inner connection between the NTL data and GDP.
Local weighted regression (LWR) is proposed as a solution for the problem of a linear regression occasionally being able to underfit results and not exactly matching the true distribution of the data. This method allows the data analyst to not need to specify a universal model to fit all the GDP data of 31 provinces as it only aims to fit each subset of the data separately. It is obvious that the LWR combines much of the simplicity of linear regressions with the flexibility of non-linear regressions [26], which is more accurate for data fitting in the consideration of the regional differences among provinces.
The partial least squares regression (PLSR) was first proposed by Wold et al. [27], who used a multivariate statistical analysis algorithm to form this linear regression by projecting the dependent variable and independent variables to a new space. Following this, regression modeling, data simplification, and correlation analysis were conducted simultaneously [28]. Furthermore, PLSR can effectively overcome the multicollinearity within the NTL data and remains suitably applicable even in the case where the number of samples (31 provinces) are less than that of variables (64 DN variables) [29]. Therefore, it has the potential to produce results of high quality.
The support vector machine regression (SVMR) can establish a non-linear model, which uses supervised learning algorithms for regression analysis. By optimizing the support vector regression machine, SVMR tries to find the optimal function for approximating the relationship between variables. In this case, complicated problems are transformed into a search for the optimal function by the sample data [30]. Few studies have attempted to use this advanced non-linear method for the NTL data and thus, the capacity of SVMR will be explored in this paper.
The frequency table of the entire DN series from 0 to 63 was adopted to estimate GDP with the above-mentioned four data mining methods, according to Equation (1).
where and . is the Gross Domestic Product of province in year ; () is the frequency number when the DN value is in the frequency table of province in year ; and is the estimating model for all the 31 provinces in year .
2.3. Model Evaluation
The performance of modeling was evaluated by the coefficient of determination of cross validation . The performance of predicting of the model was evaluated by the coefficient of determination of prediction and the residual prediction deviation [31]. and are commonly used for modeling and are calculated by Equation (2).
where and are the measured and predicted values of sample ; and is the mean of measured values. In cross validation, indicates the fit level of the model with original data set. In prediction, indicates the fit level of the model with new data set. To differ from them, the former is named and the latter is named . The highest indicates the best model for regression and for predicting, a higher indicates a better accuracy.
As for , it is used to investigate the prediction error with variation in the data [32], which is calculated by Equation (3).
where is the standard deviation of measured values and is the root mean square error for the prediction. We adopted the six-level interpretations of as provided by Rossel [33]: for excellent predictions; for very good predictions; for good predictions where quantitative predictions are possible; for fair predictions, which may be used for assessment and correlation; for poor predictions where only high and low values are distinguishable; and for very poor predictions, their use is not recommended.
3. Results
3.1. Model Calibration
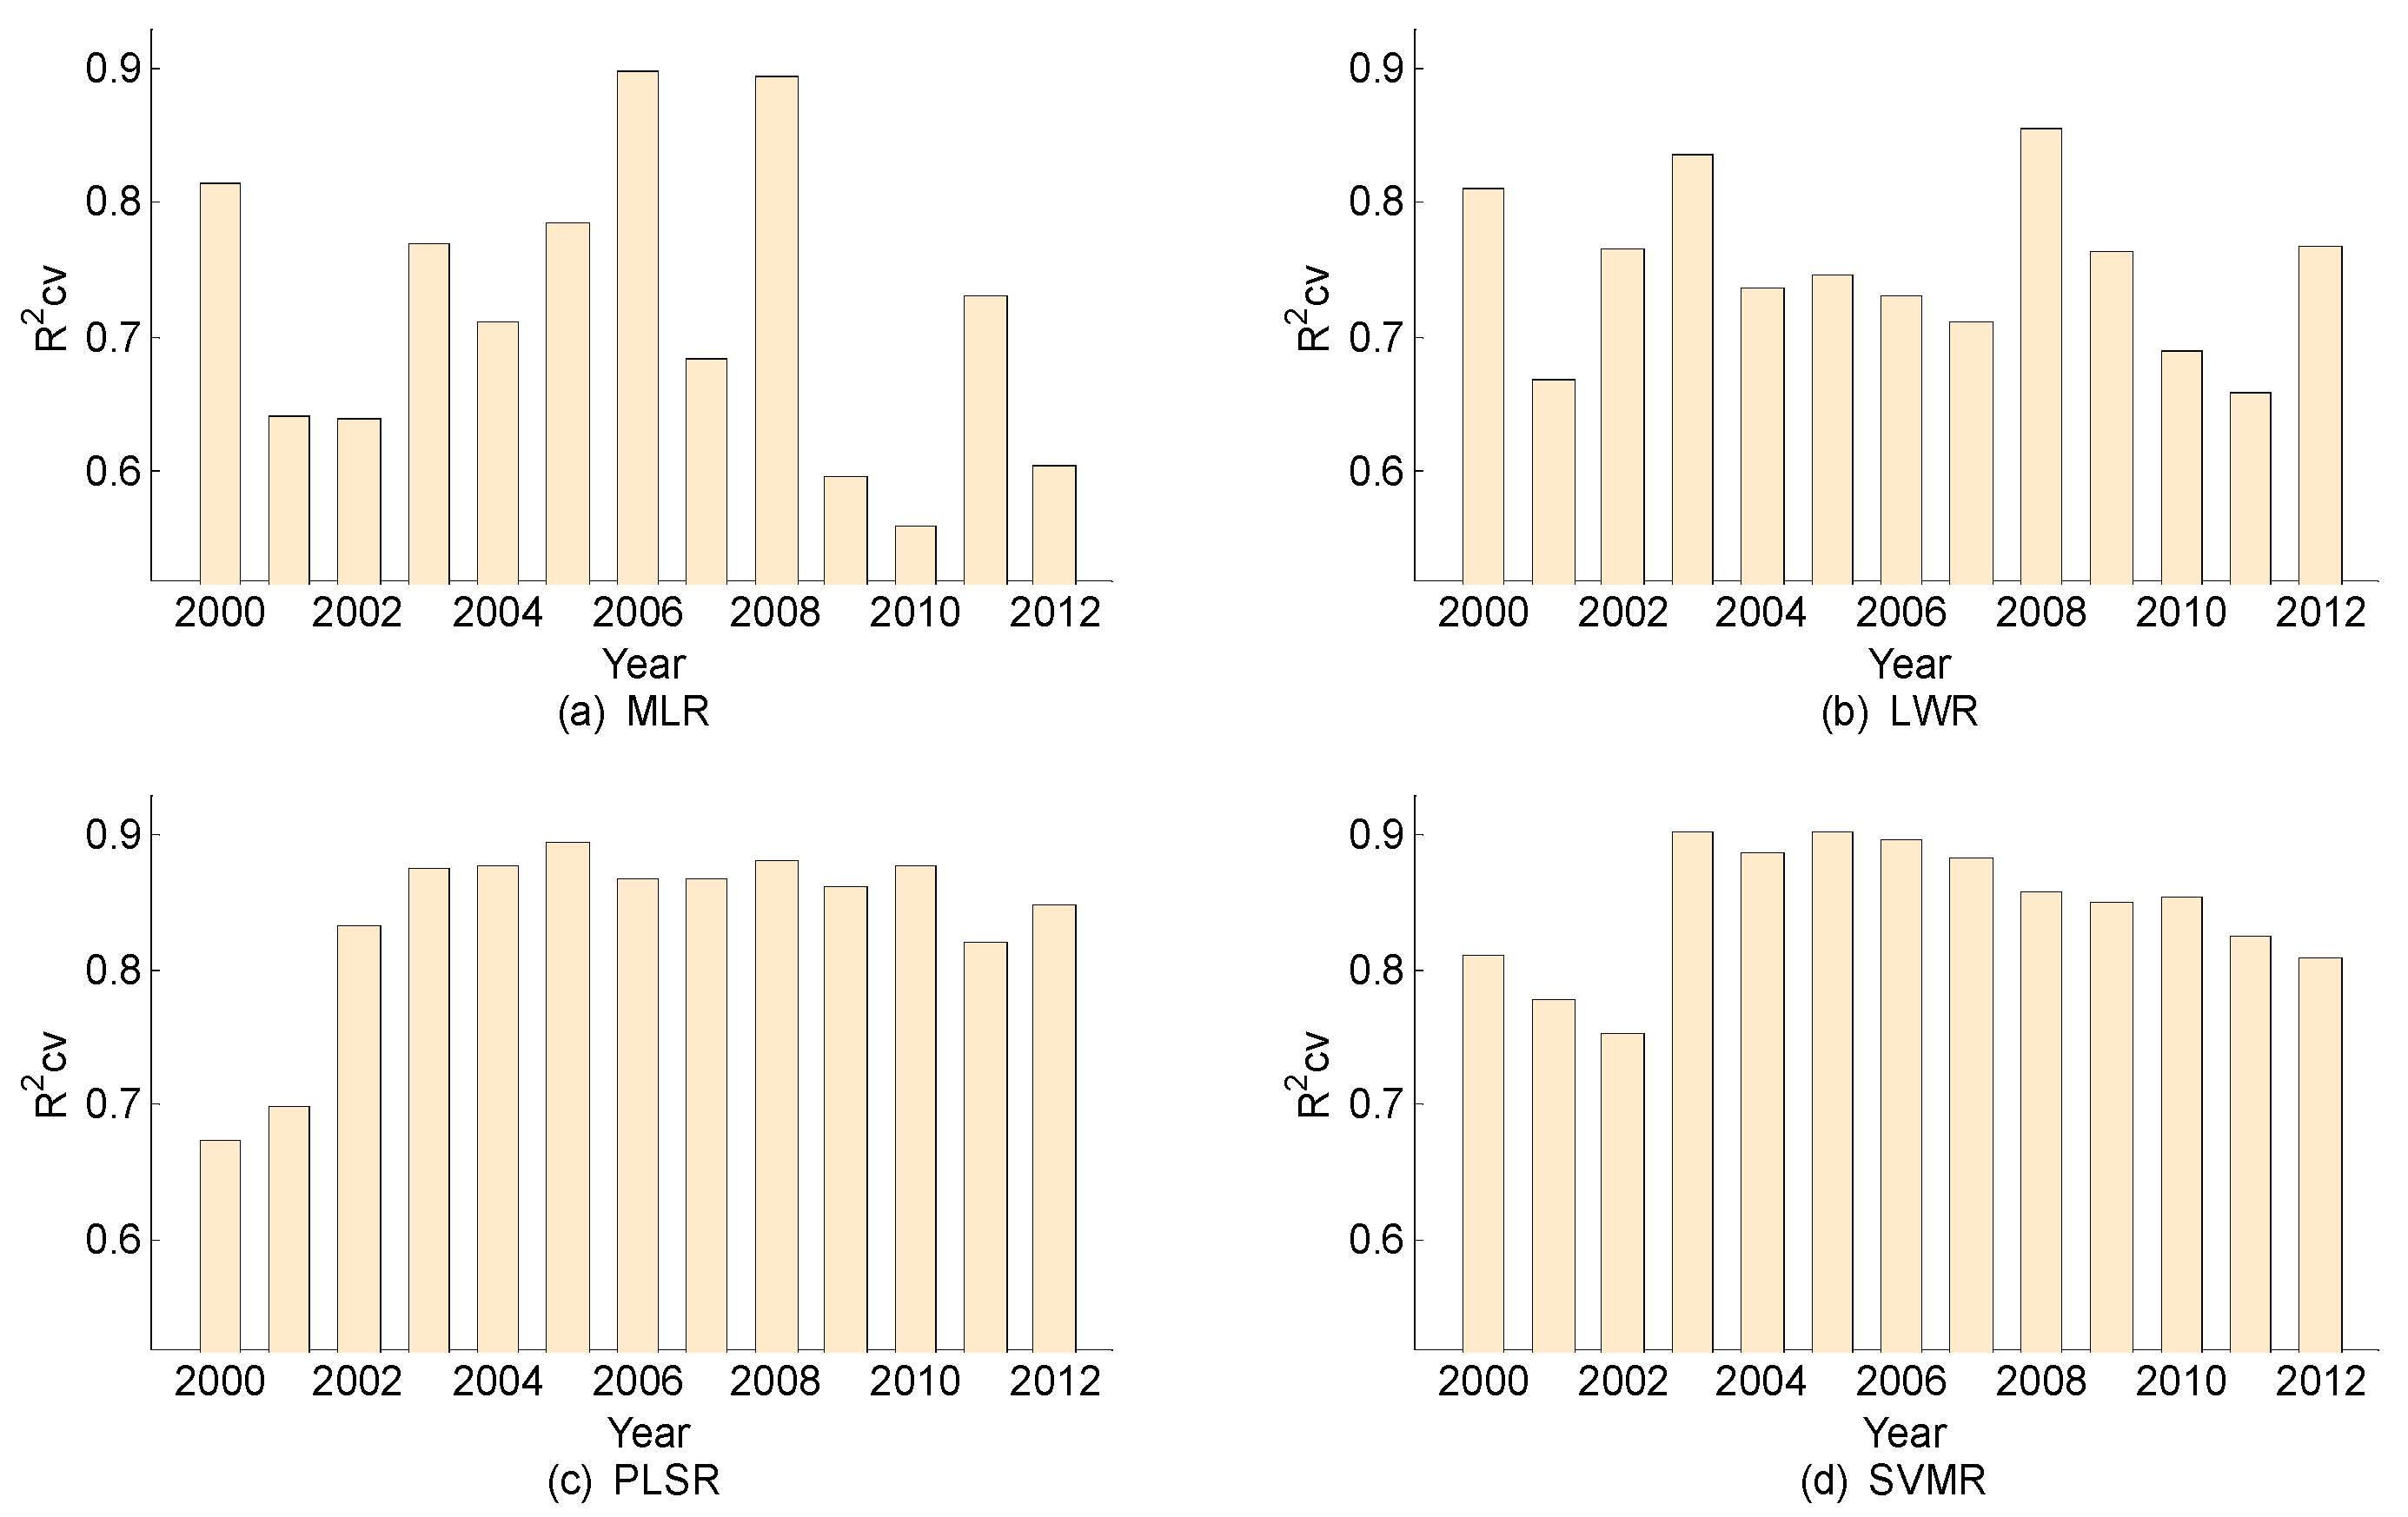
Both linear and non-linear data mining methods, including MLR, LWR, PLSR, and SVMR, were used for the estimation of GDP based on the NTL data from 2000 to 2012. Figure 3 shows the with four methods in 13 years.
The model established by MLR had an unstable , which varied greatly among different years. Furthermore, this value only exceeded 0.8 in three years and thus, was found to be less than 0.7 for the other six years. The model established by LWR also had an obvious interannual variability, which was greater than 0.8 in three years in addition to being between 0.7 and 0.8 for seven years for . However, it was slightly better than MLR. The model established by PLSR was relatively stable with its being greater than 0.8 in 11 years with a peak value of 0.89 in 2005, which indicated an accurate fit for the NTL and GDP. The model established by SVMR also showed good stability with being greater than 0.8 in 11 years with a peak of 0.90 in 2005, which is even slightly better than PLSR.
3.2. Transferability Validation
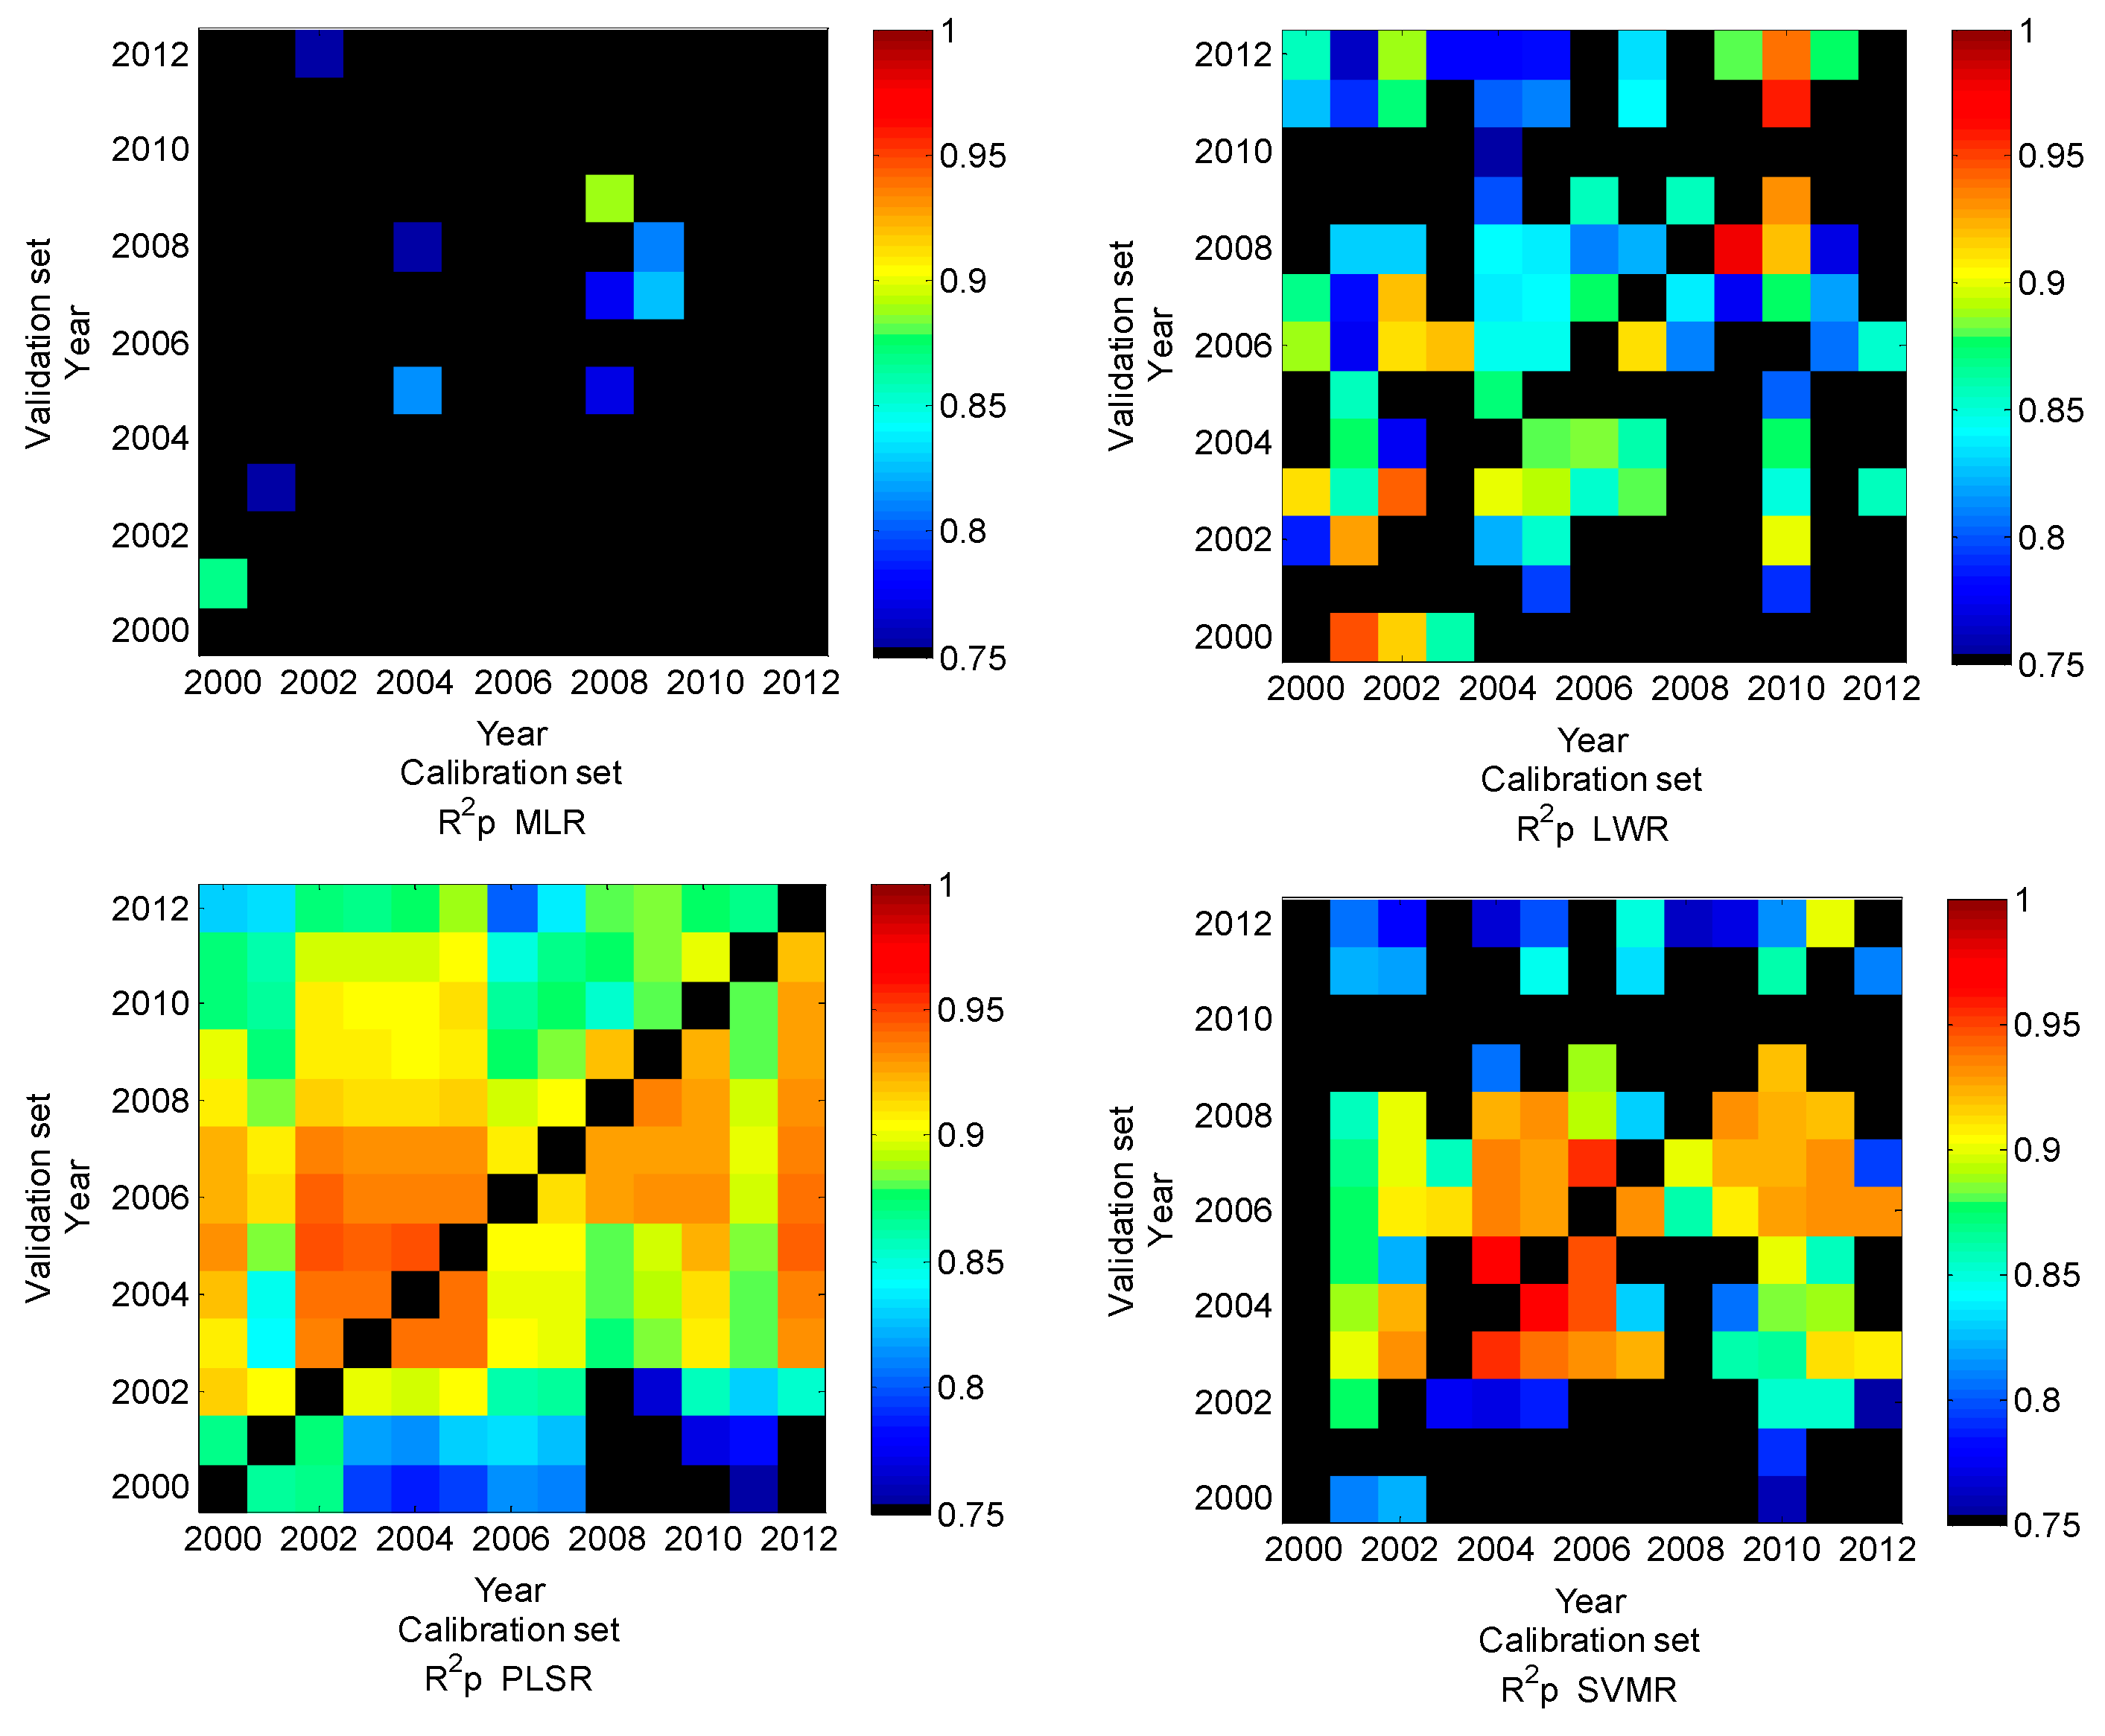
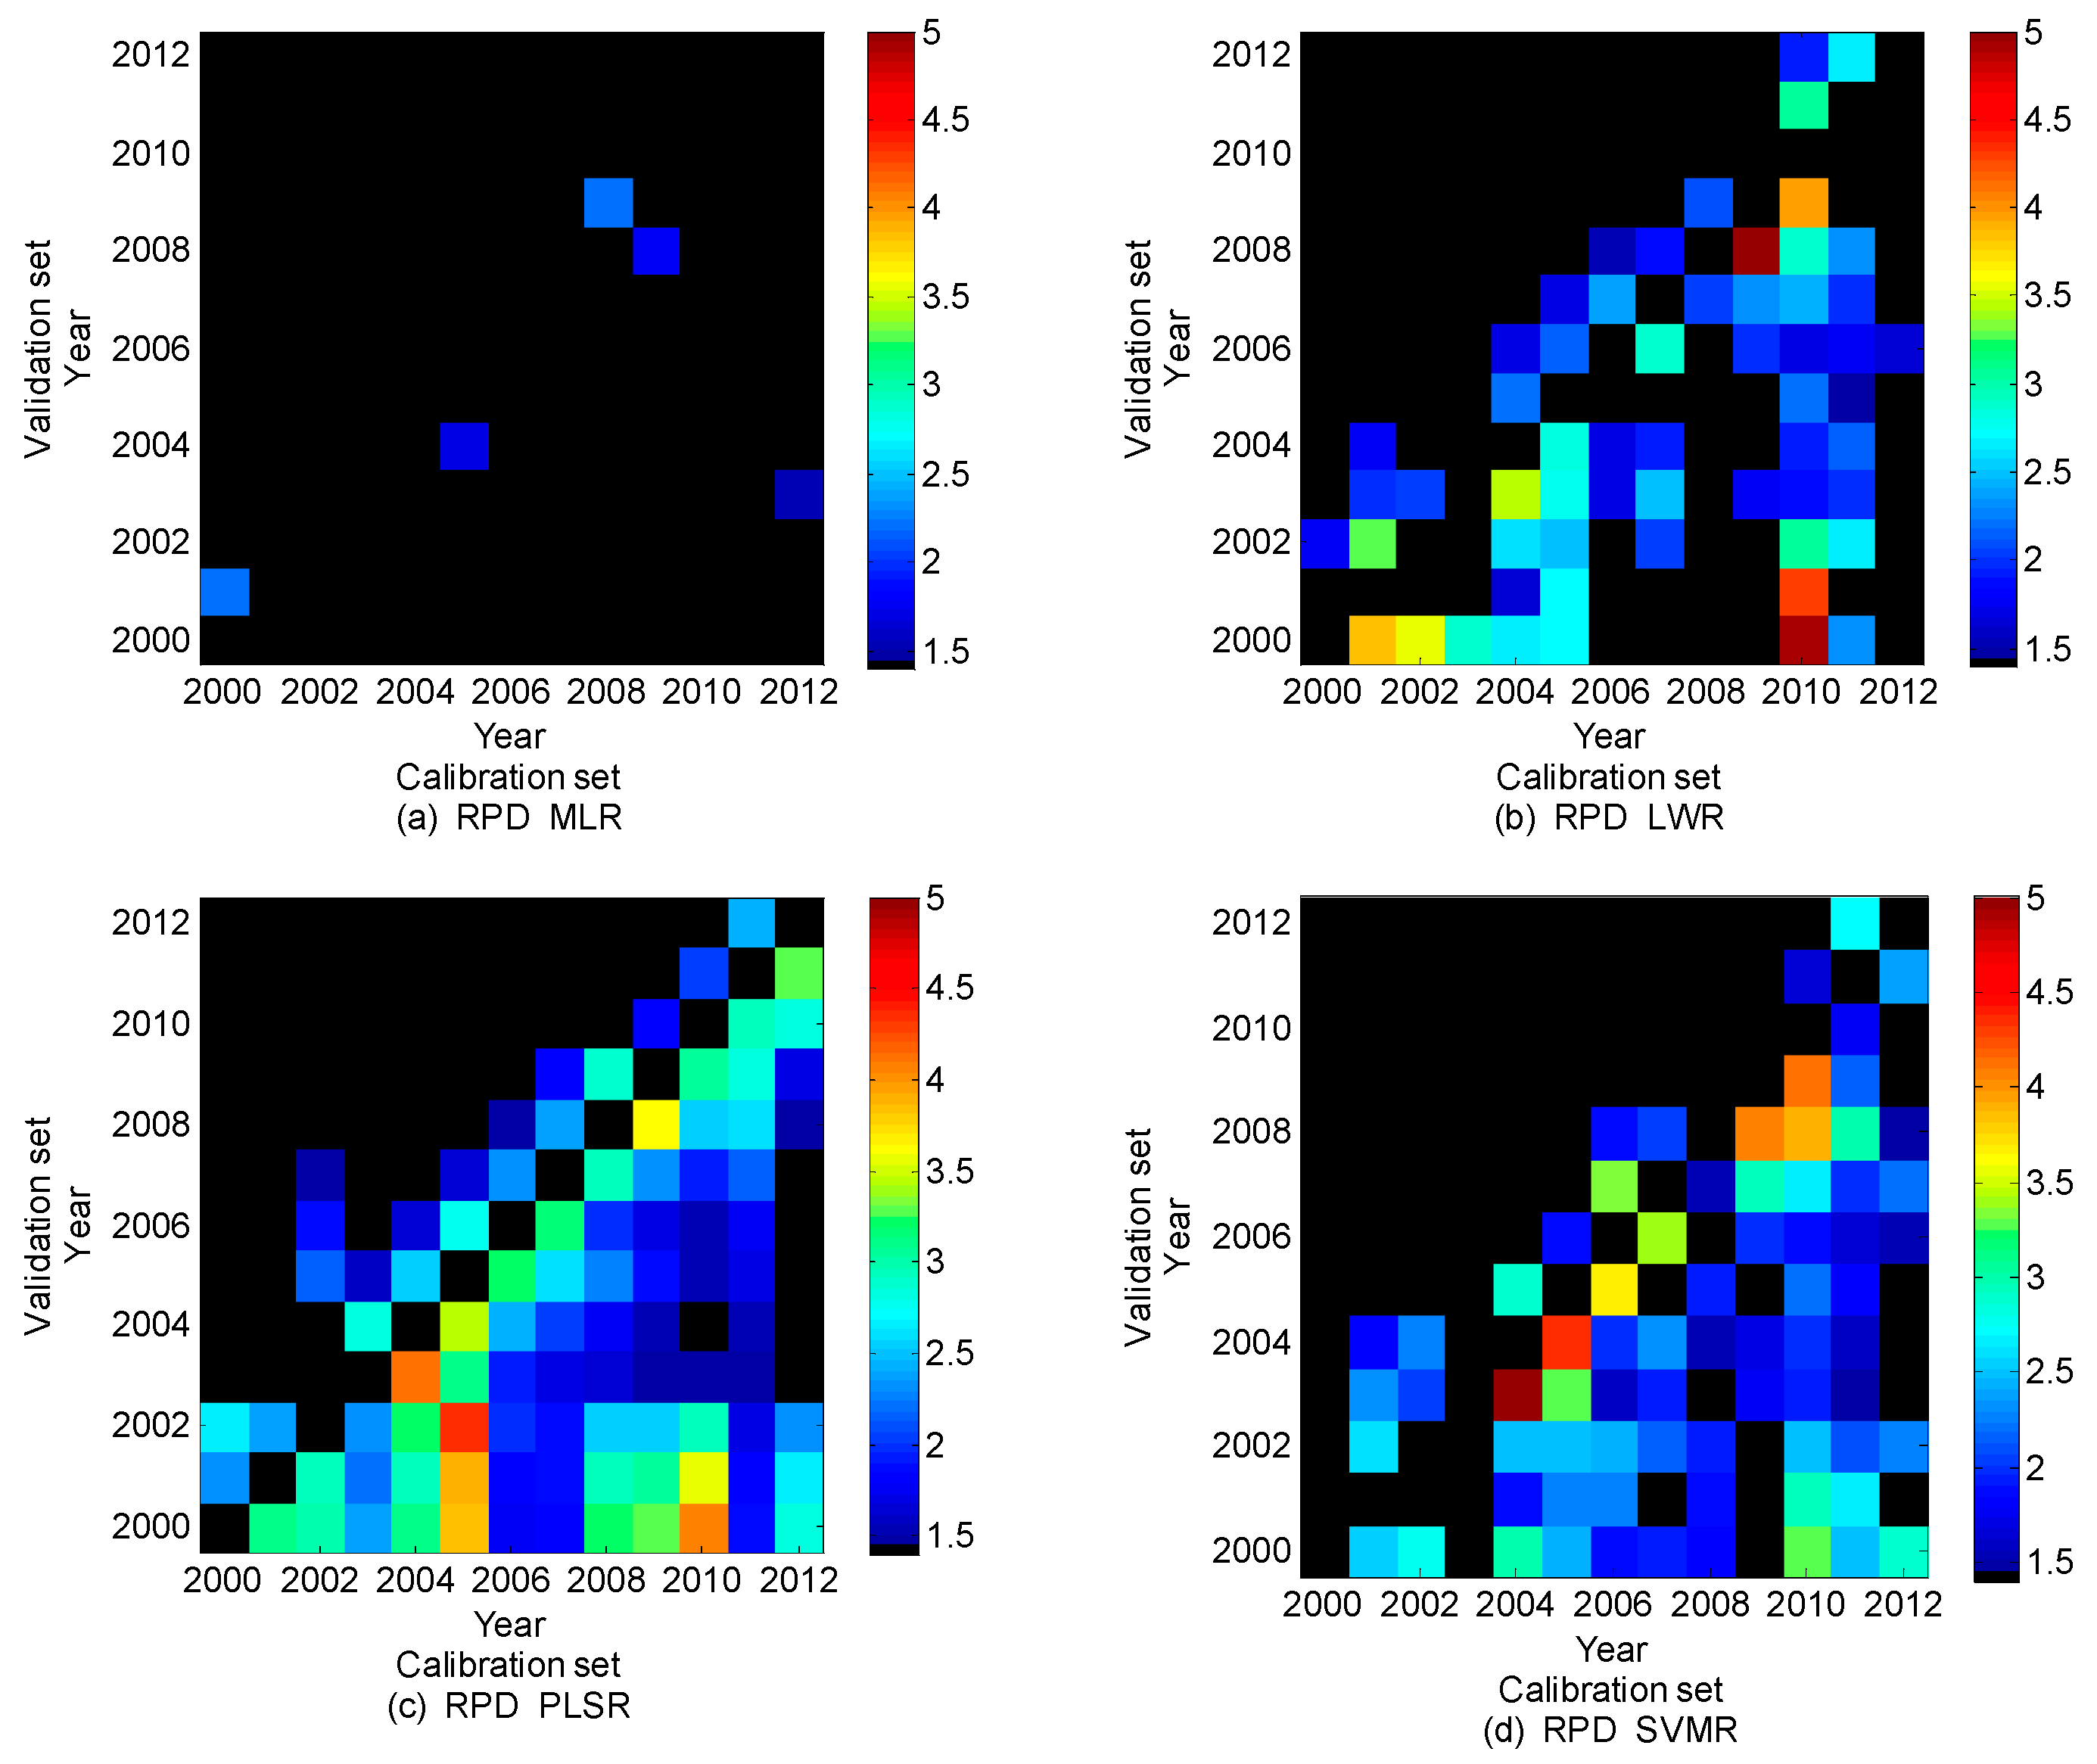
Aimed at testing the transferability across years, a model established in a given year with a single method was applied to the remaining 12 years for validation. The performances were evaluated by and . The former value represents the quality of the data fitting when a given model is applied to another year, while the latter depicts the quality of the model transfer based on the prediction errors [34]. The results are shown in Figure 4 and Figure 5.
The colored area in Figure 4 represents the combinations of the modeling and validation sets with an of greater than 0.75, while the black area represents those with values less than 0.75 or the diagonal area (self-validated). It can be seen that only a few cases succeeded with MLR, which indicated that this model was not suitable for fitting the data of other years. In comparison, LWR and SVMR performed much more effectively, with an that was greater than 0.75 in more than half of the cases. This indicates approximate estimations in other years. PLSR obtained the best result as it was suitable for fitting most cases and its model remained capable despite the addition of different years.
The colored area in Figure 5 represents the combinations of the modeling and validation sets that has a greater than 1.4 (the threshold for fair predictions, which may be used for assessment and correlation), while the black area represents the values of less than 1.4 and the diagonal area. It can be seen that it was almost black for MLR and thus, this method was incapable for prediction. For LWR and SVMR, was greater than 1.4 in more than 38% and 48% of the cases, indicating the possibility of transferring these models to other years to a certain extent. Furthermore, the prediction ability of PLSR was relatively good with greater than 1.4 in 59% of the cases, which showed a relatively strong transferability across years.
4. Discussion
4.1. Comparison and Explanation
Four methods were used to excavate the relationship between NTL and economy. The model evaluation parameters, which are , , and along with their statistical characteristics—are listed in Table 1.
By comparing , it can be seen that the mean values of PLSR and SVMR are 0.836 and 0.847 respectively, which have reached a high level that indicates a satisfactory accuracy for modeling. Between these two methods, all the minimum, maximum, and mean values of SVMR are slightly higher than those of PLSR, while the standard deviation is lower. Thus, we conclude that SVMR is slightly better than PLSR from the perspective of modeling. The reason may be that SVMR is a non-linear method with a sophisticated data mining mechanism and thus, fits the variables better. This also demonstrates that the non-linear method should have a good inherent advantage in deeply excavating the economic information from the complex and diverse NTL data. On the other hand, despite the fact that the of both MLR and LWR are relatively low, the latter’s four parameters are superior to those of the former, which can also be explained by the model complexity. The LWR method only needs to fit each subset of the economy data separately, instead of specifying a universal model to fit all the data similar to MLR. Therefore, the LWR method has a higher degree of fitting and a better modeling performance. Therefore, from the perspective of modeling, PLSR and SVMR were better than MLR and LWR. The further ranking is SVMR > PLSR > LWR > MLR, which approximately fits the model complexity.
By comparing , it can be seen that PLSR has the highest coefficient of determination (mean of 0.88) and the lowest standard deviation (0.07), which represents the best accuracy and stability for prediction. A similar pattern is shown in , with PLSR having the highest mean value (1.76). Contrary to the modeling performance of SVMR being slightly better than PLSR, from this perspective of model transfer, PLSR is much better than SVMR. This is possibly because PLSR is an excellent linear regression model, which can effectively overcome the multicollinearity within the NTL data and remains applicative even when the sample numbers are less than the variables. These qualities may help make it superior to alternatives when used for prediction across different years. However, SVMR is a classical non-linear method with high-precision fitting in a single year and has greater advantages in modeling. Its complexity of computation may also bring over-fitting problems, which makes it fail to transfer the models to other years. In conclusion, only PLSR performed well with a high accuracy and stability in terms of model transfer. The further ranking is PLSR > SVMR > LWR > MLR.
4.2. Transferability Across Years
Some of previous studies used simple linear regressions (SLR) to build up the GDP estimation model based on NTL data, and further discussed the transferability of the models across regions. There is a lack of research addressing the transferability across years. In order to find out whether a traditional SLR model can be used for the prediction of other years, we conducted an additional experiment with a popular light index, namely the total night-time light (also referred to as ‘sum of light’) [1,4,5]. Similarly, models of each single year from 2000 to 2012 were built by SLR, before each was applied to the other 12 years. The results are shown in Table 2. It can be seen that the mean value of is 0.742, indicating a good performance of modeling. However, the mean value of was less than 0, indicating that these models could not be used for the prediction of other years. Thus, a traditional SLR model based on a certain light index can only be used for modeling in a single year and is not capable for model transfer across years. This is possibly because the data underwent great changes in the structure and distribution between different years, making it difficult for a SLR model to cover all the variants and obtain accurate predictions. On the other hand, it might be that the light index did not make full use of the information from the NTL data and thus, its models missed some of the most important mechanisms of interaction between lights and economy.
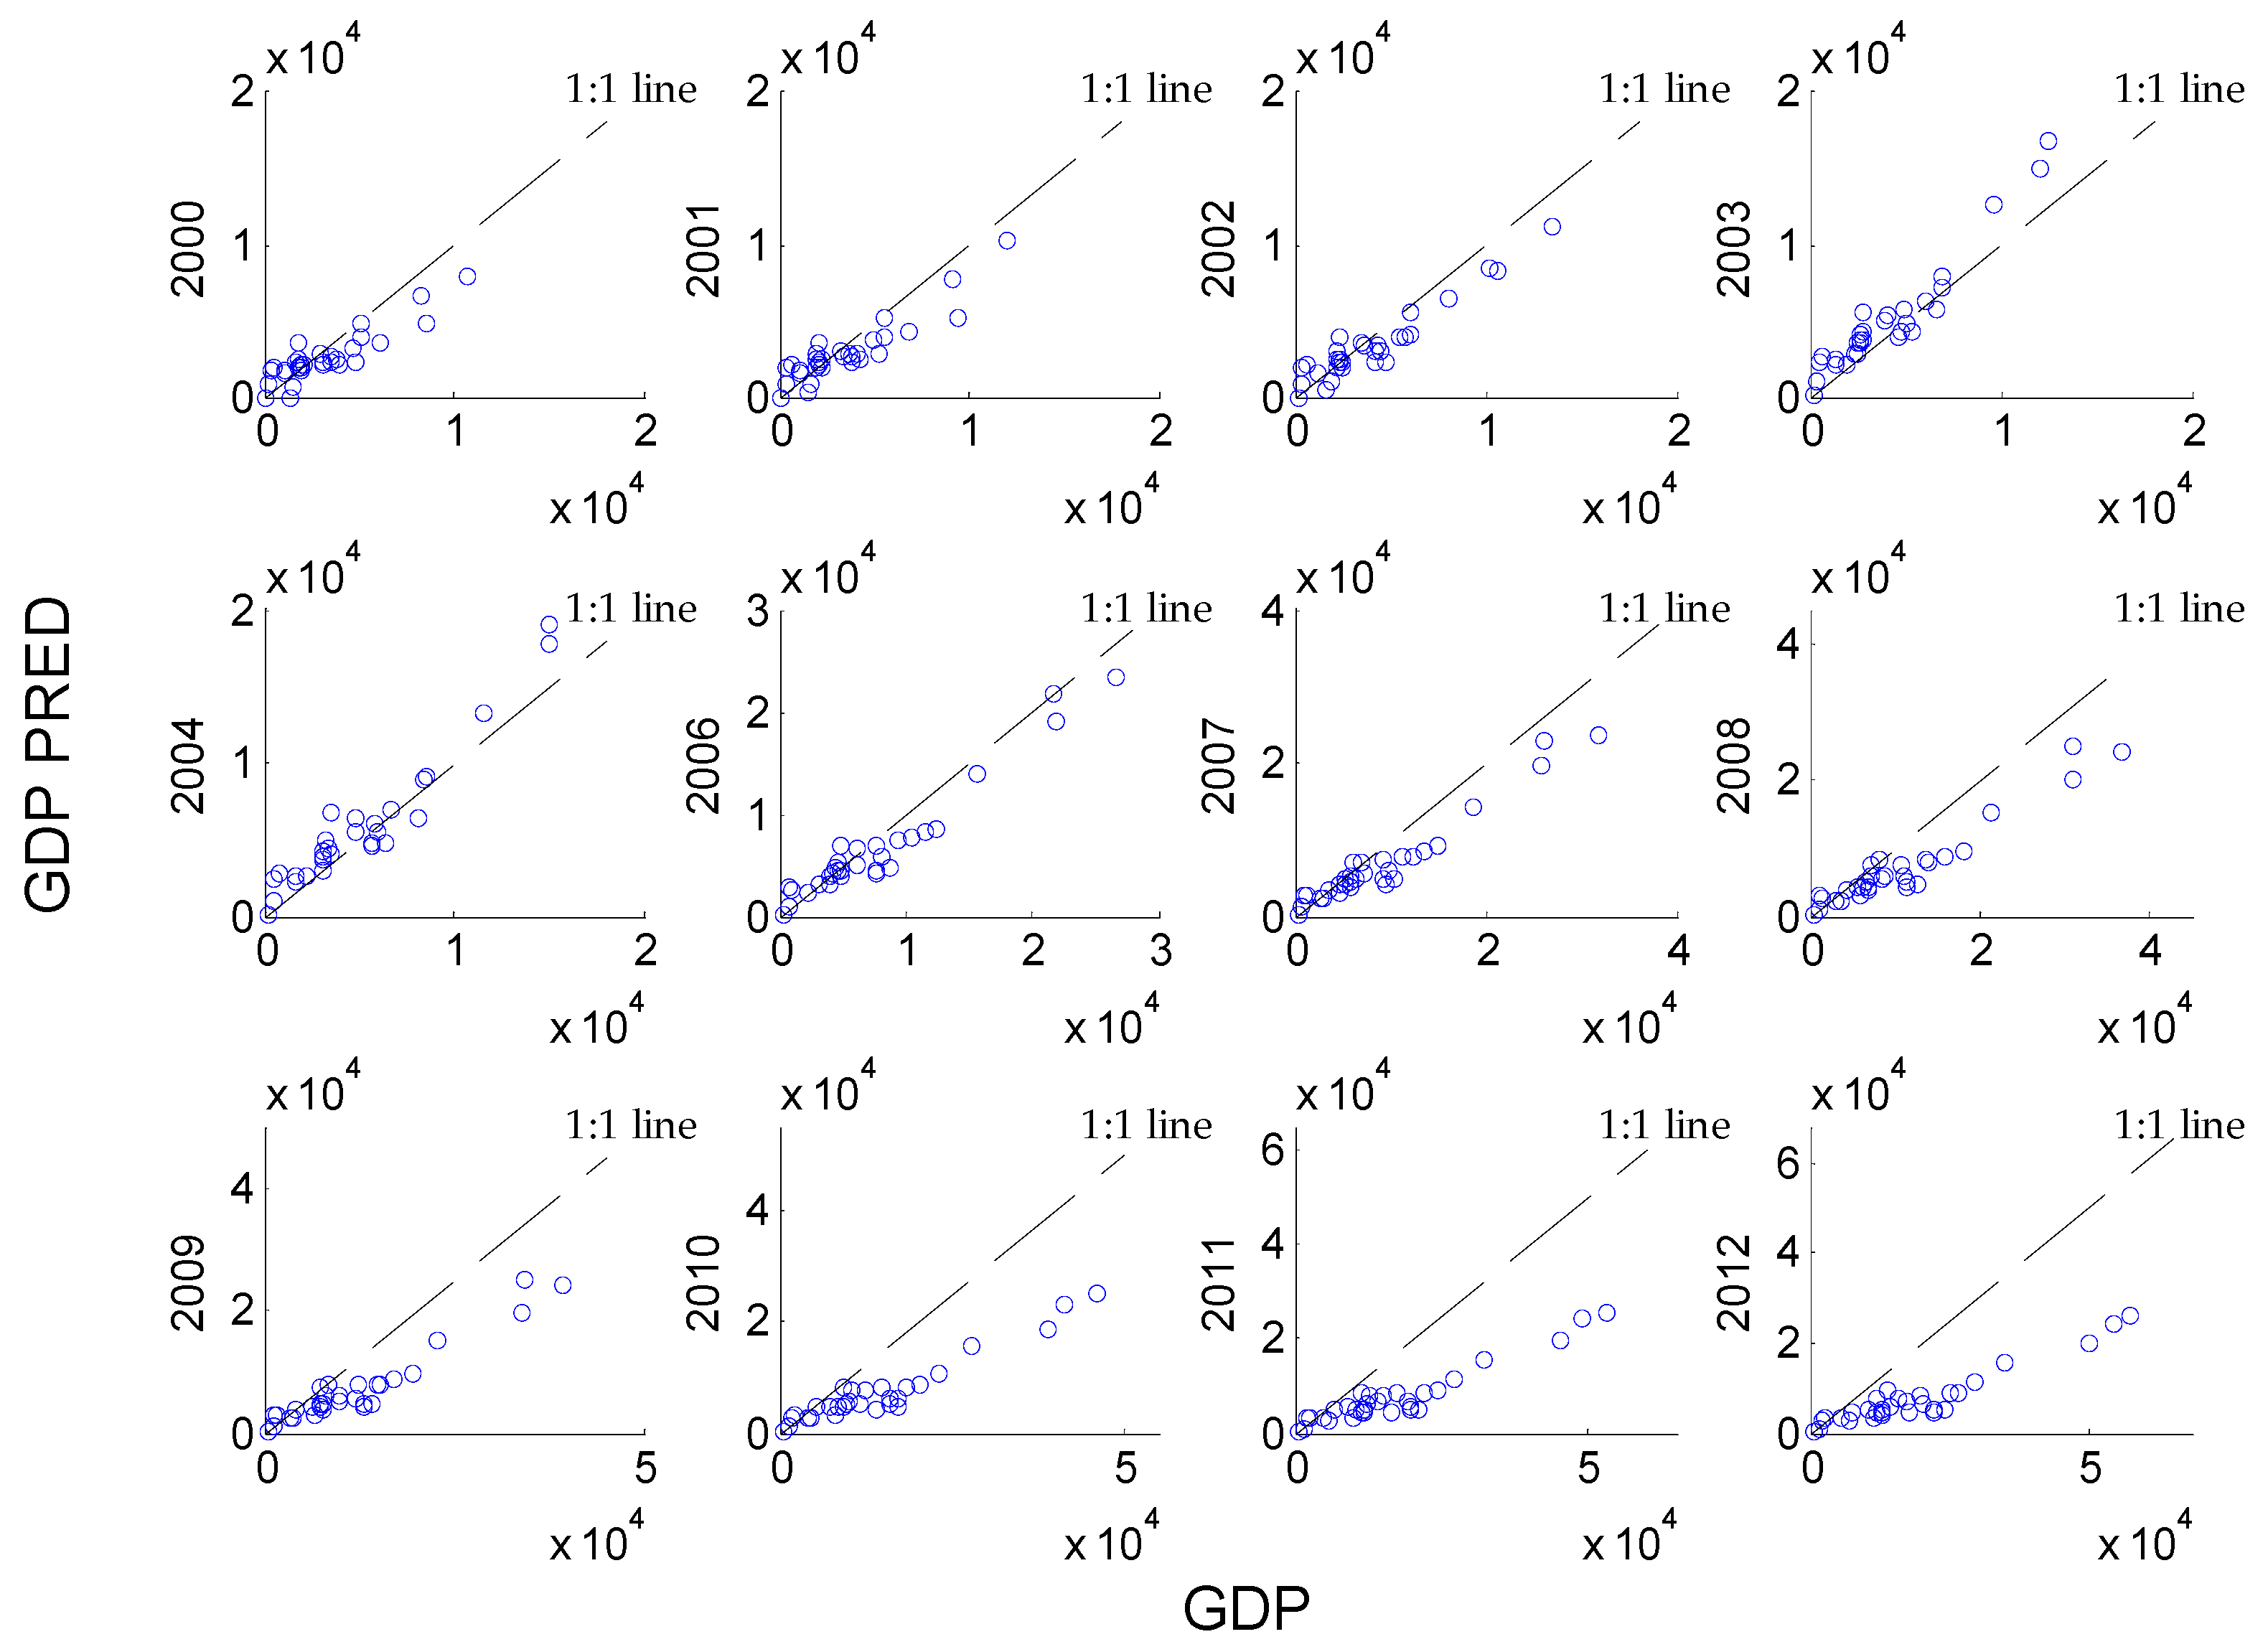
In contrast, the entire DN series of the NTL data were adopted for the estimation of the economy with four data mining methods. In this estimation, PLSR performed well in both modeling and transferring with the highest of 0.89 in 2005. This model was applied to the prediction of the other 12 years, with the results shown in Figure 6. It can be inferred that this PLSR model showed a certain level of transferability across years, with a mean of 0.90 and a mean of 2.20. Nevertheless, the economy of 2000–2001 was underestimated to a certain extent, possibly for the reason that the development level was low in 2000 and 2001 with a considerable number of 0 values in the frequency table of the entire DN series. With the development of the society, the frequency table in 2005 was more complete with fewer 0 values and more valid DNs for modeling. In consequence, when the model from 2005 was used for 2000 and 2001, parts of the valid DN variables met 0 values and made no contributions to the estimation and thus, resulted in an undervaluation. The scattered points from 2002 to 2007 mainly distributed closely to the 1:1 line, indicating relatively reliable prediction results. The economy values from 2008–2012 were underestimated. The first reason might be that these years’ frequency tables were more complete with fewer 0 values than in 2005, so some of their valid DN variables were possibly not valid (0 values) in the model of 2005. Consequently, the earlier model only calculated parts of the DNs’ contribution and caused the underestimation. The second reason might be that the frequency table changed rapidly in these years and resulted in an aggregation at the section of high DN values, which usually represented the city cores and had a greater influence on the economy. In 2005, there were a smaller number of high DN values and thus, their contributions were not so significant in the original model. When this model was applied to 2007–2012, the contributions of these newly high DN value sections were underestimated, resulting in prediction bias occurring. Nevertheless, PLSR solved the problem of transferability and was capable of economy estimation across years.
4.3. Important DN Section Extraction
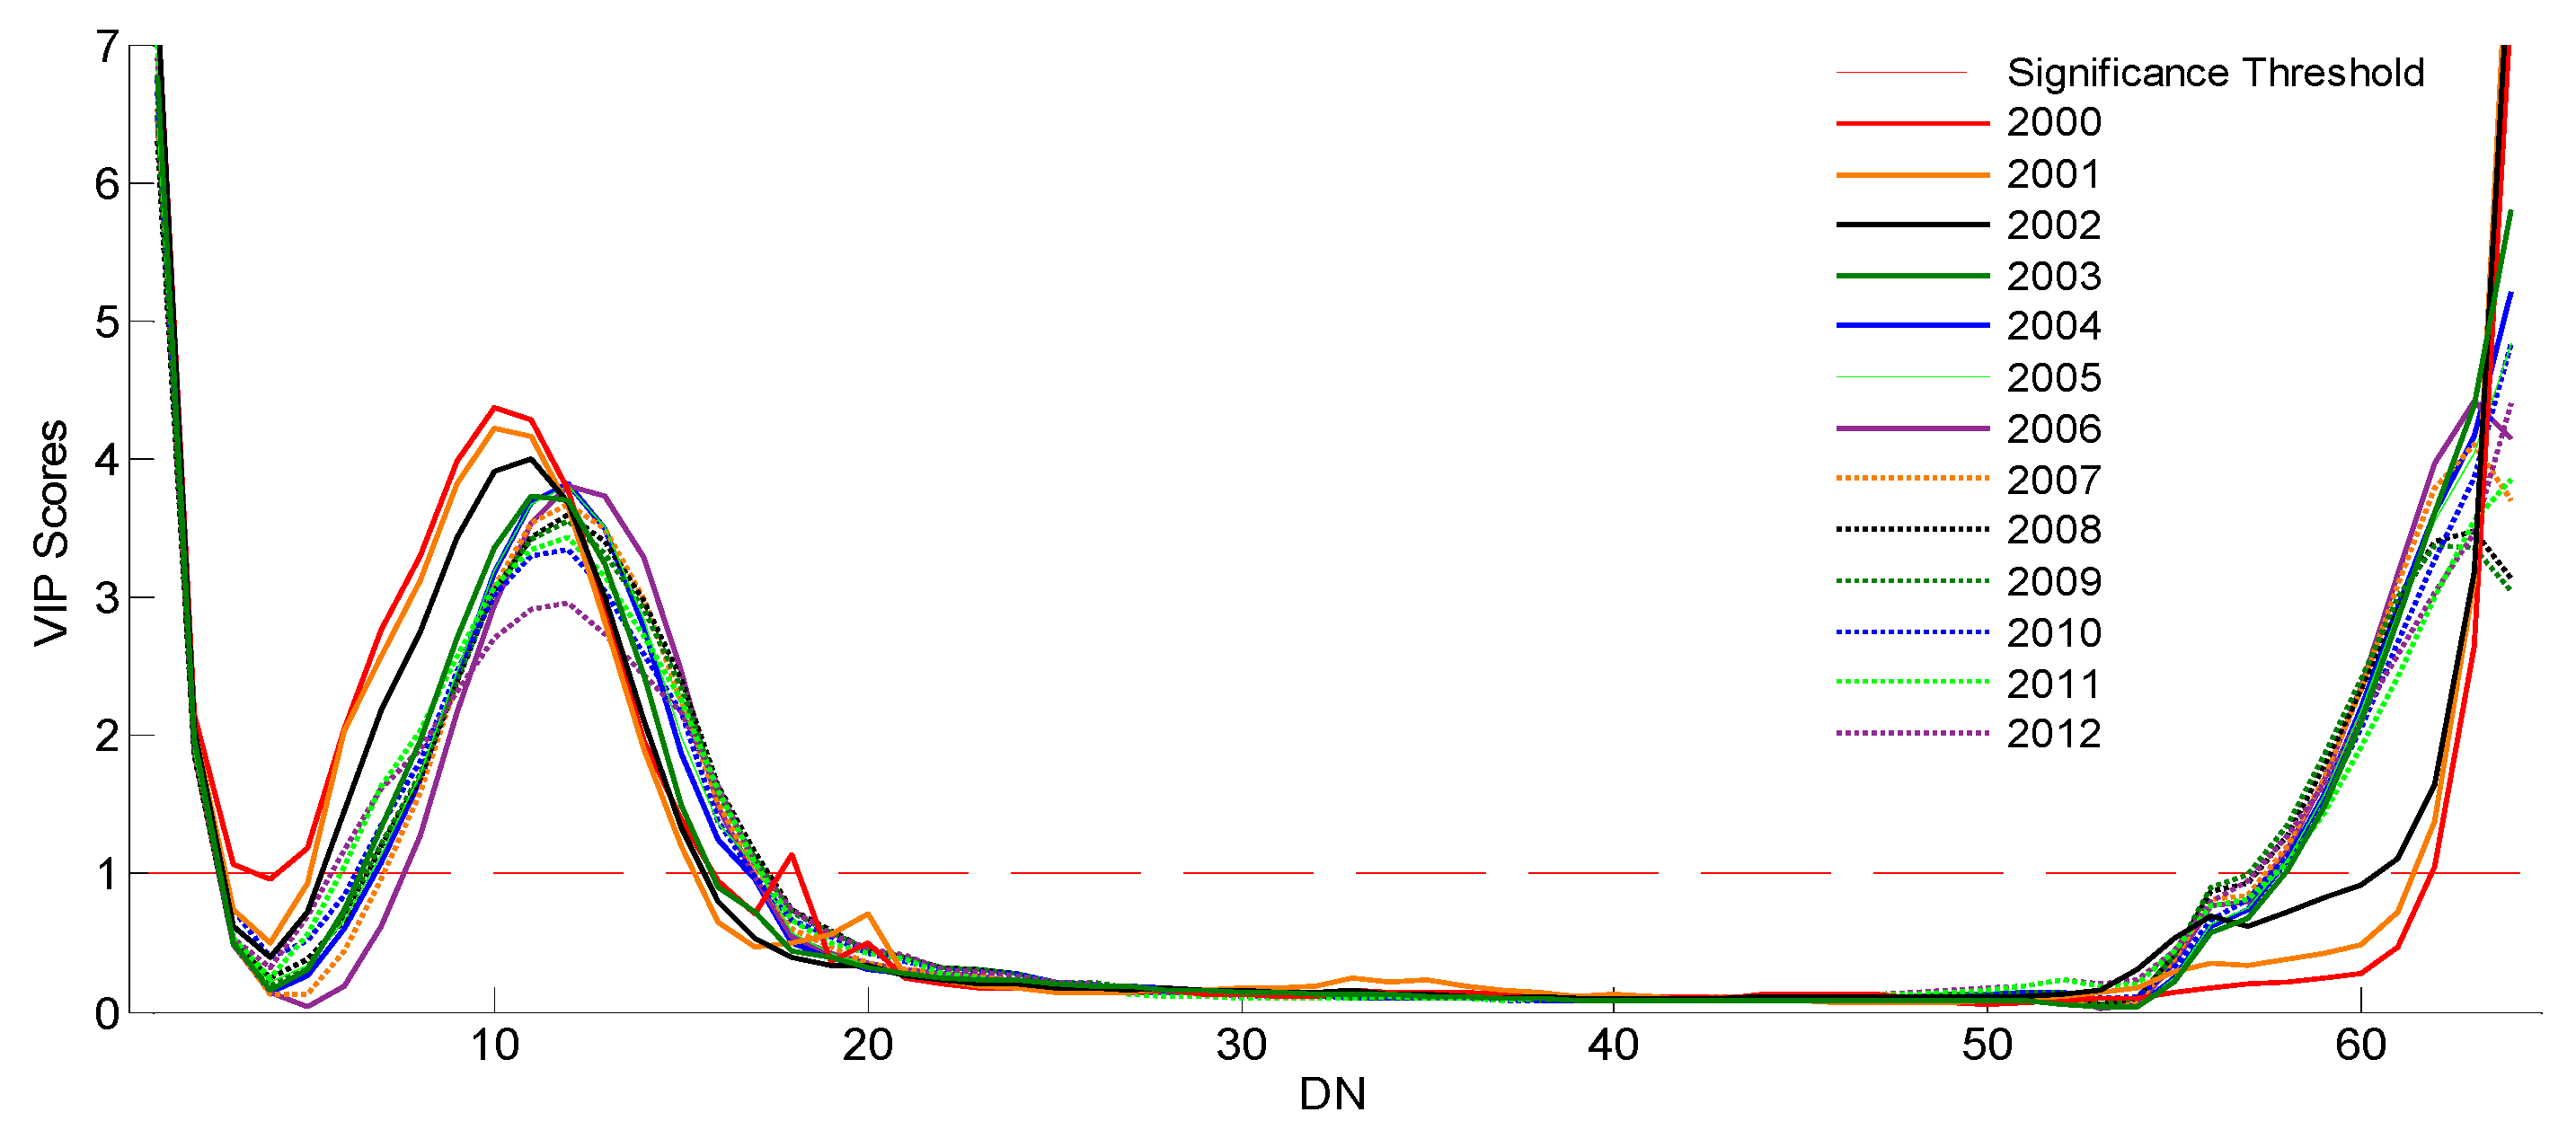
The frequency table of the entire DN series from 0 to 63 was used for modeling. However, the importance and contribution of the 64 DN variables are not exactly the same in the estimation (if so, the annual GDP will remain the same, since the sum of frequency table is actually the number of image grids that also represents the area). In order to highlight the different roles of different variables, a Variable Importance in Projection (VIP) extraction was carried out. The VIP scores will help to visually point out the importance of each DN variable in interpreting the GDP. A higher score indicates a greater contribution to the estimation [35]. A variable with a VIP Score close to or greater than 1 can be considered important in the model. Variables with VIP scores that are significantly less than 1 are less important and might be good candidates for exclusion from the model [36].
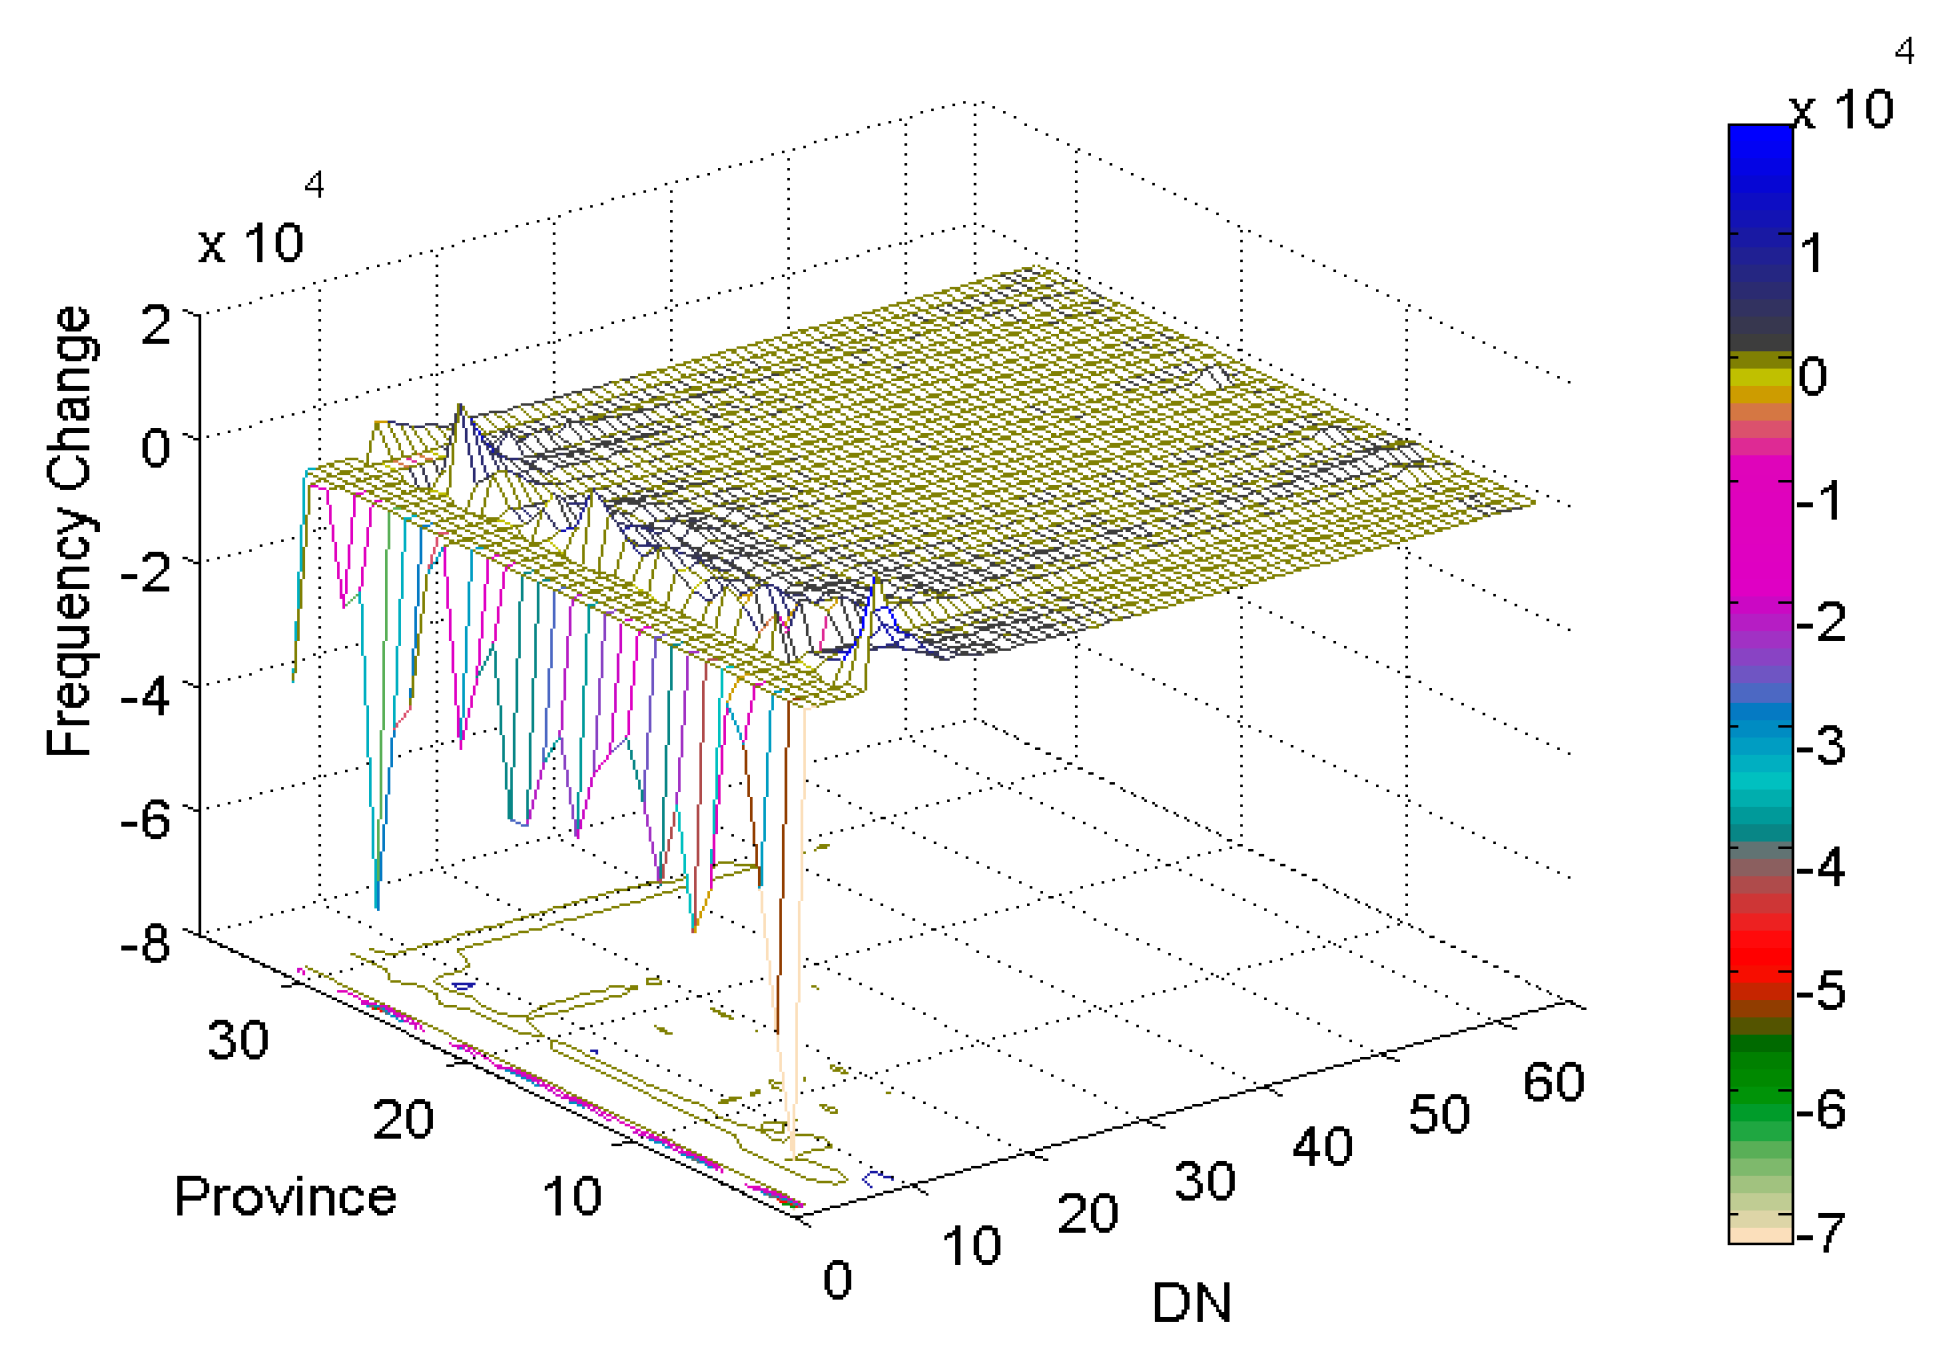
Figure 7 shows the importance of different DN values in the 13-year economy estimation using the PLSR data mining method. It can be found that there were mainly three DN sections with scores greater than 1: (0–1), (4–16), and (57–63). These sections were especially important to the economy and occupied vital roles for the estimation results. The first section (0–1) was important possibly due to its frequency, which is considerably larger (for the same reason, it was not shown in Figure 2). This would enlarge its contribution to the interpretation of the results. The second section (4–16) was important due to its obvious changes in the frequency table. This was further illustrated by Figure 8, which depicts the frequency change of the entire DN series between 2000 and 2012. The largest change in Figure 8 was found at (0–1) with another peak having occurred within a small section around 10, which just confirmed the first two important sections in Figure 7. Furthermore, the (4–16) section possibly indicated the early stages of urbanization or urban growth, especially considering this section contained a real nascent signal that probably represented actual economic development. As for the third section, (57–63), the DN values had reached a relatively high level or even saturation, which represented the highly developed area and is usually accompanied by the booming economy. Therefore, it is easy to understand why this section held an important role in economy estimation.
Additionally, the frequency tables of the DN sections of (0–1), (4–16), and (57–63) were extracted to form new independent variables. Then they were used for model calibration and transferability validation with PLSR. The results are shown in Table 3. It can be seen that the results were relatively satisfactory: mean of = 0.91, mean of = 0.79, mean of = 1.82. This confirmed the findings above that the three DN sections played a vital role in economy estimation.
4.4. Limitations of Present Study
The spatial overflow sometimes causes lit pixels to extend beyond the real illuminated area of nighttime light [14], which is especially serious in DMSP/OLS imagery. This issue partially limits the results for relevant studies. However, it is noted that this study takes the developing country of China as the example, with a large proportion of the western and middle areas of China still being underdeveloped [37]. All estimation models are built on a provincial scale with an average area over 300,000 km2. In other words, areas with high DN values are just a small part of the province (such as the provincial capital). The lights may overflow to the adjacent areas but rarely escape out of the province and thus, will not have too much impact on the models.
Moreover, this study does suffer from saturation of the DN values of the NTL data, which may bring some prediction bias when using lights to estimate economy [38]. We expect that we can overcome this problem by using the night-time Visible Infrared Imaging Radiometer Suite (VIIRS) Day/Night Band (DNB) data, with a measured wavelength range of 505–890 μm. This shows a significant advantage over the DMSP/OLS data (0.4–1.1 μm). Nonetheless, these new products are only available from 2013 [39] and will be widely used in the near future when there are more data. Furthermore, He et al. offer a new method to correct the saturated lights of DMSP/OLS [40], which may also help to solve these limitations.
5. Conclusions
This paper adopts four data mining methods for transferable economy estimation across years based on the entire DN series of DMSP/OLS night-time light. From the results, we conclude that: (1) from the perspective of modeling, PLSR and SVMR are superior to MLR and LWR, although they all performed quite well; (2) from the perspective of model transfer, only PLSR has a strong transferability across different years; (3) three important DN sections of (0–1), (4–16), and (57–63) are particularly important for economic estimations. Such findings are expected to provide a more comprehensive understanding of the relationship between NTL and economy in addition to helping to build up a transferable model across different years. The idea of data mining on the basis of the entire DN series and the extraction of important DN sections may open up the field of remote sensing to statisticians and economists, who will be interested in using it to estimate years of multiple socioeconomic indicators. Thus, this will help to promote interdisciplinary applications.
Acknowledgments
Parts of this research were supported by the High-Resolution Earth Observation System National Key Foundation of China (Grant Nos. 11-Y20A02-9001-16/17 and 30-Y20A01-9003-16/17). The authors sincerely appreciate He Chunyang and his research team for the generous and kind help on the NTL data preprocessing method, and Chen Yiyun for guidance on software operation as well as code support. The authors are sincerely thankful for the comments and contributions of anonymous reviewers and members of the editorial team.
Author Contributions
Kun Qi and Yi’na Hu conceived the study and wrote the article; Chengqi Cheng supervised the research topic and directed the method; Bo Chen offered helpful suggestions, directed the writing, and revised the paper. All authors read and approved the submitted manuscript, agreed to be listed, accepted the version for publication.
Conflicts of Interest
The authors declare no conflict of interest.
References
- Li, X.; Xu, H.; Chen, X.; Li, C. Potential of NPP-VIIRS nighttime light imagery for modeling the regional economy of China. Remote Sens. 2013, 6, 3057–3081. [Google Scholar] [CrossRef]
- Henderson, J.; Storeygard, A.; Weil, D. Measuring economic growth from outer space. Am. Econ. Rev. 2012, 102, 994–1028. [Google Scholar] [CrossRef] [PubMed]
- Henderson, J.; Storeygard, A.; Weil, D. A bright idea for measuring economic growth. Am. Econ. Rev. 2011, 101, 194–199. [Google Scholar] [CrossRef] [PubMed]
- Sutton, P.; Elvidge, C.; Ghosh, T. Estimation of Gross Domestic Product at sub-national scales using nighttime satellite imagery. Int. J. Ecol. Econ. Stat. 2007, 8, 5–21. [Google Scholar]
- Doll, C.; Muller, J.; Morley, J. Mapping regional economic activity from night-time light satellite imagery. Ecol. Econ. 2006, 57, 75–92. [Google Scholar] [CrossRef]
- He, C.; Shi, P.; Li, J.; Chen, J.; Pan, Y.; Li, J.; Ichinose, T. Restoring urbanization process in China in the 1990s by using non-radiance-calibrated DMSP/OLS nighttime light imagery and statistical data. Sci. Bull. 2006, 51, 1614–1620. [Google Scholar] [CrossRef]
- Liao, W.; Liu, X.; Wang, D.; Sheng, Y. The impact of energy consumption on the surface urban heat island in China’s 32 major cities. Remote Sens. 2017, 9, 250. [Google Scholar] [CrossRef]
- Zhou, Y.; Smith, S.J.; Zhao, K.; Imhoff, M.; Thomson, A.; Bond-Lamberty, B.; Elvidge, C. A global map of urban extent from nightlights. Environ. Res. Lett. 2015, 10, 054011. [Google Scholar] [CrossRef]
- Zhou, Y.; Smith, S.J.; Elvidge, C.; Zhao, K.; Thomson, A.; Imhoff, M. A cluster-based method to map urban area from DMSP/OLS nightlights. Remote Sens. Environ. 2014, 147, 173–185. [Google Scholar] [CrossRef]
- Elvidge, C.; Baugh, K.; Kihn, E.; Kroehl, H.; Davis, E.; Davis, C. Relation between satellite observed visible-near infrared emissions, population, economic activity and electric power consumption. Int. J. Remote Sens. 1997, 18, 1373–1379. [Google Scholar] [CrossRef]
- Ma, T.; Zhou, C.; Pei, T.; Haynie, S.; Fan, J. Responses of Suomi-NPP VIIRS-derived nighttime lights to socioeconomic activity in China’s cities. Remote Sens. Lett. 2014, 5, 165–174. [Google Scholar] [CrossRef]
- Bustos, M.; Hall, O.; Andersson, M. Nighttime lights and population changes in Europe 1992–2012. Ambio 2015, 44, 653–665. [Google Scholar] [CrossRef] [PubMed]
- Ghosh, T.; Anderson, S.; Powell, R.; Sutton, P.; Elvidge, C. Estimation of Mexico’s informal economy and remittances using nighttime imagery. Remote Sens. 2009, 1, 418–444. [Google Scholar] [CrossRef]
- Bennett, M.; Smith, L. Advances in using multitemporal night-time lights satellite imagery to detect, estimate, and monitor socioeconomic dynamics. Remote Sens. Environ. 2017, 192, 176–197. [Google Scholar] [CrossRef]
- Propastin, P.; Kappas, M. Assessing satellite-observed nighttime lights for monitoring socioeconomic parameters in the Republic of Kazakhstan. GISci. Remote Sens. 2012, 49, 538–557. [Google Scholar] [CrossRef]
- Elvidge, C.; Imhoff, M.; Baugh, K.; Hobson, V.; Nelson, I.; Safran, J.; Dietz, J.; Tuttle, B. Night-time lights of the world: 1994–1995. ISPRS J. Photogramm. 2001, 56, 81–99. [Google Scholar] [CrossRef]
- Jiang, W.; He, G.; Long, T.; Wang, C.; Ni, Y.; Ma, R. Assessing light pollution in China based on nighttime lLight imagery. Remote Sens. 2017, 9, 135. [Google Scholar] [CrossRef]
- Yi, K.; Tani, H.; Li, Q.; Zhang, J.; Guo, M.; Bao, Y.; Wang, X.; Li, J. Mapping and evaluating the urbanization process in northeast china using dmsp/ols nighttime light data. Sensors 2014, 14, 3207–3226. [Google Scholar] [CrossRef] [PubMed]
- Gao, B.; Huang, Q.; He, C.; Ma, Q. Dynamics of urbanization levels in China from 1992 to 2012: Perspective from DMSP/OLS nighttime light data. Remote Sens. 2015, 7, 1721–1735. [Google Scholar] [CrossRef]
- Bickenbach, F.; Bode, E.; Nunnenkamp, P.; Söder, M. Night lights and regional GDP. Rev. World Econ. 2016, 152, 425–447. [Google Scholar] [CrossRef]
- Sutton, P.; Costanza, R. Global estimates of market and non-market values derived from nighttime satellite imagery, land cover, and ecosystem service valuation. Ecol. Econ. 2002, 41, 509–527. [Google Scholar] [CrossRef]
- Ebener, S.; Murray, C.; Tandon, A.; Elvidge, C. From wealth to health: Modelling the distribution of income per capita at the sub-national level using night-time light imagery. Int. J. Health Geogr. 2005, 4, 5. [Google Scholar] [CrossRef] [PubMed]
- Nordhaus, W.; Chen, X. A sharper image? Estimates of the precision of nighttime lights as a proxy for economic statistics. J. Econ. Geogr. 2014, 15, 217–246. [Google Scholar] [CrossRef]
- Yu, B.; Shu, S.; Liu, H.; Song, W.; Wu, J.; Wang, L.; Chen, Z. Object-based spatial cluster analysis of urban landscape pattern using nighttime light satellite images: A case study of China. Int. J. Geogr. Inf. Sci. 2014, 28, 2328–2355. [Google Scholar] [CrossRef]
- Liu, Z.; He, C.; Zhang, Q.; Huang, Q.; Yang, Y. Extracting the dynamics of urban expansion in China using DMSP-OLS nighttime light data from 1992 to 2008. Landsc. Urban Plan. 2012, 106, 62–72. [Google Scholar] [CrossRef]
- Cleveland, W.; Devlin, S. Locally-weighted regression: An approach to regression analysis by local fitting. J. Am. Stat. Assoc. 1988, 83, 596–610. [Google Scholar] [CrossRef]
- Wold, S.; Sjöström, M.; Eriksson, L. Pls-regression: A basic tool of chemometrics. Chemom. Intell. Lab. 2001, 58, 109–130. [Google Scholar] [CrossRef]
- Chen, Y.; Qi, T.; Huang, Y.; Wan, Y.; Zhao, R.; Qi, L.; Zhang, C.; Fei, T. Optimization method of calibration dataset for VIS-NIR spectral inversion model of soil organic matter content. Trans. CSAE 2017, 33, 107–114. [Google Scholar]
- Rossel, R.; Behrens, T. Using data mining to model and interpret soil diffuse reflectance spectra. Geoderma 2010, 158, 46–54. [Google Scholar] [CrossRef]
- Ben-Hur, A.; Horn, D.; Siegelmann, H.; Vapnik, V. Support vector clustering. J. Mach. Learn. Res. 2001, 2, 125–137. [Google Scholar] [CrossRef]
- Chen, Y.; Qi, K.; Liu, Y.; He, J.; Jiang, Q. Transferability of hyperspectral model for estimating soil organic matter concerned with soil moisture. Spectrosc. Spectr. Anal. 2015, 35, 1705–1708. [Google Scholar]
- Jiang, Q.; Chen, Y.; Guo, L.; Fei, T.; Qi, K. Estimating Soil Organic Carbon of Cropland Soil at Different Levels of Soil Moisture Using VIS-NIR Spectroscopy. Remote Sens. 2016, 8, 755. [Google Scholar] [CrossRef]
- Rossel, R.V.; McGlynn, R.N.; McBratney, A. Determining the composition of mineral-organic mixes using UV–VIS–NIR diffuse reflectance spectroscopy. Geoderma 2006, 137, 70–82. [Google Scholar] [CrossRef]
- Wang, X.; Chen, Y.; Guo, L.; Liu, L. Construction of the Calibration Set through Multivariate Analysis in Visible and Near-Infrared Prediction Model for Estimating Soil Organic Matter. Remote Sens. 2017, 9, 201. [Google Scholar] [CrossRef]
- Jiang, Q.; Li, Q.; Wang, X.; Wu, Y.; Yang, X.; Liu, F. Estimation of soil organic carbon and total nitrogen in different soil layers using VNIR spectroscopy: Effects of spiking on model applicability. Geoderma 2017, 293, 54–63. [Google Scholar] [CrossRef]
- Chong, I.; Jun, C. Performance of some variable selection methods when multicollinearity is present. Chemom. Intell. Lab. 2005, 78, 103–112. [Google Scholar] [CrossRef]
- Yu, B.; Shi, K.; Hu, Y.; Huang, C.; Chen, Z.; Wu, J. Poverty evaluation using NPP-VIIRS nighttime light composite data at the county level in China. IEEE J. STARS 2015, 8, 1217–1229. [Google Scholar] [CrossRef]
- He, C.; Liu, Z.; Tian, J.; Ma, Q. Urban expansion dynamics and natural habitat loss in China: A multiscale landscape perspective. Glob. Chang. Biol. 2014, 20, 2886–2902. [Google Scholar] [CrossRef] [PubMed]
- Chen, Y.; Liu, X.; Li, X. Analyzing Parcel-Level Relationships between Urban Land Expansion and Activity Changes by Integrating Landsat and Nighttime Light Data. Remote Sens. 2017, 9, 164. [Google Scholar] [CrossRef]
- He, C.; Ma, Q.; Liu, Z.; Zhang, Q. Modeling the spatiotemporal dynamics of electric power consumption in Mainland China using saturation-corrected DMSP/OLS nighttime stable light data. Int. J. Digit. Earth 2014, 7, 993–1014. [Google Scholar] [CrossRef]
Figure 1.
Distribution of GDP in mainland China in (a) 2000 and (b) 2012.

Figure 2.
Distribution of frequency table of the entire DN series in (a) 2000 and (b) 2012.

Figure 3.
for different data mining methods: (a) MLR; (b) LWR; (c) PLSR; and (d) SVMR.

Figure 4.
for different data mining methods in validation across years.

Figure 5.
for different data mining methods in validation across years: (a) MLR; (b) LWR; (c) PLSR and (d) SVMR.
Figure 5.
for different data mining methods in validation across years: (a) MLR; (b) LWR; (c) PLSR and (d) SVMR.

Figure 6.
GDP and GDP PRED based on the estimation model of 2005.

Figure 7.
VIP scores for the entire DN series based on the estimation model.

Figure 8.
Frequency change of the entire DN series between 2000 and 2012.


Table 1.
Parameters for model performance evaluation.
| Parameter | Method | Min | Max | Mean | Std |
|---|---|---|---|---|---|
| MLR | 0.56 | 0.90 | 0.72 | 0.11 | |
| LWR | 0.66 | 0.86 | 0.75 | 0.06 | |
| PLSR | 0.67 | 0.90 | 0.84 | 0.07 | |
| SVMR | 0.75 | 0.90 | 0.85 | 0.05 | |
| MLR | 0.00 | 0.89 | 0.35 | 0.26 | |
| LWR | 0.00 | 0.98 | 0.65 | 0.29 | |
| PLSR | 0.54 | 0.95 | 0.88 | 0.07 | |
| SVMR | 0.00 | 0.97 | 0.63 | 0.32 | |
| MLR | 0.01 | 2.22 | 0.50 | 0.41 | |
| LWR | 0.07 | 7.05 | 1.27 | 1.14 | |
| PLSR | 0.24 | 4.34 | 1.76 | 0.99 | |
| SVMR | 0.14 | 4.95 | 1.50 | 1.00 |
Table 2.
Parameters for SLR performance evaluation.
| Parameter | Method | Min | Max | Mean | Std |
|---|---|---|---|---|---|
| SLR | 0.682 | 0.775 | 0.742 | 0.028 | |
| SLR | −7.07 | 0.771 | −0.198 | 1.539 |
Table 3.
Parameters for PLSR performance evaluation using important DN sections.
| Parameter | Method | NTL Dataset | Min | Max | Mean | Std |
|---|---|---|---|---|---|---|
| PLSR | Important DN sections only | 0.83 | 0.95 | 0.91 | 0.04 | |
| PLSR | Important DN sections only | 0.01 | 0.95 | 0.79 | 0.18 | |
| PLSR | Important DN sections only | 0.14 | 5.54 | 1.82 | 1.27 |
© 2017 by the authors. Licensee MDPI, Basel, Switzerland. This article is an open access article distributed under the terms and conditions of the Creative Commons Attribution (CC BY) license (http://creativecommons.org/licenses/by/4.0/).
Share and Cite
MDPI and ACS Style
Qi, K.; Hu, Y.; Cheng, C.; Chen, B. Transferability of Economy Estimation Based on DMSP/OLS Night-Time Light. Remote Sens. 2017, 9, 786. https://0-doi-org.brum.beds.ac.uk/10.3390/rs9080786
AMA Style
Qi K, Hu Y, Cheng C, Chen B. Transferability of Economy Estimation Based on DMSP/OLS Night-Time Light. Remote Sensing. 2017; 9(8):786. https://0-doi-org.brum.beds.ac.uk/10.3390/rs9080786
Chicago/Turabian StyleQi, Kun, Yi’na Hu, Chengqi Cheng, and Bo Chen. 2017. "Transferability of Economy Estimation Based on DMSP/OLS Night-Time Light" Remote Sensing 9, no. 8: 786. https://0-doi-org.brum.beds.ac.uk/10.3390/rs9080786
Note that from the first issue of 2016, this journal uses article numbers instead of page numbers. See further details here.