Article

Canopy-Level Photochemical Reflectance Index from Hyperspectral Remote Sensing and Leaf-Level Non-Photochemical Quenching as Early Indicators of Water Stress in Maize

1
Jiangsu Provincial Key Laboratory of Geographic Information Science and Technology, International Institute for Earth System Science, Nanjing University, Nanjing 210023, China
2
School of Geographic and Oceanographic Sciences, Nanjing University, Nanjing 210023, China
3
Department of Geography and Program in Planning, University of Toronto, Toronto, ON M5S 3G3, Canada
4
Department of Geography, Government College University, Faisalabad 38000, Pakistan
5
School of Applied Meteorology, Nanjing University of Information Science & Technology, Nanjing 210044, China
6
Institute of Botany, Jiangsu Province and Chinese Academy of Sciences, Nanjing 210014, China
*
Author to whom correspondence should be addressed.
Submission received: 13 June 2017 / Revised: 21 July 2017 / Accepted: 28 July 2017 / Published: 2 August 2017
(This article belongs to the Section Remote Sensing in Agriculture and Vegetation)

Abstract

:
In this study, we evaluated the effectiveness of photochemical reflectance index (PRI) and non-photochemical quenching (NPQ) for assessing water stress in maize for the purpose of developing remote sensing techniques for monitoring water deficits in crops. Leaf-level chlorophyll fluorescence and canopy-level PRI were measured concurrently over a maize field with five different irrigation treatments, ranging from 20% to 90% of the field capacity (FC). Significant correlations were found between leaf-level NPQ (NPQleaf) and the ratio of chlorophyll to carotenoid content (Chl/Car) (R2 = 0.71, p < 0.01) and between NPQleaf and the actual photochemical efficiency of photosystem II (ΔF/Fm′) (R2 = 0.81, p < 0.005). At the early growing stage, both canopy-level PRI and NPQleaf are good indicators of water stress (R2 = 0.65 and p < 0.05; R2 = 0.63 and p < 0.05, respectively). For assessment of extreme water stress on plant growth, a relationship is also established between the quantum yield of photochemistry in PSII (ΦP) and the quantum yield of fluorescence (ΦF) as determined from photochemical quenching (PQ) and non-photochemical quenching (NPQleaf) of excitation energy at different water stress levels. These results would be helpful in monitoring soil water stress on crops at large scales using remote sensing techniques.

Graphical Abstract

1. Introduction

The frequency and severity of drought will increase in the near future due to climate change [1,2]. Severe drought will significantly reduce crop yields [3,4,5]. Therefore, it is important to monitor drought in croplands at regional scales, which can be achieved using remote sensing techniques [6,7,8,9,10].
Spectral signals are shown to be particularly sensitive to changes in leaf pigment contents which can be related to water stress. The photochemical reflectance index (PRI) and leaf-level chlorophyll fluorescence parameters (i.e., non-photochemical quenching (NPQ) and steady-state fluorescence) are two promising indicators of plant physiological performance under water stress [11,12]. PRI is based on reflected radiance or reflectance in two narrow spectral bands centered at 531 nm and 570 nm, and it tracks the diurnal changes in photosynthetic efficiency [13,14]. The sensitivity of PRI to water stress has been proven in recent years at both leaf and canopy levels [7,10,13,14,15]. At the leaf scale, PRI is related to the de-epoxidation cycle of xanthophyll and to heat dissipation that increases under water stress conditions [13,16]. At the canopy scale, PRI has been shown to indicate water stress at early growing stages in maize before structural changes [8]. However, the ability of PRI to detect water stress is confounded by many external factors, i.e., the viewing and illumination geometry [7,17], canopy structure [10,18], and meteorological conditions [19,20]. Thus, the leaf-level measurements of chlorophyll florescence (the non-photochemical quenching and the steady-state fluorescence) was explored as an alternative to detecting plant water stress.
During the process of photosynthesis, non-photochemical quenching (NPQ) in a leaf changes rapidly in order to dissipate the excess energy that cannot be used in photosynthesis [11,12,18,21,22,23]. NPQleaf is attributed to a number of processes that involve xanthophyll cycle pigments and especially zeaxanthin (Z). Some photosystem II (PSII) proteins are protonated, and violaxanthin (V) molecules are released and de-epoxidated to zeaxanthin and antheraxanthin (A). Zeaxanthin binds to proteins in PSII, where it forms a quenching complex that favors the dissipation of excitation energy as heat [24]. Soil water stress would induce a decrease of leaf stomatal conductance with a consequent reduction of the transpiration rate and an increase in leaf temperature [25,26]. Ni et al. (2015) used both temperature and steady-state fluorescence (Fs) data to study soil water stress on maize in the early growing stages and found that chlorophyll fluorescence could reflect variations in the physiological states of plants during early water stress, and that leaf temperature became more elevated than air temperature at higher levels of soil water stress [25]. The quantum yield of non-cyclic electron transport has been shown to be proportional to the efficiency in capturing excited electrons by opening PSII reaction centers (Fv′/Fm′) as well as the photochemical quenching (PQ) [11]. The responses of fluorescence to water stress are pronounced in plants. Therefore, the steady-state fluorescence can be used to indicate water stress [27].
Despite progress made by previous studies, the following issues are still not yet clear: (1) The relationships among the quantum yield of photochemistry in PSII (ΦP), the quantum yield of non-photochemical quenching (ΦN), the quantum yield of fluorescence (ΦF) and constitutive heat dissipation (ΦD) at different water stress levels; (2) The effectiveness of canopy-level PRI (PRIcanopy) and leaf-level NPQ (NPQleaf) for detecting water stress in crops; and (3) Relationships between ΦP and ΦF as affected by PQ and NPQleaf of excitation energy at different water stress levels, especially at high stress levels. Water is a fundamental ingredient of plant photosynthesis, and water stress is destructive to the photosynthetic apparatus of plants, i.e., PS II [28]. Changes of the light-harvesting pigment protein complexes may cause decreases in photosynthetic efficiency. NPQleaf and PQ are the main indicators of the damage in PS II caused by water stress [12,29,30]. Many researchers have discussed these two indicators, but the results are not consistent. Many studies [12,30,31] showed that NPQleaf increased with water stress at different rates, while the response of PQ to water stress is either insignificant [12,30] or weak [31]. Conflicting results were reported in the literature regarding the effect of water stress on PQ. PQ was observed to decrease under water stress in some studies (i.e., Sorghum bicolor and Setaria sphacelata) [32,33]. A consistent investigation with a large range of water stress would therefore help to understand the effectiveness of both PQ and NPQleaf for water stress assessment.
Through conducting a set of field measurements on maize grown under a wide range of soil water conditions, we attempted to address the following research objectives:
(1)
To establish the relationships among ΦP, ΦN, ΦF, and ΦD at different levels of the soil water stress.
(2)
To measure the ratio between chlorophyll and carotenoid pigment contents and to establish their relationships with NPQleaf and PRI at different levels of soil water stress.
(3)
To analyze the feasibility of detecting soil water stress in maize using leaf-level NPQ and canopy-level PRI.

2. Materials and Methods

Field investigation took place in an experimental field of the Nanjing University of Information Science & Technology (NUIST) (31°20’N, 118°70’E). The mean annual temperature is approximately 15.4 °C and the mean annual total infiltration rate is around 1106 mm. The soil texture is loamy clay and clay loam. The maximum water holding capacity is 27.6%. The maize was planted on 6 July, 2015 (DOY 187) on a 90 m2 (0.009 ha) area. A field campaign was conducted on 13 and 14 August, 2015, around 37 days after planting when plants were in the stage of stem elongation [34]. Concurrent measurements were made on leaf-level chlorophyll fluorescence and canopy-level PRI over a maize field with five different irrigation treatments, ranging from 20% to 90% of the field capacity (FC): (1) W1: 20% FC < SWC < 35% FC; (2) W2: 35% FC < SWC < 45% FC; (3) W3: 50% FC <SWC < 60% FC; (4) W4: 65% FC < SWC < 75% FC; and (5) W5: 80% FC < SWC < 90% FC. There were two group treatments with a plot size of 3 m × 3 m. A total of 10 plots were employed in this study, and the spatial distribution of theses plots was randomly determined (See Figure A1: Layout of the experimental site). These treatments were made immediately after planting and maintained for the whole growing season. Mobile rainfall shelters were used to block precipitation on these plots, and frequent irrigation was made to maintain the soil moisture within a small range of the target value within each plot. A Diviner 2000 capacitance probe (Sentek Environmental Technologies, Stepney, Australia) and a time domain reflectometry (TDR) (IMKO GmbH, Ettlingen, Germany) system were installed in each plot to automatically measure and record soil moisture data hourly. The required irrigation amount was then calculated and the plot was automatically irrigated using PVC pipes of small pores. The TDR instruments were calibrated using a gravimetric method. At the beginning of the experiment by taking the soil core to the depth of 0.7 m and drying the samples at 100 °C for 24 h before weighing. Measurements were recorded with a data logger (IMKO GmbH, Ettlingen, Germany) using TDR probes with an intelligent microelement system (TRIME). There were four HOBO U12 (Onset Computer Corp, Bourne, MA, USA) micro-loggers in every plot (See Figure A2). HOBO micro-loggers were used to record soil temperature data measured in the plots. Leaf temperature was measured using the Testo 845 infrared thermometer (Testo AG, Lenzkirch, Germany). We set the emissivity at 0.99 with an accuracy of ±0.75 °C between −35 and +75 °C. The leaf temperature was recorded at a time consistent with the other measurements to ensure the accuracy and comparability of the experimental results.

2.1. Leaf Biochemistry and Leaf Area Index Measurements

Leaves were sampled from the upper, middle, and lower parts of the maize canopies, i.e., the first leaf, the fourth leaf and the sixth leaf from the top. During the experimental period, each maize plant had 7 leaves on average. From each plot, three leaves were sampled during the early growing stages. We designed an experiment to test if the temperature of sampled leaves would affect the leaf chlorophyll content to be subsequently measured in the laboratory. We put the leaf samples into four fridges set at the temperatures of 25 °C, 0 °C, −5 °C, −20 °C, respectively, for one hour before the subsequent extraction of the leaf chlorophyll. We found that the leaf chlorophyll content measured at 25 °C was lower than the other treatments. However, there were no significant differences among the other three treatments. Thus, leaf samples were sealed in plastic bags and kept in an ice box at about 0 °C for subsequent biochemical analysis to extract the leaf chlorophyll and carotenoid contents. We first punched around 6 leaf discs of known area (~2.54 cm2), and they were grinded into homogenate until the tissue became white in a mortar with quartz sand, CaCO3 powder and 2–3 mL ethanol of 95%. The homogenate and the residue were filtered into a brown volume bottle of 10 mL for the subsequent absorbance measurements. Spectral absorbance was measured at 470 nm, 649 nm, and 665 nm using a Shimadzu UV-1700 spectrophotometer (Shimadzu Inc., Kyoto, Japan) [35]. The ratio of chlorophyll to carotenoid (Chl/Car) is calculated as the sum of chlorophyll A and B divided by the sum of all carotenoids. Leaf area index (LAI) and canopy structural parameters were measured on the same days as leaf sampling. Effective LAI (Le) measurements were obtained using the LAI-2200 plant canopy analyzer (LI-COR, Lincoln, NE, USA), following the methods outlined by Chen et al. (1997) [36]. The LAI-2200 field of view was limited with a 90° view-cap, to minimize the influence of the operator and the adjacent plots. The LAI value was calculated by averaging five data points taken across the crop row, i.e., derived from one A value (above the canopy) and five B values (below the canopy).

2.2. Leaf-Level Fluorescence Measurements

Field measurements of the leaf-level NPQ and net photosynthesis rate (Pn) were carried out using a LI-6400 with an integrated leaf chamber fluorometer (LCF) (LI-COR, Lincoln, NE, USA) on maize plants during the early growing stage in 2015. All leaf fluorescence data were taken within 1 h between 11:00 a.m. and 12:00 p.m. in sunny conditions. We set LI-6400 under the same light intensity to measure leaf-level chlorophyll fluorescence in the 10 plots. Then, we collected the fluorescence data and canopy spectral data at approximately the same time. We measured chlorophyll fluorescence of three leaves (at the top, middle and bottom of the canopy, respectively) of a plant in each plot. As mentioned above, one leaf was chosen for each canopy position (i.e., top, middle and bottom) and each leaf were measured twice (two repetitions). Thus, six leaf-level measurements were made per plot of watering treatment on each date. We mean is one leaf per canopy position. This is the case also for eco-physiological measurements. The measured plant was within the field of view of canopy spectral measurements. Pn is the gross rate of photosynthetic CO2 fixation minus the rate of loss of CO2 due to leaf dark respiration. Fs is the fluorescence yield under environmental illumination measured before the saturation pulse and it represents the fluorescence during the steady-state of photochemical processes. Fo is the primary chlorophyll fluorescence yield recorded under low measuring light intensities, and Fm is the maximum chlorophyll fluorescence yield when a saturation pulse closed the PSII reaction centers. After a night of dark adaptation, both Fo and Fm were measured using LI-6400 from 3:00 a.m. to 4:00 a.m. Fo was measured with weak modulated irradiation (<0.1 µmol/(m2 s)), and A 600 ms saturating flash (>7000 µmol/(m2 s)) was used to determine the Fm. After which the leaf was continuously illuminated with a red-blue actinic light (1800 µmol/(m2 s)) to record fluorescence intensity of Fs. Following this, another saturation flash (7000 µmol/(m2 s)) was applied, and then maximal fluorescence intensity at actinic light (Fm′) was determined. After the flash, actinic light was removed and far-infrared light was applied, and then minimal fluorescence intensity at actinic light (Fo′) was measured. Fm and Fm′ were measured at the same leaf portion. The fraction of absorbed photons that are used for photochemistry for a dark-adapted leaf, is usually written as Fv/Fm. For maize, Fv/Fm is between 0.75 and 0.85. During measurement, the displayed value of dF/dt on the instrument was monitored for its stability. When the absolute value of dF/dt < 5, the rate of change of the fluorescence signals was considered to be stable over the past 10 s. During the measurement, the air temperature in the leaf chamber was maintained as close to 25 °C as possible and the relative humidity was kept between 40–80% and the CO2 concentration was kept at around 400 ppm. NPQleaf was calculated according to Bilger and Bjorkman (1990) as Fm/Fm′ − 1 (where Fm′ is the maximum fluorescence of the sample under environmental illumination) [37], and the actual photochemical efficiency of PSII is calculated as ΔF/Fm′ = (Fm′ − Fs)/Fm′ [11].
In previous studies [38,39,40], the definition of the quantum yield of photochemistry in PSII (ΦP) was used to assess the allocation of light absorbed by PSII antennae to photosynthetic electron transport in maize. It can be expressed as:
ϕ P = k p k f + k d + k p + k n
in which kf is the effective rate constants of fluorescence, kd is the effective rate of constitute heat dissipation, kp is the effective rate of photochemistry, and kn is the effective rate constants of non-photochemical quenching.
ΦP can also be expressed as:
ϕ P = 1 F s F m
in which Fs is defined as F s = k f k f + k d + k p + k n , and Fm′ is defined as F m = k f k f + k d + k n .
ϕ F + ϕ D = k f + k d k f + k d + k p + k n
Photons absorbed by PSII antennae can be emitted by the quantum yield of fluorescence (ΦF), the quantum yield of photochemistry in PSII (ΦP), the quantum yield of non-photochemical quenching (ΦN) and the constitutive heat dissipation (ΦD). The sum of ΦF and ΦD can be expressed as:
ϕ F + ϕ D = F s F m
The fraction of photons absorbed by PSII antennae that are dissipated thermally through xanthophyll-cycle processes can be expressed as:
Where F s = k f k f + k d + k p + k n , F m = k f k f + k d , and F m = k f k f + k d + k n . Thus, ΦN is
ϕ N = k n k f + k d + k p + k n

2.3. Canopy Spectral Data Collection

Meteorological data, including air temperature, humidity and global solar radiation, were measured at the NUIST weather station. Spectral reflectance data (350 nm to 2500 nm) were measured using an ASD FieldSpec 3 Spectroradiometer (SR = 3 nm, SSI = 1 nm, SNR > 4000, Analytical Spectral Devices, Boulder, CO, USA) in the 10 plots of maize under five water stress levels. All spectral measurements were made at 11:00 a.m. in sunny conditions. We used the ASD spectrometer held at 4 m above the ground by a supporting mobile system (Figure A3) to measure the spectral data of the maize canopy of the 10 sample plots in the nadir direction. The hyperspectral data were acquired within 15 min during clear days to minimize variations in the solar zenith angle. We assume that the light intensity of the solar radiation would not change significantly within 15 min during the clear days. Thus, we can compared the canopy spectral data of different plots. The field of view of the fiber of the ASD spectrometer was set as 25° when used to measure the canopy spectra (DN value). The integration time was adjusted with the fiber-optic exposed to white reference conditions so that the peak of spectrum would not saturate. A white reference scanning and a dark scanning were made before the spectral data measurements over each plot. The white reference panel was supported by a holder located under the spectrum probe, and the probe is perpendicular to the white panel for the subsequent white reference scanning. The surface of the white reference panel is sulphate barium, which has a reflectance of 99%. Spectral data were acquired in multiples of five for each plot, and the results were then averaged to give a final spectral reflectance spectrum. Before recording the spectra of a target, the dark current (DC) and white references values were collected to convert radiance to reflectance [41]. The hyperspectral data were sampled within a 15 min time frame to minimize variations in the solar zenith angle. There is no need for angle correction because spectral observation was finished in 15 min in which the variation of solar zenith angle was small. The observation angle of the instrument was fixed at nadir. We used the 4 m holder to measure the spectral data of the maize canopy for each plot. The PRI was calculated from the measured canopy hyperspectral data as follows:
P R I ( t ) = R e f ( t , λ = 531 ) R e f ( t , λ = 570 ) R e f ( t , λ = 531 ) + R e f ( t , λ = 570 )
where PRI(t) is PRI at a given time t, Ref is the reflectance of two wavelengths of 531 and 570 nm with a wavelength width of 1 nm at time t.

3. Results

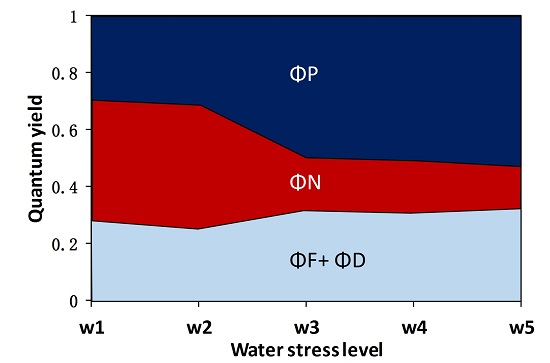
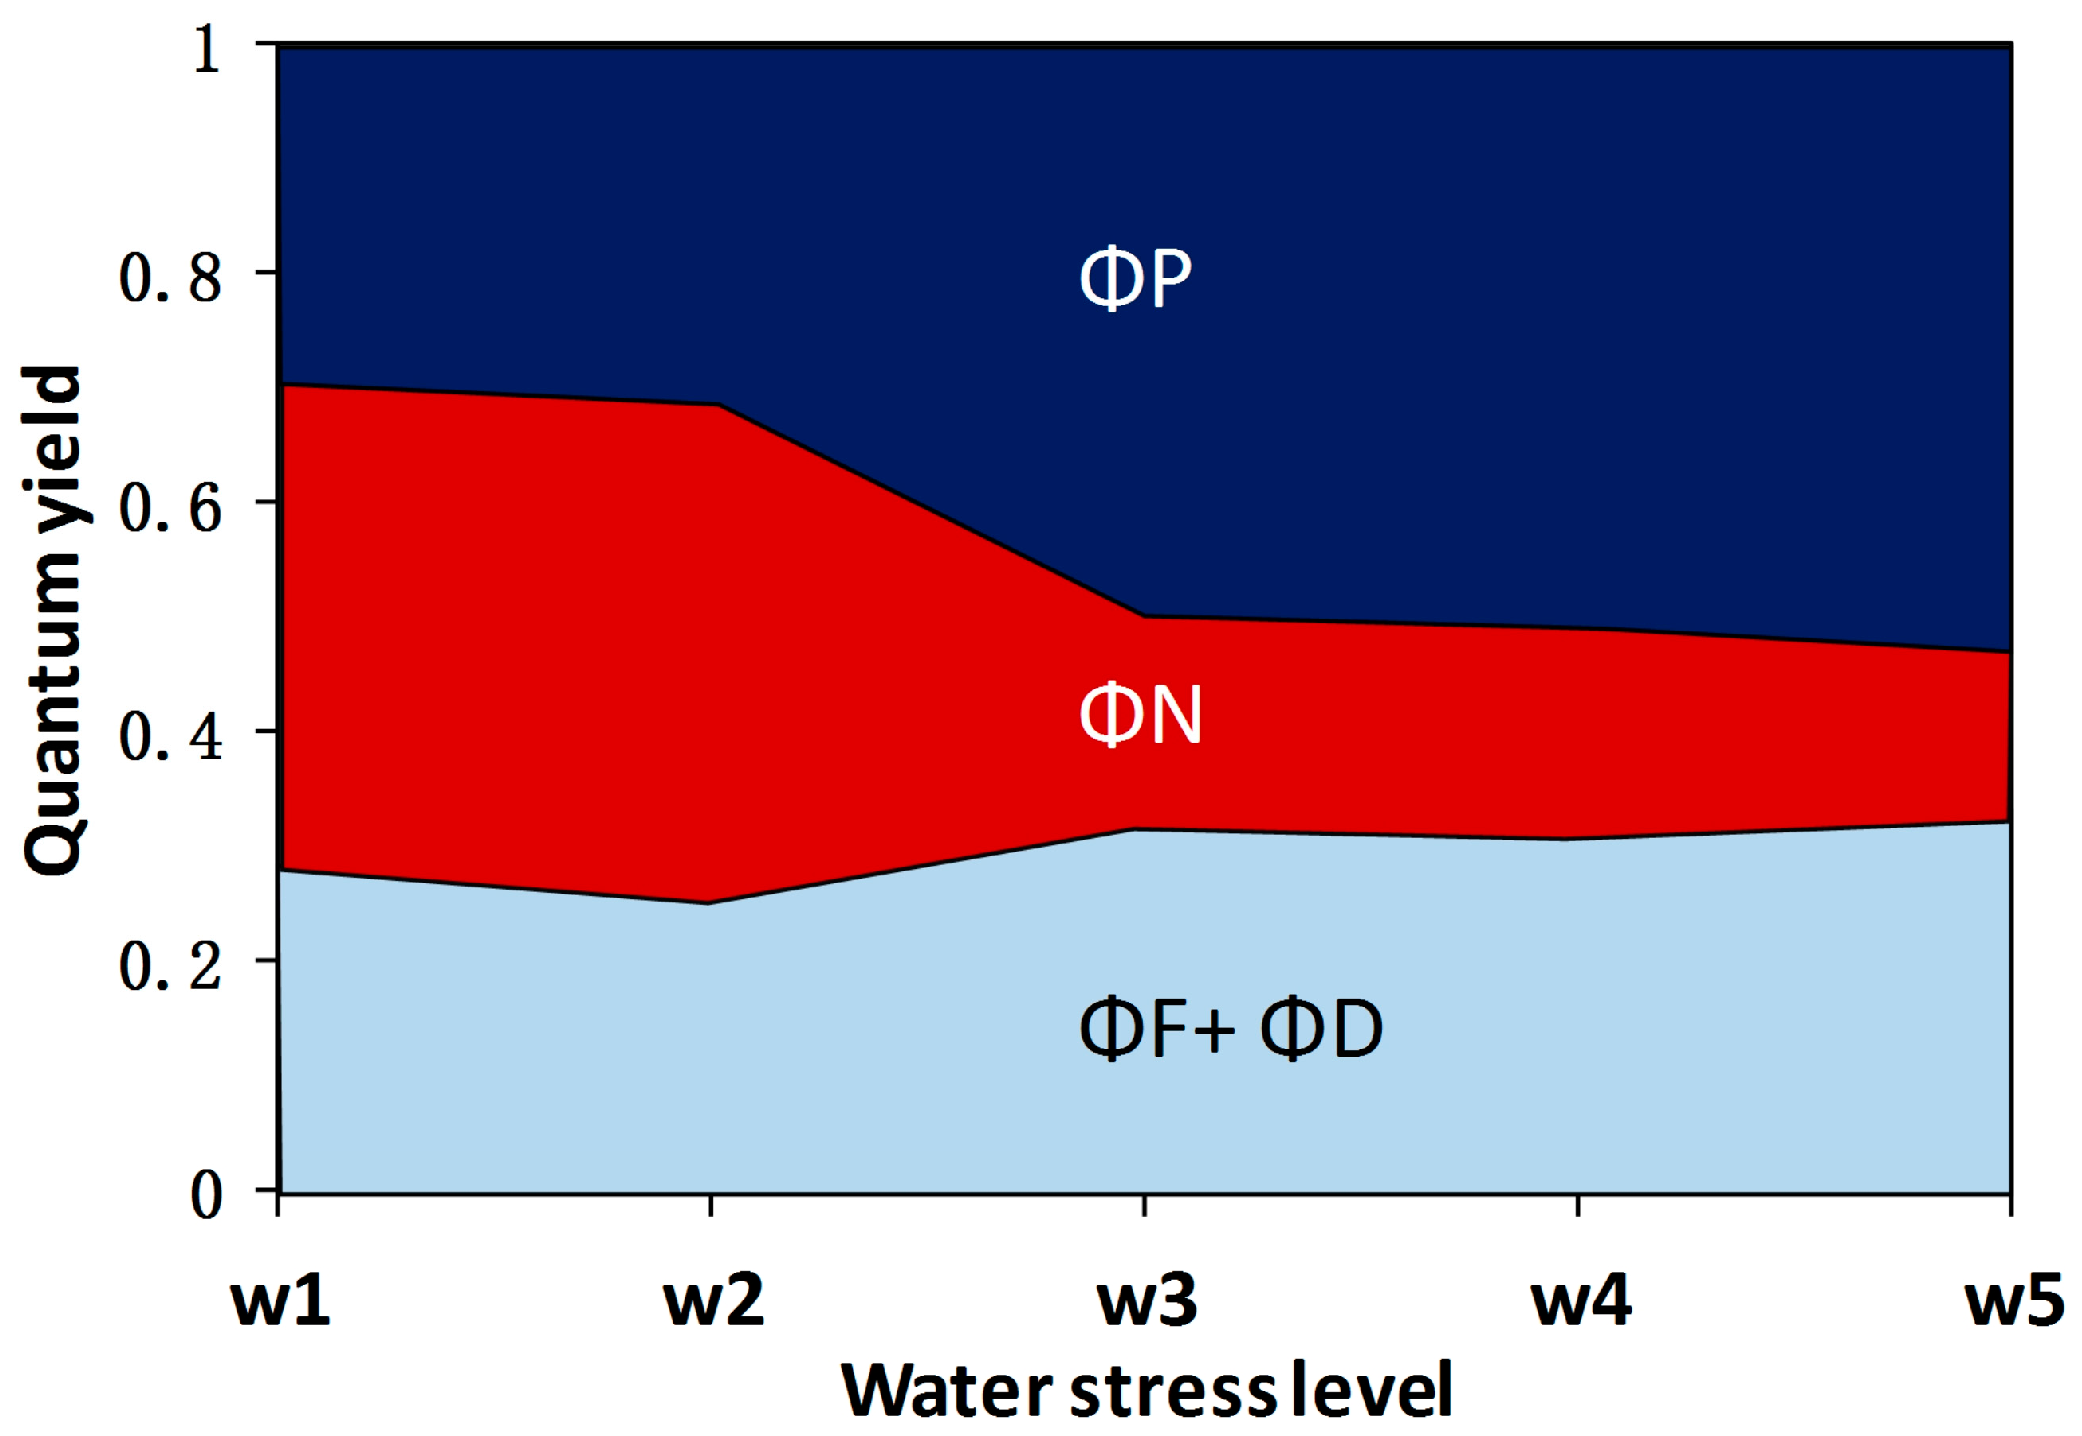
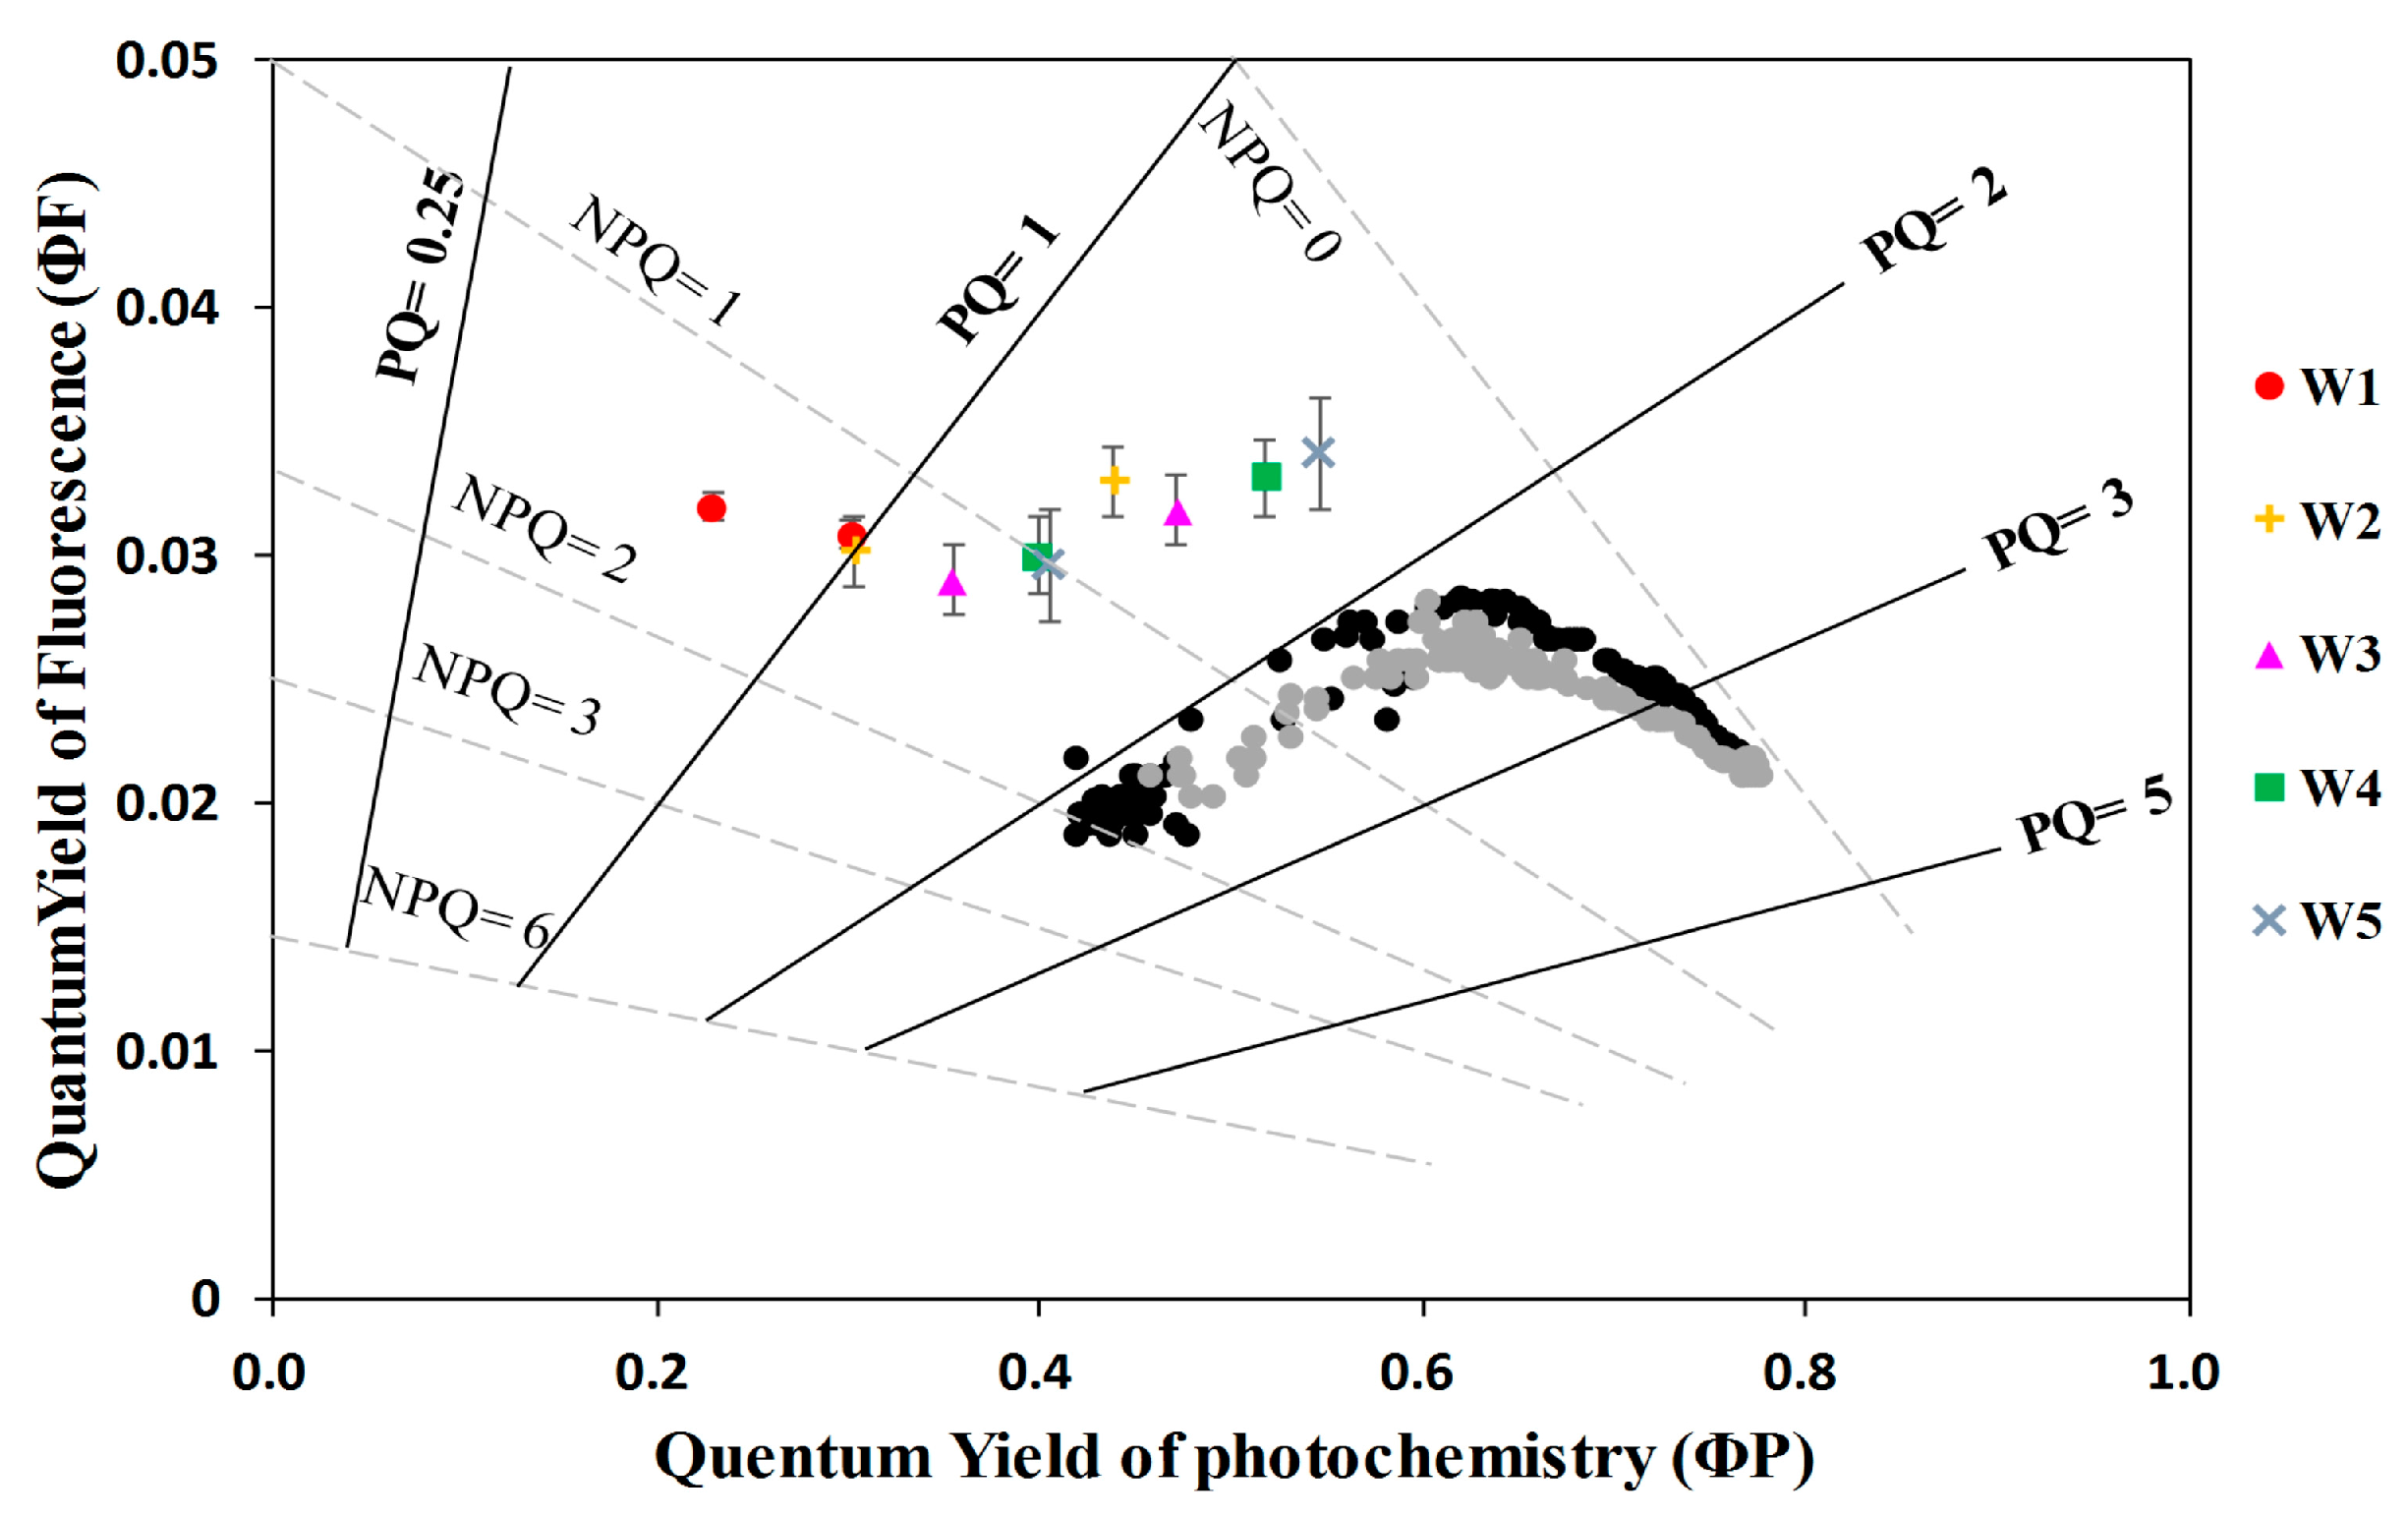
3.1. The Fate of Light Absorbed by a Leaf at Different Water Stress Levels

Quenching is the reduction in fluorescence induced by the competing processes. The processes are photochemistry, energy-dependent heat dissipation, constitutive (un-regulated) dissipation, and fluorescence. The adjustments in the relative quantum yields of photochemistry in PSII (ΦP), the quantum yield of non-photochemical quenching (ΦN), the quantum yield of fluorescence (ΦF) and constitutive heat dissipation (ΦD) at different water stress levels (Figure 1).
The variations of ΦP, ΦN and the sum of ΦF and ΦD with water stress were shown in Figure 1. It was found that ΦP increased as the water stress decreased. At the lowest level of water stress (W5), ΦP was around 0.5, while it is around 0.3 at the highest level of water stress (W1). ΦF + ΦD decreased a little bit with increasing water stress. However, when plants grown at the highest water stress levels of W1 and W2, ΦN was highest, and it appeared to decrease with decreasing water stress.

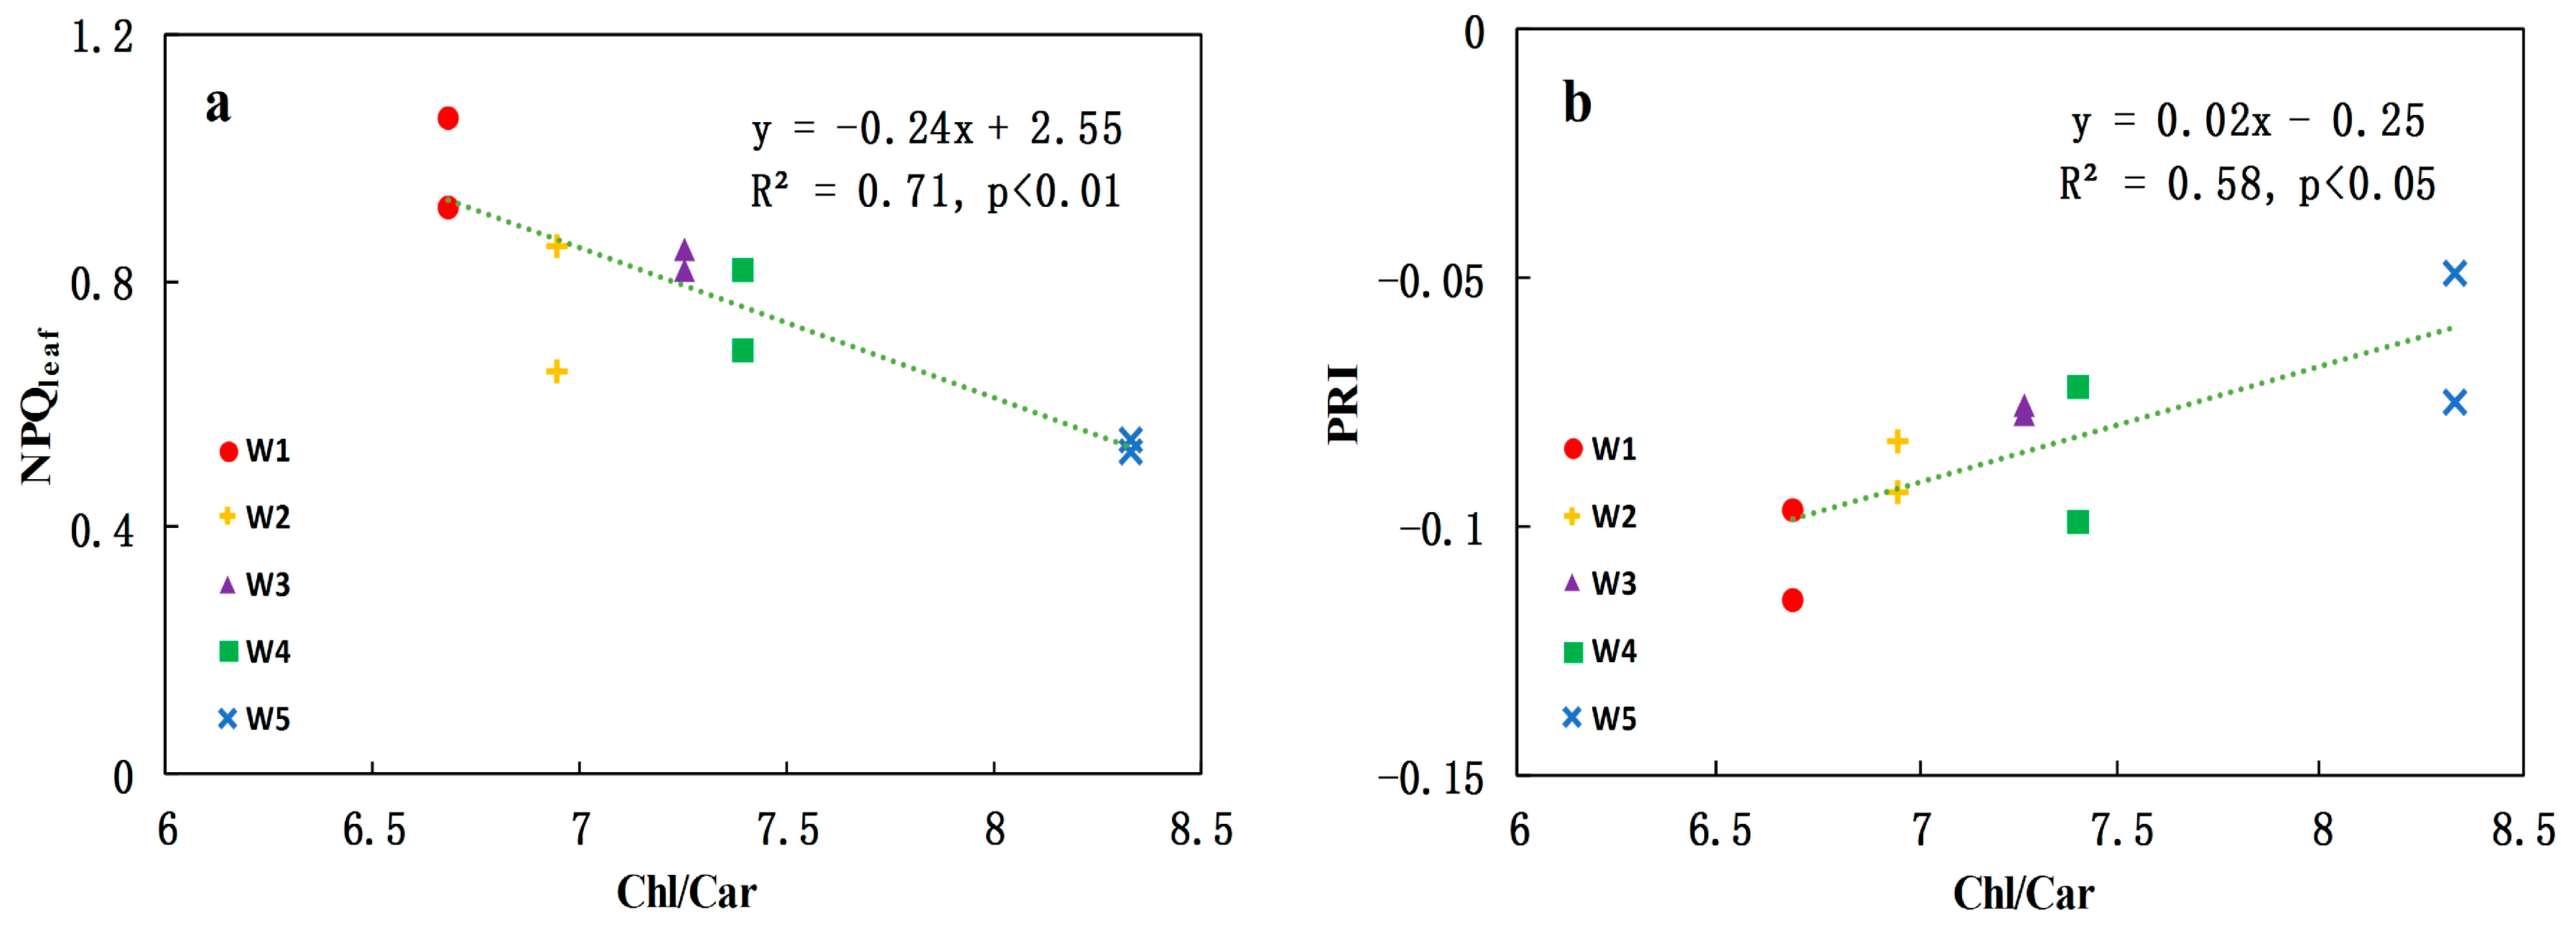
3.2. Relationships between Leaf-Level NPQ and Leaf Pigment Ratios under Water Stress

The ratio of chlorophyll to carotenoid (Chl/Car) was explored as an indicator of the relative change in leaf pigment levels (Figure 2). The Chl/Car ratio reflected the change of pigments in plant leaves. Moreover, carotenoids are a kind of pigments that are related to the non-photochemical quenching process.
A strong correlation was found between Chl/Car and NPQleaf under different water stress levels (R2 = 0.71, p < 0.01) (Figure 2a). A key heat dissipation process employed by plants in their natural environment is mediated by a particular group of carotenoids [42]. The Chl/Car ratio represents the change in the content of pigments in leaf cells. Figure 2b shows a strong relationship between measured Chl/Car and PRI at different water stress levels (R2 = 0.58, p < 0.05) (Figure 2b). Under water stress, the carotenoid content increased while the chlorophyll content decreased, leading to a decrease in the Chl/Car ratio. Correspondingly the value of PRI also decreased. Therefore, there was a positive relationship between Chl/Car and PRI (Figure 2b). The carotenoid content in leaves is also related to the non-photochemical quenching process. When it is small, the value of Chl/Car is large and NPQleaf is small. Leaf chlorophyll and carotenoid contents are not good indicators of water stress, because leaf chlorophyll pigments do not have direct response to water stress. Instead, leaf chlorophyll content is highly related to illumination [28], leaf nitrogen and RuBisCo (ribulose 1, 5-bisphosphate carboxylase/oxygenase) enzyme [43]. When water stress increased, carotenoid content increased while the chlorophyll content remained constant or decreased, leading to the decrease in the Chl/Car ratio. Therefore, these pigments deserve close attention in water stress assessment.

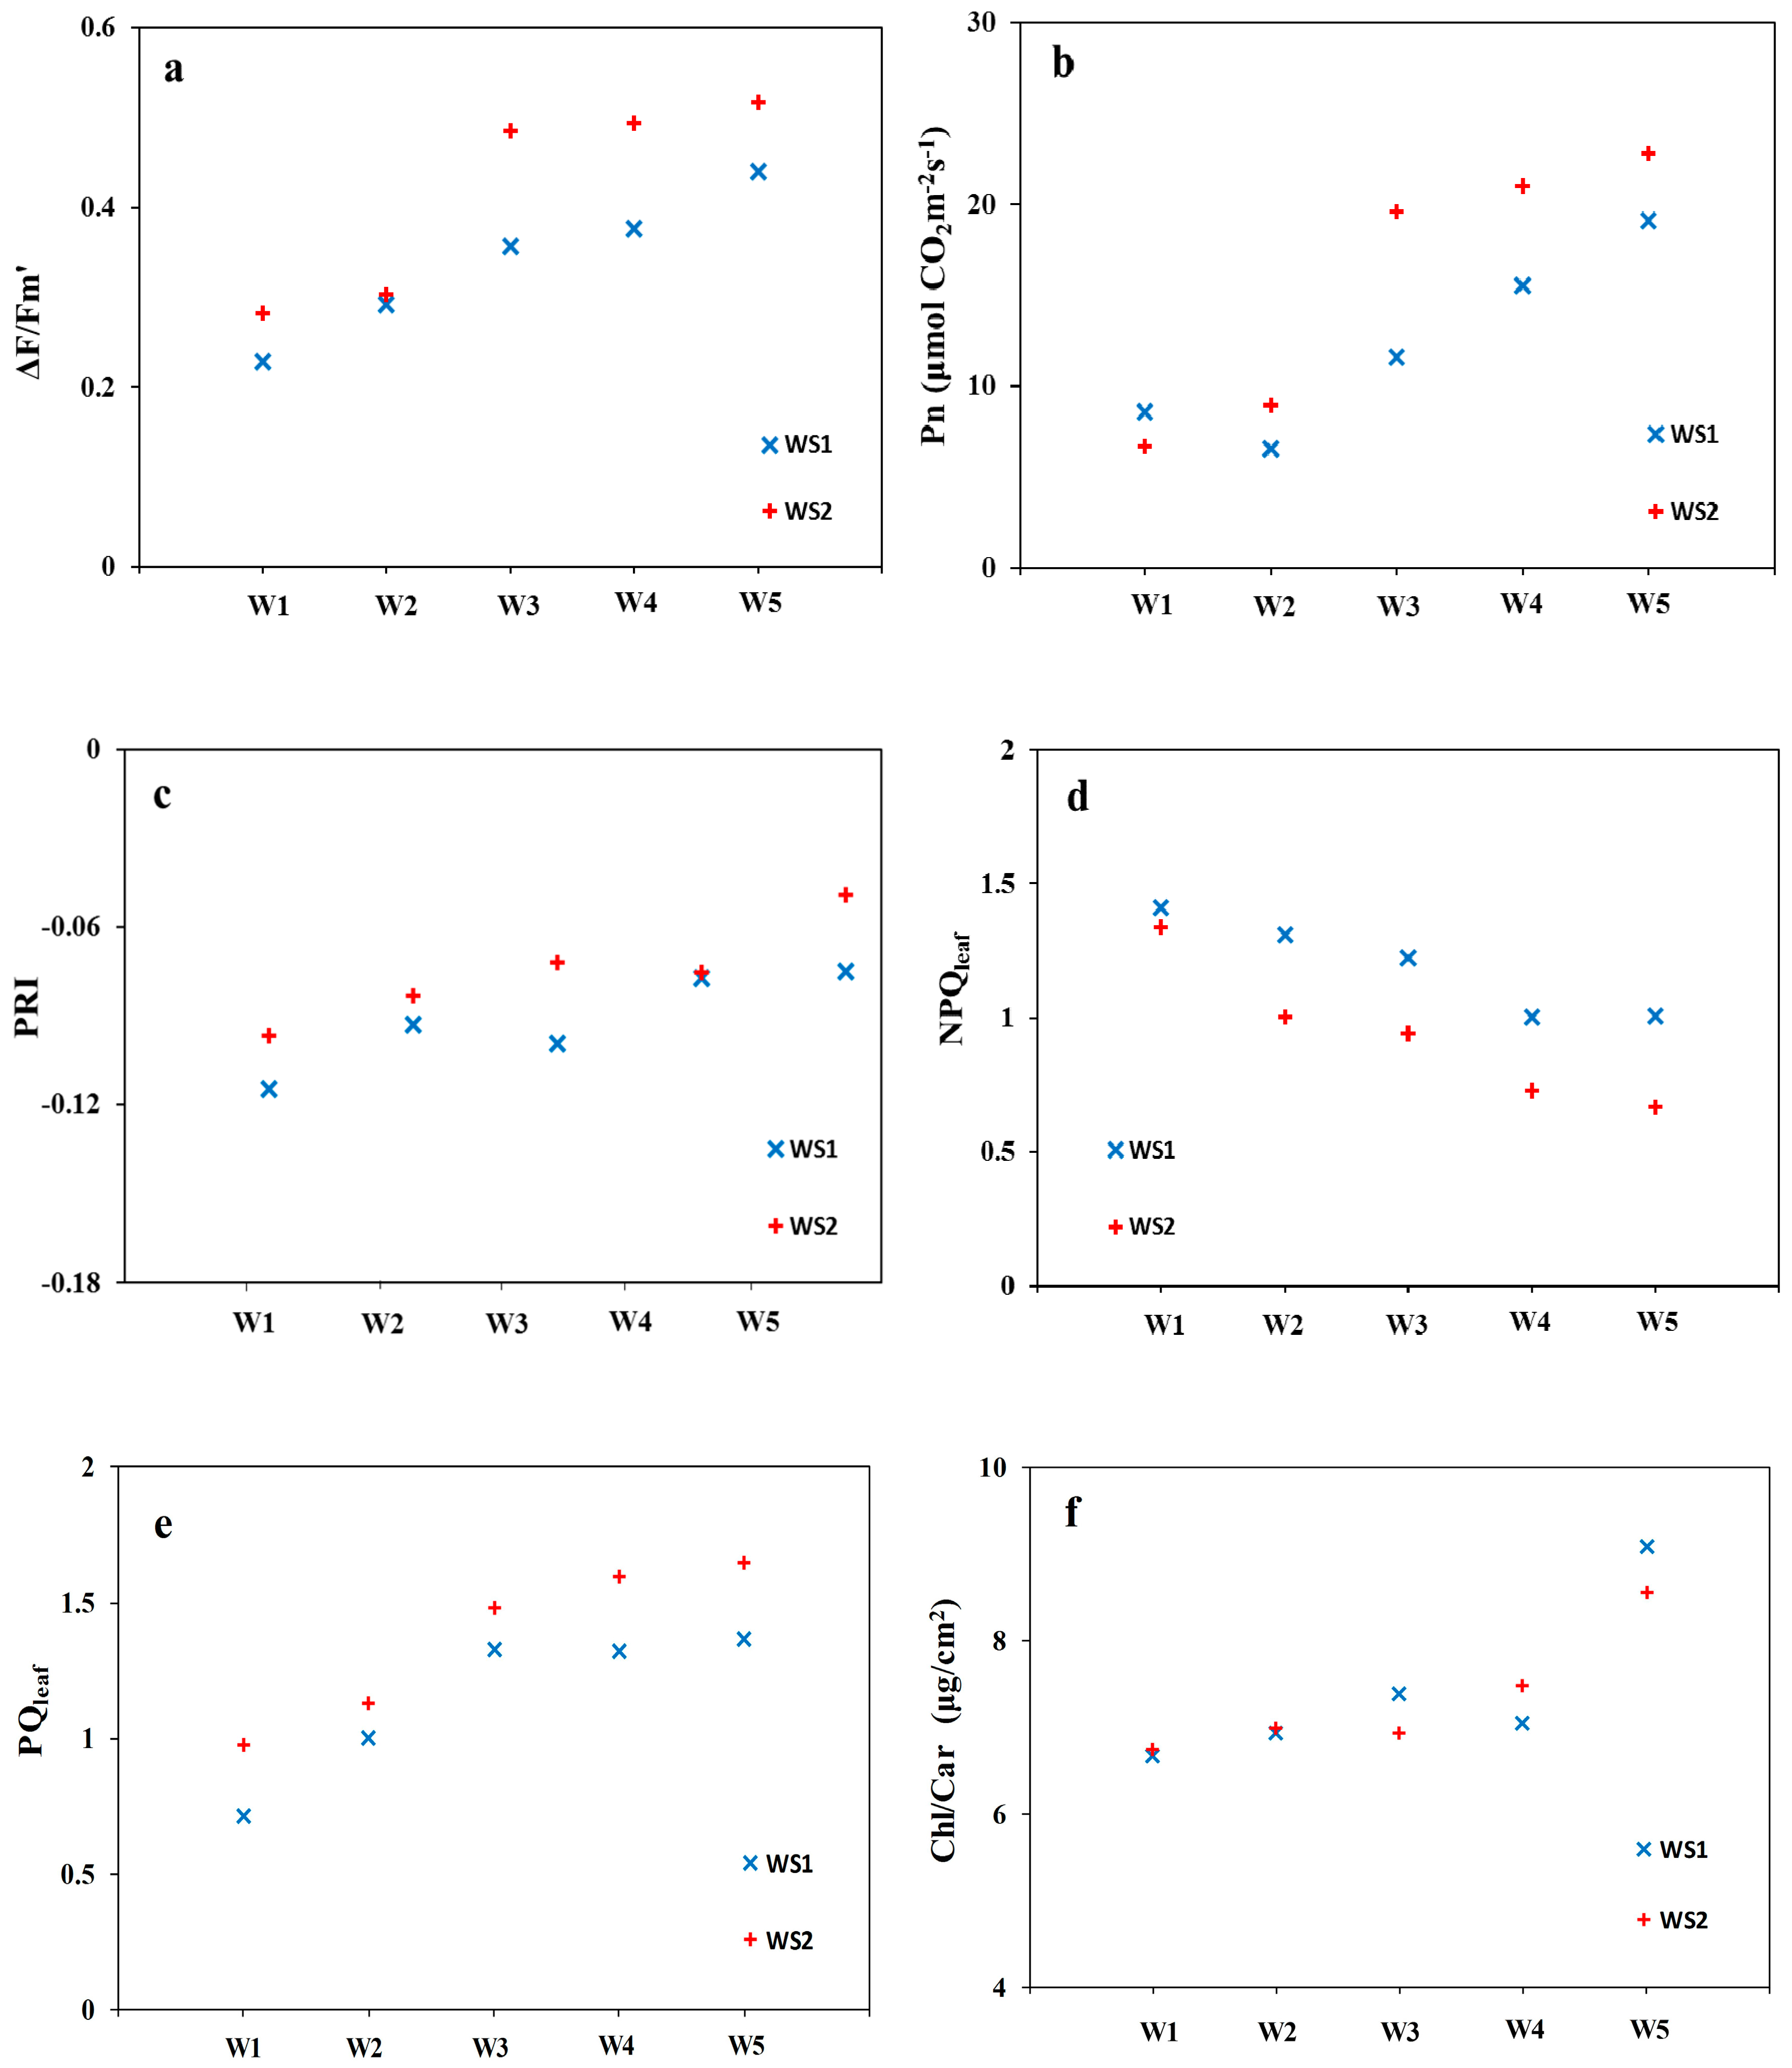
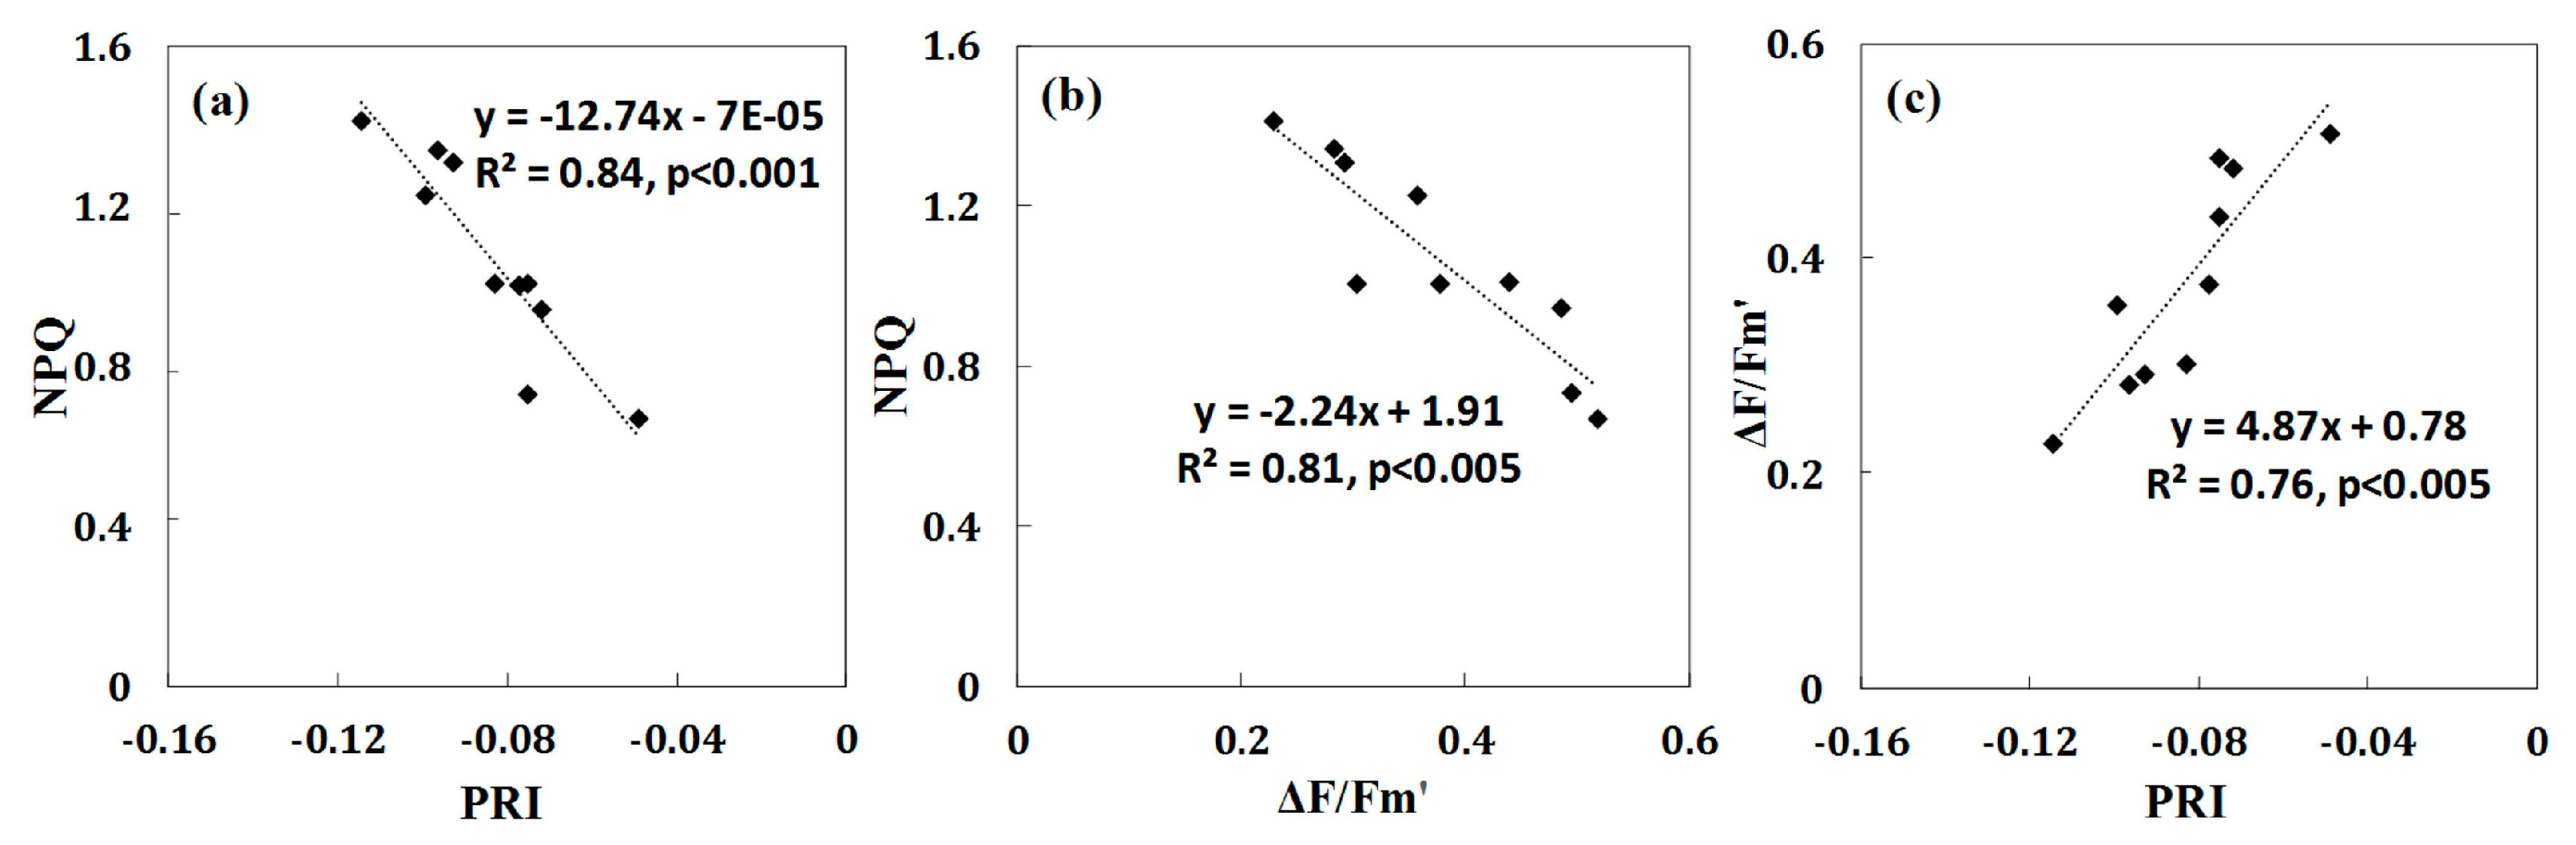
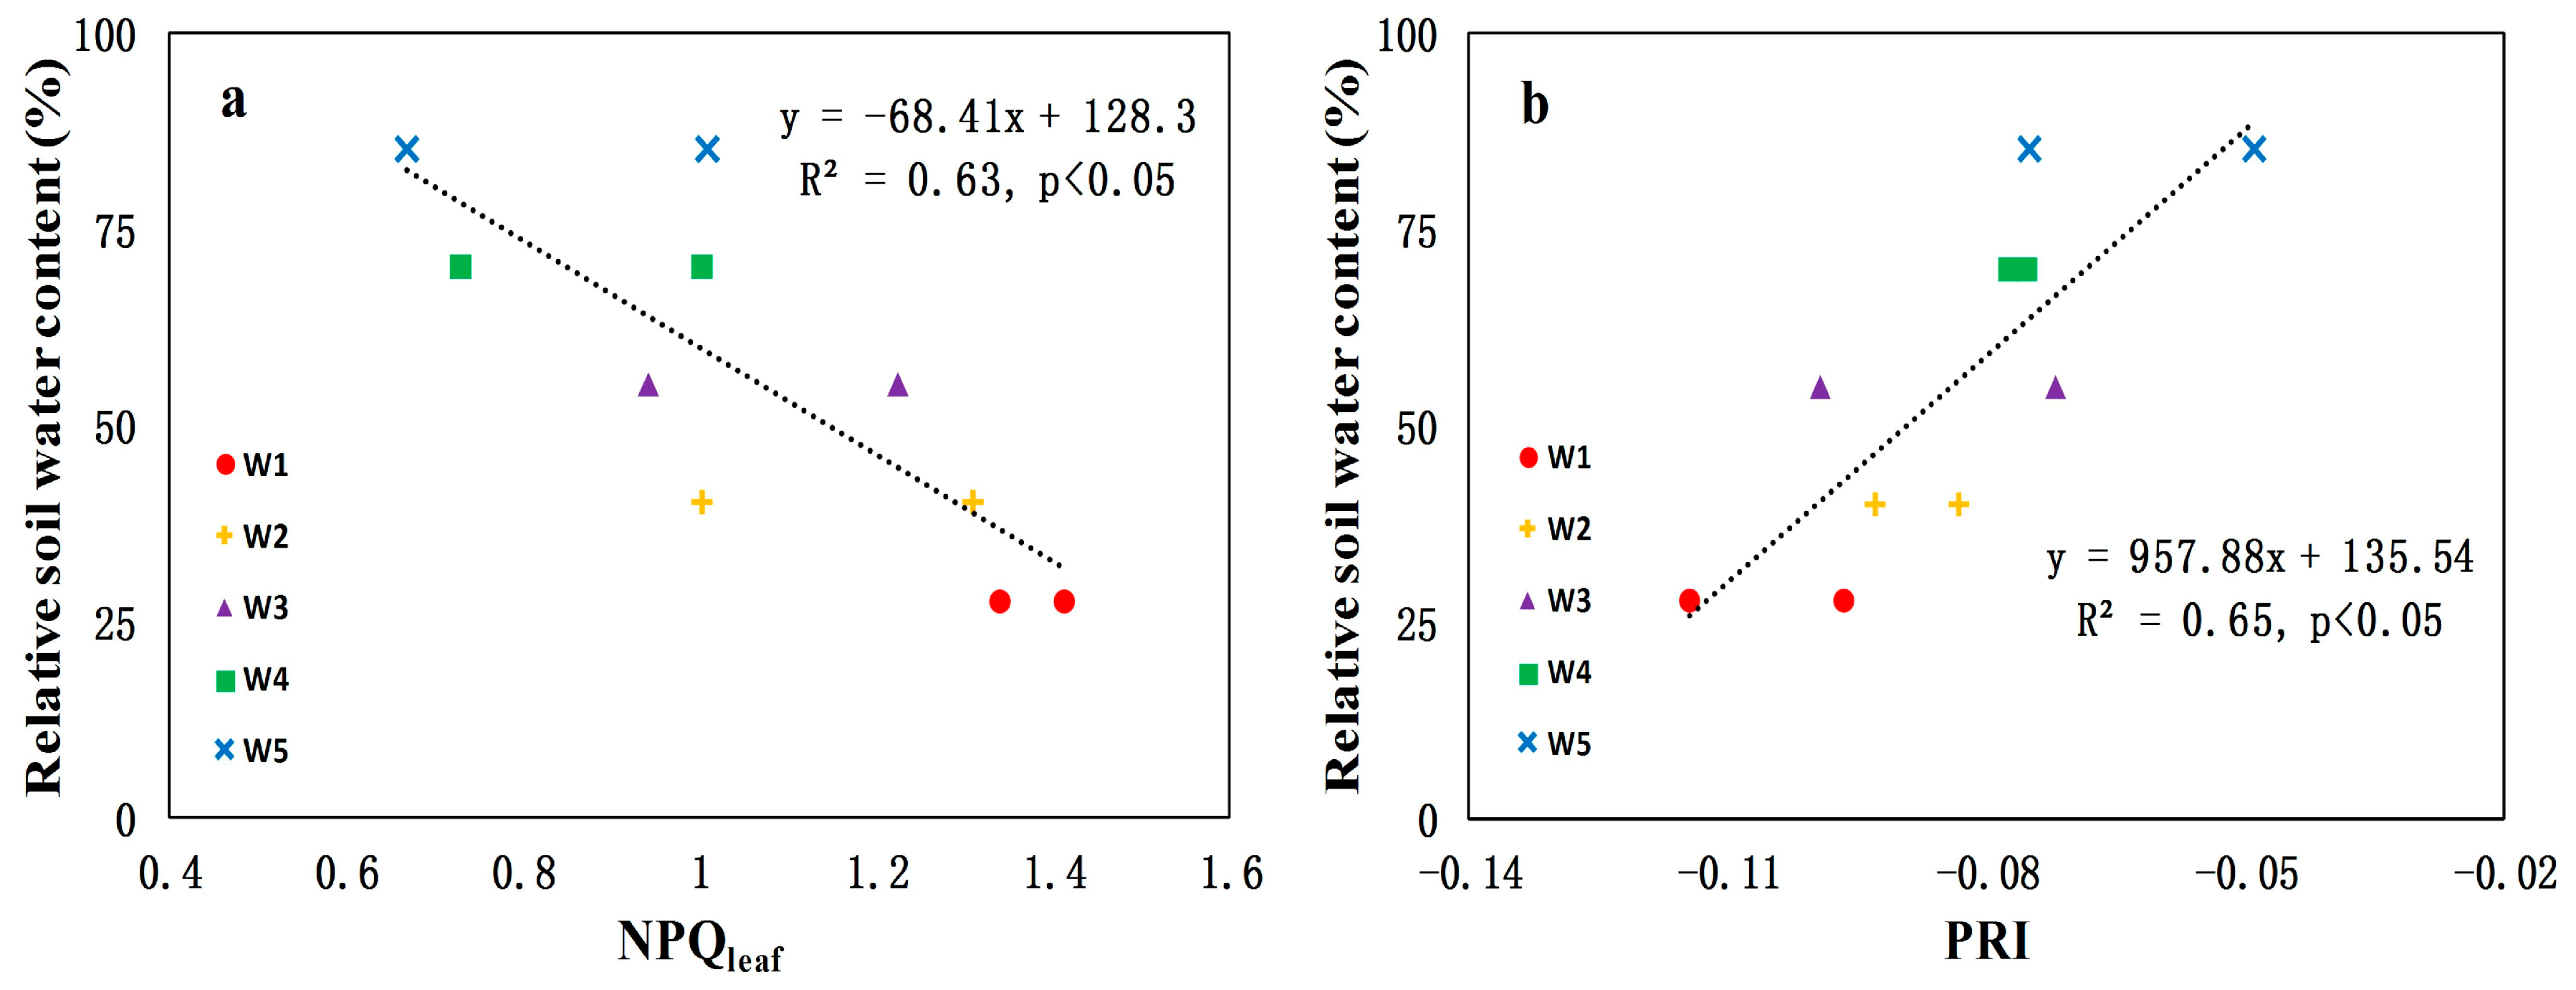
3.3. Canopy-Level PRI and NPQleaf for Detecting Water Stress in Crops

Spectral signals are shown to be particularly sensitive to changes in leaf pigment contents which can be related to water stress. PRI showed a higher correlation with NPQleaf than with the other measured parameters, including the photochemical efficiency of PSII [44]. Moreover, it can indicate the water stress change at early stages of growth [26,30,41]. Many studies showed that NPQleaf can be a good indicator of water stress at early growth stages [12,25,30]. The canopy-level PRI and NPQleaf observations were made at approximately the same time.
We obtained the value of actual photochemical efficiency of PSII (i.e., ΔF/Fm′) using the method proposed by Genty et al. (1989) based on leaf-level measurements taken in coincidence with the aerial survey [11]. The ΔF is the difference between Fm′ (i.e., the maximal fluorescence yield of the sample under environment illumination) and Fs (i.e., the fluorescence yield under environment illumination measured before the saturation pulse). The value of ΔF/Fm′ represents the efficiency of electron transport by PSII under steady-state conditions of irradiance (the ambient irradiance). Compared with stressed leaves, healthy leaves usually hold higher levels of ΔF/Fm′ [16]. The decrease in ΔF/Fm′ (Figure 3a) in maize under water stress would appear to increase in NPQleaf (Figure 3d), and decrease in PRI (Figure 3c). Water stress can induce damage to the photosynthetic apparatus and inhibit photosynthesis. For instance, photosynthesis reduction is a common response of plants under serious water stress, which results also from reduced photochemistry efficiency [45]. In monitoring water stress in a maize field, we found that PRI was related to water stress at the early growth stage before structural change occurred [10,15].
Water stress showed no effects on the maximal quantum yield of PSII, and it increased NPQleaf [6,12]. The efficiency of excitation energy transfers (Fv′/Fm′) and the quantum yield of transport PSII were reduced due to water stress, NPQleaf significantly increased with water stress [31]. Fv′/Fm′ will be limited by water stress, and the quantum yield of PSII electron transport (ΦPS, PSII) has limited effects on the photochemical quenching, while its increase will result in the increase in the non-photochemical quenching [12]. ΔF/Fm′ and Pn gradually increased with the decrease in water stress (Figure 3a,b), and PRI decreased with increasing water stress at the early growth stage (Figure 3c). NPQleaf significantly decreased with decreasing water stress (Figure 3d). The Chl/Car and PQ in maize under water stress appear to increase (Figure 3e,f).
PRI can well predict (R2 = 0.84, n = 10, p < 0.001) the variations of NPQleaf with a negative linear regression model, and NPQleaf showed the obvious decreasing trend as ΔF/Fm′ increases from 0 to 0.6 with a negative linear regression model (i.e., y = −2.24x + 1.91). However, a positive linear regression model was found between PRI and ΔF/Fm′ with a correlation coefficient of 0.76 (n = 10, p < 0.005) (Figure 4).
Maize seedlings are sensitive to the change in soil moisture at the initial stage of growth. Leaves of maize seedlings are relatively small at this stage, and the dissipation of light energy by chlorophyll fluorescence is reduced with increasing water stress, while most of the energy is used in non-photochemical quenching. Results show correlations between NPQleaf and relative soil water content (R2 = 0.63, p < 0.05) and between PRI and relative soil water content (R2 = 0.65, p < 0.05) (Figure 5). The correlations between PRI and LAI (R2 = 0.65, p < 0.05). Although leaf chlorophyll content did not change significantly under the short-term (23 days) water stress, NPQleaf and PRI differ significantly among the different levels of water stress because the ratio of chlorophyll to carotenoid changed significantly.

4. Discussion

Previous studies have found that NPQleaf would increase with the increase of water stress at the leaf scale [46]. Under a low level of light (i.e., near sunrise and sunset), the changes in ΦP are dominated by PQ while NPQleaf remains constant and low. Under a high level of solar radiation (i.e., at noon), the changes in ΦP are dominated by NPQleaf while PQ remains constant (Figure 6) [47]. However, the relationship between ΦP and ΦF is unknown when ΦP is in the range of 0 to 0.4.
It is well understood that chlorophyll fluorescence would indicate the level of photosynthesis during the early stage of water stress. The accuracy of water stress detection can be improved by using leaf temperature and chlorophyll fluorescence data [25]. Leaf-level PRI and chlorophyll fluorescence were used to detect water stress in a citrus orchard, and the results showed that chlorophyll fluorescence and PRI tracked different levels of water stress [9].
According to Rossini et al. (2015), leaf-level chlorophyll fluorescence (i.e., ΔF/Fm′) and canopy temperature data were used to detect water stress with the soil moisture content ranging from 30% to 60% [48]. However, it remains unclear if sun-induced chlorophyll fluorescence would indicate the photosynthetic rate when extreme drought occurs (i.e., the soil moisture decreased to 20–30% of the field capacity). In contrast to other studies, our results demonstrated that sun-induced chlorophyll fluorescence increased under an extreme water stress level (soil moisture deceased to 20–30% of the field capacity).
ATP (adenosine triphosphate) synthesis is sensitive to cellular dehydration induced by soil water stress. Low ATP content would decrease the supply of RuBP (Ribulose-1, 5-disphosphate), and then inhibits photosynthesis [49]. The non-stomatal component of photosynthesis was affected and a light-dependent inactivation of the primary photochemistry associated with PSII occurred at the highest water stress level [50,51]. In order to avoid damage to leaf photosynthetic apparatus and reduce transpiration, plants will close stomata under high water stress conditions [47]. Therefore, the use of radiative energy for plant photosynthesis is limited. The photochemical process nearly stopped at the highest water stress level (i.e., from 20% FC to 35% FC), so a large amount of radiative energy absorbed by the leaves is reemitted in the form of fluorescence. For this reason, the ΦF will increase instead when the water stress reaches a certain level. Porcar-Castell et al. (2014) showed the relationship between the ΦP and ΦF in relation to the PQ and NPQleaf of excitation energy [47]. Data were obtained during a summer day using a PAM fluorometer (Heinz Walz, Effeltrich, Germany). Lines were obtained by assuming a maximum quantum yield of fluorescence at the Fm state of 10%, and by varying PQ and NPQleaf to estimate ΦF = 0.1/(1 + PQ + NPQleaf) and ΦP = PQ/(1 + PQ + NPQleaf) [47]. Specifically, compared to the previous results from Porcar-Castell et al. (2014) on the ΦFΦP relationship in the limited ΦP range from 0.4 to 0.8, our research extended the ΦP value to 0.2, allowing for a comprehensive assessment of drought impacts on both ΦP and ΦF (see Figure 6). ΦF reversed the decreasing trend with ΦP as shown by Porcar-Castell and showed a slightly increasing trend. According to Parcar-Castell et al. (2014), the data points in the ΦFΦP plot should be arranged along a constant PQ line, but our data points deviate from a constant PQ line because our measured PQ decreases with increasing water stress (Figure 4e). This finding may be regarded as an extension of Porcar-Castell’s results, which were taken mostly under non-water stress conditions. Our results, therefore, contribute to the understanding the full picture of the ΦFΦP relationship.
ϕ P = P Q 1 + P Q + N P Q
ϕ F = 0.1 1 + P Q + N P Q
Equations (7) and (8) show that ΦP and ΦF are affected by NPQleaf and PQ (Equations (7) and (8), respectively). The decrease in ΦF suggests that most energy was consumed by the NPQ process [47,52]. Figure 6 shows that under water stress the changes in ΦF are controlled by PQ, with NPQleaf remaining approximately constant. In contrast, under water stress the changes in ΦP are also controlled by NPQleaf, with PQ changing in a small range. According to previous studies, chlorophyll absorbs energy within 400–700 nm wavelengths, part of which is re-radiated as chlorophyll fluorescence in the spectral range between 660–800 nm. It has two peaks in the red (690 nm) and far-red (740 nm) regions. PSII is responsible for the red peak, while both PSI and PSII contribute to the far-red peak, suggesting that PSII chlorophyll fluorescence is tightly related to the photochemical process [53], and thus giving information for the light use efficiency (LUE) [47,54].
Since both PQ and NPQleaf are affected by water stress, ΦF should also vary with water stress. This non-complementary behavior generates a two-phased inverted ‘V’ relationship between ΦF and ΦP (Figure 6). In general, ΦF significantly decreased gradually with increasing water stress but increased in severe water stress conditions when soil moisture content decreased to 20–30% of the field capacity. Correspondingly, the ratio of ΦF to ΦP decreased from well-watered to moderate water stress and then increased toward the severe water stress conditions, suggesting that severe drought affected ΦP in higher proportion than ΦF.
Maize is a drought-tolerant crop species [55,56]. This tolerance is not fully developed in the early growing season [57,58], and thus it is susceptible to water stress in the early growing season. NPQleaf can indicate different levels of water stress for many plant species, including wheat, soybean and cotton [12,29,30]. However, NPQleaf cannot always be the indicator of water stress for maize due to its drought tolerance. When the drought tolerance of maize is fully developed in the later part of the growing season [57], NPQleaf shows little sensitivity to water stress. As leaves of maize grow larger, they are able to produce higher photosynthetic yield and dissipate more energy through chlorophyll fluorescence, leading to less NPQleaf.
In Figure 6, ΦF for maize from this study is considerably higher than those from Porcar-Castell et al. (2014) at the same ΦP. This is perhaps due to different photosynthesis pathways of different species. Maize is a C4 plant species which is able to generate higher chlorophyll fluorescence than C3 plants under similar light conditions [56,59,60]. However, more studies are needed to understand the difference in ΦF between plant species.

5. Conclusions

In this study, we tested the ability of canopy-level PRI and NPQleaf for assessing water stress in maize, in order to develop remote sensing techniques to monitor water stress in crops. The following conclusions are drawn:
(i)
The quantum yield of fluorescence (ΦF) significantly decreased from well-watered to moderate water stress conditions and then increased toward severe water stress conditions with soil moisture at about 20–30% of the field capacity. At the threshold of soil moisture of about 40% of the field capacity, the ratio of ΦF to the quantum yield of photochemistry (ΦP) increased with increasing water stress, suggesting that severe drought affected ΦP in higher proportion than ΦF. This result means that the sun-induced chlorophyll fluorescence would fail to indicate the photosynthetic rate when extreme drought occurs.
(ii)
Canopy-level PRI was better than NPQleaf as indicators of water stress at the early growing season of maize (R2 = 0.65 and p < 0.05; R2 = 0.63 and p < 0.05, respectively). This result encourages the use of remote sensing techniques to measure canopy-level PRI for drought-related research. However, the ability of PRI to detect water stress is confounded by many external factors (i.e., illumination and viewing geometry). Thus NPQleaf may be explored as a complementary parameter for detecting plant water stress.
(iii)
Significant relationships are established between NPQleaf and Chl/Car (R2 = 0.71; p < 0.01) and between PRI and Chl/Car (R2 = 0.58; p < 0.05) at the leaf level. When water stress increased, the carotenoid contents increased while chlorophyll content remained fairly stable, leading to the decrease in the Chl/Car ratio. In the meantime, PRI also decreased, confirming that carotenoids are closely related to non-photochemical quenching in leaves, and therefore these pigments deserve close attention in water stress assessment.

Acknowledgments

This work was supported by National Key R&D Program of China (2016YFA0600202) and National Natural Science Foundation of China (41671343 and 41503070). We thank Albert Porcar-Castell for providing the PAM fluorimeter data.

Author Contributions

Jing M. Chen conceived and designed the experiments; Shuren Chou, Bin Chen, Hua Yu and Qin Shi analyzed the data; Meng Li contributed the weather station data; Shuren Chou wrote the paper. Jing M. Chen, Holly Croft, Xiuying Zhang, Shoaib Khalid reviewed and polished the manuscript.

Conflicts of Interest

The authors declare no conflict of interest.

Appendix A

The layout of the experimental site is shown in Figure A1. The plots are maintained at 5 different soil moisture levels and are indicated by the symbols of W1, W2, W3, W4, and W5. Soil moisture increased from W1 to W5. There were two plots for each level, and the plot size is all 3 m × 3 m × 2.5 m (length × width × depth). Each plot is reinforced and separated with cement to prevent side seepage. The soil was well mixed before planting to ensure homogeneity. This experimental setup ensures that no interferences could occur among plots of different soil water treatments.
Figure A1. Layout of the experimental site. W1: 20% FC < SWC < 35% FC, W2: 35% FC < SWC < 45% FC, W3: 50% FC <SWC < 60% FC, W4: 65% FC < SWC < 75% FC, and W5: 80% FC < SWC < 90% FC.
Remotesensing 09 00794 g007

Appendix B

The deployment of instruments in each plot is shown in Figure A2.
Figure A2. The deployment of instruments at each plot.
Remotesensing 09 00794 g008

Appendix C

A photograph of the canopy-level spectral measurement system is shown in Figure A3.
Figure A3. A hand-held mobile system for measuring canopy spectral reflectance. A 2 m horizontal boom is mounted on a 4 m vertical pole to support an Analytical Spectral Devices (ASD) FieldSpec 3 spectrometer to measure the canopy optical spectra in the nadir direction.
Remotesensing 09 00794 g009

References

  1. Alcamo, J.; Florke, M.; Marker, M. Future long-term changes in global water resources driven by socio-economic and climatic changes. Hydrol. Sci. J. 2007, 52, 247–275. [Google Scholar] [CrossRef]
  2. Anoop, M.; Chen, L.S. Changes in precipitation pattern and risk of drought over India in the context of global warming. J. Geophys. Res. 2016, 119, 7833–7861. [Google Scholar]
  3. Potopová, V.; Boroneant, C.; Boincean, B.; Soukup, J. Impact of agricultural drought on main crop yields in the Republic of Moldova. Int. J. Climatol. 2015, 36, 2063–2082. [Google Scholar] [CrossRef]
  4. Potopová, V.; Boroneant, C.; Boincean, B. Multi-scalar drought and its impact on crop yield in the Republic of Moldova. In Drought: Research and Science-Policy Interfacing; Taylor & Francis: Abingdon, UK, 2015; Volume 29, pp. 85–90. [Google Scholar]
  5. Yetkin Ozum, D.; Anne, G.; Sven, G. Testing the Contribution of Stress Factors to Improve Wheat and Maize Yield Estimations Derived from Remotely-Sensed Dry Matter Productivity. Remote Sens. 2016, 8, 170. [Google Scholar] [CrossRef] [Green Version]
  6. Bagher, B.; Christiaan, V.; Wouter, V. Remote Sensing of Grass Response to Drought Stress Using Spectroscopic Techniques and Canopy Reflectance Model Inversion. Remote Sens. 2016, 8, 557. [Google Scholar] [CrossRef]
  7. Suárez, L.; Zarco-Tejada, P.J.; Sepulcre-Cantó, G.; Pérez-Priego, O.; Miller, J.R.; Jiménez-Muñoz, J.C.; Sobrino, J. Assessing canopy PRI for water stress detection with diurnal airborne imagery. Remote Sens. Environ. 2008, 112, 560–575. [Google Scholar] [CrossRef]
  8. Rossini, M.; Fava, F.; Cogliati, S.; Meroni, M.; Marchesi, A.; Panigada, C.; Giardino, C.; Busetto, L.; Migliavacca, M.; Amaducci, S. Assessing canopy PRI from airborne imagery to map water stress in maize. ISPRS J. Photogramm. Remote Sens. 2013, 86, 168–177. [Google Scholar] [CrossRef]
  9. Zarco-Tejada, P.J.; González-Dugo, V.; Berni, J.A. Fluorescence, temperature and narrow-band indices acquired from a UAV platform for water stress detection using a micro-hyperspectral imager and a thermal camera. Remote Sens. Environ. 2012, 117, 322–337. [Google Scholar] [CrossRef]
  10. Zarco-Tejada, P.J.; González-Dugo, V.; Williams, L.; Suárez, L.; Berni, J.A.; Goldhamer, D.; Fereres, E. A PRI-based water stress index combining structural and chlorophyll effects: Assessment using diurnal narrow-band airborne imagery and the CWSI thermal index. Remote Sens. Environ. 2013, 138, 38–50. [Google Scholar] [CrossRef]
  11. Genty, B.; Briantais, J.M.; Baker, N.R. The relationship between the quantum yield of photosynthetic electron-transport and quenching of chlorophyll fluorescence. Biochim. Biophys. Acta 1989, 990, 87–92. [Google Scholar] [CrossRef]
  12. Lu, C.M.; Zhang, J.H. Effects of water stress on photosystem II photochemistry and its thermostability in wheat plants. J. Exp. Bot. 1999, 50, 1199–1206. [Google Scholar] [CrossRef]
  13. Gamon, J.A.; Penuelas, J.; Field, C.B. A Narrow-Waveband Spectral Index That Tracks Diurnal Changes in Photosynthetic Efficiency. Remote Sens. Environ. 1992, 41, 35–44. [Google Scholar] [CrossRef]
  14. Garbulsky, M.F.; Penuelas, J.; Gamon, J.; Inoue, Y.; Filella, I. The photochemical reflectance index (PRI) and the remote sensing of leaf, canopy and ecosystem radiation use efficiencies A review and meta-analysis. Remote Sens. Environ. 2011, 115, 281–297. [Google Scholar] [CrossRef]
  15. Filella, I.; Porcar-Castell, A.; Munne-Bosch, S.; Back, J.; Garbulsky, M.F.; Penuelas, J. PRI assessment of long-term changes in carotenoid/chlorophyll ratio and short-term changes in de-epoxidation state of the xanthophyll cycle. Int. J. Remote Sens. 2009, 30, 4443–4455. [Google Scholar] [CrossRef]
  16. Panigada, C.; Rossini, M.; Meroni, M.; Cilia, C.; Busettoa, L.; Amaducci, S.; Boschetti, M.; Cogliati, S.; Picchi, V.; Pinto, F.; et al. Fluorescence PRI and canopy temperature for water stress detection in cereal crops. Int. J. Appl. Earth Obs. 2014, 30, 167–178. [Google Scholar] [CrossRef]
  17. Barton, C.V.M.; North, P.R.J. Remote sensing of canopy light use efficiency using the photochemical reflectance index-Model and sensitivity analysis. Remote Sens. Environ. 2001, 7, 264–273. [Google Scholar] [CrossRef]
  18. Hilker, T.; Coops, N.C.; Hall, F.G.; Black, T.A.; Wulder, M.A.; Nesic, Z.; Krishnan, P. Separating physiologically and directionally induced changes in PRI using BRDF models. Remote Sens. Environ. 2008, 112, 2777–2788. [Google Scholar] [CrossRef]
  19. Zhang, Q.; Chen, J.M.; Ju, W.M.; Wang, H.M.; Qiu, F.; Yang, F.T.; Fan, W.L.; Hang, Q.; Wang, Y.P.; Feng, Y.K.; et al. Improving the ability of the photochemical reflectance index to track canopy light use efficiency through differentiating sunlit and shaded leaves. Remote Sens. Environ. 2017, 194, 1–15. [Google Scholar] [CrossRef]
  20. Zhang, Q.; Ju, W.M.; Chen, J.M.; Wang, H.M.; Yang, F.T.; Fan, W.L.; Huang, Q.; Zheng, T.; Feng, Y.K.; Zhou, Y.L.; et al. Ability of the Photochemical Reflectance Index to Track Light Use Efficiency for a Sub-Tropical Planted Coniferous Forest. Remote Sens. 2015, 7, 16938–16962. [Google Scholar] [CrossRef]
  21. Porcar-Castell, A. A high-resolution portrait of the annual dynamics of photochemical and non-photochemical quenching in needles of Pinus sylvestris. Physiol. Plant. 2011, 143, 139–153. [Google Scholar] [CrossRef] [PubMed]
  22. Karapetyan, N.V. Non-photochemical quenching of fluorescence in cyanobacteria. Biochem. Mosc. 2007, 72, 1127–1135. [Google Scholar] [CrossRef]
  23. Koblizek, M.; Kaftan, D.; Nedbal, L. On the relationship between the non-photochemical quenching of the chlorophyll fluorescence and the Photosystem II light harvesting efficiency. A repetitive flash fluorescence induction study. Photosynth. Res. 2001, 68, 141–152. [Google Scholar] [CrossRef] [PubMed]
  24. Eskling, M.; Emanuelsson, A.; Akerlund, H. Enzymes and mechanisms for violaxanthin-zeaxanthin conversion. Regul. Photosynth. 2001, 11, 433–452. [Google Scholar]
  25. Ni, Z.Y.; Liu, Z.G.; Huo, H.Y.; Li, Z.L.; Nerry, F.; Wang, Q.S.; Li, X.W. Early Water Stress Detection Using Leaf-Level Measurements of Chlorophyll Fluorescence and Temperature Data. Remote Sens. 2015, 7, 3232–3249. [Google Scholar] [CrossRef]
  26. Sarlikioti, V.; Driever, S.M.; Marcelis, L.F.M. Photochemical reflectance index as a mean of monitoring early water stress. Ann. Appl. Biol. 2010, 157, 81–89. [Google Scholar] [CrossRef]
  27. Flexas, J.; Briantais, J.M.; Cerovic, Z.; Medrano, H.; Moya, I. Steady-state and maximum chlorophyll fluorescence responses to water stress in grapevine leaves: A new remote sensing system. Remote Sens. Environ. 2000, 73, 283–297. [Google Scholar] [CrossRef]
  28. Croft, H.; Chen, J.M.; Zhang, Y.; Simic, A. Modelling leaf chlorophyll content in broadleaf and needle leaf canopies from ground, CASI, Landsat TM 5 and MERIS reflectance data. Remote Sens. Environ. 2013, 133, 128–140. [Google Scholar] [CrossRef]
  29. Inamullah, I.; Isoda, A. Adaptive responses of soybean and cotton to water stress II. Changes in CO2 assimilation rate, chlorophyll fluorescence and photochemical reflectance index in relation to leaf temperature. Plant Prod. Sci. 2005, 8, 131–138. [Google Scholar] [CrossRef]
  30. Subrahmanyam, D.; Subash, N.; Haris, A.; Sikka, A.K. Influence of water stress on leaf photosynthetic characteristics in wheat cultivars differing in their susceptibility to drought. Photosynthetica 2006, 44, 125–129. [Google Scholar] [CrossRef]
  31. Meroni, M.; Rossini, M.; Picchi, V.; Panigada, C.; Cogliati, S.; Nali, C.; Colombo, R. Assessing steady-state fluorescence and PRI from hyperspectral proximal sensing as early indicators of plant stress: The case of ozone exposure. Sensors 2008, 8, 1740–1754. [Google Scholar] [CrossRef] [PubMed]
  32. Loreto, F.; Tricoli, D.; Marco, G.D. On the relationship between electron transport rate and photosynthesis in leaves of the C4 plant Sorghum bicolor exposed to water stress, temperature changes and carbon metabolism inhibition. Funct. Plant Biol. 1995, 22, 885–892. [Google Scholar]
  33. Da Silva, J.M.; Arrabaca, M.C. Photosynthesis in the water-stressed C4 grass Setaria sphacelata is mainly limited by stomata with both rapidly and slowly imposed water deficits. Physiol. Plant. 2004, 121, 409–420. [Google Scholar] [CrossRef]
  34. Lancashire, P.D.; Bleiholder, H.; Langeluddecke, P.; Stauss, R.; Van, T.; Weber, E.; Witzenberger, A. A uniform decimal code for growth stages of crops and weeds. Ann. Appl. Biol. 1991, 119, 561–601. [Google Scholar] [CrossRef]
  35. Lichtenthaler, H.K.; Wellburn, A.R. Determinations of total carotenoids and chlorophylls a and b of leaf extracts in different solvents. Biochem. Soc. Trans. 1983, 11, 591–592. [Google Scholar] [CrossRef]
  36. Chen, J.M.; Black, T.A. Defining leaf-area index for non-flat leaves. Plant Cell Environ. 1992, 15, 421–429. [Google Scholar] [CrossRef]
  37. Bilger, W.; Björkman, O. Role of the xanthophyll cycle in photoprotection elucidated by measurements of light-induced absorbance changes, fluorescence and photosynthesis in leaves of Hedera canariensis. Photosynth. Res. 1990, 25, 173–185. [Google Scholar] [CrossRef] [PubMed]
  38. Porcar-Castell, A.; Garcia-Plazaola, J.I.; Nichol, C.J.; Kolari, P.; Olascoaga, B.; Kuusinen, N.; Fernandez-Marin, B.; Pulkkinen, M.; Juurola, E.; Nikinmaa, E. Physiology of the seasonal relationship between the photochemical reflectance index and photosynthetic light use efficiency. Oecologia 2012, 170, 313–323. [Google Scholar] [CrossRef] [PubMed]
  39. Hendrickson, L.; Furbank, R.T.; Chow, W.S. A simple alternative approach to assessing the fate of absorbed light energy using chlorophyll fluorescence. Photosynth. Res. 2004, 82, 73–81. [Google Scholar] [CrossRef] [PubMed]
  40. Ishida, S.; Uebayashi, N.; Tazoe, Y.; Ikeuchi, M.; Homma, K.; Sato, F.; Endo, T. Diurnal and Developmental Changes in Energy Allocation of Absorbed Light at PSII in Field-Grown Rice. Plant Cell Physiol. 2014, 55, 171–182. [Google Scholar] [CrossRef] [PubMed]
  41. Milton, E.J.; Schaepman, M.E.; Anderson, K.; Kneubühler, M.; Fox, N. Progress in field spectroscopy. Remote Sens. Environ. 2009, 113, 92–109. [Google Scholar] [CrossRef]
  42. Meroni, M.; Picchi, V.; Rossini, M.; Cogliati, S.; Panigada, C.; Nali, C.; Lorenzini, G.; Colombo, R. Leaf level early assessment of ozone injuries by passive fluorescence and photochemical reflectance index. Int. J. Remote Sens. 2008, 29, 5409–5422. [Google Scholar] [CrossRef]
  43. Croft, H.; Chen, J.M.; Luo, X.; Bartlett, P.; Chen, B.; Staebler, R.M. Leaf chlorophyll content as a proxy for leaf photosynthetic capacity. Glob. Chang. Biol. 2016, 12, 1–7. [Google Scholar] [CrossRef] [PubMed]
  44. Evain, S.; Flexas, J.; Moya, I. A new instrument for passive remote sensing: 2. Measurement of leaf and canopy reflectance changes at 531 nm and their relationship with photosynthesis and chlorophyll fluorescence. Remote Sens. Environ. 2004, 91, 175–185. [Google Scholar] [CrossRef]
  45. Johnson, G.N.; Young, A.J.; Scholes, J.D.; Horton, P. The dissipation of excess excitation-energy in British plant-species. Plant Cell Environ. 1993, 16, 673–679. [Google Scholar] [CrossRef]
  46. Schmuck, G.; Moya, I.; Pedrini, A.; Van der Linde, D.; Lichtenthaler, H.K.; Stober, F.; Schindler, C.; Goulas, Y. Chlorophyll fluorescence lifetime determination of waterstressed C3-and C4-plants. Radiat. Environ. Biophys. 1992, 31, 141–151. [Google Scholar] [CrossRef] [PubMed]
  47. Porcar-Castell, A.; Tyystjarvi, E.; Atherton, J.; van der Tol, C.; Flexas, J.; Pfundel, E.E.; Moreno, J.; Frankenberg, C.; Berry, J.A. Linking chlorophyll a fluorescence to photosynthesis for remote sensing applications: Mechanisms and challenges. J. Exp. Bot. 2014, 65, 4065–4095. [Google Scholar] [CrossRef] [PubMed]
  48. Rossini, M.; Panigada, C.; Cilia, C.; Meroni, M.; Busetto, L.; Cogliati, S.; Amaducci, S.; Colombo, R. Discriminating Irrigated and Rainfed Maize with Diurnal Fluorescence and Canopy Temperature Airborne Maps. ISPRS Int. J. Geo-Inf. 2015, 401, 914–917. [Google Scholar] [CrossRef] [Green Version]
  49. Tezara, W.; Mitchell, V.J.; Driscoll, S.D.; Lawlor, D.W. Water stress inhibits plant photosynthesis by decreasing coupling factor and ATP. Nature 1999, 401, 914–917. [Google Scholar]
  50. Angelopoulos, K.; Dichio, B.; Xiloyannis, C. Inhibition of photosynthesis in olive trees (Olea europaea L.) during water stress and rewatering. J. Exp. Bot. 1996, 47, 1093–1100. [Google Scholar] [CrossRef]
  51. Yoshida, Y.; Joiner, J.; Tucker, C.; Berry, J.; Lee, J.E.; Walker, G.; Reichle, R.; Koster, R.; Lyapustin, A.; Wang, Y. The 2010 Russian drought impact on satellite measurements of solar-induced chlorophyll fluorescence: Insights from modeling and comparisons with parameters derived from satellite reflectances. Remote Sens. Environ. 2015, 166, 163–177. [Google Scholar] [CrossRef]
  52. Ehleringer, J.R.; Mooney, H.A. Leaf hairs—Effects on physiological-activity and adaptive value to a desert shrub. Oecologia 1978, 37, 183–200. [Google Scholar] [CrossRef] [PubMed]
  53. Yang, X.; Tang, J.W.; Mustard, J.F.; Lee, J.E.; Rossini, M.; Joiner, J.; Munger, J.W.; Kornfeld, A.; Richardson, A.D. Solar-induced chlorophyll fluorescence that correlates with canopy photosynthesis on diurnal and seasonal scales in a temperate deciduous forest. Geophys. Res. Lett. 2015, 42, 2977–2987. [Google Scholar] [CrossRef]
  54. Rossini, M.; Nedbal, L.; Guanter, L.; Ac, A.; Alonso, L.; Burkart, A.; Cogliati, S.; Colombo, R.; Damm, A.; Drusch, M.; et al. Red and far red Sun-induced chlorophyll fluorescence as a measure of plant photosynthesis. Geophys. Res. Lett. 2015, 42, 1632–1639. [Google Scholar] [CrossRef] [Green Version]
  55. Zhang, F.; Zhou, G.S. Estimation of Canopy Water Content by Means of Hyperspectral Indices Based on Drought Stress Gradient Experiments of Maize in the North Plain China. Remote Sens. 2015, 7, 15203–15223. [Google Scholar] [CrossRef]
  56. Koffi, E.; Rayner, P.J.; Norton, A.J.; Frankenberg, C.; Scholze, M. Investigating the usefulness of satellite-derived fluorescence data in inferring gross primary productivity within the carbon cycle data assimilation system. Biogeosciences 2015, 1, 4067–4084. [Google Scholar] [CrossRef]
  57. Edmeades, G.O.; Bolanos, J.; Chapman, S.C.; Lafitte, H.R.; Banziger, M. Selection improves drought tolerance in tropical maize populations: I. Gains in biomass, grain yield, and harvest index. Crop Sci. 1999, 39, 1306–1315. [Google Scholar] [CrossRef]
  58. Bolanos, J.; Edmeades, G.O. The importance of the anthesis-silking interval in breeding for drought tolerance in tropical maize. Field Crop. Res. 1996, 48, 409–420. [Google Scholar] [CrossRef]
  59. Van der Tol, C.; Verhoef, W.; Rosema, A. A model for chlorophyll fluorescence and photosynthesis at leaf scale. Agric. For. Meteorol. 2009, 149, 96–105. [Google Scholar] [CrossRef]
  60. Liu, L.Y.; Guan, L.L.; Liu, X.J. Directly estimating diurnal changes in GPP for C3 and C4 crops using far-red sun-induced chlorophyll fluorescence. Agric. For. Meteorol. 2017, 232, 1–9. [Google Scholar] [CrossRef]
Figure 1. Typical fluctuations in the quantum yield of photochemistry in PSII (ΦP), the quantum yield of non-photochemical quenching (ΦN), the quantum yield of fluorescence (ΦF) and constitutive heat dissipation (ΦD), at different water stress levels. (1) W1: 20% FC < SWC < 35% FC; (2) W2: 35% FC < SWC < 45% FC; (3) W3: 50% FC <SWC < 60% FC; (4) W4: 65% FC < SWC < 75% FC; and (5) W5: 80% FC < SWC < 90% FC.
Remotesensing 09 00794 g001
Figure 2. (a) The relationships between leaf-level non-photochemical quenching (NPQleaf) and the ratio of chlorophyll to carotenoid (Chl/Car) and between (b) photochemical reflectance index (PRI) and Chl/Car at different soil moisture levels.
Remotesensing 09 00794 g002
Figure 3. The plots with five different water stress levels are indicated by colors, and two groups of data are shown in this experiment. WS1 and WS2 represent the first and second group of treatments, respectively. (a) The variations of actual quantum yield of PSII (ΔF/Fm′), (b) net photosynthetic rate (Pn), (c) photochemical reflectance index (PRI), (d) non-photochemical quenching (NPQleaf), (e) photochemical quenching, and (f) the ratio of chlorophyll to carotenoid (Chl/Car) at different water stress levels. W1: 20% FC < SWC < 35% FC, W2: 35% FC < SWC < 45% FC, W3: 50% FC <SWC < 60% FC, W4: 65% FC < SWC < 75% FC, W5: 80% FC < SWC < 90% FC.
Remotesensing 09 00794 g003
Figure 4. (a) The relationships between NPQleaf and PRI, (b) NPQleaf and ΔF/Fm′ and (c) between PRI and ΔF/Fm′ at different soil moisture levels.
Remotesensing 09 00794 g004
Figure 5. (a) Correlations between NPQleaf and relative soil water content (R2 = 0.63, p < 0.05) and (b) between photochemical reflectance index (PRI) and relative soil water content (R2 = 0.65, p < 0.05).
Remotesensing 09 00794 g005
Figure 6. Color points show the relationship between ΦP and ΦF at different water stress levels. Data were obtained using the Licor-6400 (Licor Inc., Lincoln, NE, USA) instrument during the day in the early growing stage, and there are five soil moisture levels, ranging from 20% to 90% of the field capacity. For a comparison, Scots pine data in Porcar-Castell et al. (2014) are also presented (black points represent to data from midnight to noon, grey points represent the data from noon to midnight).
Remotesensing 09 00794 g006

