Article

The Uncertainty of Nighttime Light Data in Estimating Carbon Dioxide Emissions in China: A Comparison between DMSP-OLS and NPP-VIIRS

1
Key Laboratory for Urban Habitat Environmental Science and Technology, Shenzhen Graduate School, Peking University, Shenzhen 518055, China
2
Key Laboratory for Earth Surface Processes, Ministry of Education, College of Urban and Environmental Sciences, Peking University, Beijing 100871, China
3
School of Architecture, Tsinghua University, Beijing 100871, China
*
Author to whom correspondence should be addressed.
Submission received: 31 May 2017 / Revised: 19 July 2017 / Accepted: 28 July 2017 / Published: 2 August 2017
(This article belongs to the Special Issue Recent Advances in Remote Sensing with Nighttime Lights)

Abstract

:
Nighttime light data can characterize urbanization, economic development, population density, energy consumption and other human activities. Additionally, carbon dioxide (CO2) emissions are closely related to the scope and intensity of human activities. In this study, we assess the utility of nighttime light data as a powerful tool to reflect CO2 emissions from energy consumption, analyze the uncertainty associated with different nighttime light data for modeling CO2 emissions, and provide guidance and a reference for modeling CO2 emissions based on nighttime light data. In this paper, Mainland China was taken as a case study, and nighttime light datasets (the Defense Meteorological Satellite Program’s Operational Linescan System (DMSP-OLS) nighttime light data and the Suomi National Polar-Orbiting Partnership Visible Infrared Imaging Radiometer Suite (NPP-VIIRS) nighttime light data) as well as a global gridded CO2 emissions dataset (PKU-CO2) were used to perform simple regressions at provincial, prefectural and 0.1° × 0.1° grid levels, respectively. The analyses are aimed at exploring the accuracy and uncertainty of DMSP-OLS and NPP-VIIRS nighttime light data in modeling CO2 emissions at different spatial scales. The improvement of nighttime light index and the potential factors influencing the effects of modeling CO2 emissions based on nighttime light datasets were also explored. The results show that DMSP-OLS is superior to NPP-VIIRS in modeling CO2 emissions at all spatial scales, and the bigger the scale, the more evident the advantages of DMSP-OLS. When modeling CO2 emissions with nighttime light datasets, not only the total amount of lights within a given statistical unit but also the agglomeration degree of lights should be taken into account. Furthermore, the geographical location and socio-economic conditions at the study site, such as gross regional product per capita (GRP per capita), population, and urbanization were shown to have an impact on the regression effect of the nighttime lights-CO2 emissions model. The regression effect was found to be better at higher latitude and longitude areas with higher GRP per capita and higher urbanization, while population showed little effect on the regression effect of the nighttime lights - CO2 emissions model. The limitation of this study is that the thresholds of potential factors are unclear and the quantitative guidance is insufficient.

Graphical Abstract

1. Introduction

It has been 50 years since the Defense Meteorological Satellite Program’s (DMSP) first satellite was launched in 1965. DMSP is the only dedicated meteorological satellite in the world, and one of its main sensors is the Operational Linescan System (OLS), is which consists of a Photo Multiplier Tube (PMT). Presently, the DMSP satellite systems in use (F10, F12, F14, F15, F16, and F18) are equipped with OLS. With PMT’s nighttime photoelectric amplification capabilities, not only clouds but also town lights, firelights, fishing lights and any other low-intensity lights can be detected [1]. DMSP-OLS nighttime light data are widely used in research on human activities in the domain of the social sciences, including urbanization monitoring [2,3,4], economic assessments [5,6,7], population density assessments [8,9,10], energy consumption [11,12,13], studying of the eco-environmental effects of human activities [14,15], and so on.
In October 2011, the Suomi National Polar-Orbiting Partnership (NPP) satellite with the Visible Infrared Imaging Radiometer Suite (VIIRS) was launched by the National Oceanic and Atmospheric Administration (NOAA)/National Geophysical Data Center (NGDC). As shown in Table 1, compared to DMSP-OLS, NPP-VIIRS are superior in spatial and radiometric resolution, radiometric detection range, and onboard calibration [16,17]. The potential advantages of NPP-VIIRS for mapping socio-economic activities have been established, and especially good correlations have been obtained with socioeconomic parameters, such as Gross Domestic Product (DP), electric power consumption, and population [18,19,20,21,22].
The application of DMSP-OLS data in modeling fossil-fuel generated carbon dioxide (CO2) emissions has been investigated in some research [23,24,25,26,27,28]. The feasibility of modeling CO2 emissions based on DMSP-OLS was analyzed, and the results show a strong positive correlation between CO2 emissions and the light area, the average night light, and the total amount of lights within a given administrative unit, respectively. Such results can provide a reference framework for modeling CO2 emissions with nighttime light data. However, the above-mentioned studies were conducted at different scales and in different study areas. Moreover, the different light indexes rendered, the results incomparable, and it was difficult to establish whether results from the same data source of CO2 emissions in the same area varied at different scales. Additionally, there are few studies on the regional differences of mapping CO2 emissions with nighttime light data, and the difference between DMSP-OLS and NPP-VIIRS nighttime light data in modeling CO2 emissions is rarely explored. Although a comparison between DMSP-OLS and NPP-VIIRS has been carried by Ou et al. [29], the characterization effects at different scales were not considered and the quality of the data source was not excluded. These are likely to affect the results because, firstly, the over-saturation problem of DMSP-OLS was unresolved, secondly, the point-source database (CARMA) only covered CO2 emissions from power plants, which do not reflect the entire CO2 emissions from energy consumption. In addition, the analysis on the potential factors influencing on the spatial heterogeneity of nighttime lights-CO2 emissions regression was insufficient.
In this paper, a detailed regression analysis on nighttime light data and CO2 emissions is conducted, both DMSP-OLS and NPP-VIIRS nighttime data are compared at different scales, and finally, the optimum nighttime dataset at different spatial scales is determined. Additionally, the improvement of nighttime light index and the potential factors affecting the regression are also discussed. This research aims to understand the quality of DMSP-OLS and NPP-VIIRS by comparing the accuracy of the two kinds of nighttime light datasets for modeling CO2 emissions. Furthermore, to resolve doubts regarding the selection of nighttime light datasets at different spatial scales, effective advice and guidance for modeling CO2 emissions are provided, and the areas that are better suited for modeling CO2 emissions with nighttime light are identified.

2. Case Study Area and Data

2.1. Case Study Area: Mainland China

In this study, Mainland China was selected as the case study area, and Hong Kong, Macao, and Taiwan were excluded due to lack of socio-economic statistical data. The administrative divisions of Mainland China contain 31 provincial-level divisions and 287 prefectural-level divisions. 21 provinces, four municipalities and six autonomous regions were selected at the province level. In addition, 287 out of the 333 prefectures in Mainland China were analyzed at prefecture level and 46 prefectures with incomplete socio-economic data were neglected.

2.2. Data Collection

The datasets used in this study contain nighttime light data (DMSP-OLS and NPP-VIIRS), gridded CO2 datat (PKU-CO2), socio-economic data, and data on the administrative divisions.
DMSP-OLS products consist of three types of data: average visible data, stable light data, and cloud free coverages. The stable light datasets provided by NOAA/NGDC are from 1992 to 2013. While the NPP-VIIRS dataset is available from 2012, taking the availability and comparison of DMSP-OLS and NPP-VIIRS into account, the year 2012 was selected in this study. The available stable light data for DMSP-OLS were collected by satellite F18 in 2012 (the DMSP-OLS Nighttime Lights Time Series dataset Version 4 is available at http://ngdc.noaa.gov/eog/dmsp/downloadV4composites.html). To resolve the inherent problem of saturation in brightly lit areas, especially urban centers, saturation correction is needed for DMSP-OLS stable light products. A series of saturation correction methods have been proposed so far, and among these the invariant method [30,31,32,33] is widely used and well received. In this paper, the invariant method proposed by Shi et al. [31] was used for data processing. The NPP-VIIRS composite for 2012 is available at http://ngdc.noaa.gov/eog/viirs/download_viirs_nighttime lights.html.
The NPP-VIIRS data obtained from the website are a preliminary product with data on lights from cities and towns, gas flares as well as temporary lights (such as volcanoes or aurora), and background noises (such as lights reflected by snowcapped mountains and dry lake beds). The use of raw data directly to calculate the lights results in unavoidable errors and affects the accuracy and reliability of the results. Therefore, the temporary lights and background noises, which are irrelevant to economic activities, should be removed. Several methods have been proposed to weaken the influence of noises [18,19] and the correction method here refers to the one proposed by Shi et al. [19]. Four first-tier cities (Beijing, Shanghai, Guangzhou, and Shenzhen) were chosen as the reference areas, under the assumption that these cities experienced rapid development in the recent years. Additionally, the lights in the four cities are higher in comparison to other areas in Mainland China. Finally, the stable lights in NPP-VIIRS were extracted, and the temporary lights, such as the outliers in Tarim Basin and Xinjiang were excluded.
The Lambert Azimuthal Equal Area Projection and a spatial resolution of 1000 m were chosen for all the nighttime light data.
PKU-CO2 is a global gridded CO2 emissions dataset with a resolution of 0.1° × 0.1°. CO2 emissions were calculated based on 64 fuel sub-types, including fossil fuel, biomass, and solid wastes. Since the proportion of CO2 emissions from biomass and solid wastes is much smaller than that from fossil fuels, in this study, CO2 emissions from the PKU-CO2 dataset assumed to be from fossil fuels. The accuracy of the PKU-CO2 dataset was confirmed by comparing it with the estimate from the International Energy Agency [34,35]. The PKU-CO2 dataset from 1960 to 2014 can be downloaded for free from the website (http://inventory.pku.edu.cn/download/download.html).
The socio-economic data used in this paper come from China City Statistical Yearbook in 2012, and include the Gross Regional Product per capita (GRP per capita), population, area of the municipal districts, and the total administration district area. The currency unit of GRP per capita is Chinese Yuan in the current year, and the unit of area is square kilometers.
The boundary data of administrative divisions used in this paper, including provincial-level and prefectural-level boundaries at the scale of 1:4 million, are available at the website of the National Geomatics Center of China (http://www.naturalearthdata.com).

3. Methods

Different nighttime light indexes [20,23,25,27,28] (such as light area, mean light, and the total amount of lights) and function forms (such as linear regression, and log-log equation) have been proposed in previous research to model CO2 emissions, and a good correlation between nighttime light index and CO2 emissions has been indicated. DN values of nighttime light data represent the intensity of human activities, energy consumption and CO2 emissions associated with human production and living activities. In this study, we hypothesize a positive correlation between DN values and CO2 emissions, i.e., areas with higher DN (brighter lights) generally have higher CO2 emissions [30]. Subsequently, the commonly used nighttime light indexes (total amount of lights within a given administrative division) were chosen in this paper. The log-log function was used because the natural logarithm of the lights and CO2 emissions helps reduce the heteroscedasticity. The provincial-level, prefectural-level as well as the 0.1° × 0.1° grids were used to perform a multi-scale study, and therefore, the nighttime light index was calculated for province, prefecture, and 0.1° × 0.1° grid. The zonal tool in ArcGIS 10.2 was used to calculate the total amounts of nighttime lights (TNL) and CO2 emissions in each administrative unit and at a grid size of 0.1° × 0.1° (created by fishnet), followed by exploratory data analyses in SPSS 20.
The regression equation is as follows.
ln (CO2)i = a × ln (TNL)i + b
where TNL is the total amount of lights within a given statistical unit i, CO2 presents CO2 emissions within the statistical unit i, and i can be a province, a prefecture, or one 0.1° × 0.1° grid.

4. Results

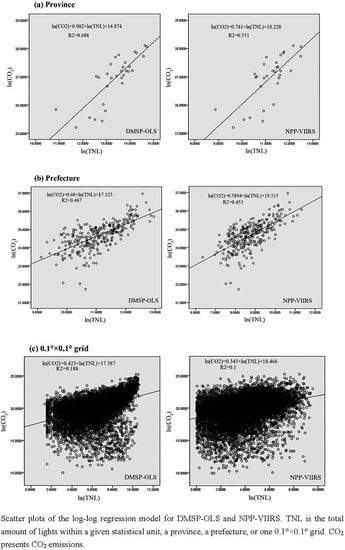
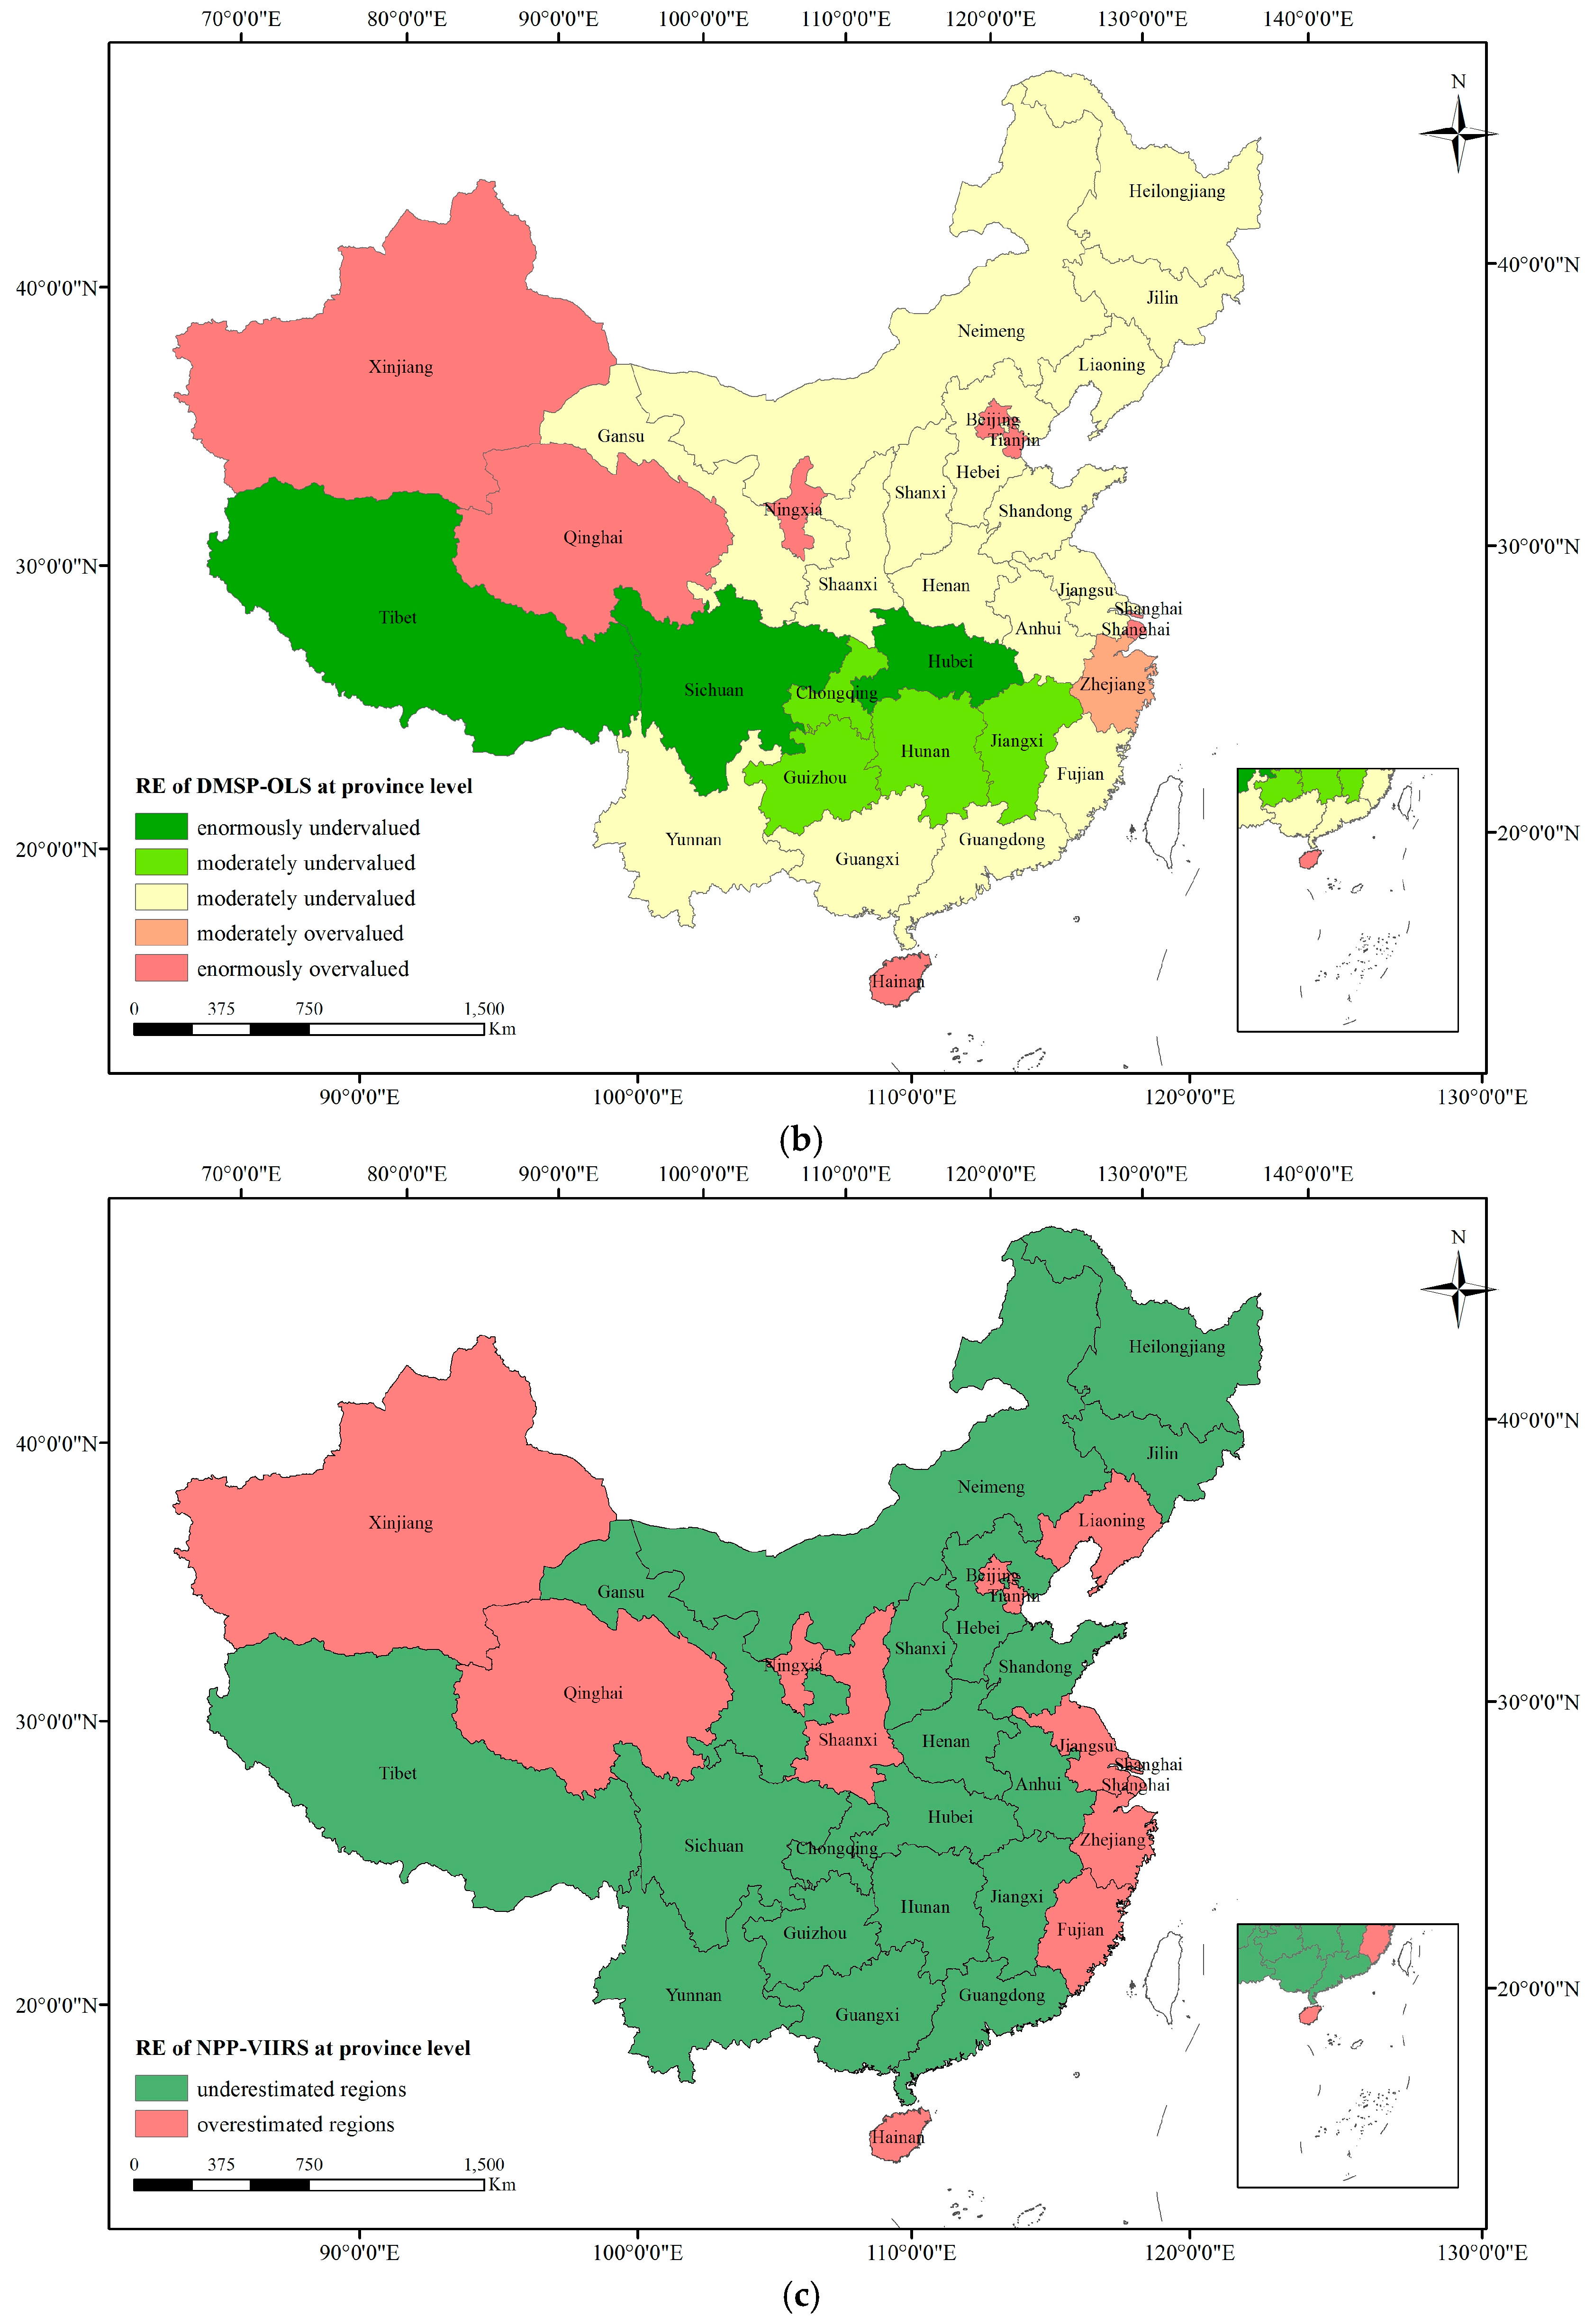
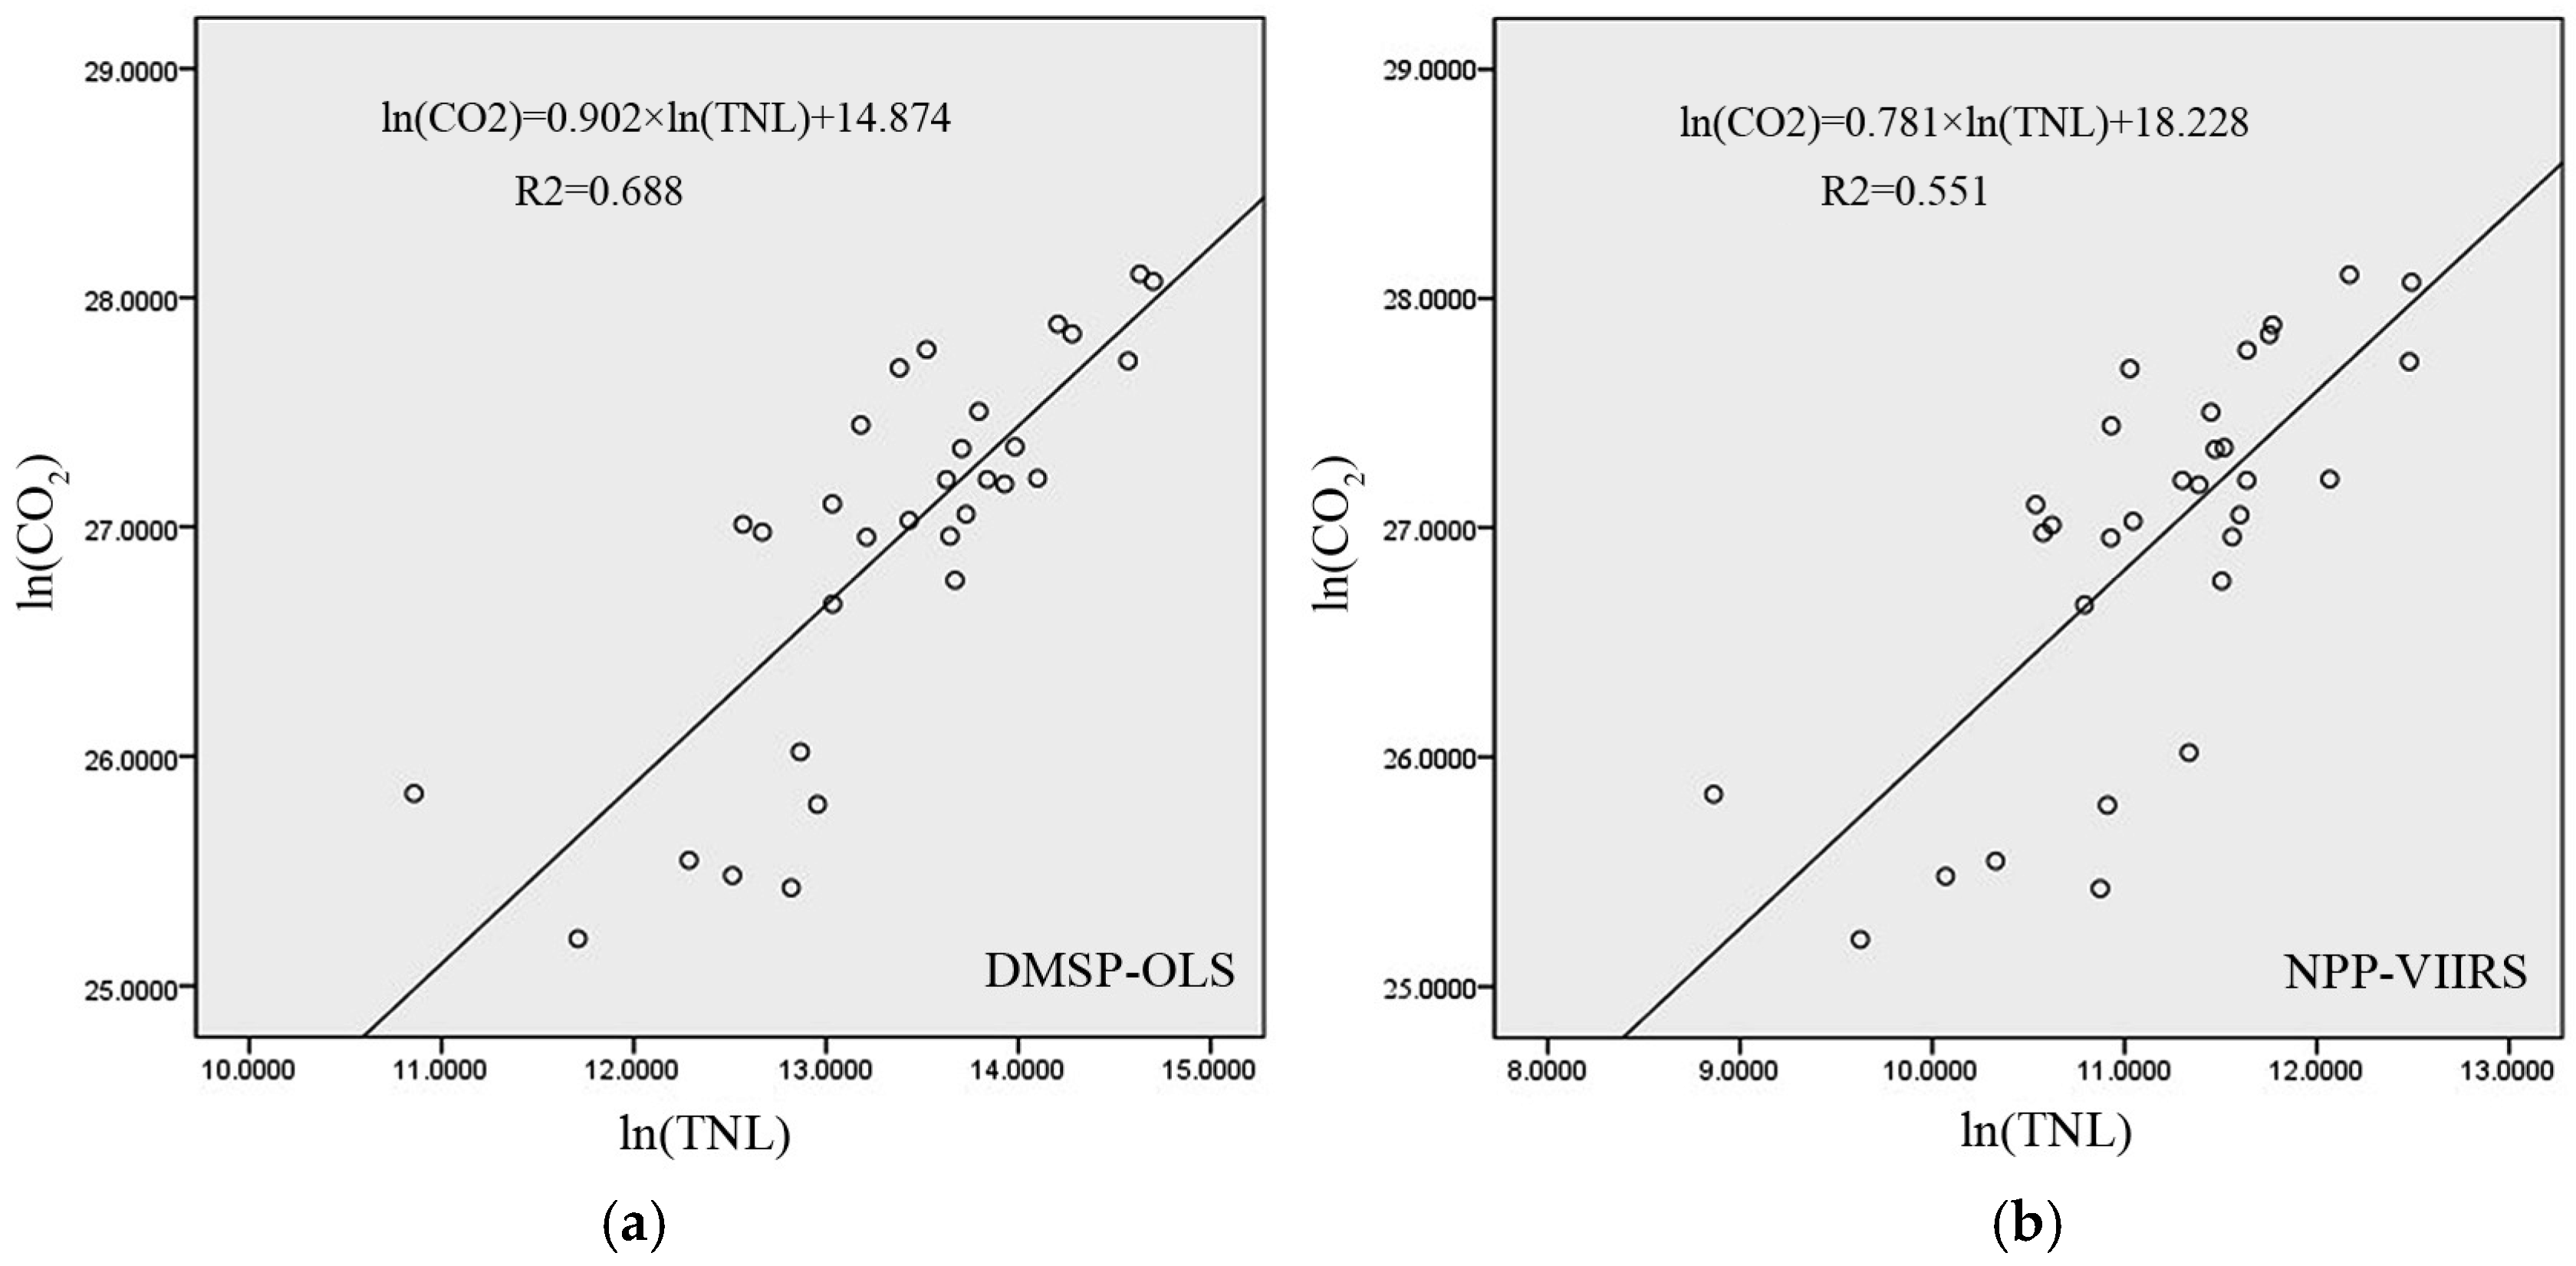
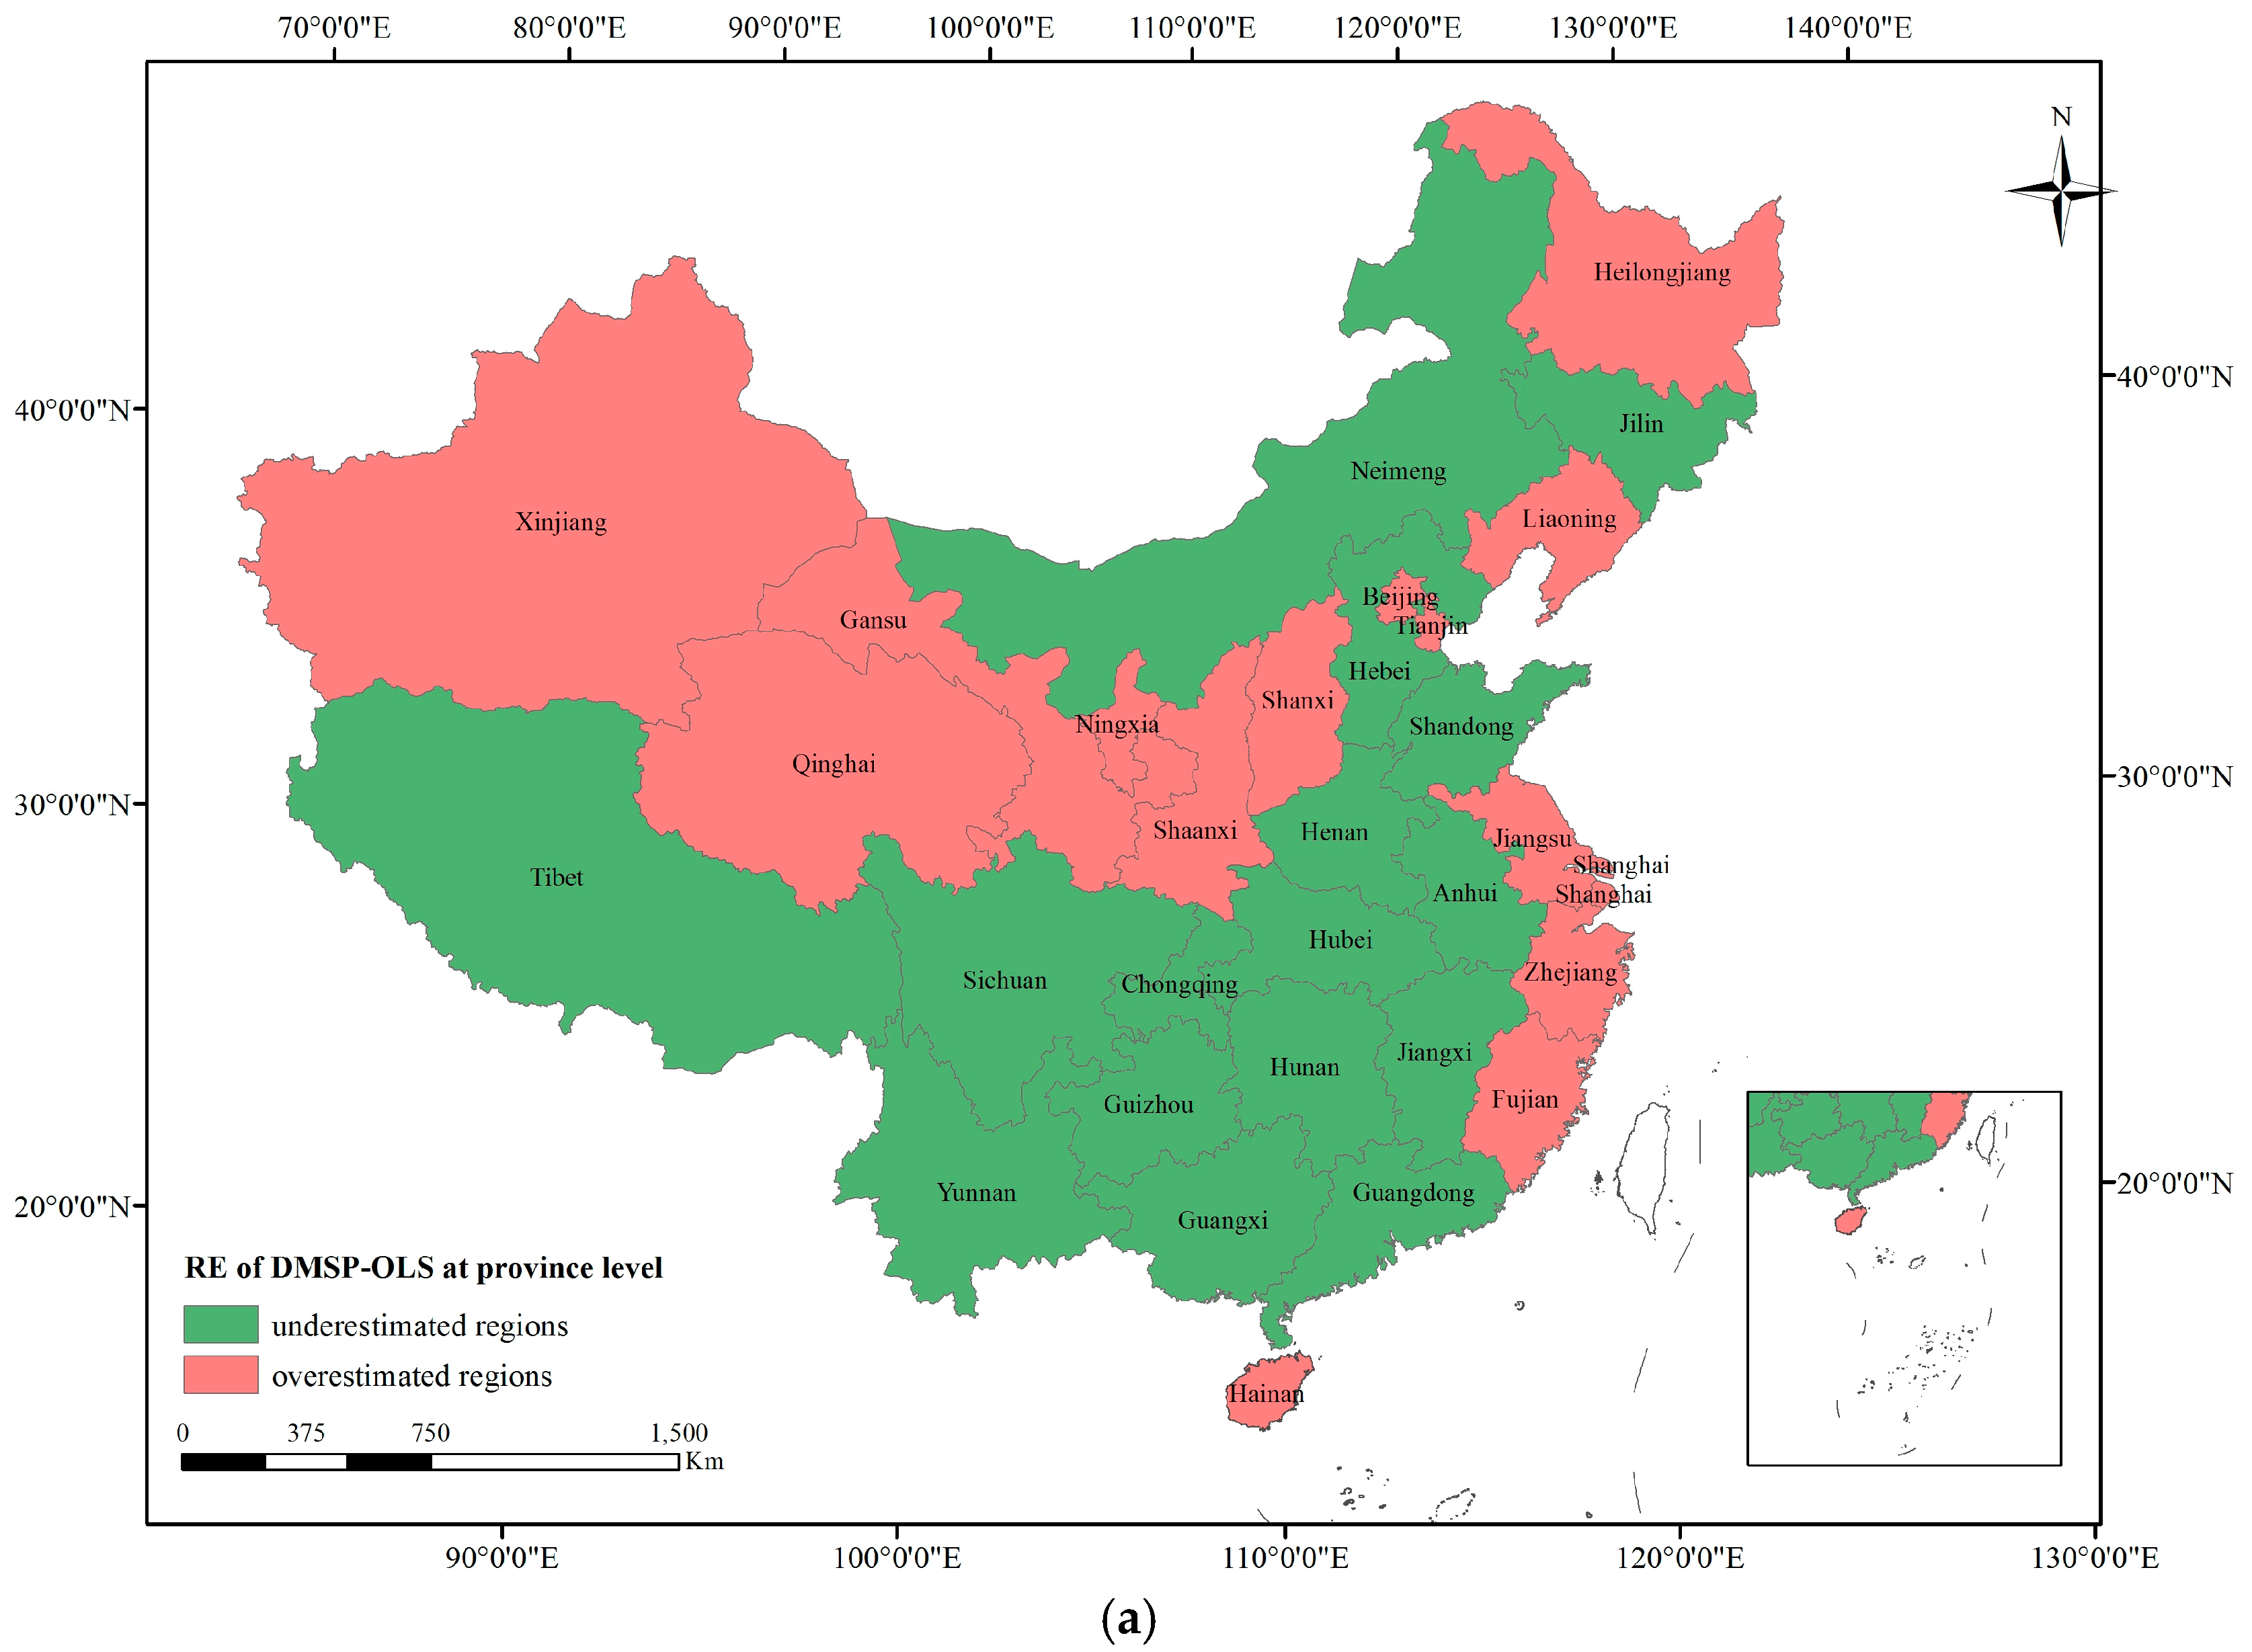
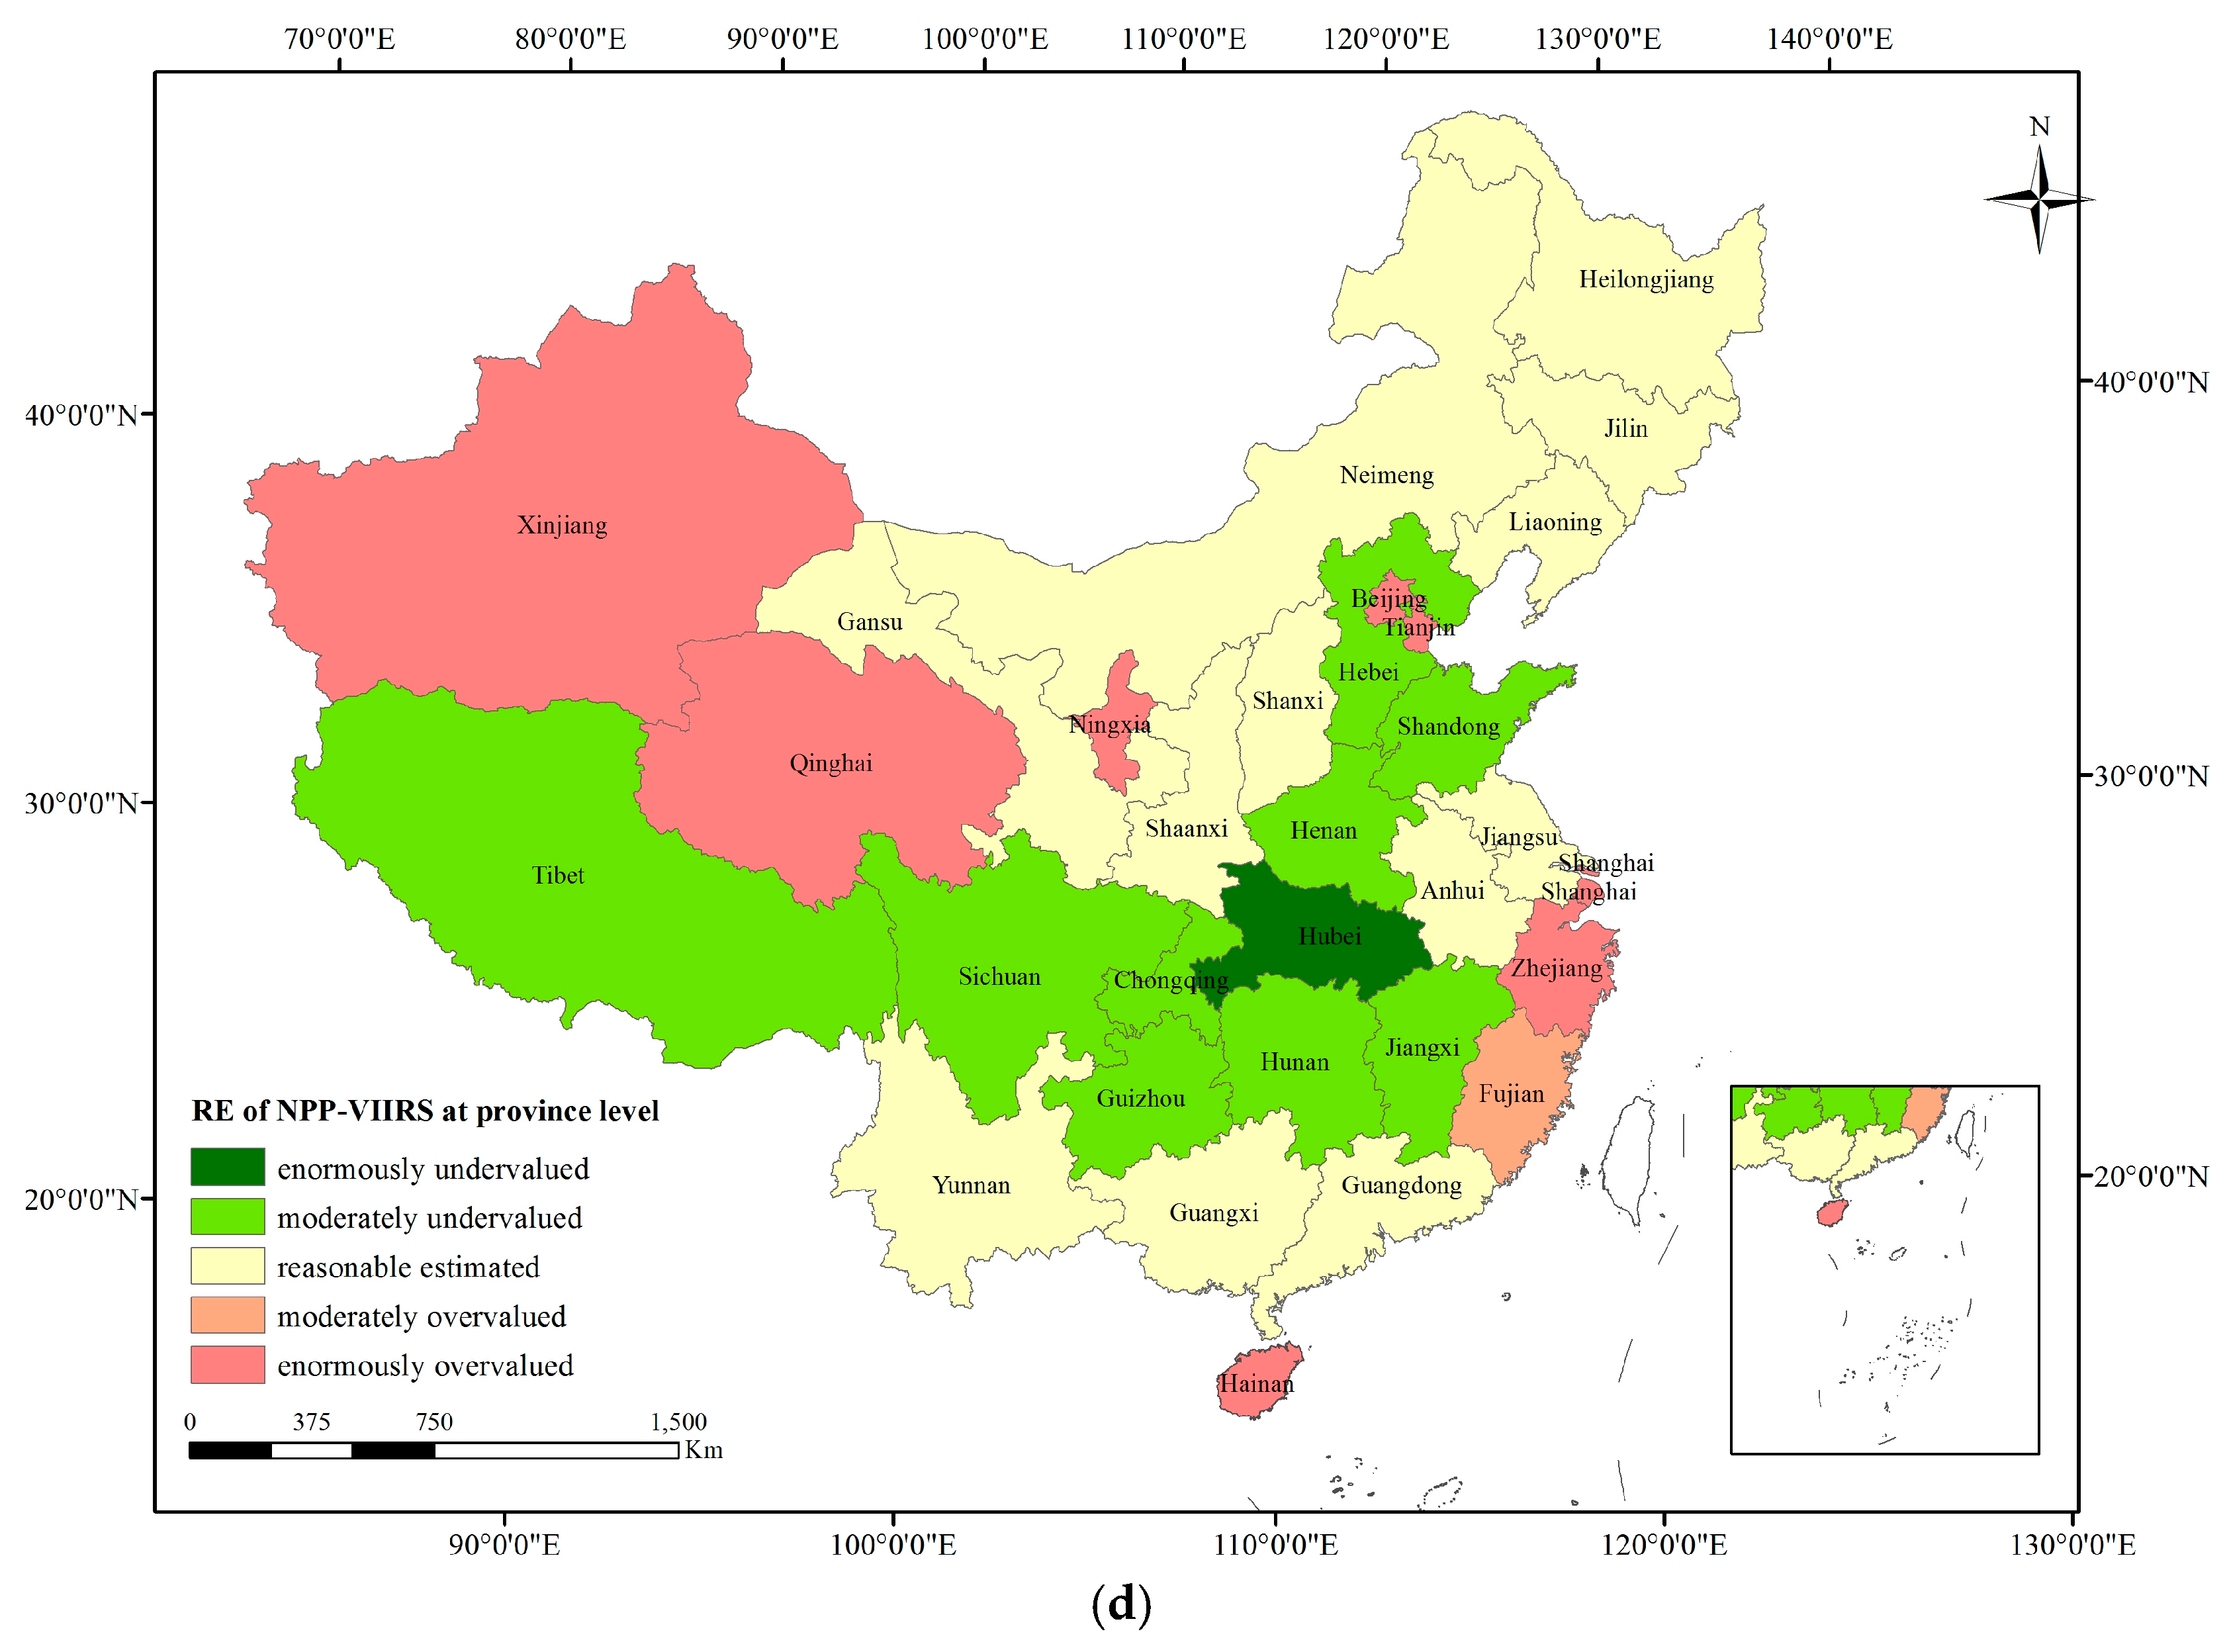
4.1. Simple Regression Result at Province Level

As the scatter plots in Figure 1 show the R2 of TNL with CO2 is 0.69 for DMSP-OLS, whereas that of NPP-VIIRS is 0.55. The regression results show that the relationship of TNL and CO2 from DMSP-OLS at province level is better than that of TNL and CO2 from NPP-VIIRS. The regression equations listed in Figure 1 were used to calculate the predicted CO2 emissions for each provincial-level division. The relative error (RE), calculated to evaluate the effect of modeling CO2 emissions with nighttime light data, is defined as:
RE = (PCO2 − RCO2)/RCO2
where PCO2 represents the predicted CO2 emissions of the administrative region, and RCO2 represents real measured CO2 emissions that is calculated by PKU-CO2 dataset.
Figure 2 visualizes the spatial distribution of RE. The overestimated regions and the underestimated regions are depicted by (RE > 0) and (RE < 0), respectively. Meanwhile, five classes are established according to REs: <−50% as highly underestimated, −50–−30% as moderately underestimated, −30–30% as reasonable error, 30–50% as moderately overestimated, and >50% as highly overestimated.
As represented in Figure 2, the number of underestimated regions is slightly higher than that of the overvalued areas for both the nighttime light datasets. The overestimated regions are mainly located in the eastern coastal regions of China and some provinces in the northwest, while the middle parts are almost underestimated. For the nighttime light data, light spillover happens easily in the coastal areas, especially islands surrounded by the sea, such as Hainan, which results in overestimation of the total amount of lights. With respect to DMSP-OLS and NPP-VIIRS, the attributions (overestimation or underestimation) of provinces were roughly consistent, while the attributions by the two datasets were inconsistent for several provinces in western China (such as Shanxi and Gansu) and Heilongjiang which is located in the northernmost part of China. Heilongjiang was underestimated in NPP-VIIRS while overestimated in DMSP-OLS.
Among the 31 provinces, 16 provincial units for DMSP-OLS, and 12 for NPP-VIIRS are within reasonable error range, which is accepted as high accuracy. These provinces are mainly located in northeast and southern China. The spatial distribution of DMSP-OLS is a little more concentrated than that of NPP-VIIRS. Compared to NPP-VIIRS, Hebei, Shandong, Henan, and Fujian have higher accuracy with DMSP-OLS. The outliers (RE > 50%) are mainly distributed in western China. RE was polarized across northwest China (overvalued) and southwest China (undervalued); in particular, the predicted CO2 emissions in Tianjin and Beijing were found to be more than twice the real CO2 emissions in both the nighttime light datasets.
By comparing the REs and R2 of DMSP-OLS and NPP-VIIRS at province level, we conclude that modeling CO2 emissions with DMSP-OLS is much better than modeling with NPP-VIIRS. It is also inferred that the geographical location may have an influence on the estimation results because of the agglomeration of the overestimated regions (the closer the region to the offshore, the greater the possibility of overestimation).

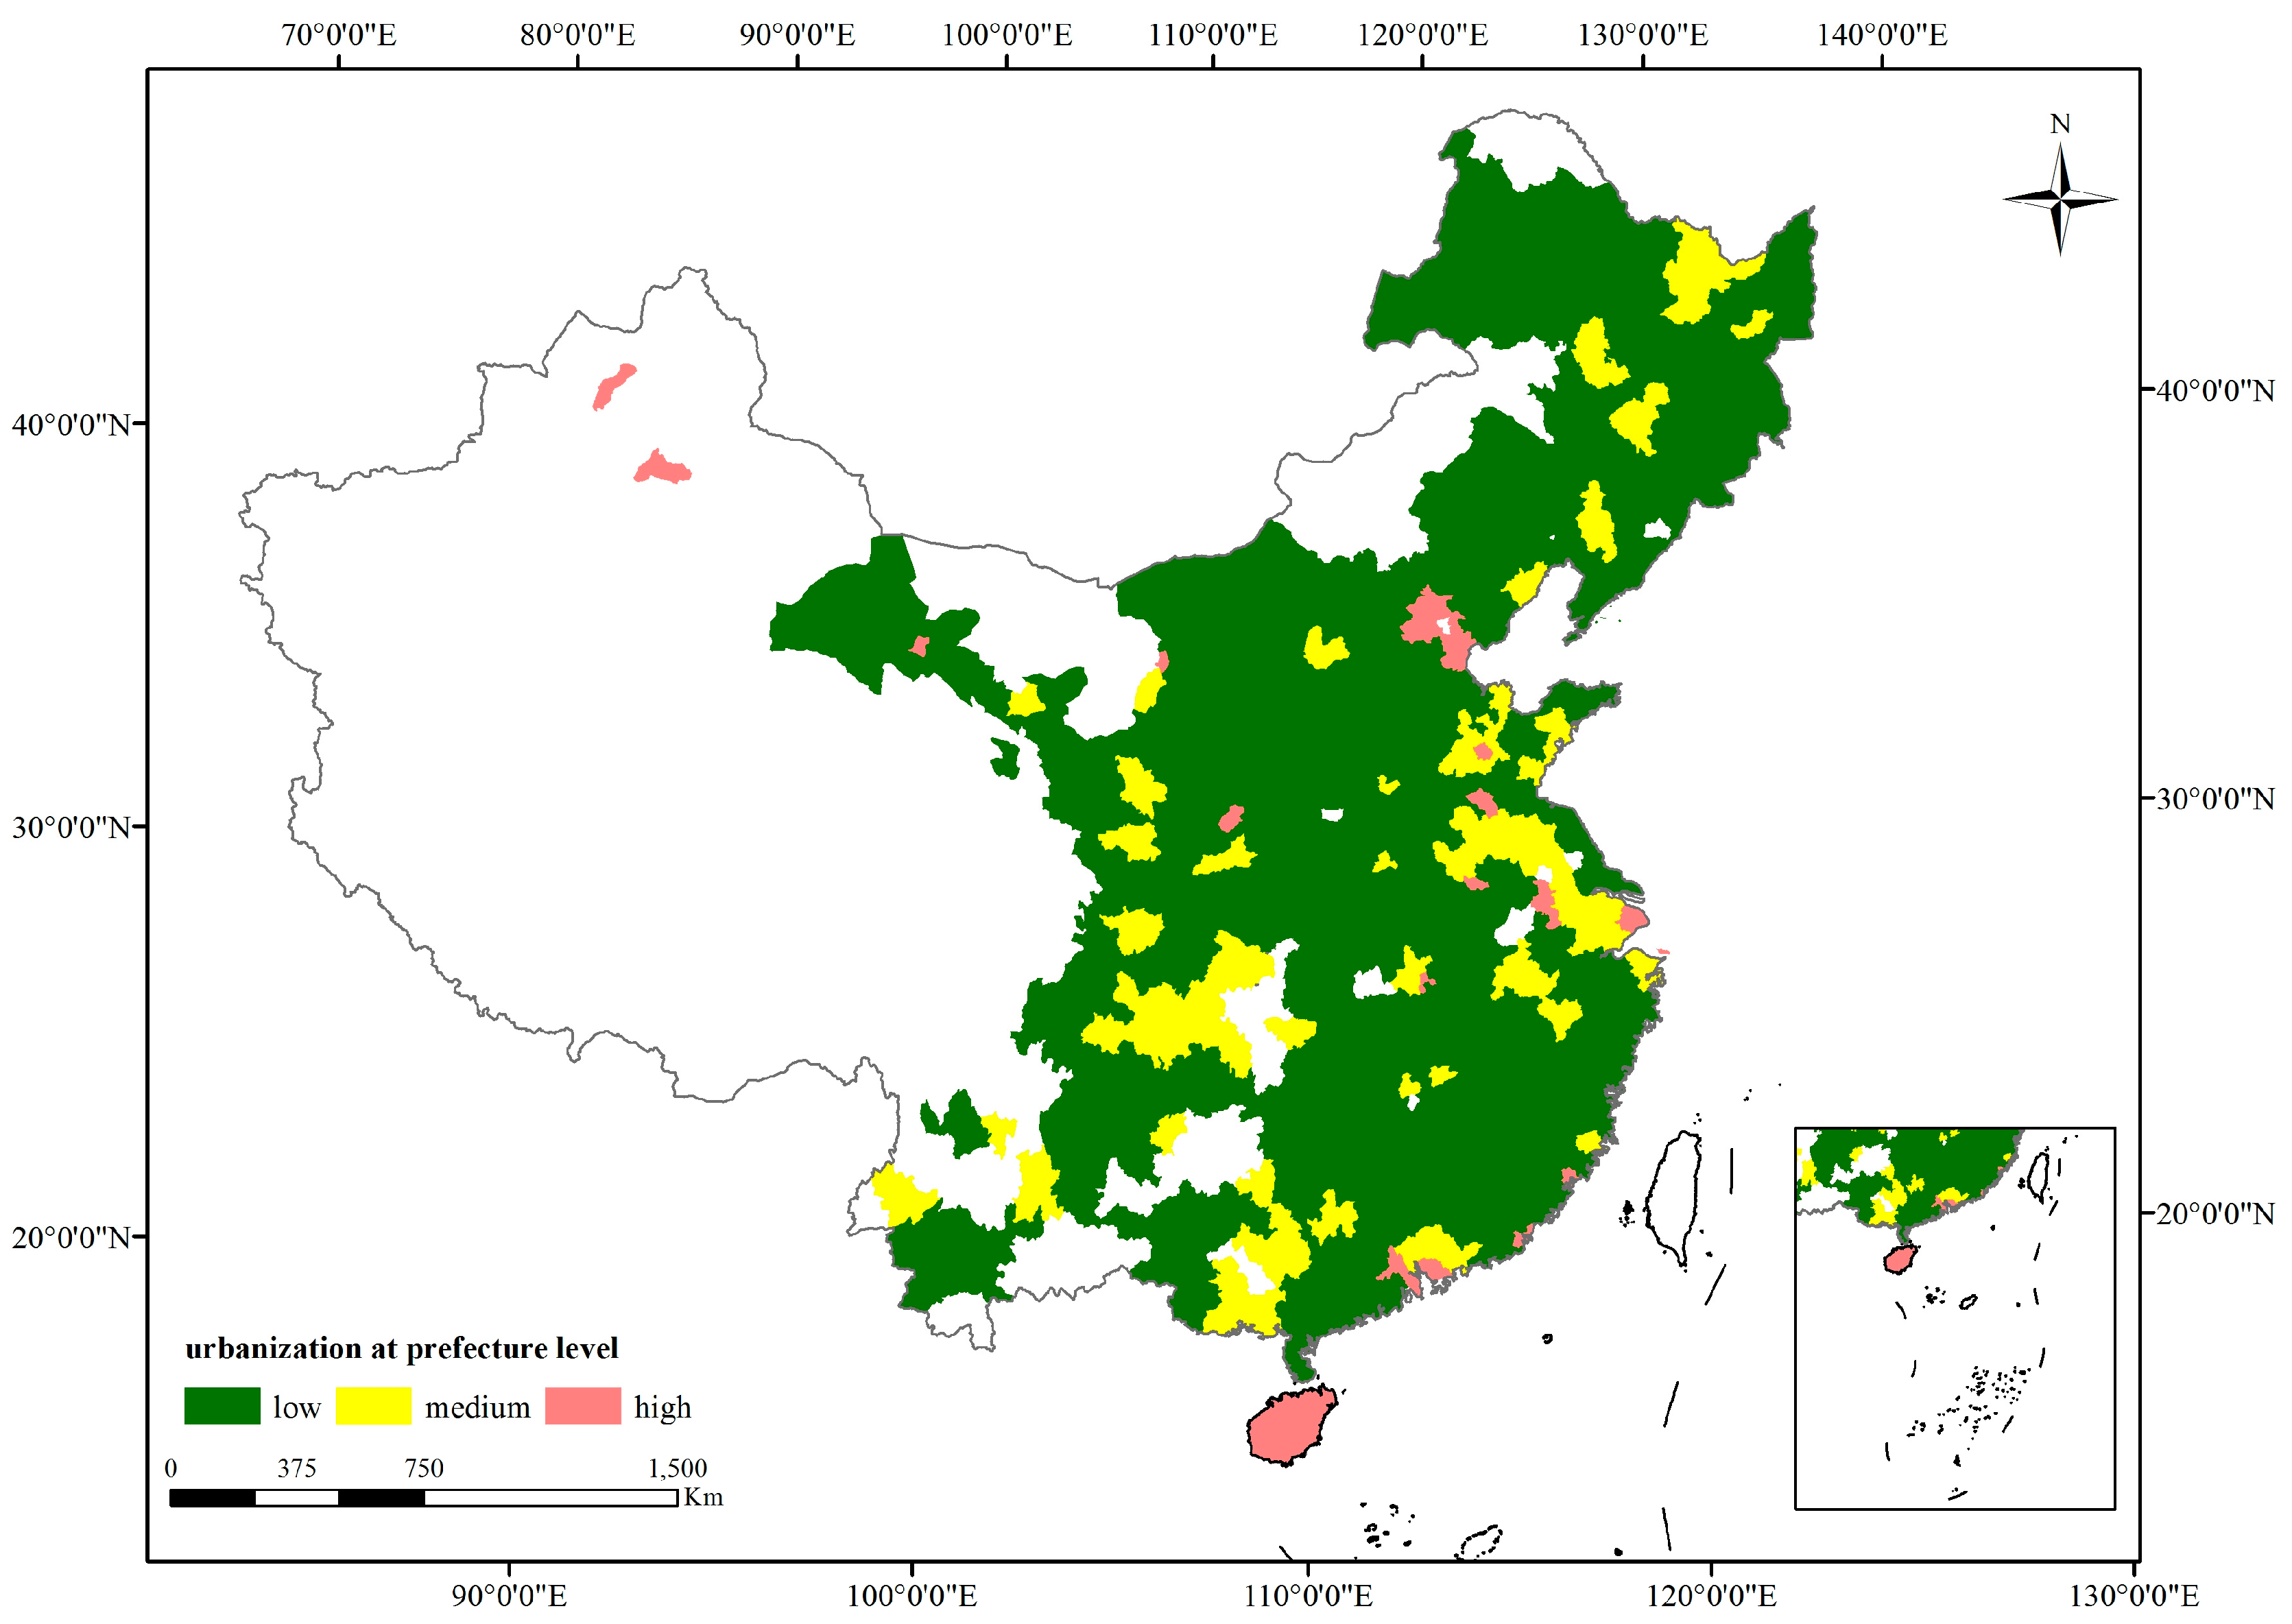
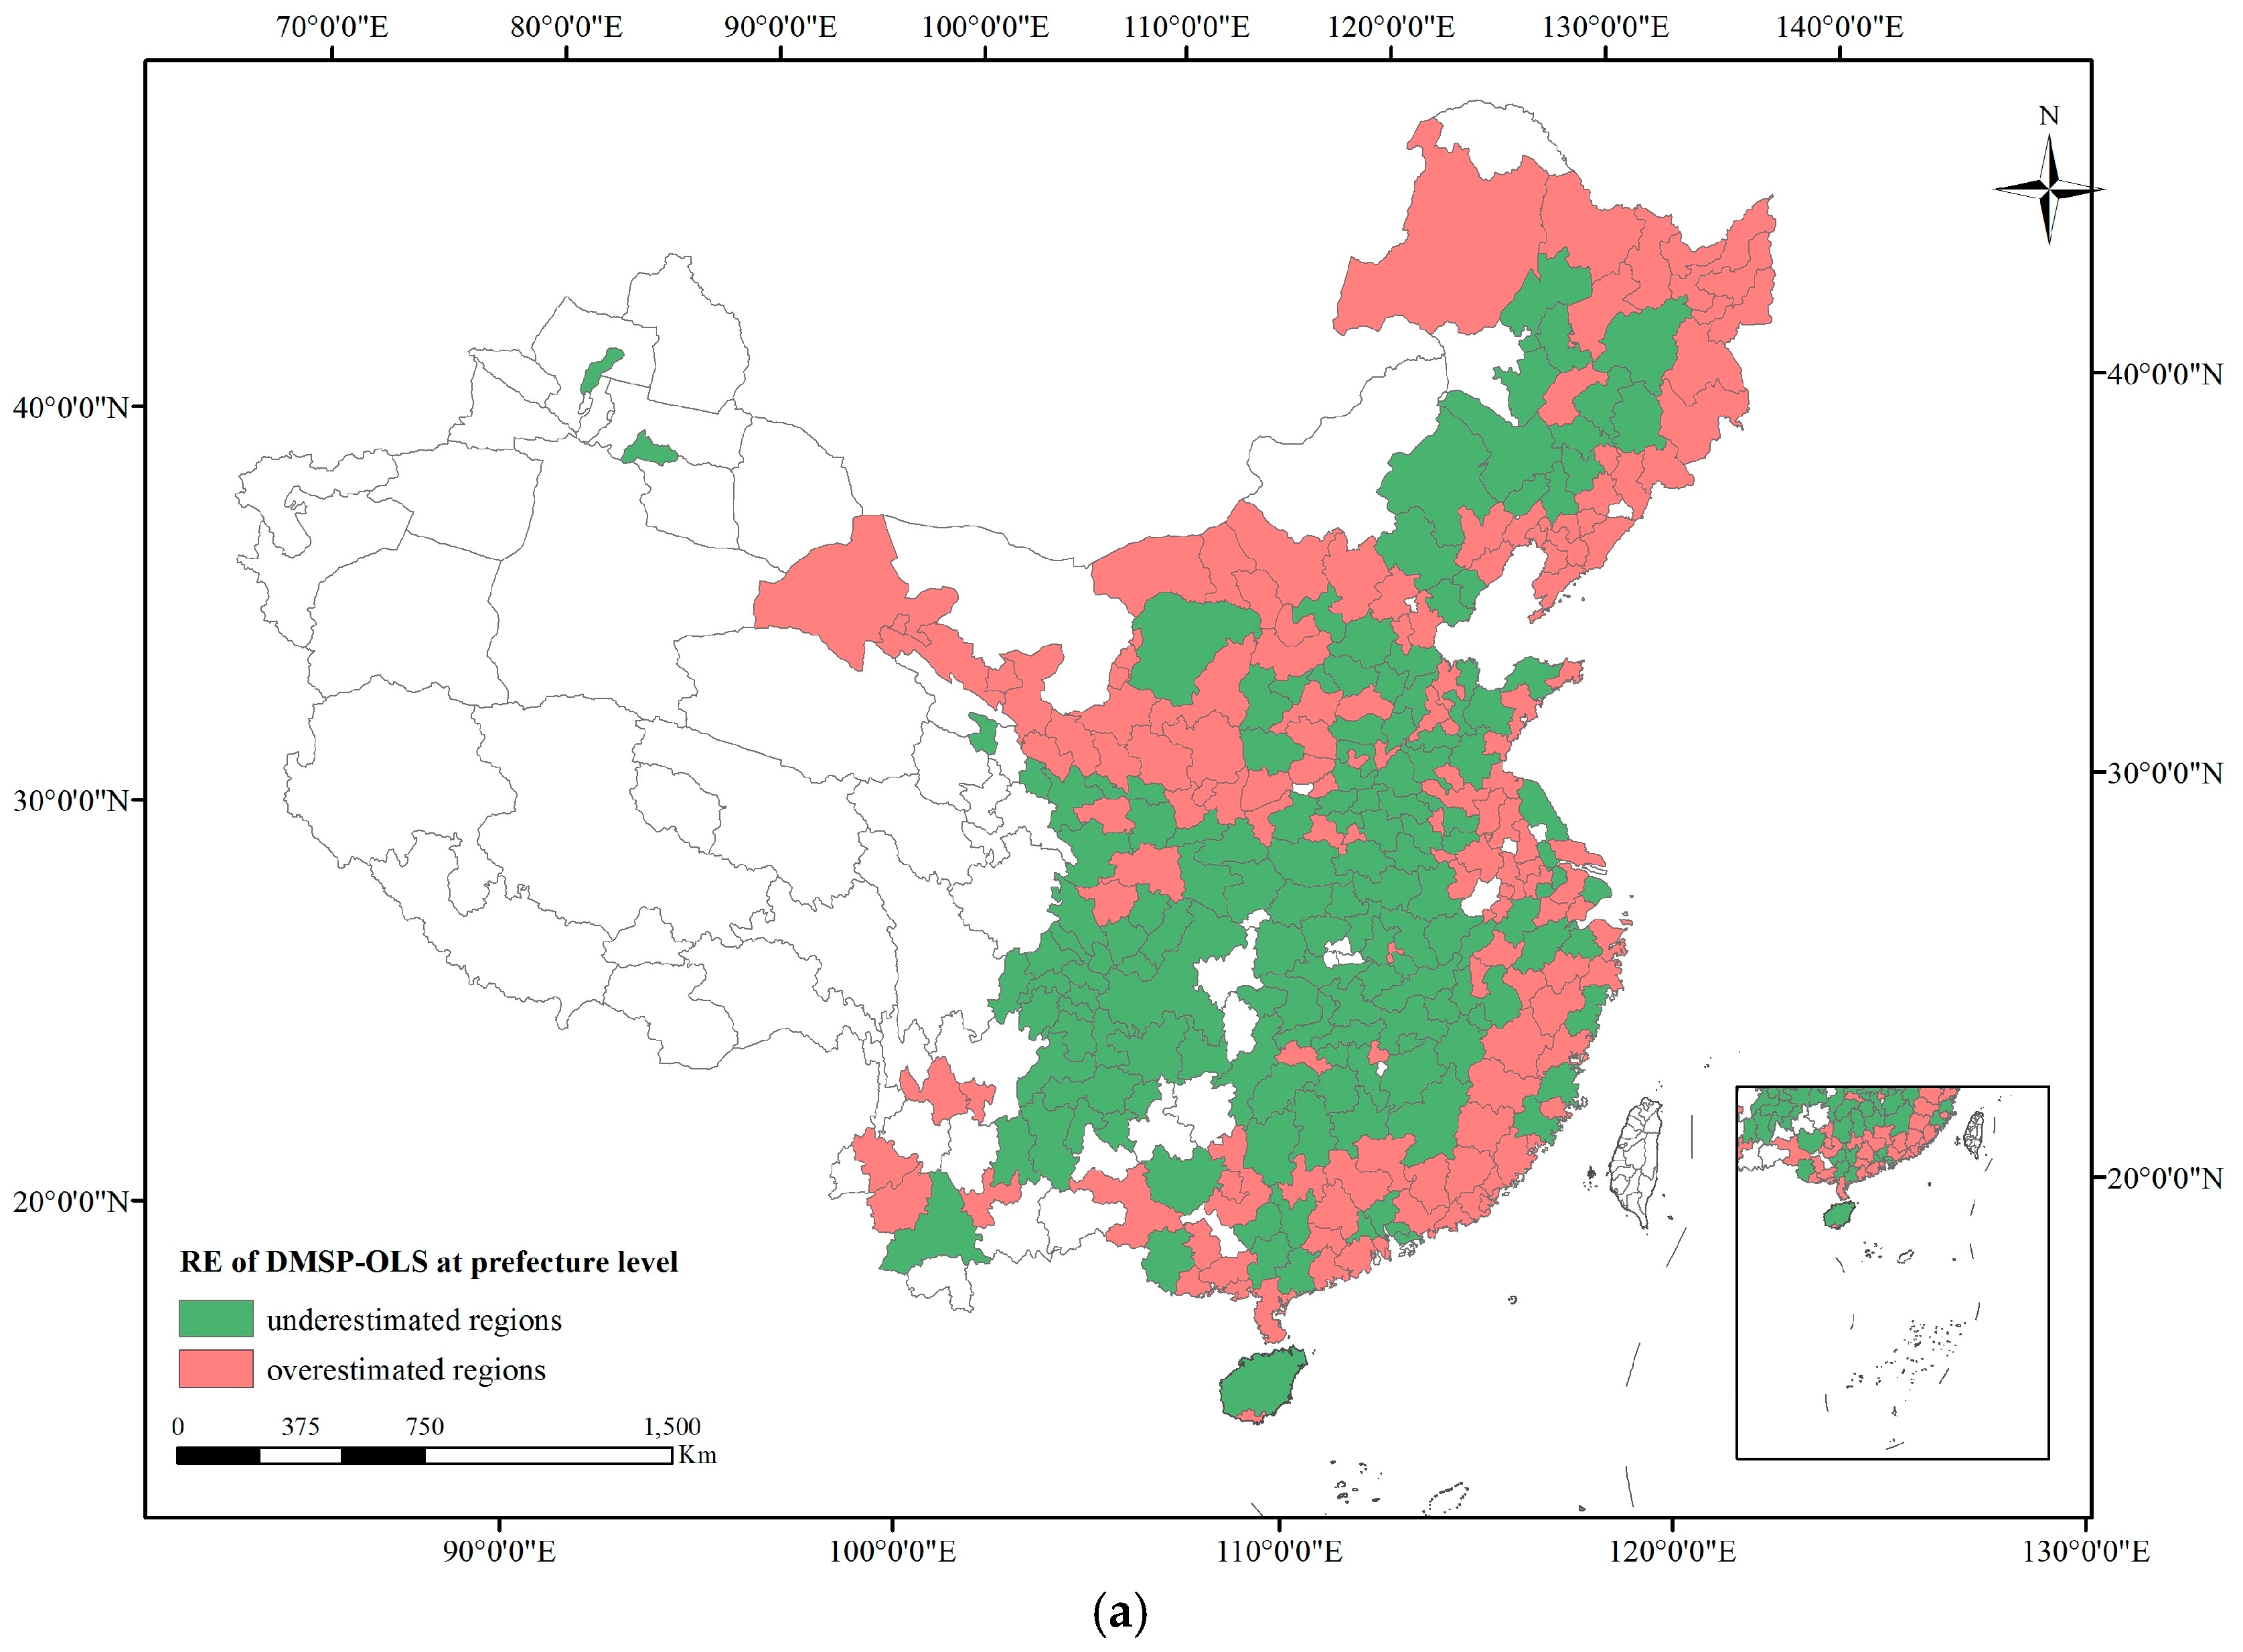
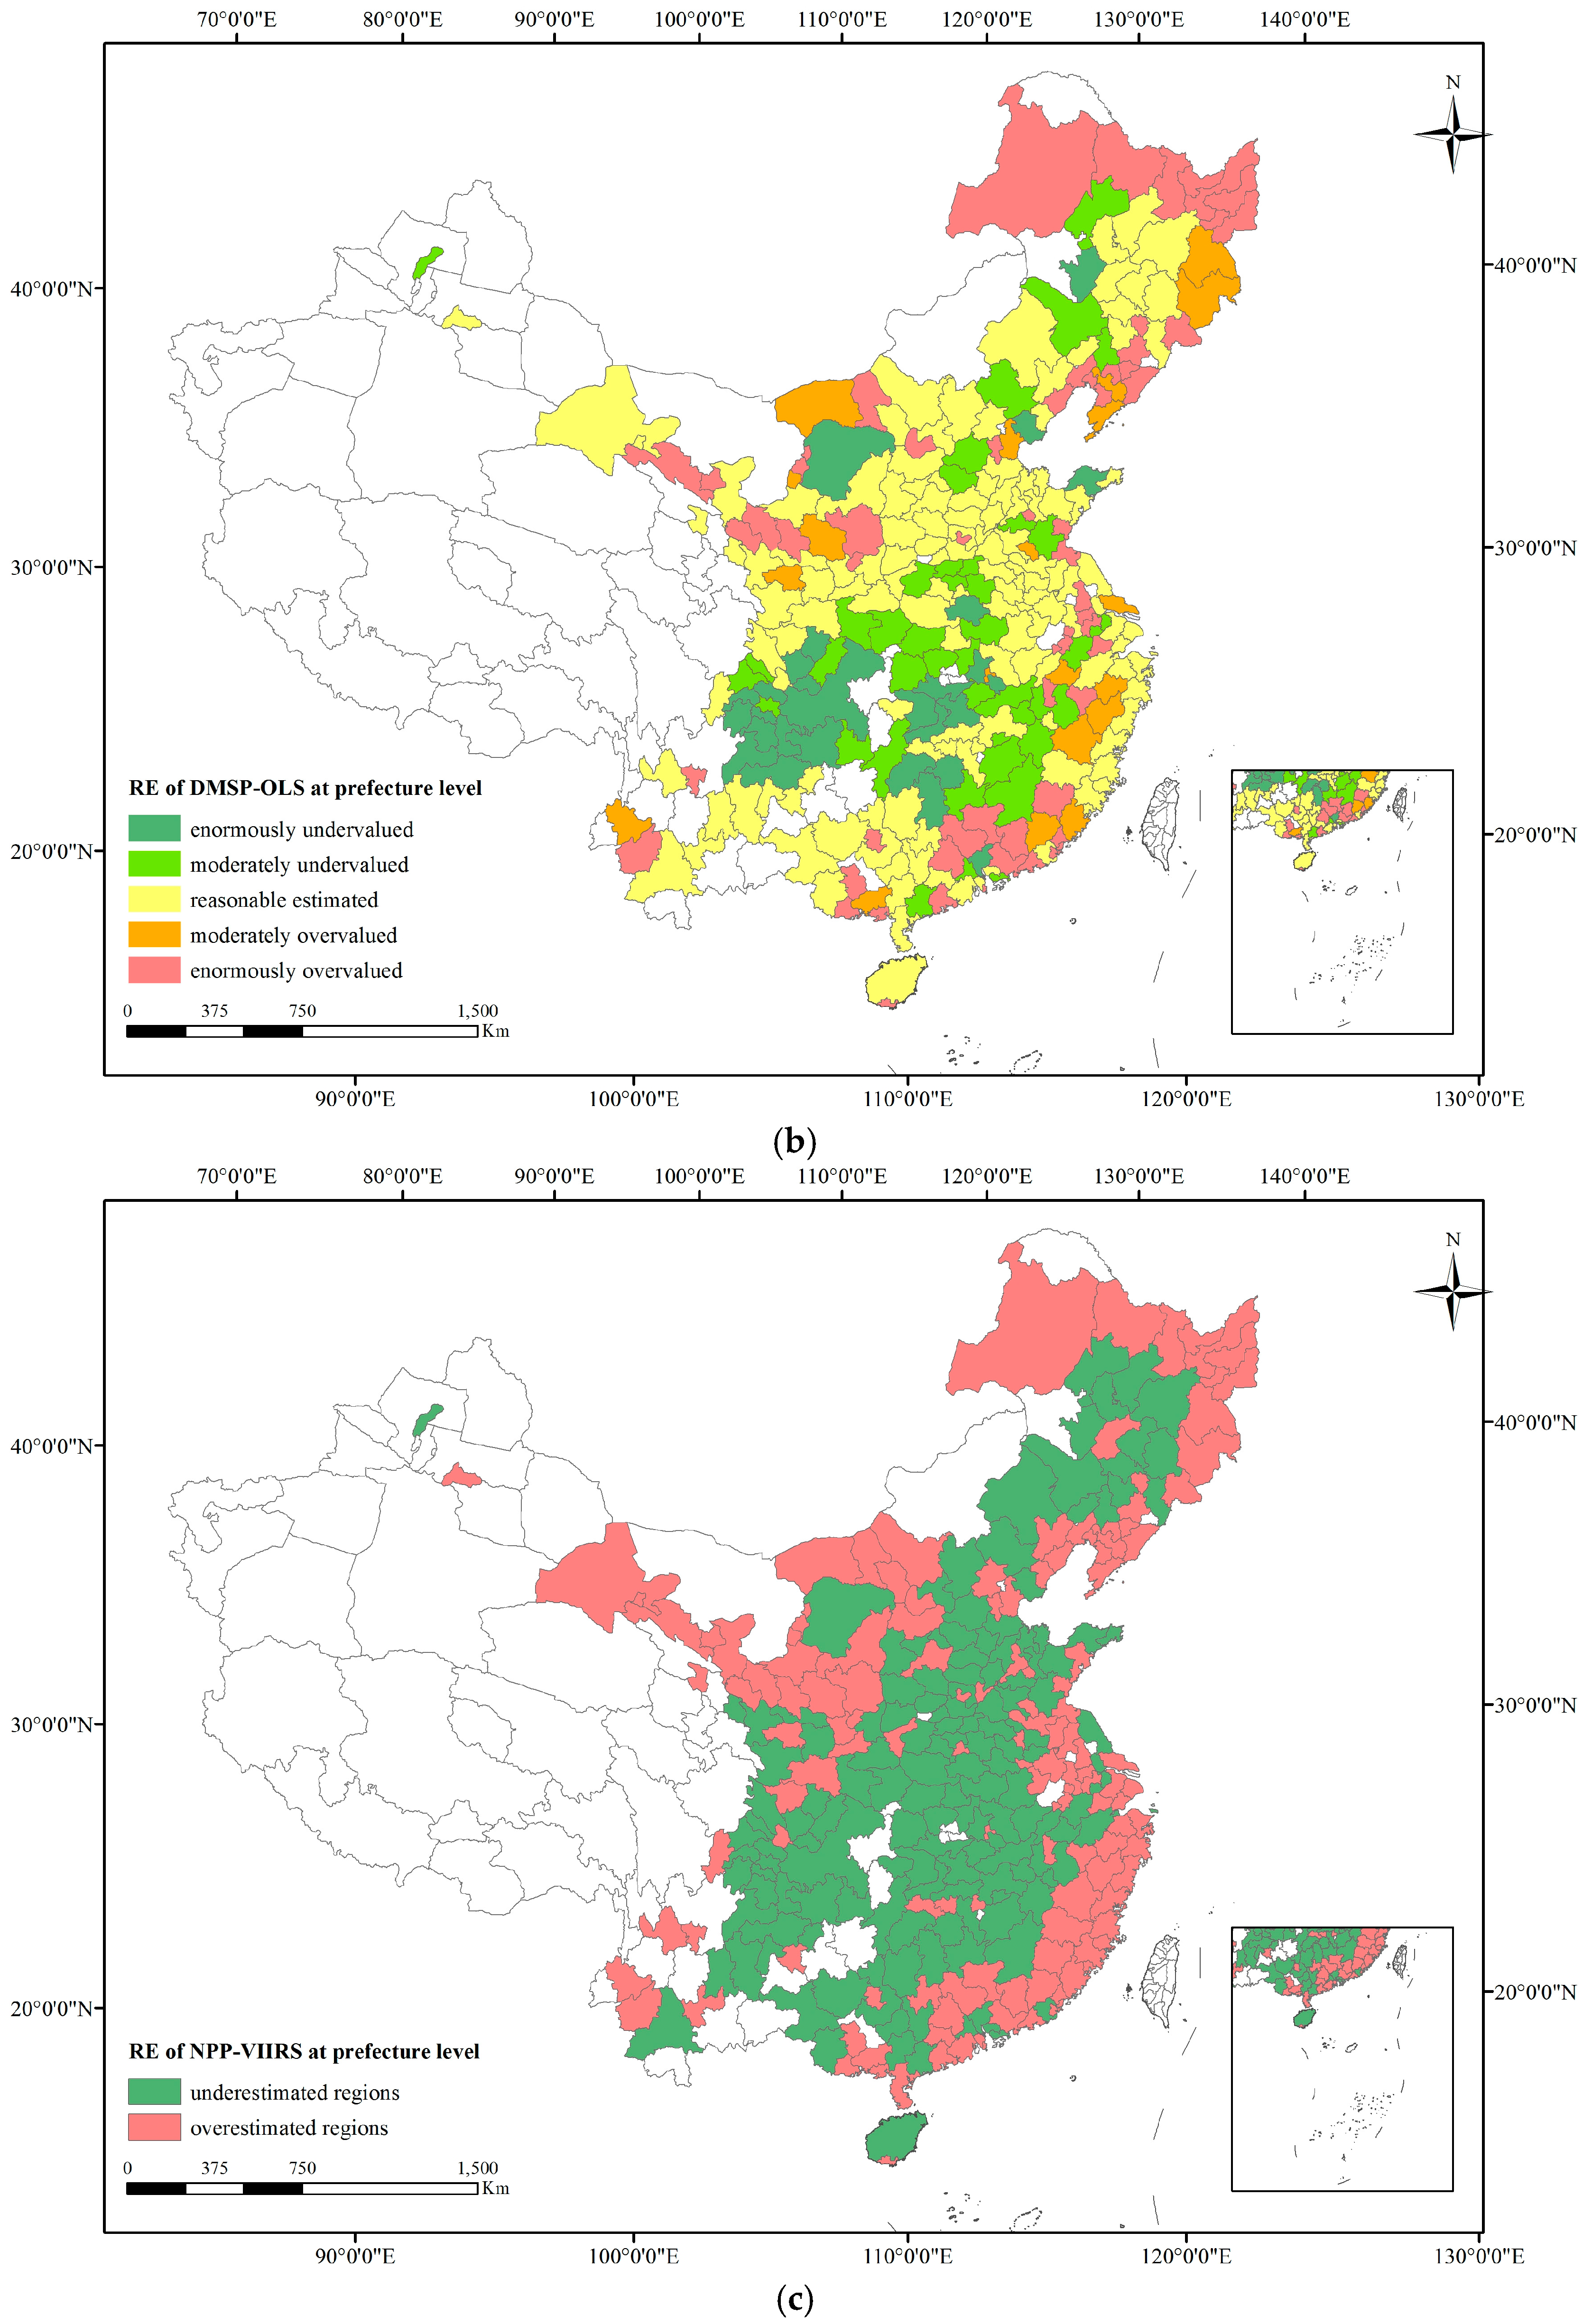
4.2. Simple Regression Result at Prefecture Level

As the two fitting curves in Figure 3 show, the TNL-CO2 relationship for DMSP-OLS is slightly better than that of NPP-VIIRS at prefecture level, and the difference of R2 is very small, especially when compared to that of the provincial divisions. As represented in Figure 4, for both DMSP-OLS and NPP-VIIRS, the numbers of underestimated regions and overestimated regions are roughly equal, but the spatial differentiation of REs in the overestimated regions and the underestimated regions is significant: the overestimated areas are mainly located in the east, while the underestimated regions are in the middle. For the five-category classification of REs, the highly undervalued and overvalued are concentrated in the southwest and eastern coastal areas of China, respectively. A comparison between DMSP-OLS and NPP-VIIRS shows the difference in quantity between DMSP-OLS and NPP-VIIRS in the regions within reasonable error range and the undervalued regions (including the moderately undervalued regions and enormously undervalued regions). The number of regions within reasonable error range in DMSP-OLS is 5% higher than in NPP-VIIRS, and the number of the undervalued regions in DMSP-OLS is 4% lower than NPP-VIIRS. The number of overestimated regions (including moderately overvalued regions and enormously overvalued regions) shows that the TNL-CO2 relationship estimated with NPP-VIIRS is prone to underestimation when compared to estimations from DMSP-OLS.
TNL-CO2 regression analyses at prefecture level show that, the difference between DMSP-OLS and NPP-VIIRS is not significant. However, the effect of modeling CO2 emissions with nighttime light data at prefecture level is not as robust as that obtained at the provincial level. Thus, modeling CO2 emissions with the nighttime light data might be more suitable at larger scales.

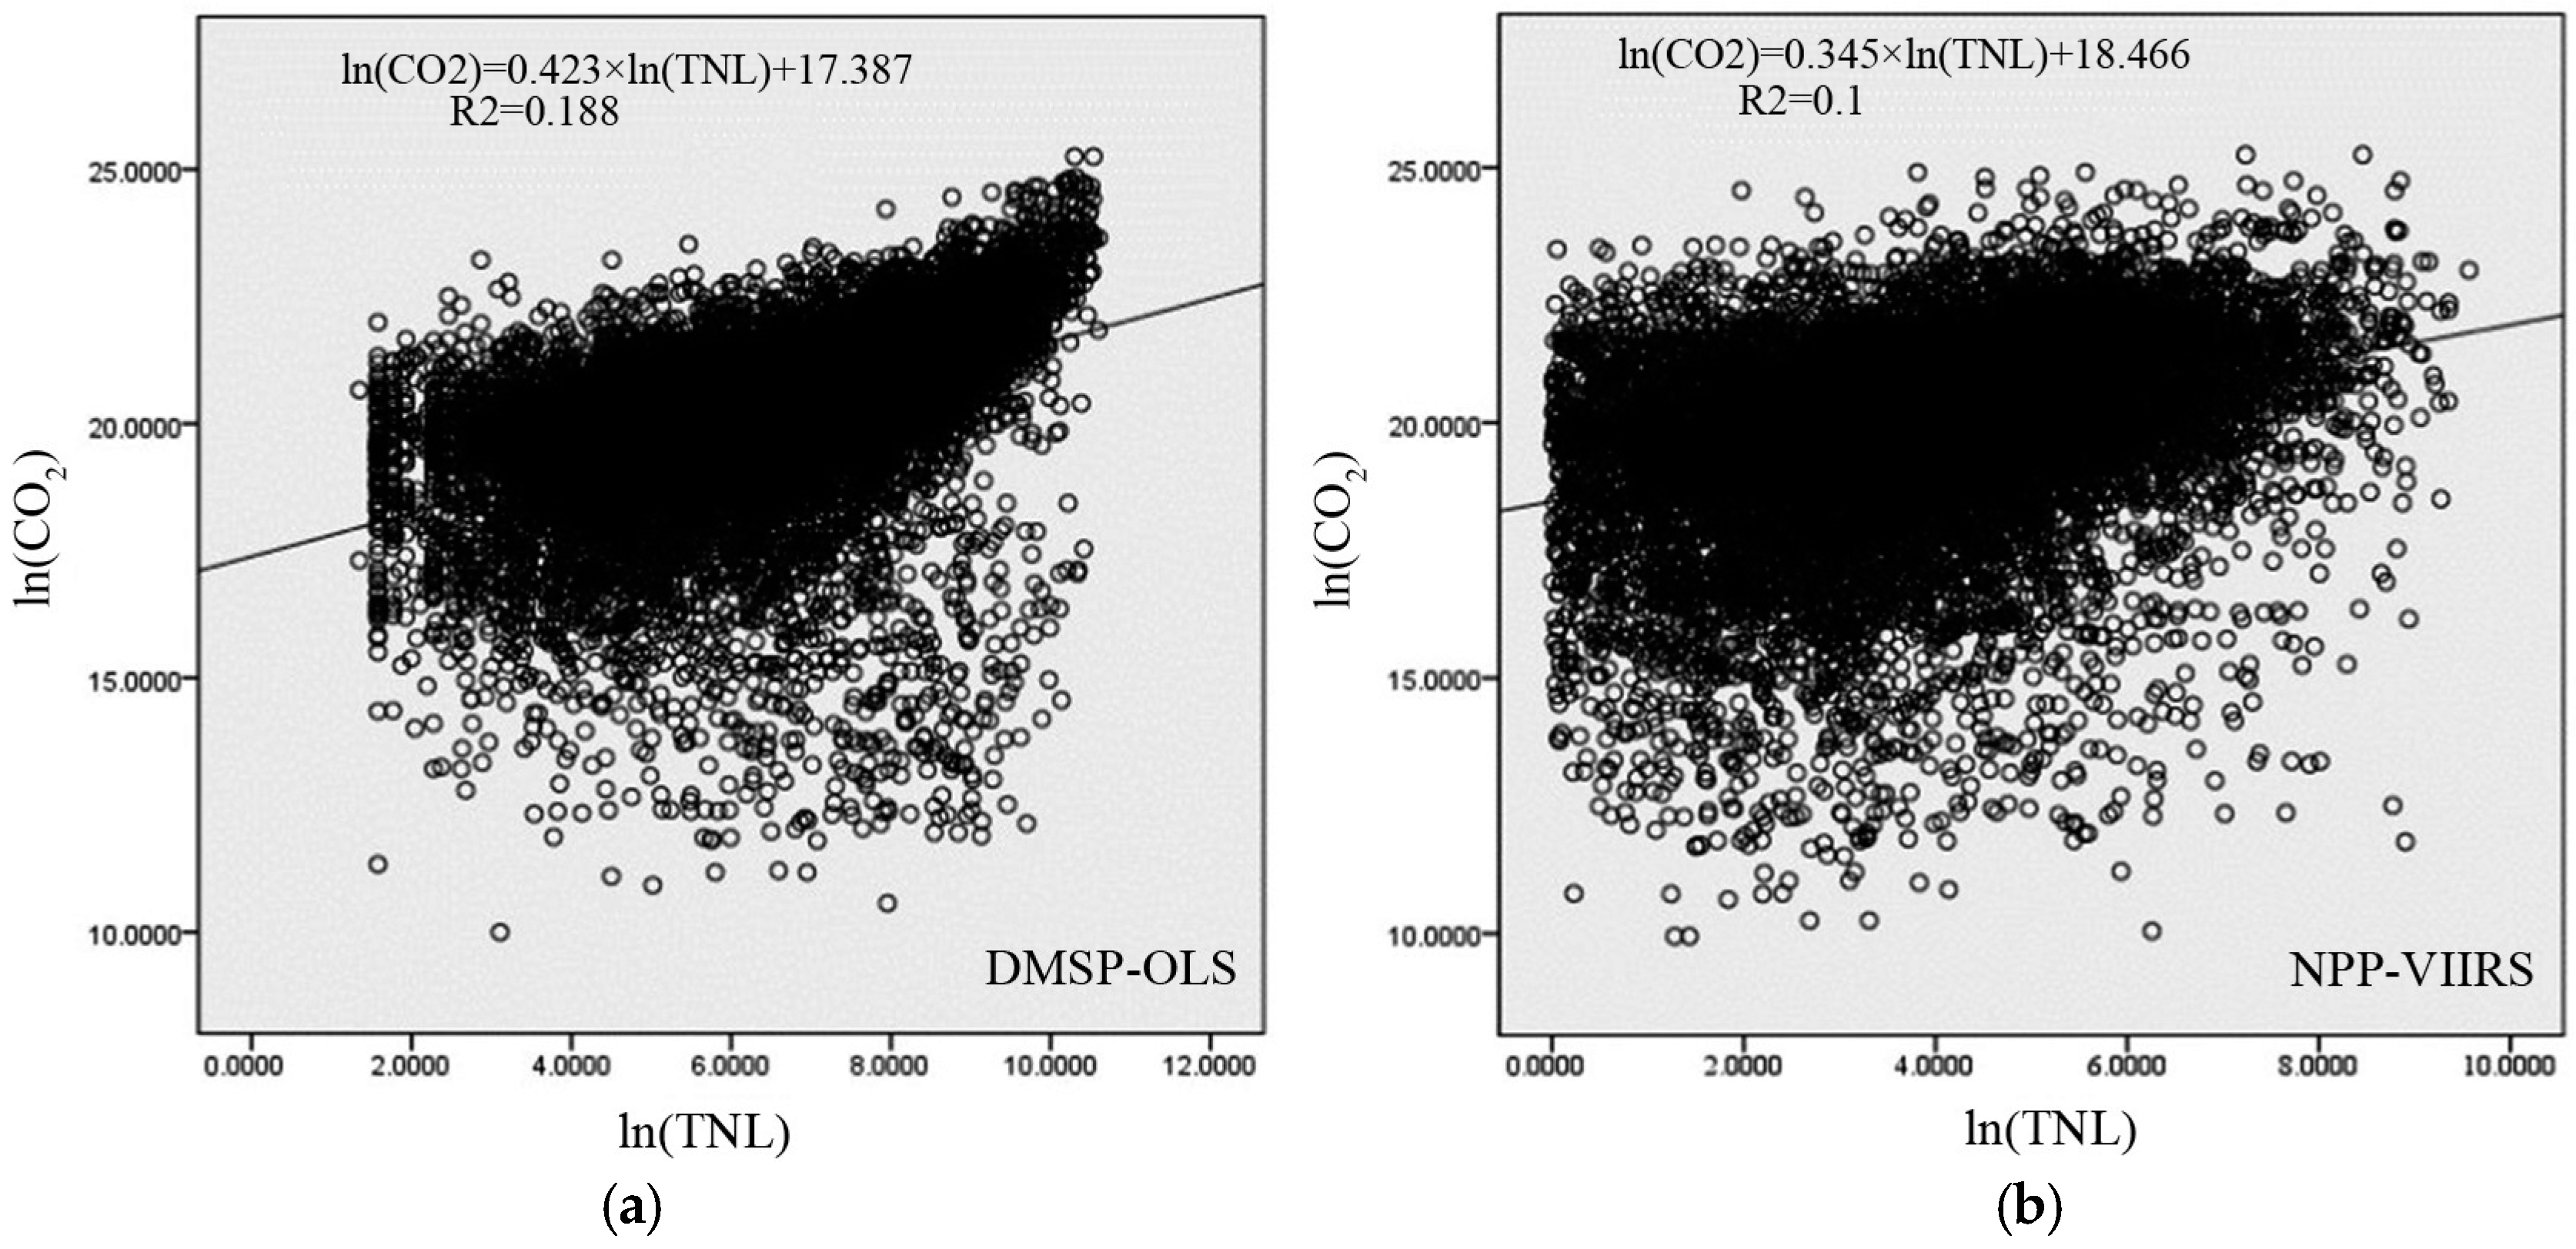
4.3. Simple Regression Result at 0.1° × 0.1° Grid Level

The curve fitting of TNL-CO2 at 0.1° × 0.1° grid level is evidently weaker than that at the provincial and prefectural levels, especially for NPP-VIIRS. The log-log linear relationship of TNL and CO2 is not obvious, and there are many outliers. In contrast, the lights of DMSP-OLS show a relatively strong relationship with CO2 emissions.
In contrast to the R2 of TNL-CO2 regression at different levels in Table 2, the influence of spatial scale on the regression result is evident. At provincial level, both DMSP-OLS and NPP-VIIRS model CO2 emissions better, however the difference between DMSP-OLS and NPP-VIIRS is significant, with DMSP-OLS performing better. Thus, it can be inferred that DMSP-OLS is better for modeling CO2 emissions. At prefectural level, both DMSP-OLS and NPP-VIIRS are shown to map CO2 emissions to a certain degree, and the difference between them is negligible, giving no significant advantage to DMSP-OLS. Thus, the effect of modeling CO2 emissions with DMSP-OLS and NPP-VIIRS is similar. At 0.1° × 0.1° grid level, the relationship of TNL-CO2 with both DMSP-OLS and NPP-VIIRS is weaker, especially for NPP-VIIRS. The linear relationship between TNL and CO2 emissions is not evident, Modeling CO2 emissions with nighttime light datasets at 0.1° × 0.1° grid level is not recommended. Hence, both DMSP-OLS and NPP-VIIRS nighttime light datasets model CO2 emissions better at a larger scale, with the advantage of DMSP-OLS increasing gradually at larger scale.

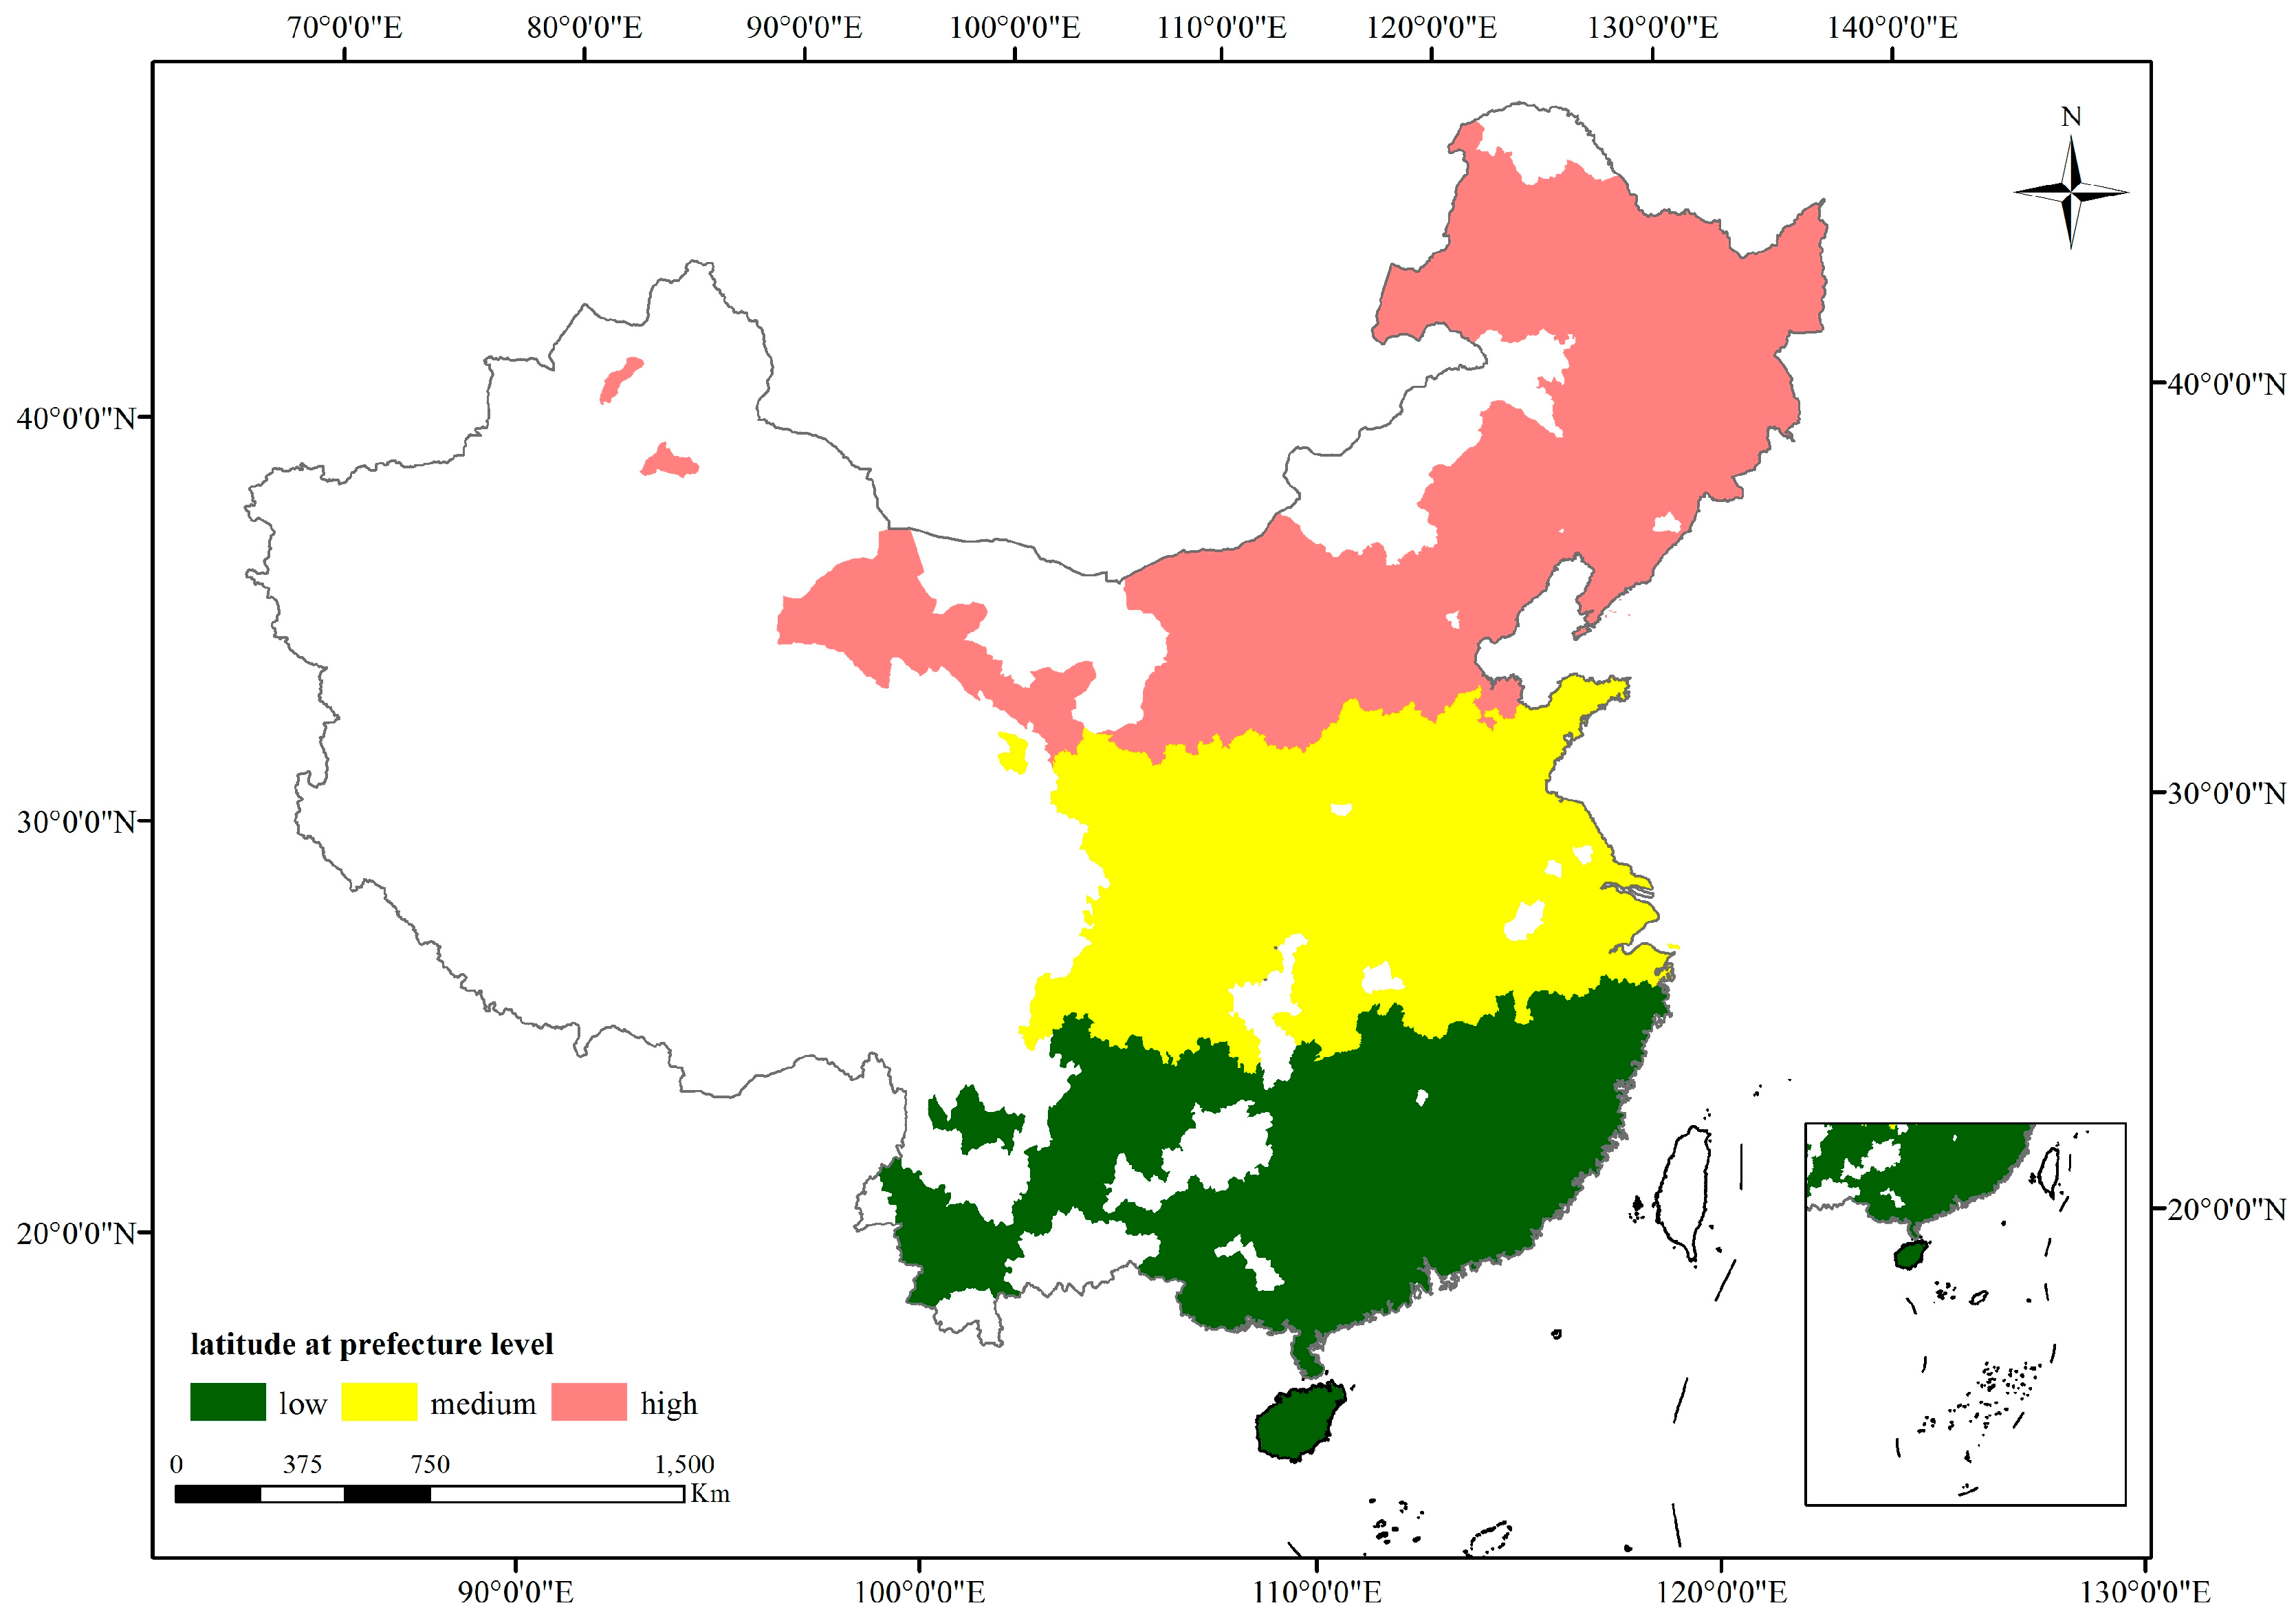
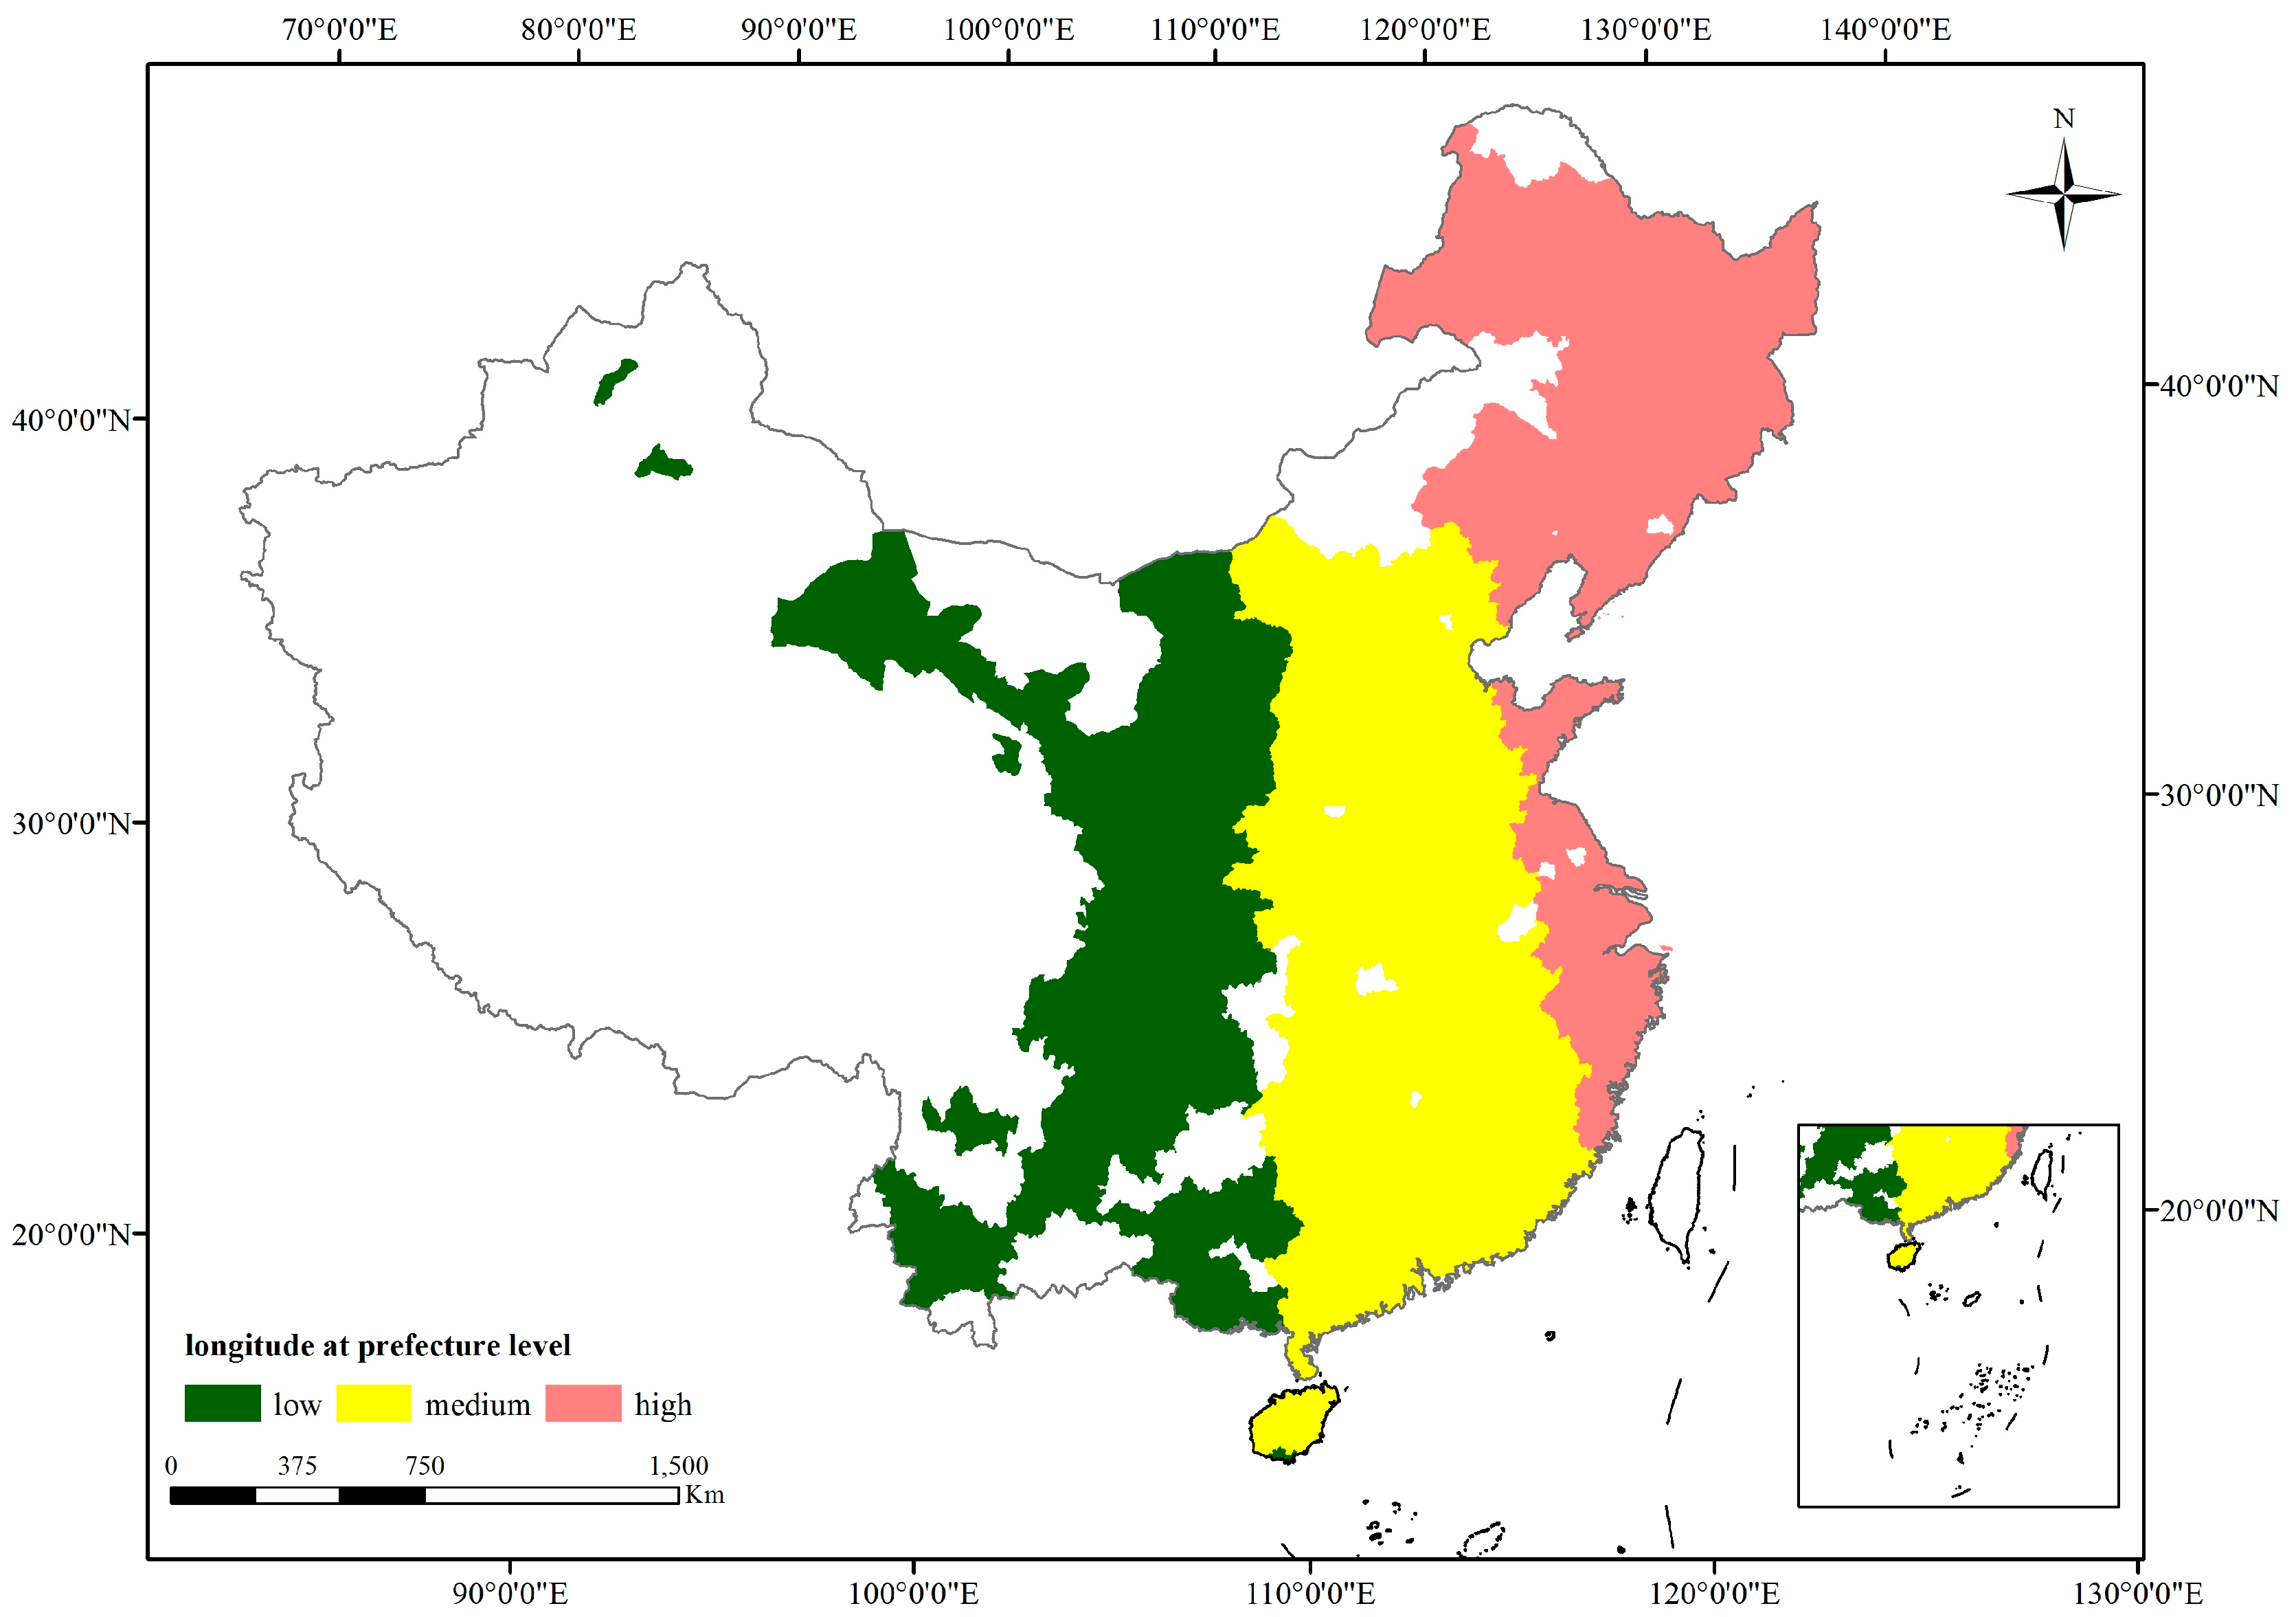
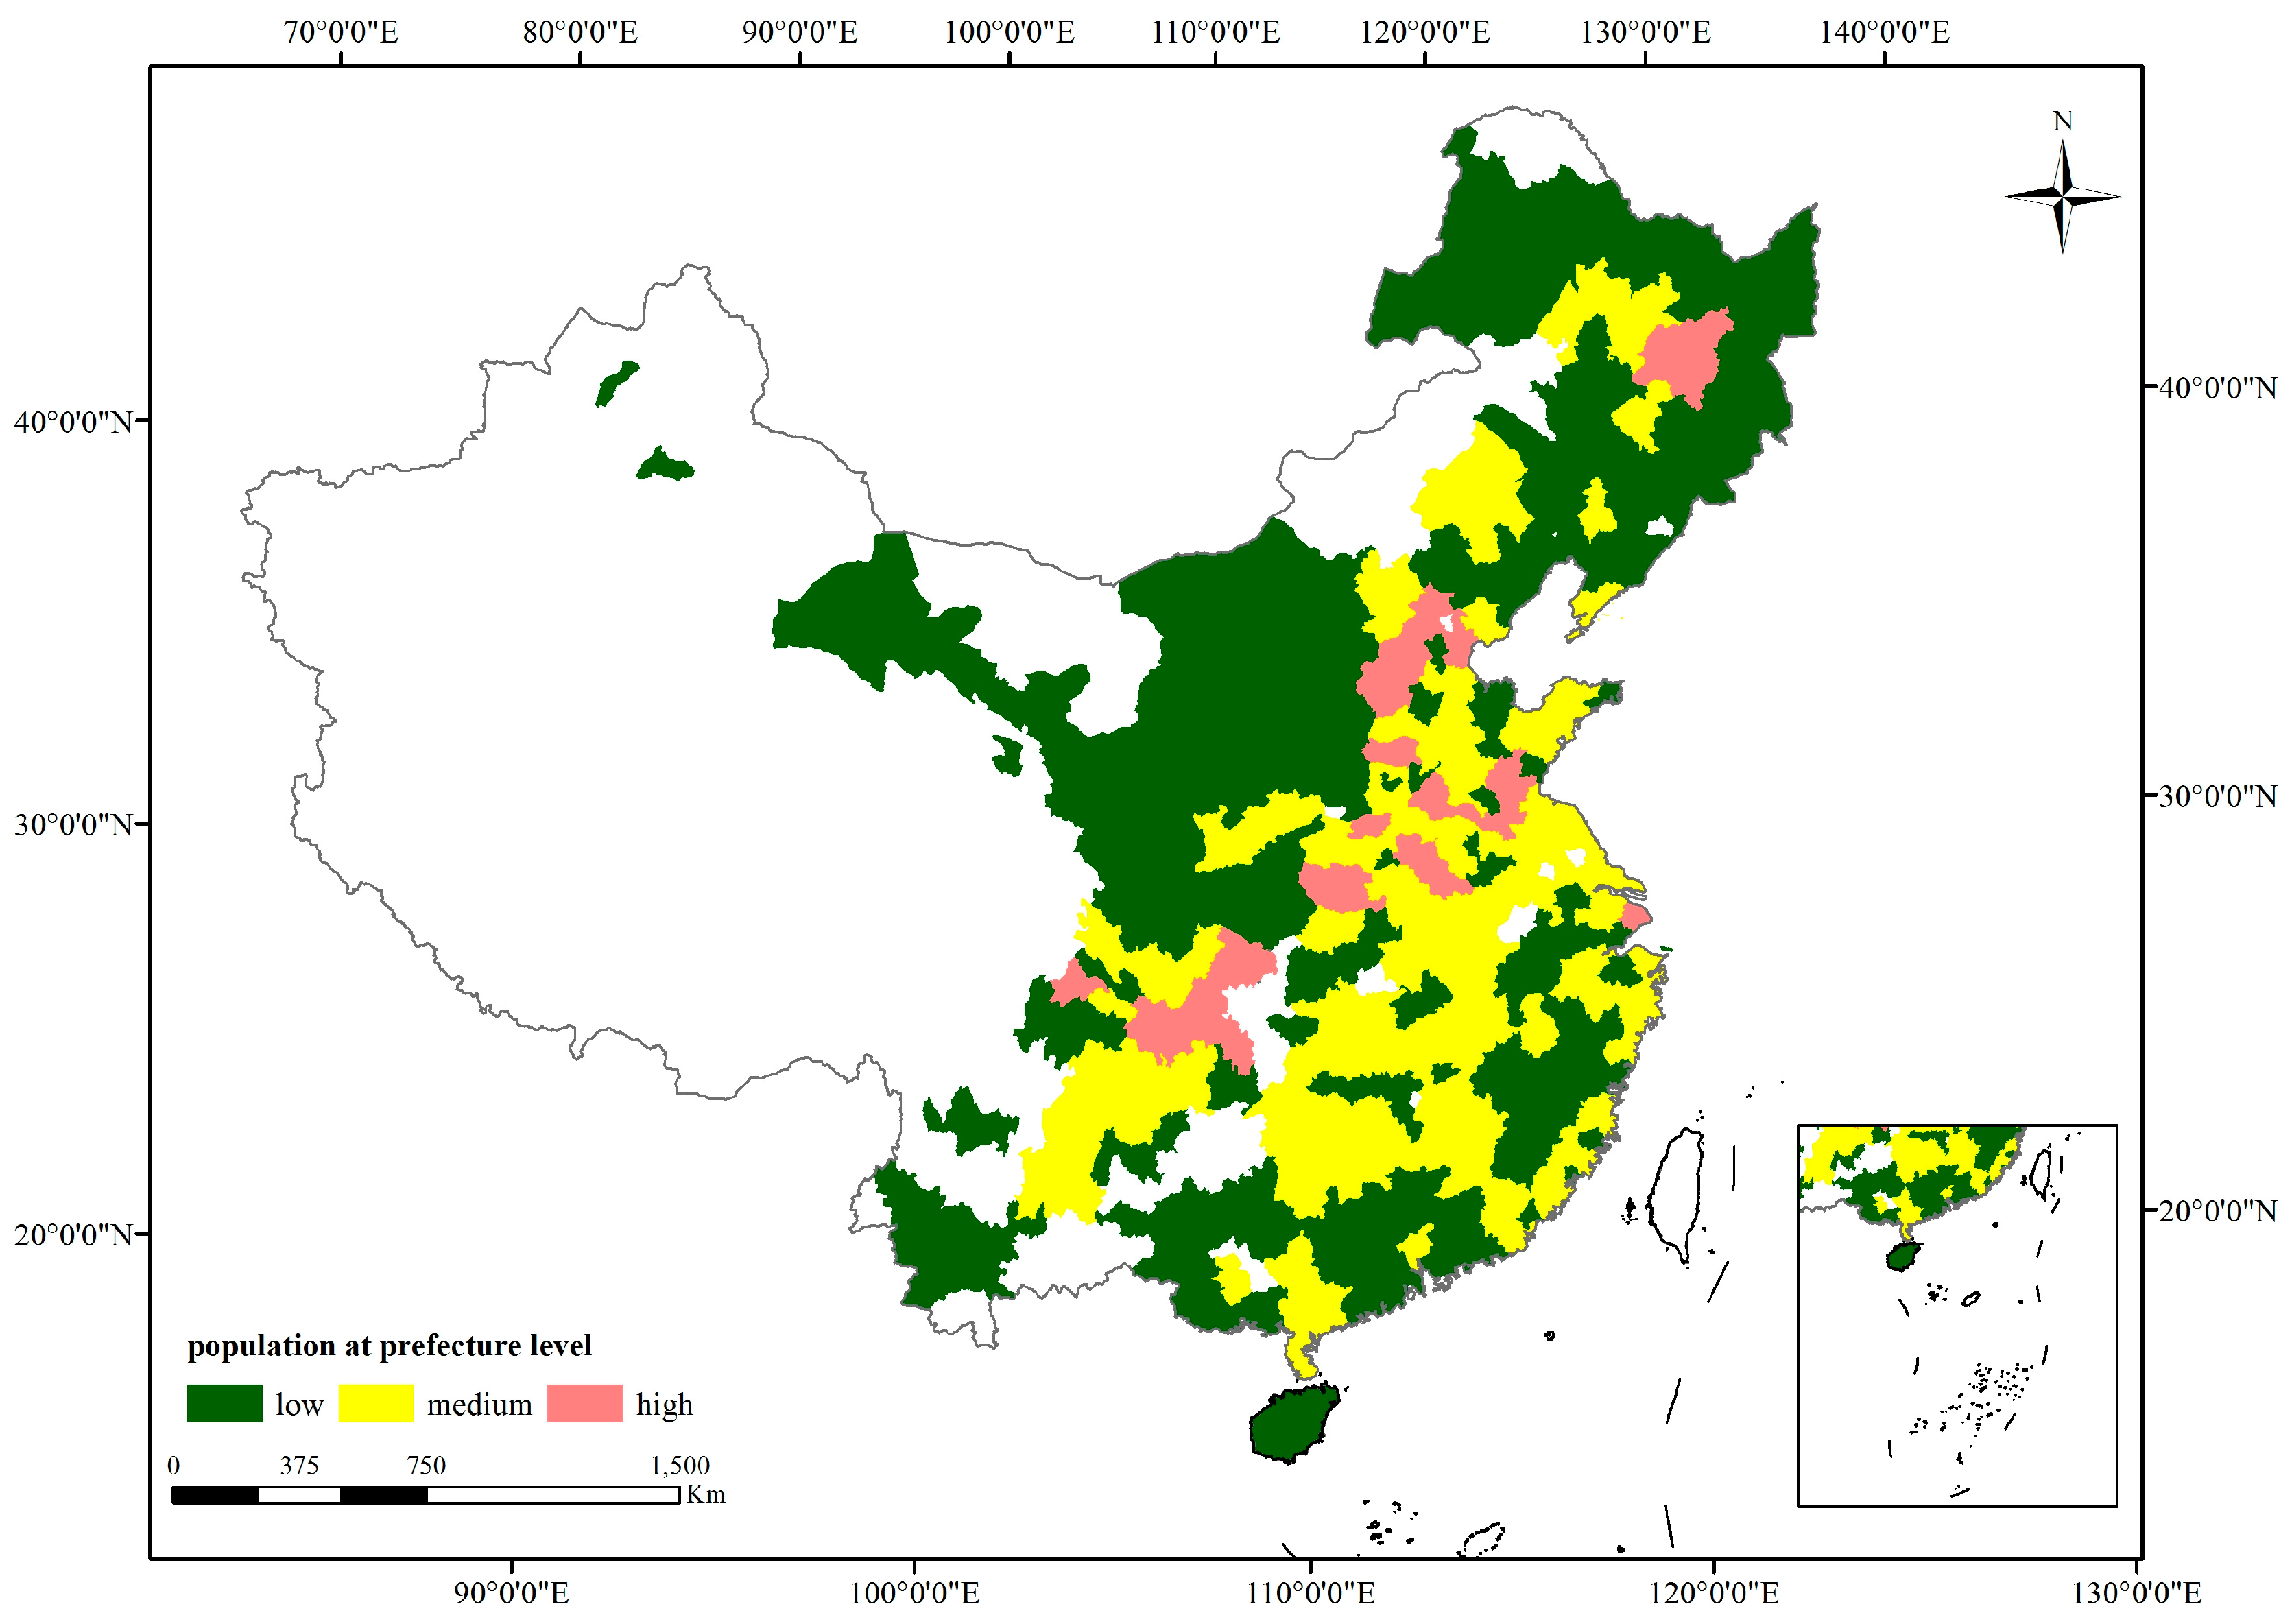
4.4. Potential Factors Affecting Modeling CO2 Emissions

From the analysis on the spatial distributions of REs with the TNL-CO2 model, it can be inferred that the concentration effect exists due to the uncertainty of modeling CO2 emissions with nighttime light data, not only at the provincial level but also at the prefectural level and the 0.1° × 0.1° grid level. It is inferred that this heterogeneity may be affected by the study area, including its geographical location and socio-economic conditions. The sample size at the province level is insufficient and the socio-economic statistics at the 0.1° × 0.1° grid level are unavailable, therefore, 287 prefecture-level cities were selected for this study. The research on the influence of nighttime light data on modeling CO2 emissions was conducted with respect to two aspects, i.e., the geographical conditions of the study area and the socio-economic conditions.
China, which is vast in territory, has a long geographical span from the north to the south, and the relationship between nighttime lights and CO2 emissions may be affected by different geographical spaces. The conditions of illumination vary across high and low latitudes, and can affect the demand for lighting and heating resulting in increasing differences in the energy consumption and CO2 emissions. Moreover, the climate in high latitudes is cold nearly all year round, with snow and ice covering the ground. All of these are likely to have an influence on the radiation in the nighttime light data, the more the snow and the ice, the larger the surface albedo and the higher the DN. Therefore, there may be some differences in the regression effect of the model at different latitudes.
With respect to longitudes, the difference between China’s inland and coastal areas is mainly reflected across the longitude. From the results above, it can be inferred that the distribution of REs in the TNL-CO2 model at all scales is clustered in the coastal and the inland areas, and most of the eastern coastal areas are overestimated, while inland areas are underestimated. It can be speculated that areas in different longitudes have different regression results from modeling CO2 emissions with nighttime light data.
Therefore, in terms of the geographical locations, both the latitude and longitude were considered, and the 287 prefecture-level cities were divided into three types of regions by means of natural breaks, such as high, medium, and low latitude and high, medium and low longitudes (Appendix Figure A1 and Figure A2). Subsequently, regression models were constructed within each category, and the R2 of regression model is shown in the Table 3.
From the results shown in Table 3, it can be inferred that the latitude and longitude have some influence on the regression effect of TNL-CO2 model, and the effects of modeling CO2 emissions with DMSP-OLS and NPP-VIIRS data improve with increasing of latitudes and longitudes. Compared to NPP-VIIRS, the advantage of DMSP-OLS data in modeling CO2 emissions becomes much more evident with an increase in latitudes and longitudes. Both DMSP-OLS and NPP-VIIRS data can model CO2 emissions better at higher latitudes and longitudes, and the TNL-CO2 model in lower latitudes or longitudes is not ideal. Therefore, modeling CO2 emissions at low latitudes or longitudes is not recommended for both DMSP-OLS and NPP-VIIRS, especially for the NPP-VIIRS dataset. A series of studies on the factors affecting CO2 emissions have been conducted in the recent years, and the results show that the spatial distribution of CO2 emissions is influenced by many socio-economic factors, such as the economic development, population, urbanization, and so on [36,37,38,39]. In this study, the economic development level is expressed by GRP per capita, and the population size is regarded as the quantity of population at the end of the year. Additionally, the proportion of the municipal area in the total administration district area represents the urbanization level. Using the method of natural breaks, the 287 prefectural-level cities were divided into three classes, high, medium, and low, as shown in Appendix Figure A3, Figure A4 and Figure A5, and the specific results of regression model within each category are shown in Table 4.
As shown in Table 4, GRP per capita has a significant influence on the effect of modeling CO2 emissions with DMSP-OLS and NPP-VIIRS, especially in regions with high GRP per capita, where the R2 of TNL-CO2 regression has greatly improved compared to the areas with lower GRP per capita. For DMSP-OLS, the increase of GRP per capita has a significant effect on the regression of TNL-CO2 model, and the R2 is significantly higher in areas with high level of the economic development compared to other areas. It is observed that, in terms of GRP per capita, the correlations of TNL-CO2 model based on the two kinds of nighttime light datasets at medium and high level of economic development are strong, and the R2 of TNL-CO2 regression for DMSP-OLS is better than that of NPP-VIIRS in areas with low and medium level of economic development. It can be concluded that modeling CO2 emissions with nighttime light data in areas at high level of economic development is practical and DMSP-OLS is the better choice.
Population size has little effect on the regression effect of TNL-CO2 model, and there are no obvious differences between the TNL-CO2 relationships within the areas of different population classes. In areas with large populations, the TNL-CO2 regression for NPP-VIIRS is slightly better than DMSP-OLS, however, the differences are not obvious for areas with medium and large population sizes. That is to say, the influence of population scale on the TNL-CO2 regression is very weak, and irrespective of the population size, the difference between DMSP-OLS and NPP-VIIRS is small. Therefore, when modeling CO2 emissions with nighttime light data, the population size of the study area is not worth considering.
In terms of urbanization, the regression effect of the two kinds of nighttime light data on CO2 emissions is greatly affected by the urbanization level. With increase in urbanization, the R2 of TNL-CO2 regression model improves greatly, especially for the NPP-VIIRS data. Modeling CO2 emissions with TNL-CO2 regression in high urbanization areas is recommended, especially for NPP-VIIRS data.
In conclusion, the matching effect of TNL-CO2 model is affected by the geographical locations (latitude and longitude), and their GRP per capita as well as the urbanization to various degrees. Both the GRP per capita and urbanization play a big role in modeling CO2 emissions with the TNL-CO2 model, and could be considered when building a TNL-CO2 emissions model in the future.

5. Discussion

5.1. The Uncertainties behind the Results

Our results indicate that DMSP-OLS is superior to NPP-VIIRS in modeling CO2 emissions, however, there are some possible uncertainties associated with the results. Firstly, the accuracy of the gridded CO2 emissions and the corrected nighttime light data are likely to have an effect on the result. For the nighttime light data, although, as shown in Table 1, the original NPP-VIIRS dataset has some advantages over the original DMSP-OLS dataset, including high spatial and radiometric resolution, and large radiometric detection range, the corrected NPP-VIIRS is not as robust as the corrected DMSP-OLS for modeling CO2 emissions. Moreover, the overpass time for DMSP-OLS is 19:30, at which human activities are frequent, while NPP-VIIRS is 1:30, at which most of the production and human activities stop, therefore, DMSP-OLS can record human activities much better than NPP-VIIRS. The advantages of DMSP-OLS are especially highlighted after data processing. For the PKU-CO2 emissions, as shown in Figure 5, several outliers were observed. Secondly, the study area and sample size are limited to Mainland China, and the global application of the results would involve some uncertainties. The DN value as well as the urbanization in Mainland China is relatively low compared to developed countries such as the United States. In addition, the industrial structure is different which is likely to have an impact on the regression effect of nighttime lights-CO2 emissions model.

5.2. Improvement of Nighttime Light Index

Several studies on modeling CO2 emissions with nighttime light data have been conducted, and different nighttime light indexes, except for TNL index, have been presented. According to a study by Elvidge et al. [23], a strong log-log correlation between light area and CO2 emissions from fossil fuel consumption at the national scale exists. Moreover, Raupach et al. [25] proposed that the mean light and CO2 emissions can be fitted by a power function.
It is known that, the area of nighttime lights is considered as the range of human activities, and it reflects the urban morphology to some degree. Additionally, when the total amount of nighttime lights within a given administrative unit is fixed, the smaller the light area, the more compact the city is. According to previous studies, urban morphology can have an indirect effect on energy use and CO2 emissions in three ways, i.e., through energy loss in the process of transportation and distribution, commute distance and transportation, as well as through heat island effect [40,41,42]. Similar to light area, the mean light represents the trend of the lights, and the urban agglomeration in a city. Both these have an influence on CO2 emissions, but are not as obvious as the total amount of lights index. Taking the two nighttime light indexes into consideration, a nighttime light index—the coefficient of variation (CV), was built to represent urban agglomeration, and to enhance the relationship between nighttime light and CO2 emissions. CV is the standard deviation of nighttime lights divided by the mean light, which represents the degree of urban agglomeration. It is also an indicator of landscape ecology, and refers to the gathering degree of human activities in space, representing the local development strategies to a large extent. It is also thought to have a positive effect on improving the relationship between the nighttime light data and CO2 emissions.

5.3. Potential Factors Affecting the TNL-CO2 Regression

Based on the above-mentioned conclusions, the relationships of nighttime light data and CO2 emissions in high latitudes and the coastal areas have greatly improved, and the results are likely to be affected by the energy consumption structure. The energy consumption of areas in high latitudes is relatively higher due to high demand for lighting and heating. While the development of local economy in such areas is at the general level, the population size is not large, resulting in low human activities. Additionally, the industrial structure is sole. Therefore, the lights in high latitudes mainly highlight the energy consumption, and that could be the main reason for a good relationship between TNL and CO2 emissions. The coastal areas, where the advantages of the geographic location are obvious, are places with various human activities, and the total amount of lights is large in contrast to that of the inlands. Meanwhile, the transport industry prospers, which has a positive effect on CO2 emissions, and the correlation of TNL-CO2 is evident.
For the socio-economic conditions, the relationship of nighttime lights and CO2 emissions is greatly influenced by GRP per capita and urbanization, but not evident for population size.
The areas with high GRP per capita are mainly developed cities in the coastal areas, such as the cities in Shandong peninsula, the Yangtze River delta as well as the Pearl River delta. The advantages of the geographic location have enabled rapid the development of the economy which has brought about the ecological and environmental problems, resulting in increased energy consumption and CO2 emissions. Consequently, the relationship of TNL-CO2 is significant.
The influence of the population size on nighttime light data is small, for both DMSP-OLS and NPP-VIIRS datasets, mainly due to the distribution of China’s population and energy consumption being inconsistent. The areas with small populations are largely distributed in the suburbs or less developed areas, such as the cities in Gansu province, and the lights in the areas are relatively weak. However, the industrial and the energy consumption structures are irrational; as a result, the total amount of energy consumption and CO2 emissions are large, which is not consistent with the nighttime lights, resulting in the weakening of the regression effect of TNL-CO2 model. Similar to the areas with large populations, in the developed regions, the industrial structure tends to be reasonable, and as a result, the lights are strong but the amount of energy consumption and CO2 emissions is small, therefore, the relationship of TNL-CO2 model is still not strong.
The NPP-VIIRS dataset is much more sensitive to urbanization compared to DMSP-OLS, and the R2 of TNL-CO2 regression model in areas of medium to high urbanization is much higher than that in other areas.
The urbanization level in this paper is characterized by the proportion of the municipal area in the total administration district area.
High urbanization areas are mainly located in the southeast coastal areas, and a few cities in the northwest (such as Urumqi, Karamay, and Wuhai), where the economy is underdeveloped, and the populations small, however, they are energy bases and the industrial structure is sole. The lights mainly reflect energy consumption, thus, the effect of modeling CO2 emissions with nighttime light data is good. For the southeast coastal areas, such as Zhuhai, Shantou, Huainan, Fuzhou, Sanya, Haikou and other places, where the economic development level as well as the lights are at the general level, but the industrial structure is dominated by tertiary-industry, especially in Haikou and Sanya, focusing on the development of tourism. Both the energy consumption and CO2 emissions are not high, and the relationship of nighttime light data and CO2 emissions is good.
For the two kinds of nighttime light data, NPP-VIIRS data had no problem of saturation in the urban cores, and the spatial resolution was higher. Additionally, the data quality was better, and the radiance of the lights was better recorded, especially for the economically developed coastal areas, such as Xiamen, Haikou, and Sanya, where the urbanization is high. For NPP-VIIRS, the overpass time is nearly 1:30 a.m., and the CO2 emissions from port transportation have been recorded well, which could account for a better relationship of the TNL-CO2 in comparison to DMSP-OLS.

6. Conclusions

The effects of modeling CO2 emissions with nighttime light data vary at different spatial scales, and both DMSP-OLS and NPP-VIIRS datasets are more effective in mapping CO2 emissions at larger scales and the regression effect of the TNL-CO2 model worsen at finer scales. The nighttime light data can reflect CO2 emissions mainly on the total amount of lights in a large statistical unit; however, the data are not fine enough to map human activities consistently at each scale. Generally, it is much more suitable to characterize the overall pattern at the macro level, but the capacity of depicting the spatial differentiation at some scales is weak. Additionally, the DMSP-OLS dataset has an advantage over NPP-VIIRS in modeling CO2 emissions, and the advantages are significant at large scales. Therefore, the DMSP-OLS dataset is a good choice when modeling CO2 emissions at large scale.
The coefficient of variation for nighttime lights was also found to improve the regression effect of the TNL-CO2 model. In addition, the geographical locations (both the latitude and the longitude) and socio-economic conditions (GRP per capita, population size and urbanization) in the study area have an impact on the effect of modeling CO2 emissions with the nighttime light data.
In this paper, the potential factors that are likely to impact the regression effect of the TNL-CO2 model are discussed. Both the types of nighttime light data are suitable for characterizing CO2 emissions at high latitudes, areas with high GRP per capita and high urbanization. In most cases, the DMSP-OLS is superior to NPP-VIIRS for modeling CO2 emissions, while NPP-VIIRS is recommended for TNL-CO2 regression in high urbanization areas. In this study, the regression effects of TNL-CO2 model at different spatial scales as well as the potential factors that are likely to impact the regression effects of the TNL-CO2 model have been explored. Our results provide a reference for nighttime light data selection and suitable research scales for other similar studies. However, the study areas in this paper is Mainland China, and certain uncertainties would be involved if the conclusions were to be applied globally. In addition, the accuracy of the 0.1° × 0.1° gridded CO2 emissions dataset may have some influence on the regression results. As is shown in Figure 5, there were many outliers. In future research, it is necessary to combine other remote sensing datasets with the nighttime light datasets to improve the accuracy of modeling CO2 emissions. Additionally, considering the geographical limitations of land use in the study area, we might consider extending the research scale globally, and adding more research samples. Threshold regression could be used to identify the potential factors that may influence the regression effects of TNL-CO2 model, in order to establish more efficient and credible reference for modeling CO2 emissions based on nighttime light data.

Acknowledgments

This work has been supported by the National Natural Science Foundation of China (No. 41330747), and we express our sincere gratitude to all the participants of this study.

Author Contributions

Jiansheng Wu and Jian Peng designed the experiment. Xiwen Zhang, and Qiwen Cao performed the experiment, analyzed the data and wrote the paper. Qiwen Cao edited and revised the manuscript.

Conflicts of Interest

The authors declare no conflict of interest. The founding sponsors had no role in the design of the study; in the collection, analyses, or interpretation of data; in the writing of the manuscript, and in the decision to publish the results.

Appendix A

Figure A1. Classifications based on latitude at prefecture level.
Remotesensing 09 00797 g006
Figure A2. Classifications based on longitude at prefecture level.
Remotesensing 09 00797 g007
Figure A3. Classifications based on GRP per capita at prefecture level.
Remotesensing 09 00797 g008
Figure A4. Classifications based on population at prefecture level.
Remotesensing 09 00797 g009
Figure A5. Classifications based on urbanization at prefecture level.
Remotesensing 09 00797 g010

References

  1. Croft, T.A. Nighttime images of the earth from space. Sci. Am. 1978, 239, 86–98. [Google Scholar] [CrossRef]
  2. Henderson, M.; Yeh, E.T.; Gong, P.; Elvidge, C.; Baugh, K. Validation of urban boundaries derived from global night-time satellite imagery. Int. J. Remote Sens. 2003, 24, 595–609. [Google Scholar] [CrossRef]
  3. Small, C.; Pozzi, F.; Elvidge, C. Spatial analysis of global urban extent from DMSP-OLS night lights. Remote Sens. Environ. 2005, 96, 277–291. [Google Scholar] [CrossRef]
  4. Elvidge, C.; Safran, J.; Tuttle, B.; Sutton, P.; Cinzano, P.; Pettit, D.; Arvesen, J.; Small, C. Potential for global mapping of development via a nightsat mission. Geojournal 2007, 69, 45–53. [Google Scholar] [CrossRef]
  5. Doll, C.N.H.; Muller, J.P.; Morley, J.G. Mapping regional economic activity from night-time light satellite imagery. Ecol. Econ. 2006, 57, 75–92. [Google Scholar] [CrossRef]
  6. Sutton, P.C.; Elvidge, C.D.; Ghosh, T. Estimation of gross domestic product at sub-national scales using nighttime satellite imagery. Int. J. Ecol. Econ. Stat. 2007, 8, 5–21. [Google Scholar]
  7. Henderson, J.V.; Storeygard, A.; Weil, D.N. Measuring economic growth from outer space. Am. Econ. Rev. 2012, 102, 994–1028. [Google Scholar] [CrossRef] [PubMed]
  8. Sutton, P.; Roberts, D.; Elvidge, C.; Melj, H. A Comparison of Nighttime Satellite Imagery and Population Density for the Continental United States. Photogramm. Eng. Remote Sens. 1997, 63, 1303–1313. [Google Scholar]
  9. Amaral, S.; Monteiro, A.M.; Câmara, G.; Quintanilha, J.A. DMSP/OLS Night-Time light imagery for urban population estimates in the Brazilian Amazon. Int. J. Remote Sens. 2006, 27, 855–870. [Google Scholar] [CrossRef]
  10. Lo, C.P. Modeling the Population of China Using DMSP Operational Linescan System Nighttime Data. Photogramm. Eng. Remote Sens. 2001, 67, 1037–1047. [Google Scholar]
  11. Kiran Chand, T.R.; Badarinath, K.V.S.; Elvidge, C.D.; Tuttle, B.T. Spatial characterization of electrical power consumption patterns over India using temporal DMSP-OLS night-time satellite data. Int. J. Remote Sens. 2009, 30, 647–661. [Google Scholar] [CrossRef]
  12. Letu, H.; Hara, M.; Yagi, H.; Naoki, K.; Tana, G.; Nishio, F.; Shuhei, O. Estimating energy consumption from night-time DMPS/OLS imagery after correcting for saturation effects. Int. J. Remote Sens. 2010, 31, 4443–4458. [Google Scholar] [CrossRef]
  13. Brian, M.; Kwawu, M.G.; Ousmane, F.S.; Alassane, A. Detection of rural electrification in Africa using DMSP-OLS night lights imagery. Int. J. Remote Sens. 2013, 34, 8118–8141. [Google Scholar]
  14. Theobald, D.M.; Cova, T.J.; Sutton, P.C. Exurban change detection in fire-prone areas with nighttime satellite imagery. Photogramm. Eng. Remote Sens. 2014, 70, 1249–1257. [Google Scholar]
  15. Sarah, E.B.; Sara, E.W.; Jim, B.; Rana, B.; John, E.V. A case-referent study: Light at night and breast cancer risk in Georgia. Int. J. Health Geogr. 2013, 12, 23. [Google Scholar]
  16. Christopher, D.E.; Kimberly, E.B.; Mikhail, N.Z.; Feng-Chi, H. Why VIIRS data are superior to DMSP for mapping nighttime lights. Proc. Asia Pac. Adv. Netw. 2013, 35, 62–69. [Google Scholar]
  17. Kimberly, E.B.; Feng-Chi, H.; Christopher, D.E. Nighttime Lights Compositing Using the VIIRS Day-Night Band: Preliminary Results. Proc. Asia Pac. Adv. Netw. 2013, 35, 70–86. [Google Scholar]
  18. Li, X.; Xu, H.; Chen, X.; Li, C. Potential of NPP-VIIRS Nighttime Light Imagery for Modeling the Regional Economy of China. Remote Sens. 2013, 5, 3057–3081. [Google Scholar] [CrossRef]
  19. Shi, K.; Yu, B.; Huang, Y.; Hu, Y.; Yin, B.; Chen, Z.; Chen, L.; Wu, J. Evaluating the Ability of NPP-VIIRS Nighttime Light Data to Estimate the Gross Domestic Product and the Electric Power Consumption of China at Multiple Scales: A Comparison with DMSP-OLS Data. Remote Sens. 2014, 6, 1705–1724. [Google Scholar] [CrossRef]
  20. Jing, X.; Shao, X.; Cao, C.; Fu, X.; Yan, L. Comparison between the Suomi-NPP Day-Night Band and DMSP-OLS for Correlating Socio-Economic Variables at the Provincial Level in China. Remote Sens. 2016, 8, 17. [Google Scholar] [CrossRef]
  21. Shi, K.; Huang, C.; Yu, B.; Yin, B.; Huang, Y.; Wu, J. Evaluation of NPP-VIIRS nighttime light composite data for extracting built-up urban areas. Remote Sens. Lett. 2014, 5, 358–366. [Google Scholar] [CrossRef]
  22. Shi, K.; Yu, B.; Hu, Y.; Huang, C.; Chen, Y.; Huang, C.; Chen, Y.; Huang, Y.; Chen, Z.; Wu, J. Modelling and mapping total freight traffic in China using NPP-VIIRS nighttime light composite data. GISci. Remote Sens. 2015, 52, 274–289. [Google Scholar] [CrossRef]
  23. Elvidge, C.D.; Imhoff, M.L.; Baugh, K.E.; Vinita, R.H.; Ingrid, N.; Jeff, S.; John, B.; Benjamin, T. Night-time Lights of the World 1994–1995. ISPRS J. Photogramm. Remote Sens. 2001, 56, 81–99. [Google Scholar] [CrossRef]
  24. Doll, C.H.; Muller, J.P.; Elvidge, C.D. Night-time imagery as a tool for global mapping of socioeconomic parameters and greenhouse gas emissions. AMBIO J. Hum. Environ. 2000, 29, 157–162. [Google Scholar] [CrossRef]
  25. Raupach, M.R.; Rayner, P.J.; Paget, M. Regional Variations in Spatial Structure of Nightlights, Population Density and Fossil-fuel CO2 Emissions. Energy Policy 2010, 38, 4756–4764. [Google Scholar] [CrossRef]
  26. Meng, L.; Graus, W.; Worrell, E.; Huang, B. Estimating CO2 (carbon dioxide) emissions at urban scales by DMSP/OLS (Defense Meteorological Satellite Program’s Operational Linescan System) nighttime light imagery: Methodological challenges and a case study for China. Energy 2014, 71, 468–478. [Google Scholar] [CrossRef]
  27. Su, Y.; Chen, X.; Li, Y.; Liao, J.; Ye, Y.; Zhang, H.; Huang, N.; Kuang, Y. China’s 19-Year City-Level Carbon Emissions of Energy Consumptions, Driving Forces and Regionalized Mitigation Guidelines. Renew. Sustain. Energy Rev. 2014, 35, 231–243. [Google Scholar] [CrossRef]
  28. Shi, K.; Chen, Y.; Yu, B.; Xu, T.; Chen, Z.; Liu, R.; Li, L.; Wu, J. Modeling spatiotemporal CO2 (carbon dioxide) emission dynamics in China from DMSP-OLS nighttime stable light data using panel data analysis. Appl. Energy 2016, 168, 528–533. [Google Scholar] [CrossRef]
  29. Ou, J.; Liu, X.; Li, X.; Li, M.; Li, W. Evaluation of NPP-VIIRS Nighttime Light Data for Mapping Global Fossil Fuel Combustion CO2 Emissions: A Comparison with DMSP-OLS Nighttime Light Data. PLoS ONE 2015, 10, 1–20. [Google Scholar] [CrossRef] [PubMed]
  30. Elvidge, C.D.; Ziskin, D.; Baugh, K.E.; Tuttle, B.T.; Ghosh, T. A fifteen year record of global natural gas Flaring Derived from Satellite Data. Energies 2009, 2, 595–622. [Google Scholar] [CrossRef]
  31. Letu, H.; Hara, M.; Tana, G.; Nishio, F. A Saturated Light Correction Method for DMSP/OLS Nighttime Satellite Imagery. IEEE Trans. Geosci. Remote Sens. 2012, 50, 389–396. [Google Scholar] [CrossRef]
  32. Wu, J.; He, S.; Peng, J.; Li, W.; Zhong, X. Intercalibration of DMSP-OLS night-time light data by the invariant region method. Remote Sens. 2013, 34, 7356–7368. [Google Scholar] [CrossRef]
  33. Shi, K.; Chen, Y.; Yu, B.; Xu, T.; Yang, C.; Li, L.; Huang, C.; Chen, Z.; Liu, R.; Wu, J. Detecting spatiotemporal dynamics of global electric power consumption using DMSP-OLS nighttime stable light data. Appl. Energy 2016, 184, 450–463. [Google Scholar] [CrossRef]
  34. Wang, R.; Tao, S.; Ciais, P.; Shen, H.; Huang, Y.; Chen, H.; Shen, G.F.; Wang, B.; Li, W.; Zhang, Y.; et al. High-resolution mapping of combustion processes and implications for CO2 emissions. Atmos. Chem. Phys. 2013, 13, 5189–5203. [Google Scholar] [CrossRef]
  35. Zhu, L.; Guan, D.; Wei, W.; Davis, S.J.; Ciais, P.; Bai, J.; Peng, S.; Zhang, Q.; Hubacek, K.; Marland, G.; et al. Reduced carbon emission estimates from fossil fuel combustion and cement production in China. Nature 2015, 524, 335–346. [Google Scholar]
  36. Kaya, Y. Impact of Carbon Dioxide Emission on GNP Growth: Interpretation of Proposed Scenarios; IPCC: Paris, France, 1989. [Google Scholar]
  37. Cole, M.A.; Neumayer, E. Examining the impact of demographic factors on air pollution population and environment. Popul. Environ. 2004, 26, 5–21. [Google Scholar] [CrossRef]
  38. Shi, A. The impact of population pressure on global carbon dioxide emissions, 1975–1996: Evidence from pooled cross-eountry data. Ecol. Econ. 2003, 44, 29–42. [Google Scholar] [CrossRef]
  39. David, F.G.; Jason, Z.Y. Urbanization and energy in China: Issues and Implications. Available online: http://pirate.shu.edu/~yinjason/papers/final%20version5-14-2001.pdf (accessed on 2 August 2017).
  40. Newman, P.W.G.; Kenworthy, J.R. The land use—Transport connection: An overview. Land Use Policy 1996, 13, 1–22. [Google Scholar] [CrossRef]
  41. Stone, B.; Rodgers, M.O. Urban Form and Thermal Efficiency: How the Design of Cities Influences the Urban Heat Island Effect. J. Am. Plan. Assoc. 2001, 67, 186–198. [Google Scholar] [CrossRef]
  42. Ewing, R.; Rong, F. The Impact of Urban Form on U.S. Residential Energy Use. Hous. Policy Debate 2008, 19, 1–30. [Google Scholar] [CrossRef]
Figure 1. (a,b) Scatter plots of TNL vs. CO2 emissions with the log-log regression model at provincial-level regions: DMSP-OLS and NPP-VIIRS.
Remotesensing 09 00797 g001
Figure 2. The Relative Errors (REs) of DMSP-OLS and NPP-VIIRS at province level: (a,c) The underestimated and overestimated regions for DMSP-OLS and NPP-VIIRS respectively; and (b,d) The spatial distributions of RE across the five classes for DMSP-OLS and NPP-VIIRS, respectively.
Remotesensing 09 00797 g002aRemotesensing 09 00797 g002bRemotesensing 09 00797 g002c
Figure 3. (a,b) Scatter plots of the log-log regression model in prefectural regions for DMSP-OLS and NPP-VIIRS.
Remotesensing 09 00797 g003
Figure 4. The REs of DMSP-OLS and NPP-VIIRS at prefecture level: (a,c) the underestimated and overestimated regions for DMSP-OLS and NPP-VIIRS, respectively; and (b,d) the spatial distributions of REs across the five classes for DMSP-OLS and NPP-VIIRS, respectively.
Remotesensing 09 00797 g004aRemotesensing 09 00797 g004bRemotesensing 09 00797 g004c
Figure 5. (a,b) Scatter plots of log-log regression model at 0.1° × 0.1° grid for DMSP-OLS and NPP-VIIRS.
Remotesensing 09 00797 g005
Table 1. The differences between raw DMSP-OLS and NPP-VIIRS data.
DatasetDMSP-OLSNPP-VIIRS
Spatial Resolution30 arc-second, about 1000 m15 arc-second, about 500 m
Radiometric Resolution6-bit14-bit
Radiometric Detection Range10−10–10−8 (W/cm2/sr/um)3 × 10−9–0.02 (W/cm2/sr)
Overpass Time19:3001:30
Units MeasuredRelative (0–63 scale)Radiance (Watts/cm2/sr)
SaturationOver-saturation in urban coresNo
On-board CalibrationNoYes
Table 2. R2 of TNL-CO2 regression at different levels.
DataProvincePrefecture0.1° × 0.1°
DMSP-OLS0.690.470.19
NPP-VIIRS0.550.450.10
Table 3. The R2 of TNL-CO2 regression in different geographical locations.
DataLatitudeLongitude
LowMediumHighLowMediumHigh
DMSP-OLS0.280.580.630.290.520.64
NPP-VIIRS0.320.520.590.350.460.62
Table 4. The R2 of TNL-CO2 regression at different socio-economic conditions.
DataGRP Per CapitaPopulationUrbanization
LowMediumHighLowMediumHighLowMediumHigh
DMSP-OLS0.250.600.710.370.310.290.370.600.68
NPP-VIIRS0.330.540.650.360.340.320.340.650.72

