Article

Multi-Year Mapping of Maize and Sunflower in Hetao Irrigation District of China with High Spatial and Temporal Resolution Vegetation Index Series

State Key Laboratory of Hydroscience and Engineering, Department of Hydraulic Engineering, Tsinghua University, Beijing 100084, China
*
Author to whom correspondence should be addressed.
Submission received: 17 July 2017 / Revised: 2 August 2017 / Accepted: 13 August 2017 / Published: 18 August 2017
(This article belongs to the Section Remote Sensing in Agriculture and Vegetation)

Abstract

:
Crop identification in large irrigation districts is important for crop yield estimation, hydrological simulation, and agricultural water management. Remote sensing provides an opportunity to visualize crops in the regional scale. However, the use of coarse resolution remote sensing images for crop identification usually causes great errors due to the presence of mixed pixels in regions with complex planting structure of crops. Therefore, it is preferable to use remote sensing data with high spatial and temporal resolutions in crop identification. This study aimed to map multi-year distributions of major crops (maize and sunflower) in Hetao Irrigation District, the third largest irrigation district in China, using HJ-1A/1B CCD images with high spatial and temporal resolutions. The Normalized Difference Vegetation Index (NDVI) series obtained from HJ-1A/1B CCD images was fitted with an asymmetric logistic curve to find the NDVI characteristics and phenological metrics for both maize and sunflower. Nine combinations of NDVI characteristics and phenological metrics were compared to obtain the optimal classifier to map maize and sunflower from 2009 to 2015. Results showed that the classification ellipse with the NDVI characteristic of the left inflection point in the NDVI curve and the phenological metric from the left inflection point to the peak point normalized, with mean values of corresponding grassland indexes achieving the minimum mean relative error of 10.82% for maize and 4.38% for sunflower. The corresponding Kappa coefficient was 0.62. These results indicated that the vegetation and phenology-based classifier using HJ-1A/1B data could effectively identify multi-year distribution of maize and sunflower in the study region. It was found that maize was mainly distributed in the middle part of the irrigation district (Hangjinhouqi and Linhe), while sunflower mainly in the east part (Wuyuan). The planting sites of sunflower had been gradually expanded from Wuyuan to the north part of Hangjinhouqi and Linhe. These results were in agreement with the local economic policy. Results also revealed the increasing trends of both maize and sunflower planting areas during the study period.

Graphical Abstract

1. Introduction

Crop identification in large irrigation districts is important for crop yield estimation [1,2], hydrological simulation [3], water resources management [4], and agricultural management [5]. The cultivated area is usually acquired through agricultural census [6], which is both time-consuming and costly. The basic unit of statistical data is usually on the county level [6] without detailed spatial distribution. In the last few decades, the rapid development of remote sensing technology provides an opportunity to identify the crops over large areas effectively [7]. In recent years, remote sensing images are widely used in crop identification because of their advantages of easy access, acceptable resolution and large coverage area [8,9,10]. Due to their capability in characterizing crop conditions, various remote sensing-based methods had been widely used as effective tools for crop identification and cultivation area estimation [11,12]. In order to achieve good classification results, two important issues need to be considered: the selection of an appropriate classifier and the sources of remote sensing images [13].
The most commonly used classification method by remote sensing is supervised classification with the basic unit of a pixel, which divides each pixel into a specified type of crop according to the training data based on the sampling points [12,14,15]. Three supervised classification algorithms based on machine learning are frequently used, including the multilayer perceptron neural networks [13,16], the support vector machine [17,18], and the random forest [19,20]. These classifiers are non-parametric algorithms, which are black-box models without a fixed classification formula. Therefore, one classifier identified in a study area cannot be applied directly to other similar areas, which would affect the generalization of the classifier. A key issue for a non-parametric classifier is the determination of input characteristic variables. The large number of input variables may result in over-fitting and the Hughes phenomenon [21,22]. Another disadvantage that cannot be ignored for a non-parametric classifier is the huge computation caused by too much data, which not only requires a high computer property but also needs a long computation time [2,23]. Accordingly, in order to improve the effectiveness and robustness of crop identification methods, the best indicators of crop growth characteristics need to be identified.
Recently, the crop phenological metric is widely used as an approach to improve the crop classifiers [24,25,26]. Vegetation phenology reflects the growth characteristics of each crop. Therefore, different crops could be identified according to the character of crop phenology. Previous studies have shown that vegetation indexes retrieved from remotely sensed data, such as the Enhanced Vegetation Index (EVI) [27,28] and Normalized Difference Vegetation Index (NDVI) [26,29], can accurately describe the crop phenology. The NDVI is widely used due to its simple calculation [30] and readily available NDVI products [16,31]. Furthermore, during the monitoring of the vegetation dynamics in arid and semi-arid areas, the NDVI is more sensitive to soil conditions and atmospheric effects compared with other vegetation indexes. Lu et al. [32] used three Moderate Resolution Imaging Spectroradiometer (MODIS)-derived vegetation indexes including NDVI, EVI and the Soil-Adjusted Vegetation Index (SAVI), to monitor dryland vegetation dynamics. The results showed the spatial deviation of phenological metrics generated from NDVI was the largest. Johnson et al. [33] have compared the yield estimation effects of the predictors of NDVI and EVI, and he concluded that NDVI was the most effective predictor for three crops in the study area. This shows that NDVI is more accurate in describing the vegetation growth process. Therefore, the NDVI is used as the primary index for correlating with the phenological metrics.
The source of remote sensing data is another key factor for determining the accuracy of crop identification. In the last few decades, Advanced Very High-Resolution Radiometer (NOAA-AVHRR) [31,34], SPOT VEGETATION product [5,35], MODIS [36,37], and Landsat TM/ETM+ [38,39] have become the main sources of remote sensing data. For these data sources, Landsat TM/ETM+ has a high spatial resolution of 30 m, but has a long revisit cycle of 16 days. It may be difficult to identify crop phenology accurately with a high possibility of images influenced by cloud. Other data sources generally have coarse or medium spatial resolution, which will lead to mixed pixel problems for areas with complex planting structure. To solve the problem of lacking data sources with both high spatial and temporal resolutions, downscaling of moderate spatial resolution MODIS data using Landsat data [40] and fusion of Landsat data and other satellite-sensor data [41] has been tested. However, these re-processing methods can further increase the uncertainty of the derived indexes on the basis of error between satellite-derived NDVI and ground-based NDVI [42]. Therefore, remote sensing data sources with both high spatial resolution and frequent revisit time are desired for crop identification.
On 6 September 2008, China launched the HJ-1A/1B satellite constellation for environment and disaster monitoring. The satellite constellation has achieved high temporal resolution (four days revisit period of a single satellite) and mid-high spatial resolution (30 m) [43]. Previous studies have indicated that the NDVI series derived from HJ-1A/1B could present a complete phenological cycle of crops and the retrieved phenological metrics were comparable with local agro-metrological observation [29]. Monthly NDVI series from HJ-1A/1B is also used to identify the species of salt marshes in coastal zones [44]. However, few studies had applied HJ-1A/1B data to crop identification in arid and semi-arid areas. The main objective of this study is to identify the multi-year distribution of main crops (maize and sunflower) in Hetao Irrigation District of China with complex planting structure using the NDVI and phenological characteristics derived from HJ-1A/1B images.

2. Study Region and Data Sources
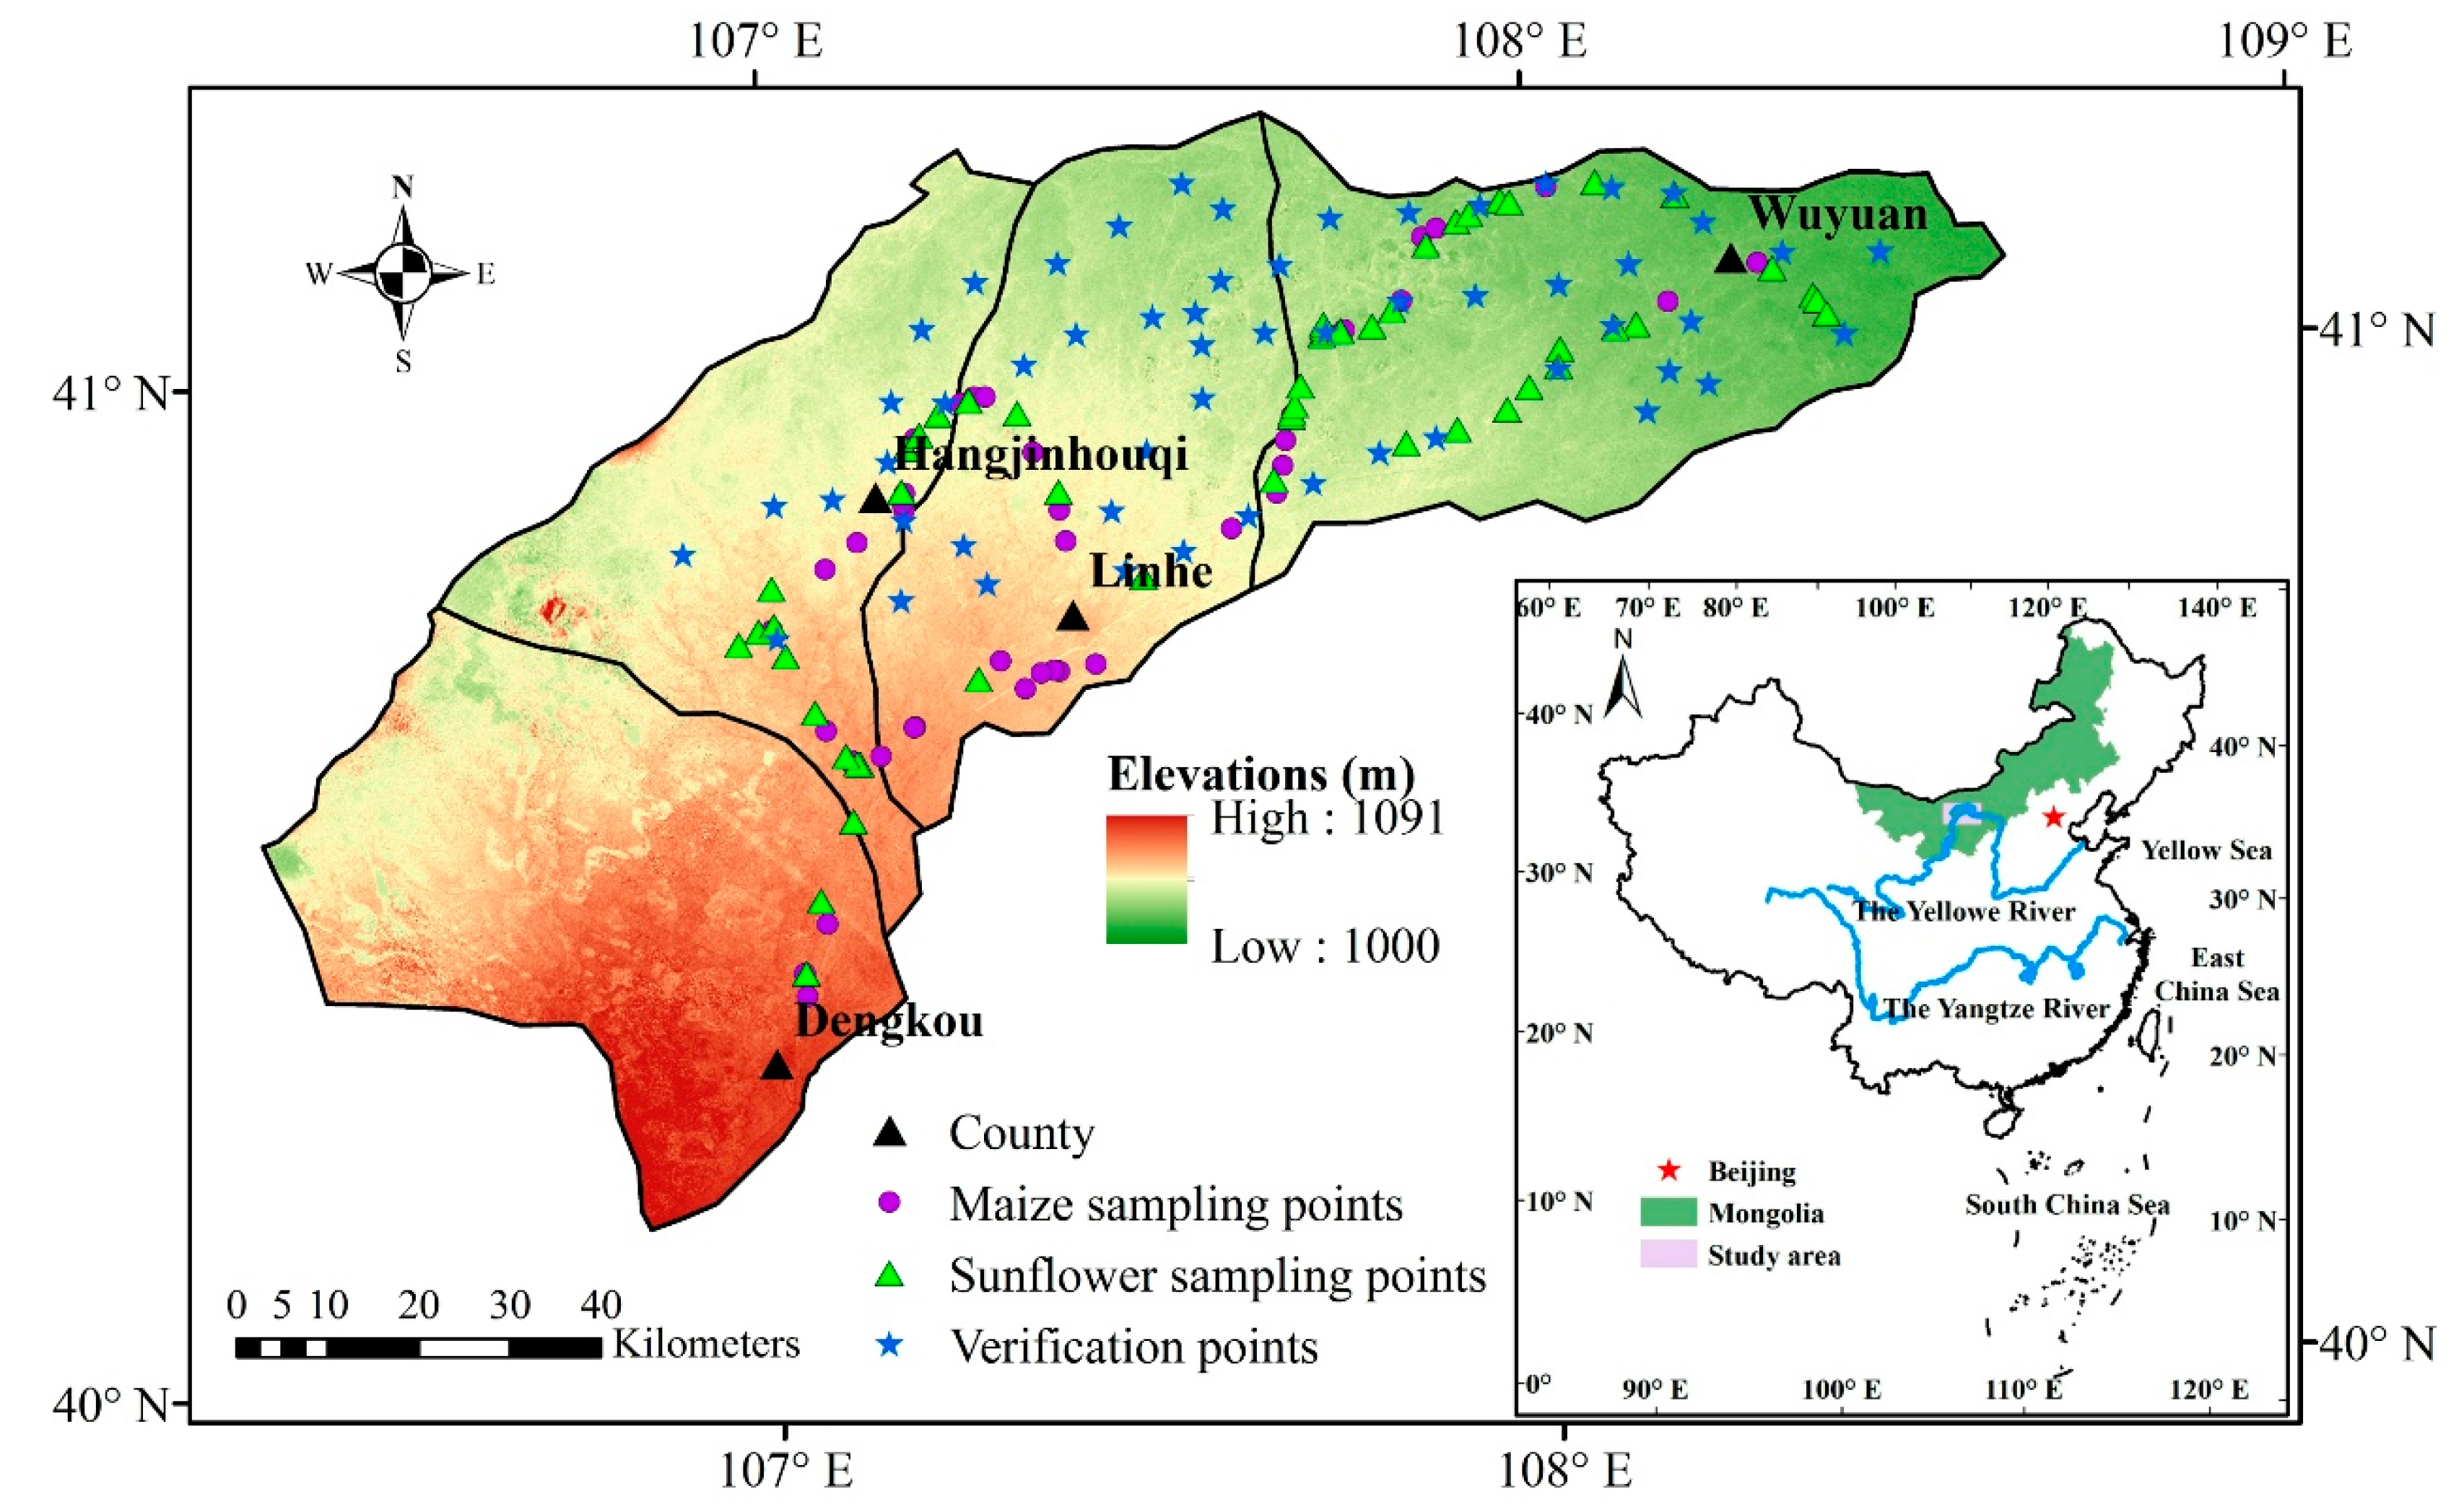
2.1. Study Region

The Hetao Irrigation District is the third largest irrigation district and an important food production base in China. The irrigation district is located in the western part of the Inner Mongolia Autonomous Region in North China. The area of Hetao Irrigation District is 1.12 million ha and the irrigated farmland is 0.57 million ha. In the present research, four counties (Dengkou, Hangjinhouqi, Linhe and Wuyuan) in the district were selected as the study region, which spans from 40.1°N to 41.4°N and from 106.1°E to 109.4°E (Figure 1). The region covers an area of 0.91 million ha, with 44% being irrigated land (Figure 2). The study region is characterized by arid continental climate with an annual precipitation of approximately 160 mm and pan evaporation (20 cm evaporation pan) of approximately 2240 mm. Mean annual temperature is 7.7–9.5 °C from 2009 to 2015, and daily mean temperatures ranging from −16.9 °C in January to 29.1 °C in July. The study region belongs to an alluvial plain of the Yellow River with elevation varied from 1000 m to 1091 m above sea level.
Dominant crops in the study area are summer maize, sunflower and spring wheat. The crop growing season spans from April to October. According to statistics of local government (http://www.bmagri.gov.cn), the planting area of three major crops has changed evidently in recent years (Figure 3). For summer maize and sunflower, the planting area increased from 2009 to 2015, while the planting area of spring wheat decreased significantly. Thus, summer maize and sunflower were considered in the following analysis.

2.2. Sampling and Verification Data

Survey of crop planting structure was carried out in Hetao Irrigation District during 28 to 30 August 2012 [11]. We obtained 41 sampling sites of maize and 53 sampling sites of sunflower using the Global Positioning System (GPS), which has a positioning accuracy of 2 m–5 m (Figure 1). In order to avoid the appearance of mixed pixels, the area of the sampling site is above 100 m × 100 m. From the spatial distribution of the sampling points, sunflower is mainly distributed in Wuyuan County, while summer maize mainly in Hangjinhouqi and Linhe counties. To find out more about the growth situation of these two major crops, we also investigated the local phenology calendar (Table 1).
In order to evaluate the accuracy of crop identification, we also carried out field investigations to obtain the verification points in 2014 and 2015. A total of 55 verification points were selected per year and the location of these points in two years were completely consistent (Figure 1). Because of the crop rotation policy in Hetao Irrigation District, the crops in the same location were different in different years. As a result, there were 19 sampling points of summer maize, 23 of sunflower, and 7 of other crops in 2014, while there were 15 of maize, 25 of sunflower, and 15 of other crops in 2015.

2.3. Satellite Data and Preprocessing

The two-day-repeat CCD sensors of Chinese HJ-1A/1B satellites capture ground features with 30 m pixel resolution, with each satellite carrying a four-band multispectral optical image that captures radiation in the blue (0.43–0.52 μm), green (0.52–0.60 μm), red (0.63–0.69 μm), and near-infrared (0.76–0.90 μm) bands [45]. The HJ-1A/1B CCD images were downloaded from the China Centre for Resources Satellite Data and Application (CRESDA) (http://cresda.spacechina.com). The satellite images used in this study consisted of 195 HJ-1A/1B CCD images of Level 2A for Hetao Irrigation District covering the years from 2009 to 2015 with the cloud cover less than 5%.
The HJ-1A/1B CCD images preprocessing procedures mainly include radiometric calibration and atmospheric and geometric corrections. Theradiometric calibration was used to convert image digital number (DN) to the sensor radiance value for each band using Equation (1).
L λ = D N g + L 0
where Lλ is the spectral radiance of each band, g and L0 are calibration coefficients that can be found in the meta-data file attached with the image.
Atmospheric correction was based on image data according to Equations (2)–(5) [46] instead of using the FLAASH module embedded in the ENVI software [29,47]. The main advantage of this method is that the coefficients necessary for the atmospheric correction are obtained from the image itself.
ρ s , λ = π ( L λ L p ) d 2 E S U N λ cos θ z T z
d = 1 + 0.0167 sin ( 2 π ( DOY 93.5 ) 365 )
L p = L min L 1 %
L 1 % = 0.01 E S U N λ cos θ z T z π d 2
where ρs,λ is at-surface reflectivity of each band, ESUNλ is the mean solar exoatmospheric radiation over each band (Table 2), θz is solar zenith angle, d is the relative Earth–Sun distance, Tz is the atmospheric transmissivity that can be approximated by cosθz, DOY is the day of year, Lp is the atmospheric radiation, Lmin is the radiance computed using the minimum radiance in band λ, L1% is the blackbody radiation.
The geometric correction was completed using the TIMES module embedded in the ArcGIS software.

2.4. Other Dataset

Daily climate data for the study area were available at China Meteorology Data Sharing Service System (http://cdc.cma.gov.cn/).
DEM data (SRTM) with spatial resolution of 90 m were downloaded from http://srtm.csi.cgiar.org/ (Figure 1).
Land use map (1:100,000) of the study area for the year of 2005 was provided by National Data Sharing Infrastructure of Earth System Science (http://spacescience.data.ac.cn), where land uses were integrated into 8 types shown in Figure 2.
Statistical data of planting area of the major crops were available at the Bayannur Agricultural Information Network (http://www.bmagri.gov.cn).

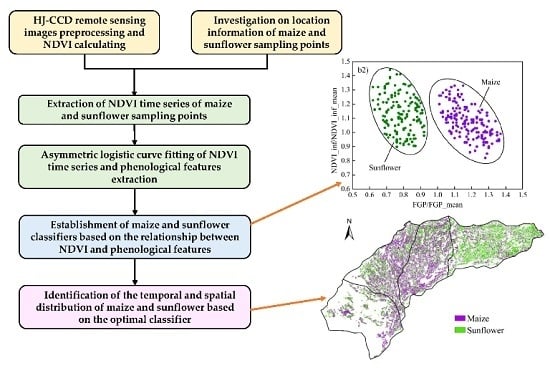
3. Phenology-Based Crop Identification

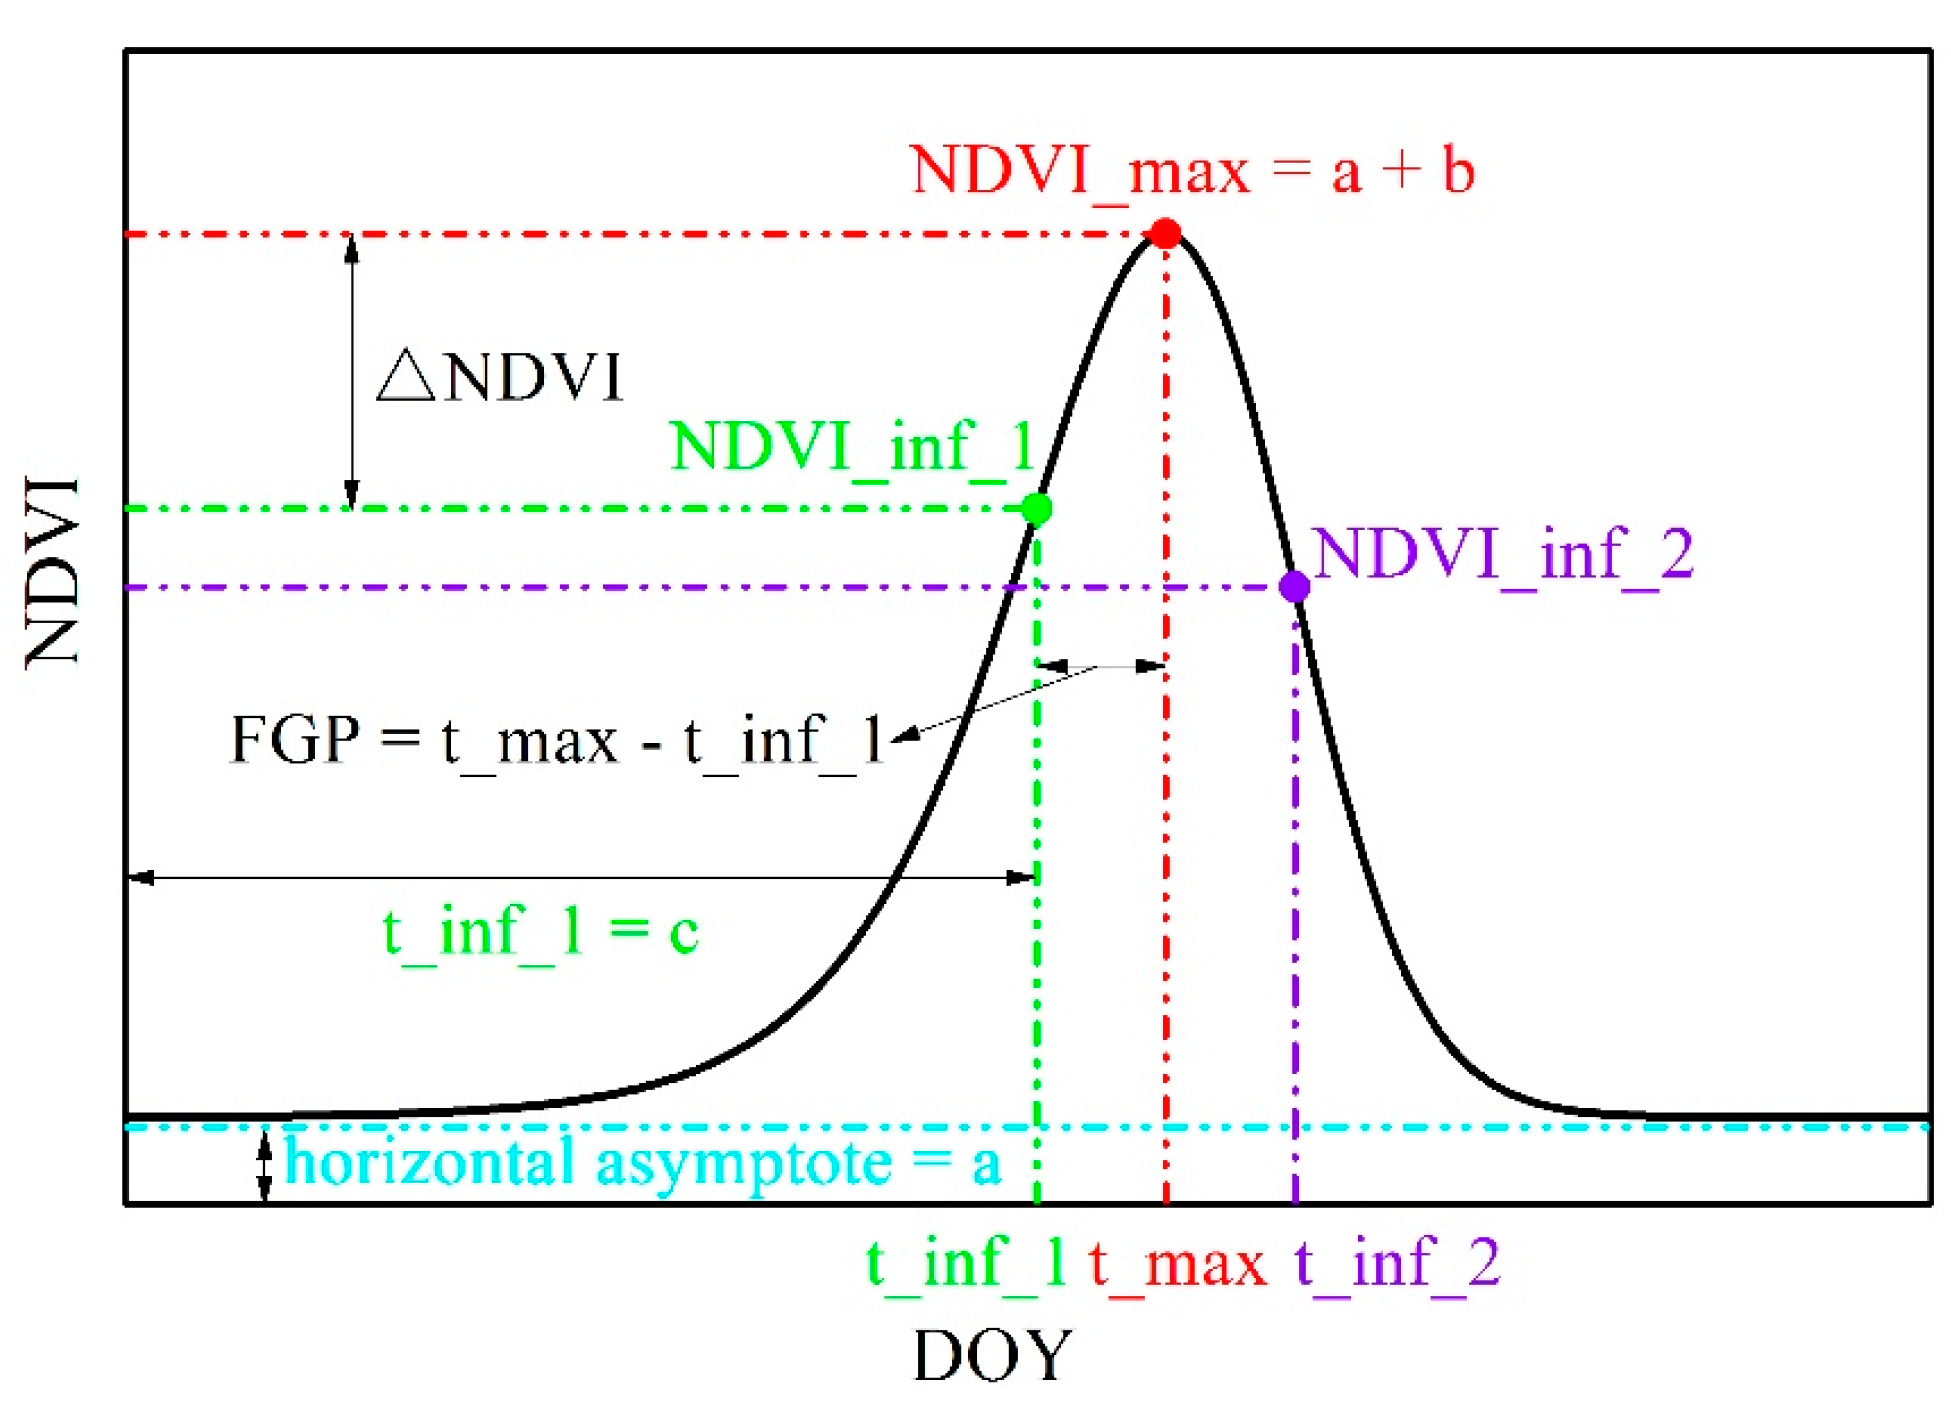
3.1. Derivation of Phenological Metrics

The NDVI was used to derive the phenological metrics of crops. The NDVI is the ratio of the differences in reflectivity for the near-infrared band and the red band to their sum [48]. In case of HJ-1A/1B satellite, the corresponding bands are bands 4 and 3, and NDVI can be calculated from
NDVI = ( ρ t , 4 ρ t , 3 ) ( ρ t , 4 + ρ t , 3 )
where ρt,3 and ρt,4 are the reflectivity of the near-infrared and the red band, respectively. Generally, NDVI > 0 indicates soil or vegetation, while NDVI ≤ 0 indicates water or snow.
The NDVI has been used to monitor vegetation dynamics for over twenty years [42,49]. Recent studies have paid more attention to the relationship between NDVI series and vegetation phenology [26,29], which confirmed the effectiveness of NDVI series in identifying crop phenology parameters. Thus, we calculated NDVI from the preprocessed images according to Equation (6). In order to decrease the effects of noise of existing data, the resulting HJ-1A/1B NDVI time series was further fitted with an asymmetric logistic curve [50] (Figure 4), which was also used by Jiang et al. [11] in crop identification. The fitting curve equation is
NDVI = a + ( b / k ) ( 1 + n ) ( k + 1 ) / k n ( k + 1 ) ( k + 1 ) / k
n = exp [ ( t + d ln ( k ) c ) / d ]
where t is DOY; a, b, c, d and k are curve parameters (Figure 4) to be estimated from NDVI series by the least-squares method.
The characteristic points of the asymmetric logistic curve (i.e., phenological metrics) can be computed from the zeroes of the first and second derivatives of Equation (7). The derivatives are
d ( NDVI ) d t = ( b / k ) [ ( k + 1 ) / ( 1 + n ) ] ( k + 1 ) / k [ ( k n ) / ( 1 + n ) ] ( n / d )
d ( NDVI ) 2 d t 2 = ( b / k 2 ) ( k + 1 ) ( k + 1 ) / k ( n / d 2 ) ( 1 + n ) [ ( k + 1 ) / k ] 2 [ ( n 2 / k ) n ( k + 3 ) + k ]
Letting d(NDVI)/dt = 0, we can obtain t_max = c. If d(NDVI)2/dt2 > 0 at this point, then we can obtain the peak value of NDVI, NDVI_max = a + b, at t_max = c. Letting d(NDVI)2/dt2 = 0, we can obtain two inflection points of the NDVI curve, t_inf = c + d ln [(k + 3 ± (k2 + 6k + 5)0.5/2] (“−” for the left and “+” for the right inflection points). The NDVI values corresponding to t_inf, NDVI_inf, can be calculated by replacing t with t_inf in Equation (7).
The area of the sampling point is at least 100 m × 100 m, which includes at least 9 pixels. Generally, one to three pixels were selected corresponding to each sampling point, and we finally got 160 and 140 pixels representing maize and sunflower, respectively. The NDVI series of each sampling pixel in 2012 were calculated based on HJ-1A/1B CCD images, and the average NDVI values of those 160 and 140 pixels were obtained as the representative NDVI series of maize and sunflower, respectively. Then the maize and sunflower NDVI time series were fitted with the asymmetric logistic curve (Figure 5). The curve fitting was also performed for NDVI time series of each pixel in the study area to obtain phenological metrics of each pixel to monitor the growth regime of crops.
The coefficient of determination (R2) for the fitting were both over 0.9 for maize and sunflower, which indicated that this asymmetric logistic curve fitted the crop phenological cycle in the Hetao Irrigation District fairly well. Comparison of the fitting curves for maize and sunflower showed that the two curves were distinct in the left side (crop growth period), while almost coinciding in the right side (crop senescence period). Therefore, three key NDVI characteristics, NDVI values at the left inflection point with maximum growth rate and the peak point and their difference, and corresponding phenological metrics were selected as possible indexes to differentiate maize and sunflower (Table 3).
From Figure 5, the maize NDVI reached its maximum value of 0.54 at the 224th day in the year (t_max), and achieved its maximum growth rate at the 190th day (t_inf) with the corresponding NDVI of 0.38 (NDVI_inf), while for sunflower, NDVI reached its maximum value of 0.52 at the 227th day, and achieved its maximum growth rate at the 203th day with NDVI_inf = 0.37. There was no clear difference between t_max of maize and sunflower, but t_inf of maize was almost half a month earlier than the sunflower. Accordingly, maize had a longer fast growth period (FGP) than sunflower, with FGP of maize and sunflower of 34 days and 25 days, respectively. Consequently, a combination of appropriate NDVI characteristics and FGP would be effective to identify maize and sunflower in the Hetao Irrigation District.

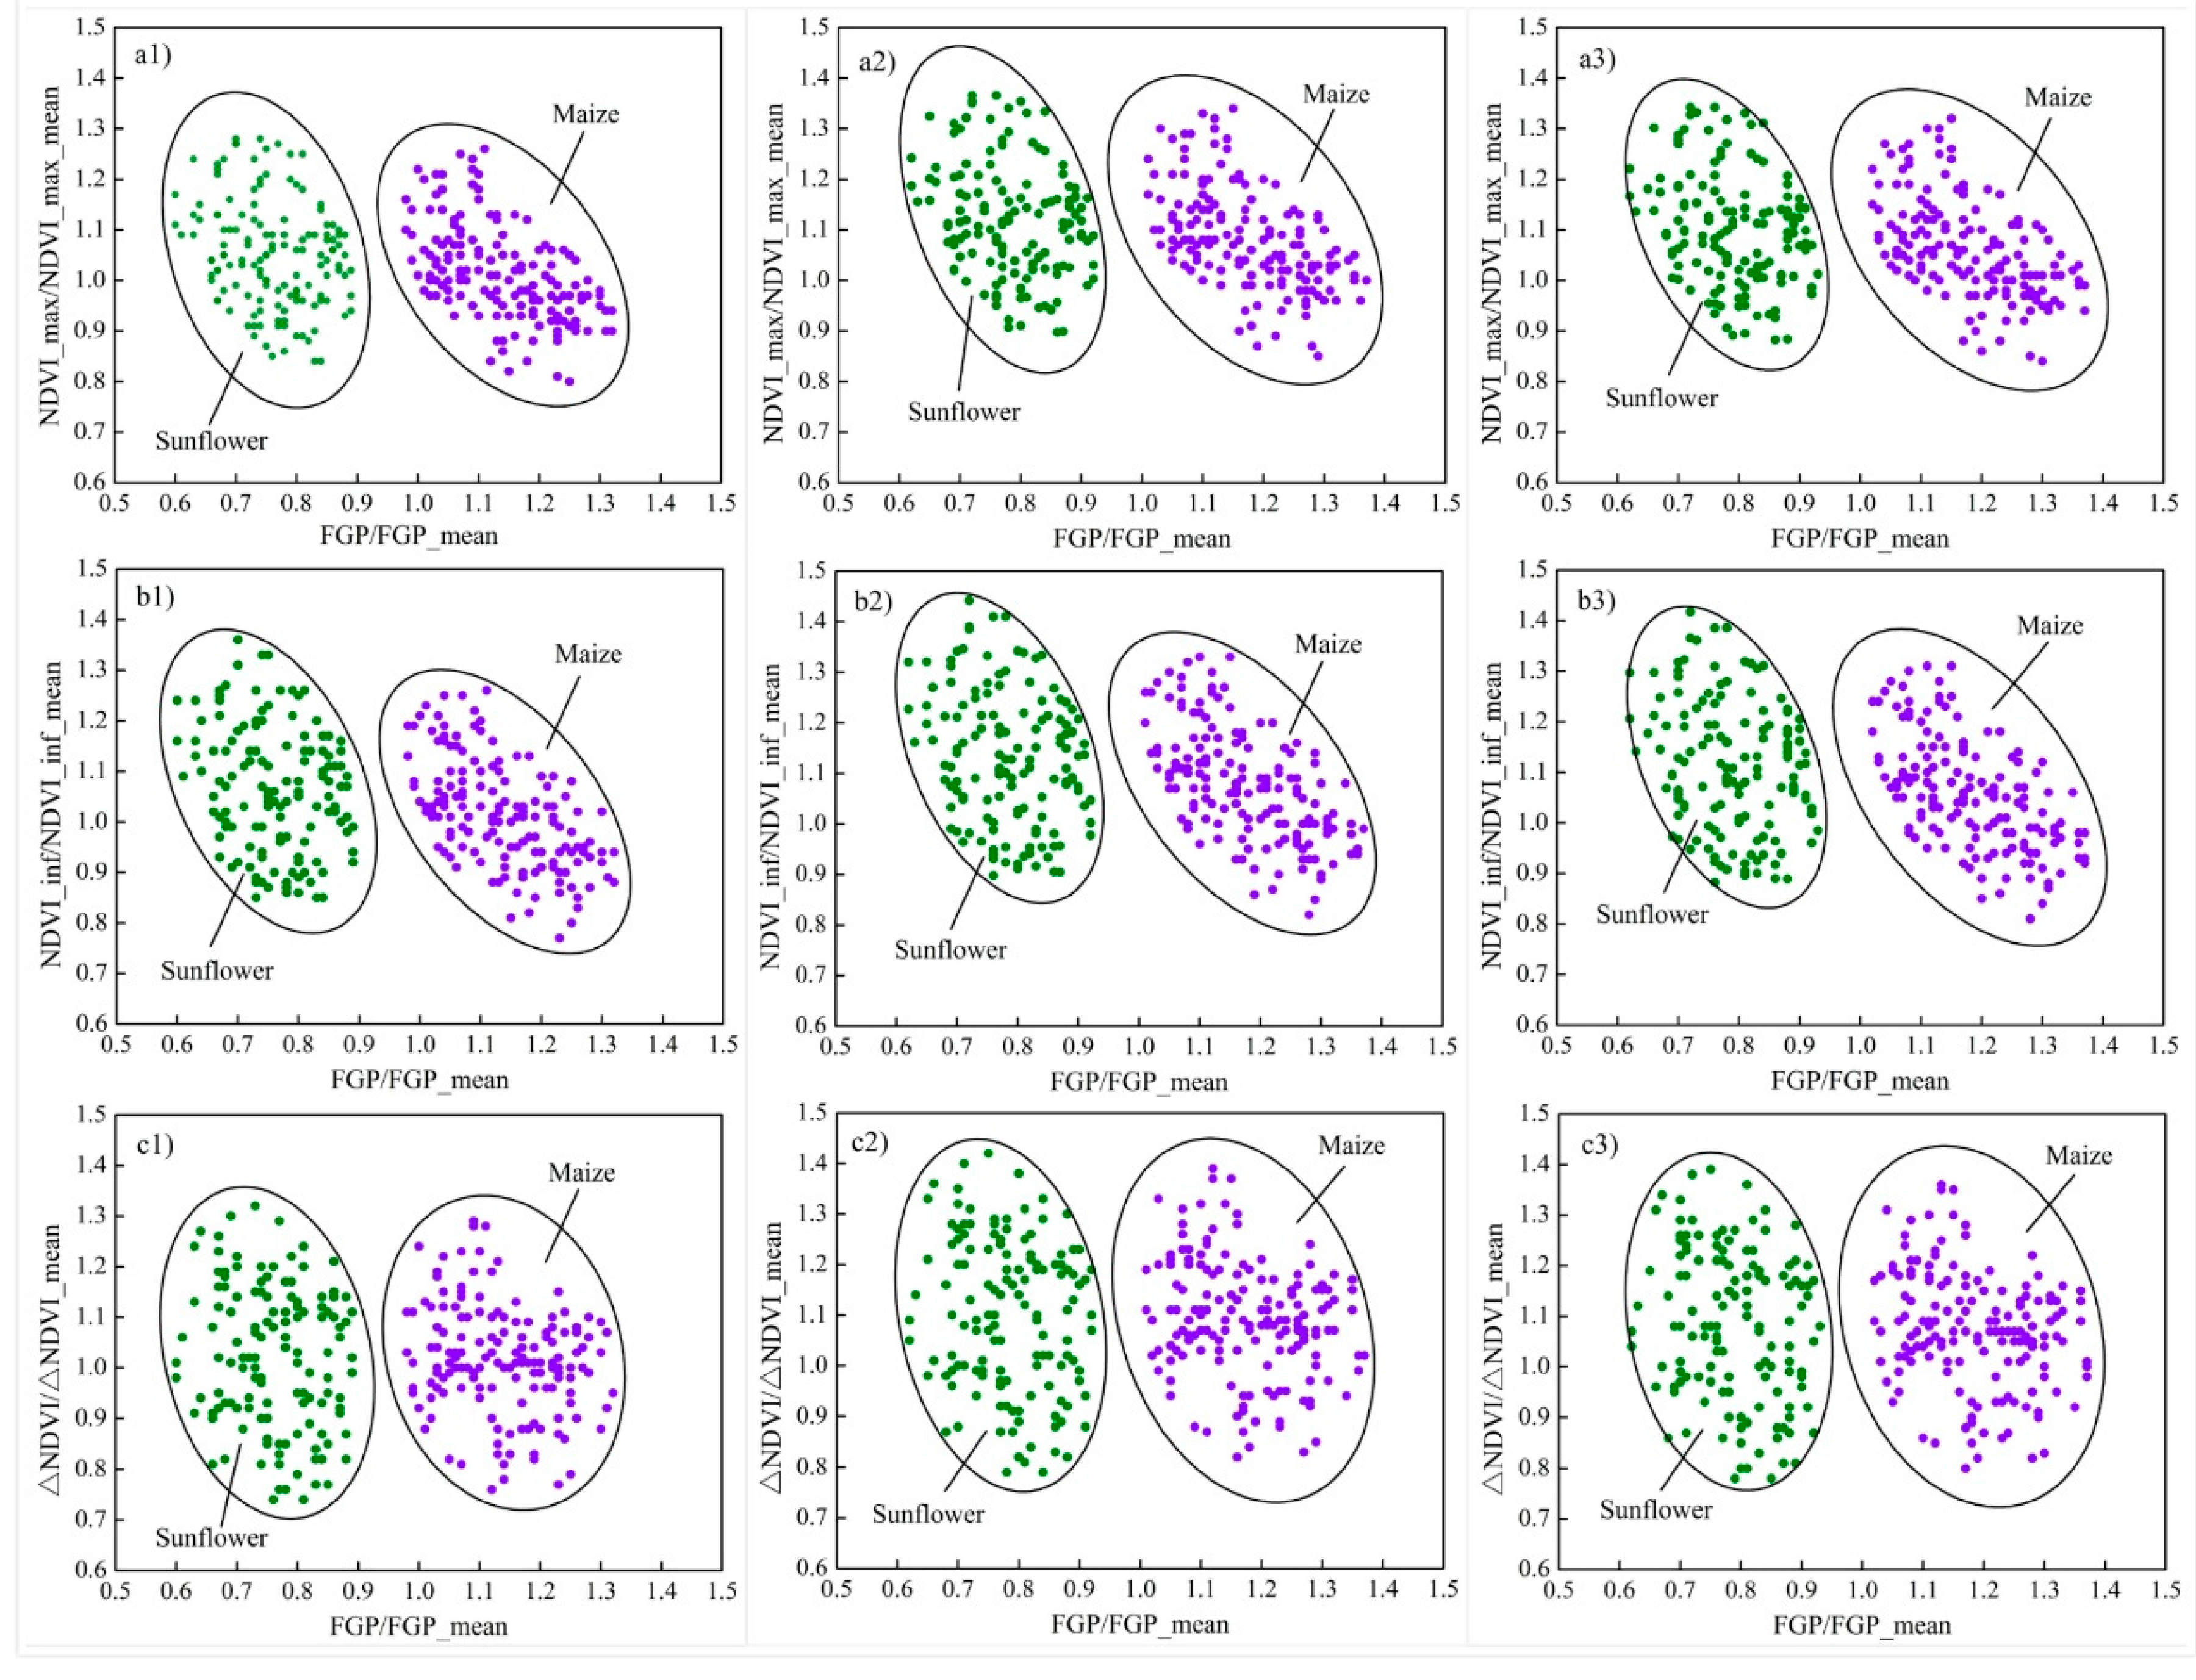
3.2. Crop Identification Model of Characteristic Ellipses

The phenology-based crop identification is a combination of phenology and vegetation indexes, which had been effectively applied to multi-year maize classification in the Hetao Irrigation District [11]. This method considered the differences of growth stage and growth condition to identify crops.
Phenological metrics represent the growth stage of crops, such as the time of sowing, harvesting, etc. Although the sowing time of the same crop may be different, the growth cycle of the same crop is usually stable. Therefore, the intervals between two phenological phases were applied instead of a single phenological phase to represent the growth stage of crops. We also used the fast growth phase (FGP = t_max − t_inf) as a typical phenological metric as Jiang et al. [11].
The NDVI characteristics indicate the growth condition of crops, and three NDVI characteristics (Table 3) were compared to find the most appropriate index. The vegetation growth condition varied among different years due to variation of meteorological conditions. In order to reduce the impact of meteorological conditions on crop growth in different years, it is preferable to normalize the above indexes. Jiang et al. [11] normalized each index using the corresponding average value of all farmland pixels. Considering that the spatial distribution and planting structure of crops changed in different years, we also used the average values of grassland pixels and forest pixels in the normalization. The mean values of NDVI characteristics and phenological metrics for farmland, grassland and forest were calculated as the reference values for normalization (Table 4), and the ratio of the above indexes to their corresponding reference values were used as the normalized indexes.
The normalized FGP was negatively correlated with normalized NDVI characteristics (Figure 6). Each combination of the normalized FGP with one of the nine normalized NDVI characteristics formed a phenology-based classifier for the identification of maize and sunflower (Figure 6). Consequently, we have nine phenology-based classifiers, the name and details of the ellipses were shown in Table 5.
From Figure 6, scatter points of normalized FGP vs. each normalized NDVI characteristic can be approximately covered by an ellipse. Our intention was to find out the minimum ellipse that can cover all sampling points. The standard equation of an ellipse with (0, 0) as the center and x and y axes as principal axes can be expressed as
x 2 a 2   +   y 2 b 2   =   1     ( a > b > 0 )
where a and b are semi-major and semi-minor axes, respectively. When the ellipse center moves from (0, 0) to (m, n) and the ellipse has a rotation angle of θ, the standard equation can be expressed as
A x 2 + B y 2 + C x y + D x + E y + F = 0
where A, B, C, D, E and F are parameters, which can be calculated from m, n, a, b, and θ [11].
The minimum ellipse was obtained by the least square method with the objective of minimizing the ellipse area on the condition that all points fell into the ellipse. Due to the limited number of sampling points, the minimum ellipse may not contain all the growth traits of maize or sunflower in the whole irrigation district. Therefore, ellipses should be amplified by increasing the semi-major and semi-minor axes to optimal values to achieve a smaller and acceptable relative error between identified crop planting areas and official statistical data. The relative area is defined as
δ = ( Calculated area Statistical area ) 100 Statistical area
where Calculatedarea and Statisticalarea are crop planting areas calculated from the classification model and from the official statistics, respectively. Furthermore, the Kappa coefficient was used to evaluate the consistency of crop spatial distribution between the identification results and the actual planting structure. The Kappa coefficient is calculated as [51]
κ = P o P c 1 P c
where Po is the proportion of observed agreements and Pc is the proportion of agreements expected by chance.
The years 2010, 2011 and 2013 were selected as training years, while 2009, 2012, 2014 and 2015 were the testing years. The amplification coefficients of a and b were defined as Fa and Fb and they were set to be 1.00 to 1.35 and 1.00 to 1.15, respectively, with steps of 0.01. The amplification results of a and b of the above nine ellipses were shown in Table 5.
During the identification process, NDVI series of each pixel were fitted with the asymmetric logistic curve. However, poor data of some pixels may result in unrealistic fitting results. According to field survey results, the FGP of maize and sunflower are usually between 20 and 60 days, respectively. Therefore, a pixel with FGP outside this range is defined as an outlier. The outliers were processed with k-Nearest Neighbor (kNN) algorithm with the window size of 3 × 3. If more than 4 pixels of the 8 pixels around an outlier belong to a particular crop, the outlier is also classified as this crop. If there are more outliers, the effect of the kNN algorithm will be affected.

4. Results and Discussion

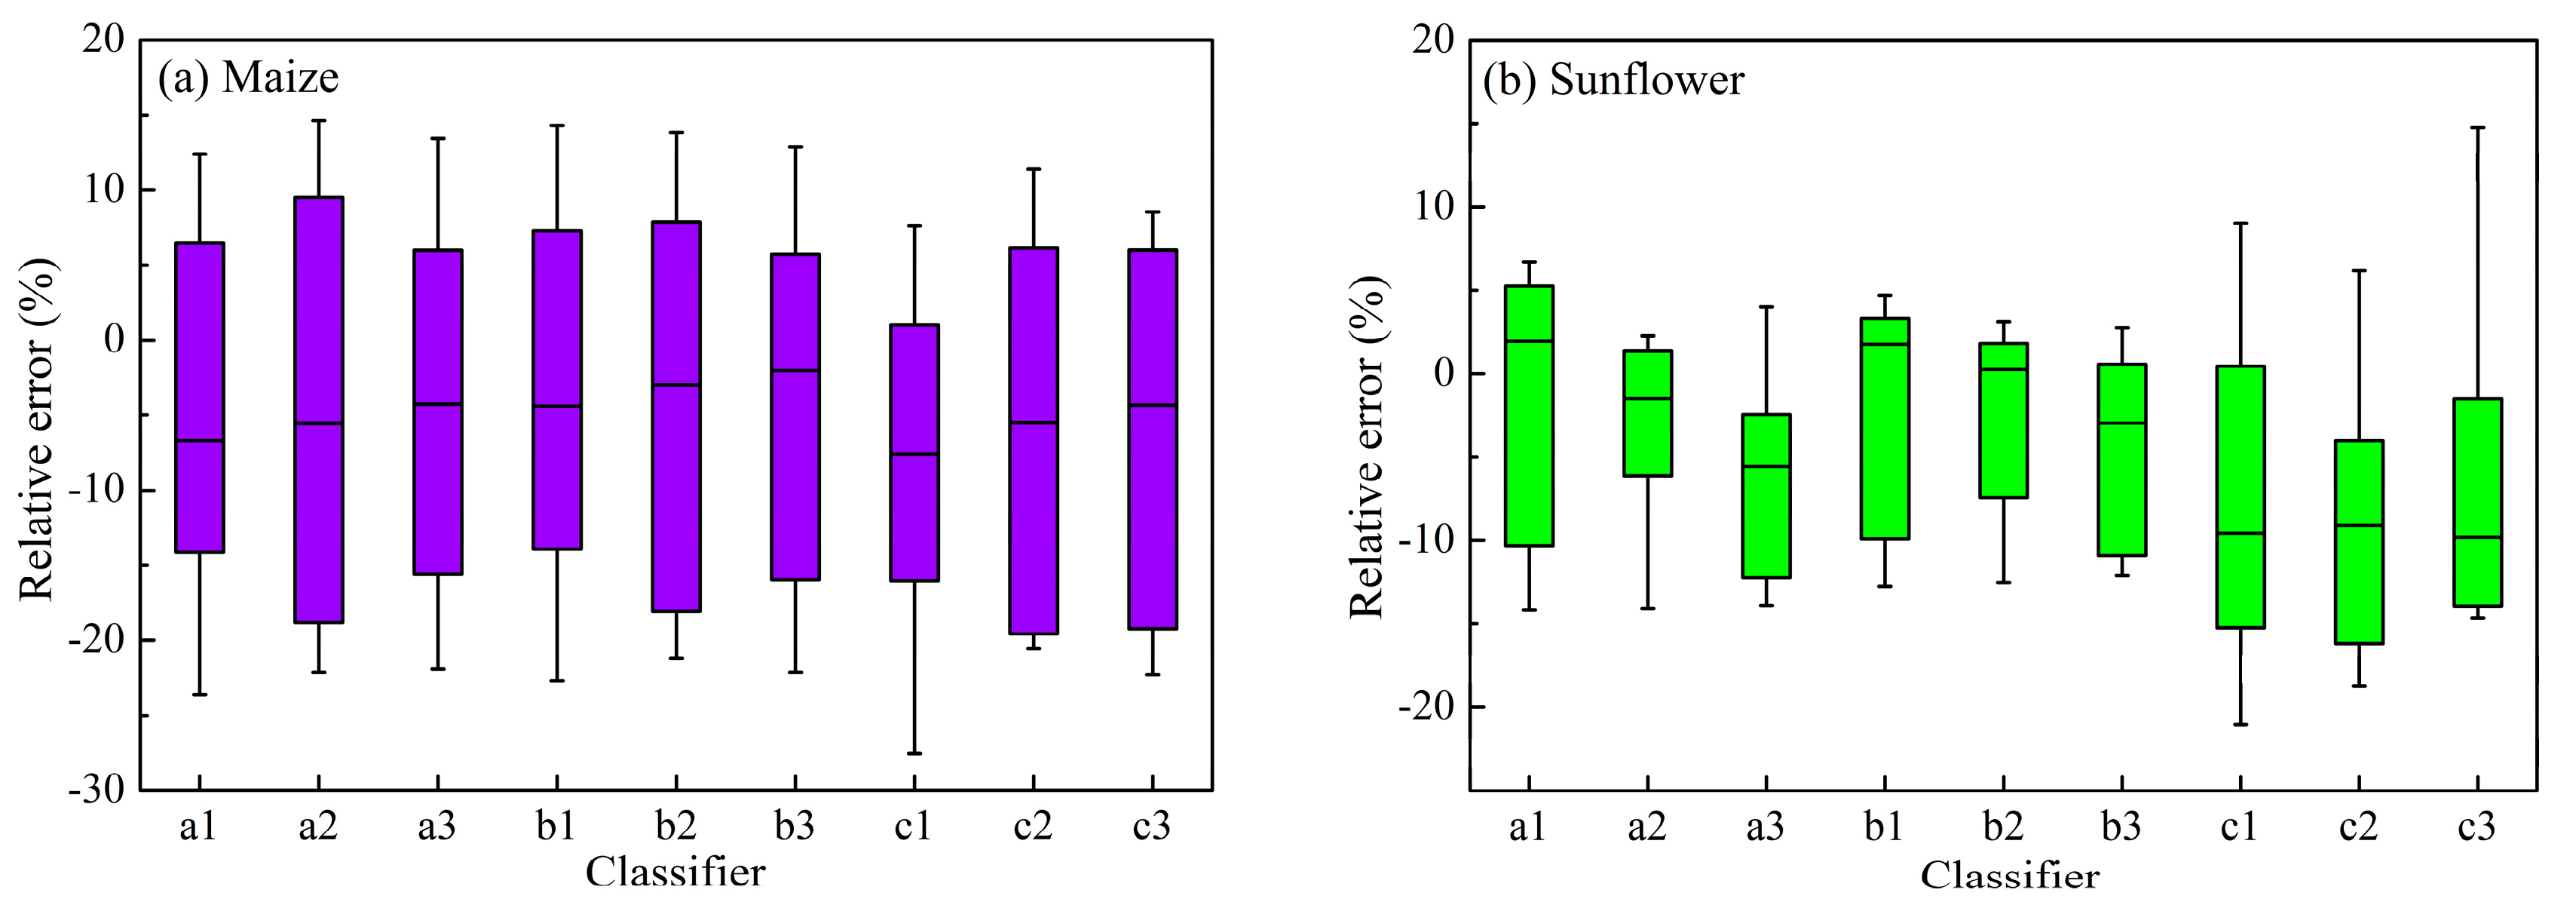
4.1. Comparison of Identification Results of Nine Classifiers

Figure 7 shows the relative errors of identified maize and sunflower planting areas from 2009 to 2015 using the above nine classifiers. For the training years, the mean relative errors of classifiers normalized with mean values of farmland, grassland and forest are 6.18%, 6.70%, and 4.62% for maize, and 5.32%, 3.35%, and 5.25% for sunflower, respectively. For the testing years, the corresponding mean relative errors are 14.55%, 14.08% and 13.79% for maize, and 9.19%, 8.72% and 8.87% for sunflower, respectively. Compared with the results of Jiang et al. [11] with the mean relative error for maize of 15.91%, our identification results of maize are significantly better. Moreover, we also obtained better identification results of sunflower than maize. Consequently, our classifiers of maize and sunflower are superior to Jiang et al. [11]. One possible reason for more precise identification results may be the higher spatial resolution data of 30 m that can reduce the impact of mixed pixels and enhance the capability in identifying small areas of maize and sunflower.
Considering the overall identification performance of maize and sunflower, the mean relative errors of the above three normalization approaches are 5.75%, 4.85%, and 4.94% for the training years, and 11.87%, 11.40%, and 11.33% for the testing years. Therefore, the relative errors of the second and third normalization approaches were quite close, which are both smaller than the first one. This is because the growth of farmland is not only affected by climatic factors, but also affected by plant structure, irrigation conditions, and other factors, resulting in instability of its normalized results. While the growth of grassland and forest are mainly affected by climatic factors, using grassland and forest indexes can eliminate the influence of different meteorological conditions after normalization. In addition, the forest area is relative small, while the area of grassland is the second largest and only smaller than the farmland in the study area (Figure 2). Therefore, the mean values of grassland indexes are more representative than forest, which was chosen for normalization.
For three classifiers normalized with grassland indexes, the mean relative errors during the training and testing years using the classifiers of NDVI_max~FGP, NDVI_inf~FGP and ∆NDVI~FGP are 11.46%, 10.82% and 10.48% for maize, and 4.37%, 4.38% and 10.50% for sunflower, respectively. The mean relative errors of maize and sunflower in the above three methods are 7.92%, 7.60% and 10.49%, respectively. The relative error from the ∆NDVI~FGP classifier are higher than the NDVI_max~FGP and NDVI_inf~FGP classifiers, and the NDVI_inf~FGP classifier has slightly better performance than the NDVI_max~FGP classifier. Consequently, the NDVI_inf~FGP classifier (b2) based on the normalization of grassland indexes was selected as the optimal classifier, and the corresponding ellipse equations of maize and sunflower are
895 x 2 + 673 y 2 + 484 x y 2821 x 1832 y + 2608 = 0
940 x 2 + 426 y 2 292 x y 1939 x 1000 y + 1298 = 0

4.2. Crop Identification Results Based on Optimal Classifier

Figure 8 compares the total area of maize and sunflower from official statistics and identified maps. From 2009 to 2015, the identified planting area of maize and sunflower are increasing progressively in general, which is consistent with statistical trends. This proves that this optimal classifier is suitable for multi-year maize and sunflower identification. However, there are also some years with a slightly large identification error. For 2012 and 2014, the areas of maize and sunflower are both underestimated. Especially for maize, the relative errors are −18.09% and −21.17%, respectively. This may be attributed to the less qualified remote sensing images in these two years, which both have fewer available images during the growing season (from DOY 100 to 300) than other years. When images in the key growth period missed, the fitting quality of the logistic curve and the extraction of phenological features will be affected, which may lead to poorer identification results than other years.
To further verify the accuracy of crop identification results, the correct identification percentage of different crops and Kappa coefficient (Table 6) were calculated using the verification points in 2014 and 2015 (Figure 1). The correct identification rates of different crops were all greater than 70% and the Kappa value of consistency test was 0.62, which indicated that the classifier performance was acceptable [15].
We also selected a specific micro-scale area (19.36 ha) of Hetao Irrigation District to analyze the classification results; the detailed description of this area can be referred to Ren et al. [4]. The crop planting structure of this area is similar to the whole Hetao Irrigation District, the planting area of maize and sunflower accounts for about half of the total area. According to the statistics data of planting area in 2012 and 2013, the mean relative errors of classifiers for maize and sunflower are 14.00% and −24.49%, respectively. This shows that the classifier is also applicable to micro-scale areas.

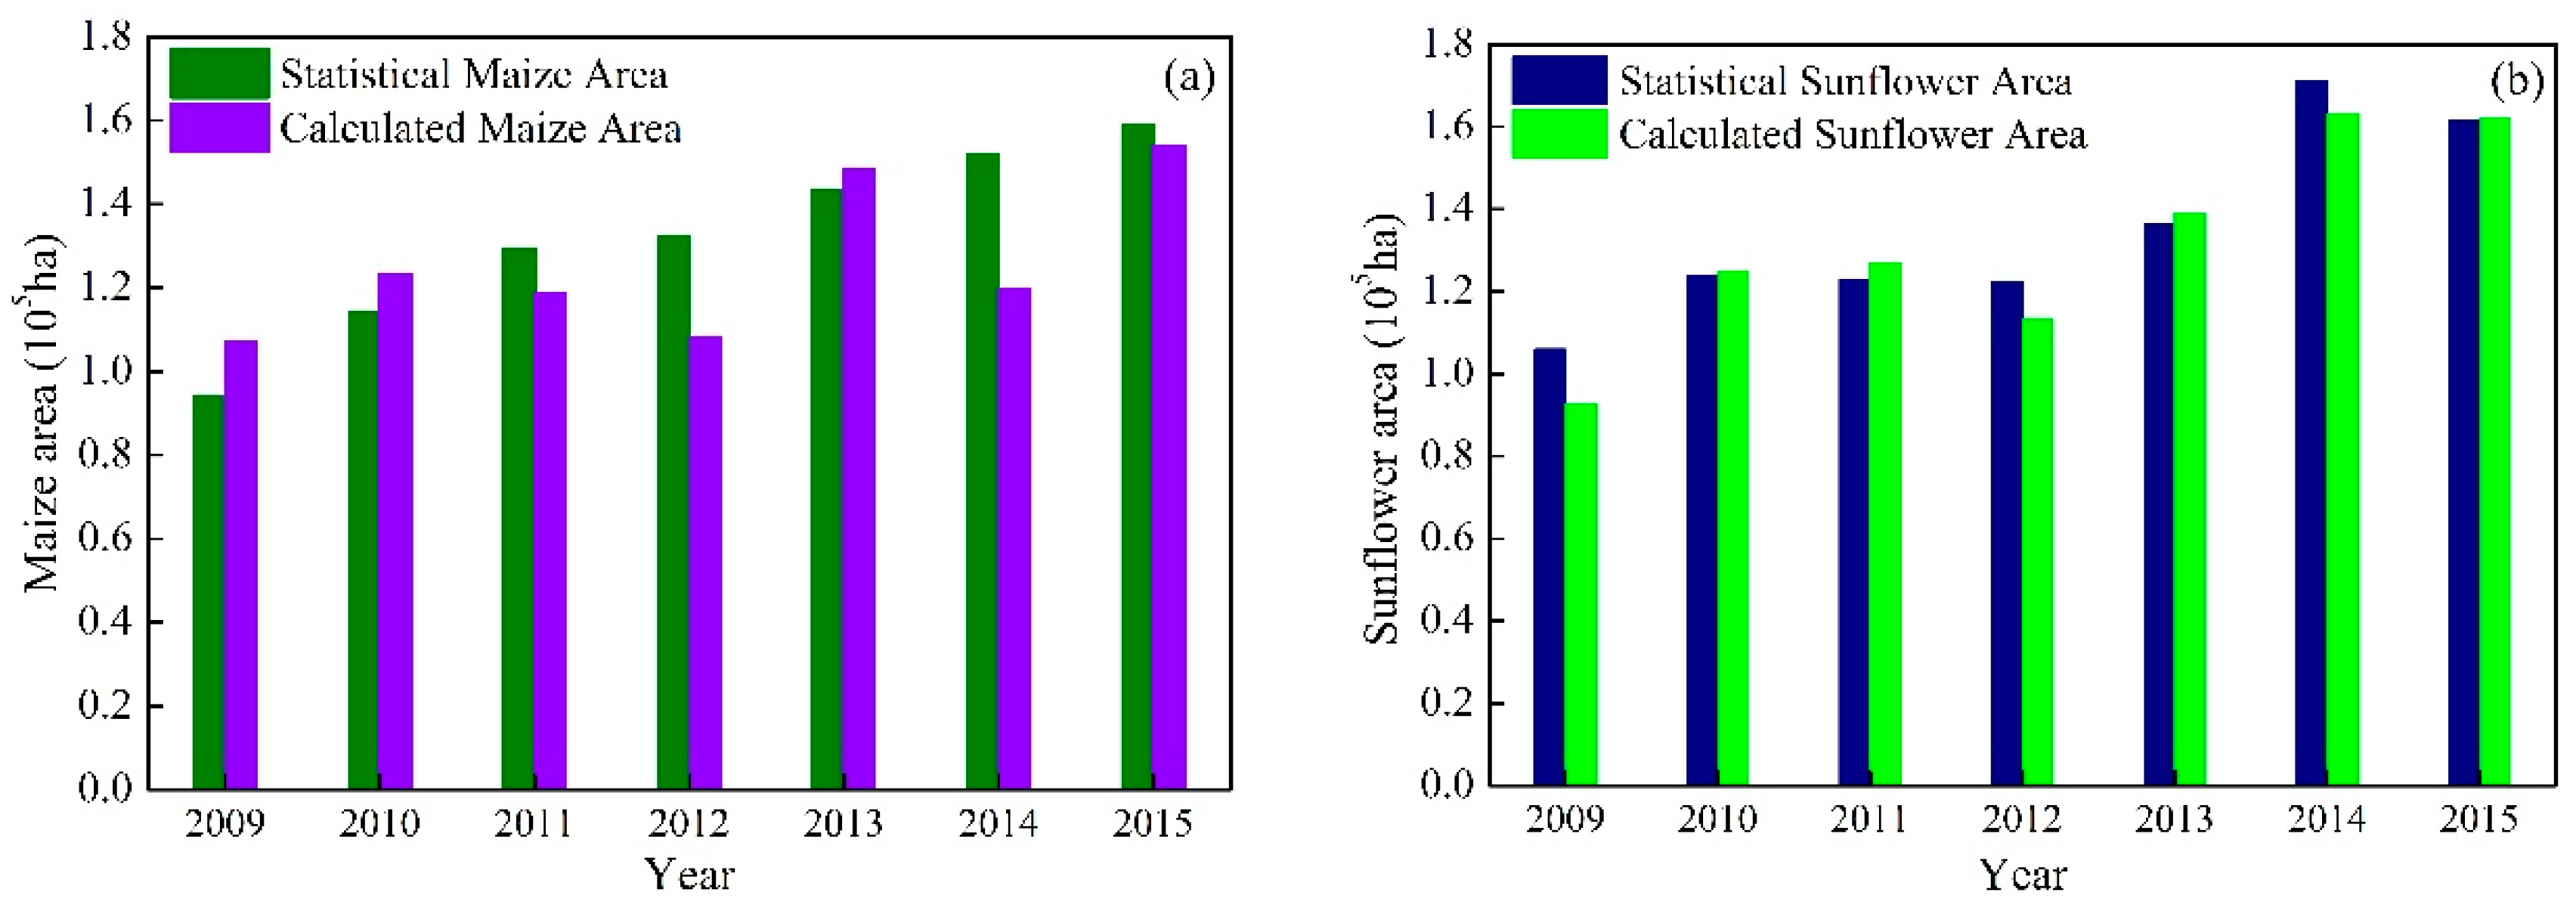
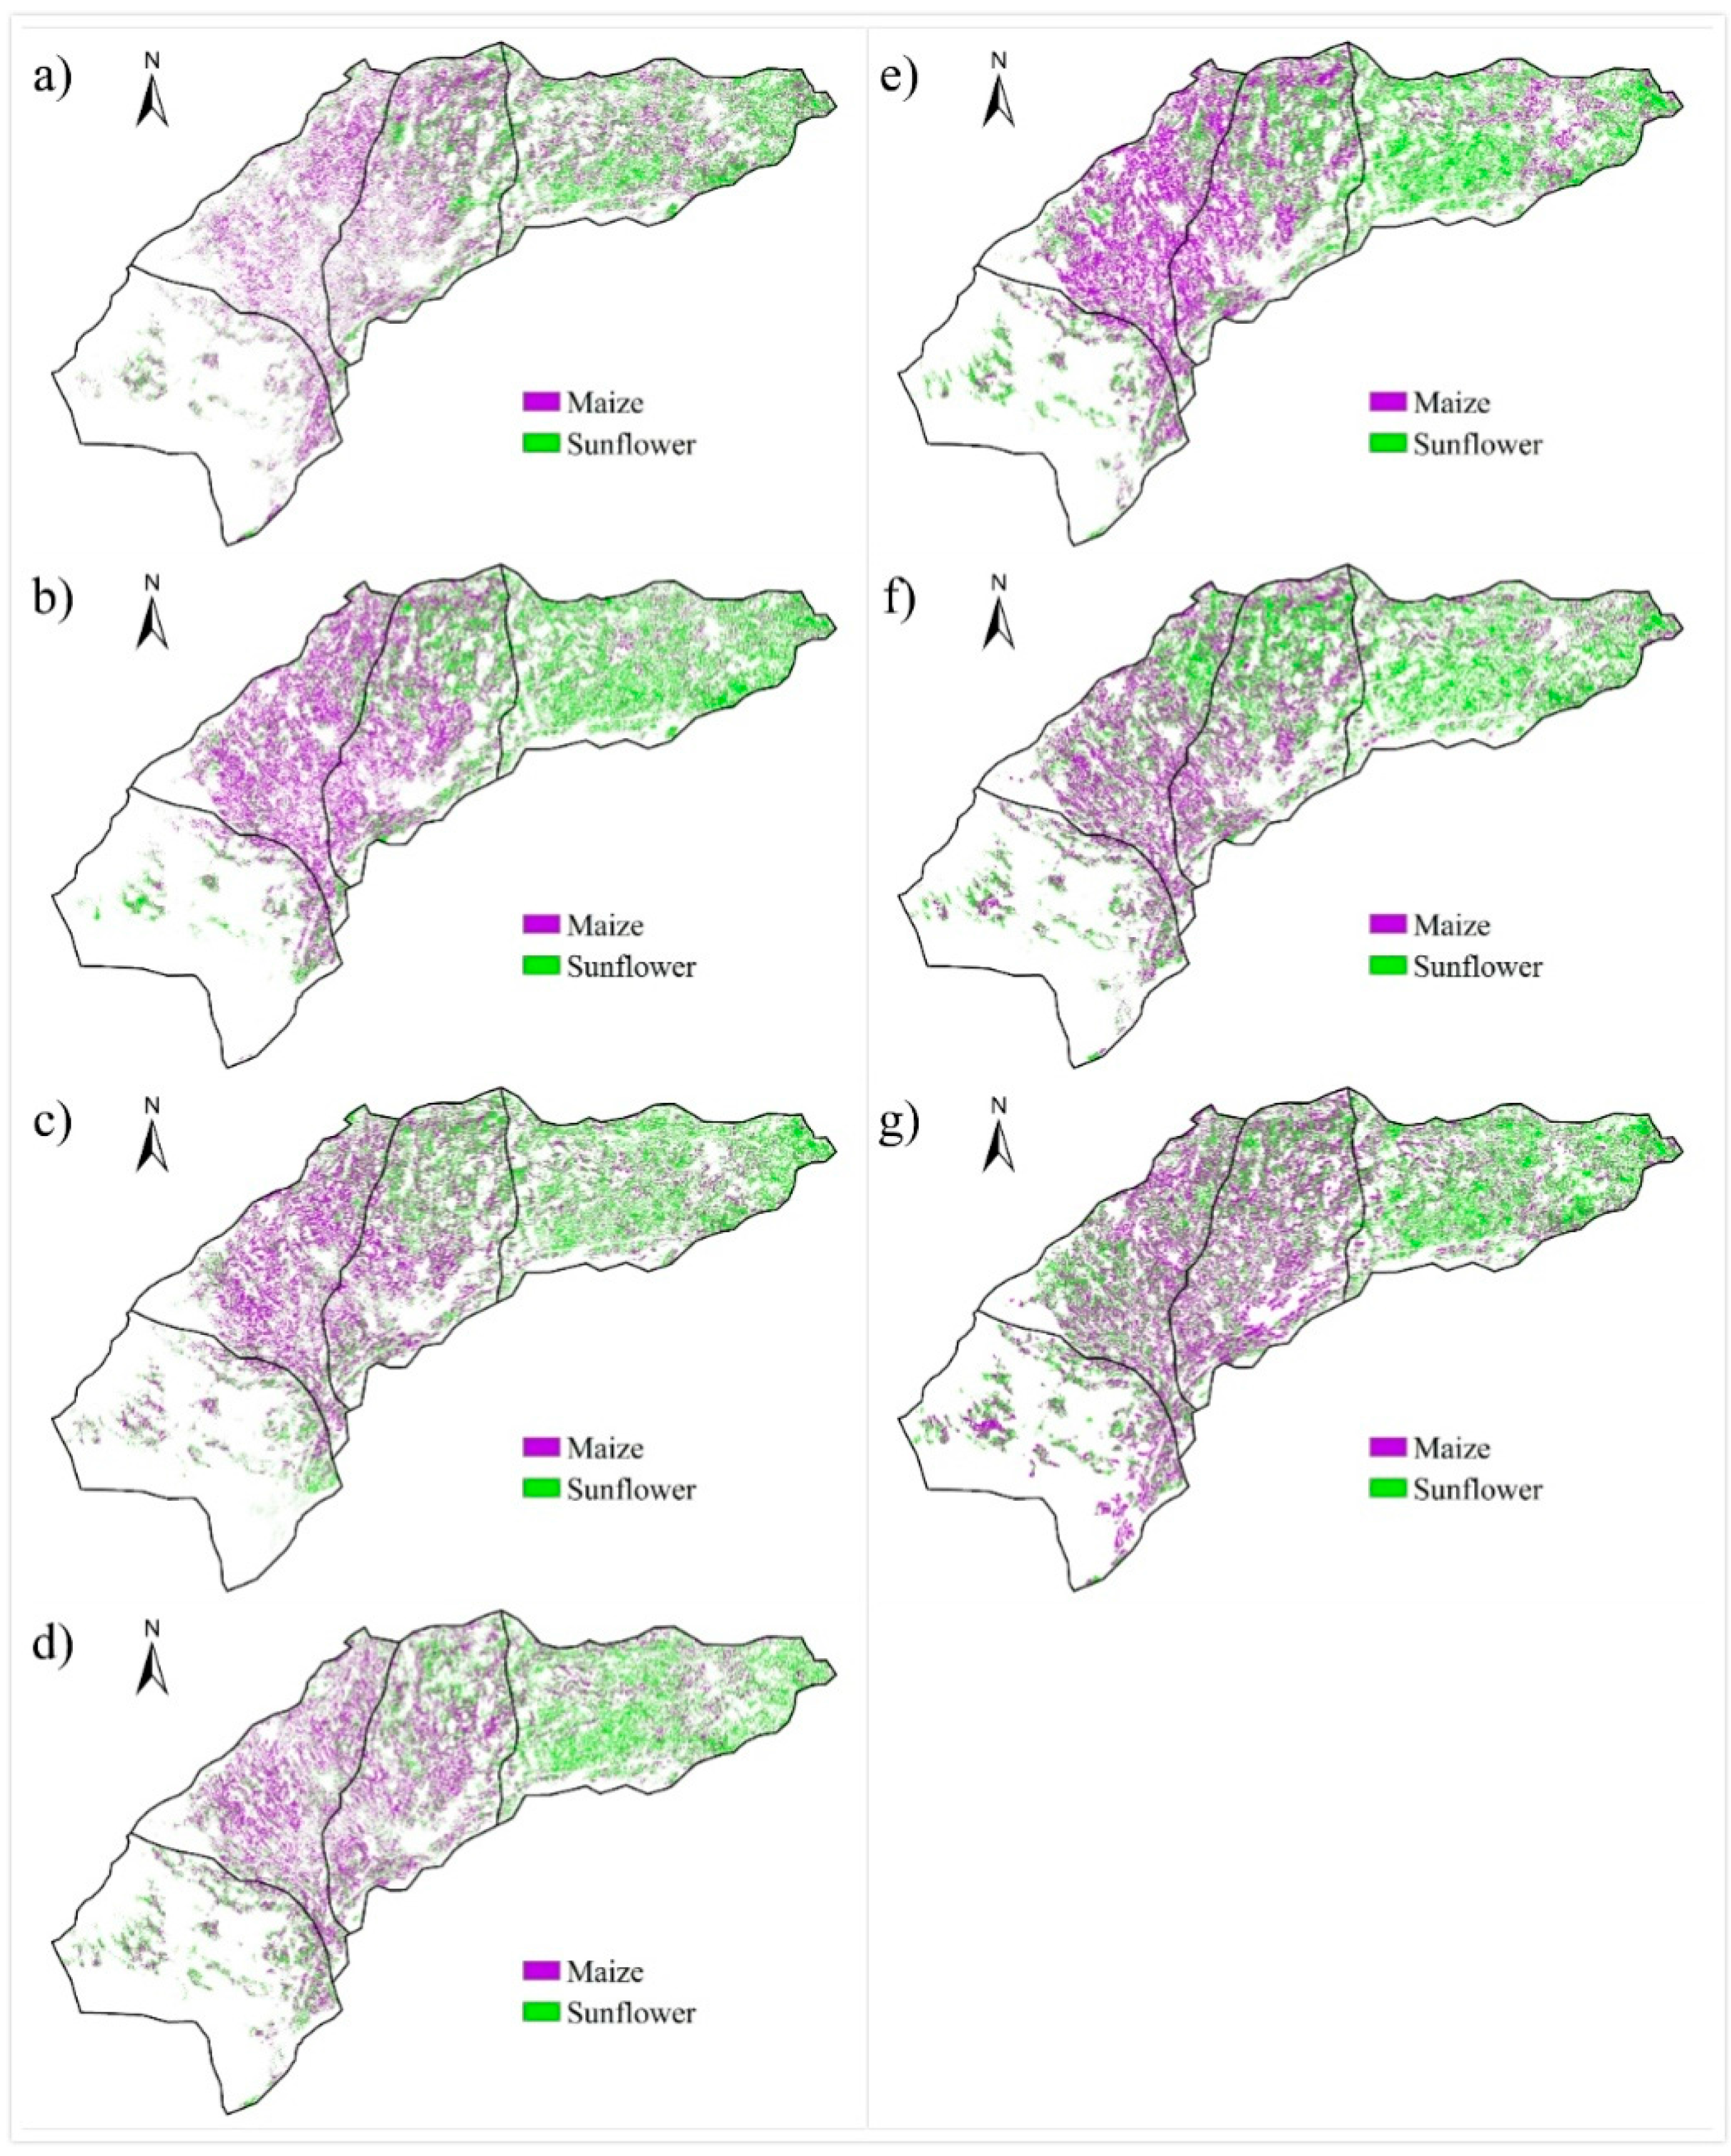
4.3. Spatial and Temporal Distribution of Maize and Sunflower

Maize and sunflower distribution maps in the study area from 2009 to 2015 are shown in Figure 9. Most large maize and sunflower fields are concentrated in the eastern three counties (Hangjinhouqi, Linhe and Wuyuan), and fields are patchier in Dengkou where the terrain is mainly desert and Gobi. Maize is mainly distributed in Hangjinhouqi and Linhe, while sunflower mainly in Wuyuan. The distribution of maize and sunflower is coherent during the study years, which is in agreement with official statistical results. This verifies the accuracy of the classifiers’ performance of this optimal classifier again.
According to the color depth in Figure 9, we can see that the planting areas of maize and sunflower are increasing from 2009 to 2015. Especially for the sunflower, the planting sites are gradually expanded from Wuyuan to the northern part of Hangjinhouqi and Linhe, and these results are in agreement with the local economic policy. Sunflower seeds are the main raw material of sunflower oil and sunflower is an important economic crop in the Hetao Irrigation District. Therefore, planting sunflower can bring more benefit to farmers than other crops. Compared to wheat, local farmers prefer to plant sunflower to get more profits, resulting in an increase in the planting area of sunflower and decrease of wheat. Hence, it is more important to identify sunflower more accurately in Hetao Irrigation District. External factors, such as economic factors, are the main reason for the change of crop plant structure. This result is similar to Lunetta et al. [16], who reported that biofuel mandates led to a significant increase in the planting area of maize in Laurentian Great Lakes Basin.

5. Conclusions

In this study, we presented a phenology-based classification method to map multi-year maize and sunflower in Hetao Irrigation District from 2009 to 2015. The main feature of this study is that we used NDVI time series based on HJ-1A/1B 30 m optical imagery as the identification of vegetation parameters, and developed annual maize and sunflower map products with acceptable accuracy. The main conclusions of this study are as follows:
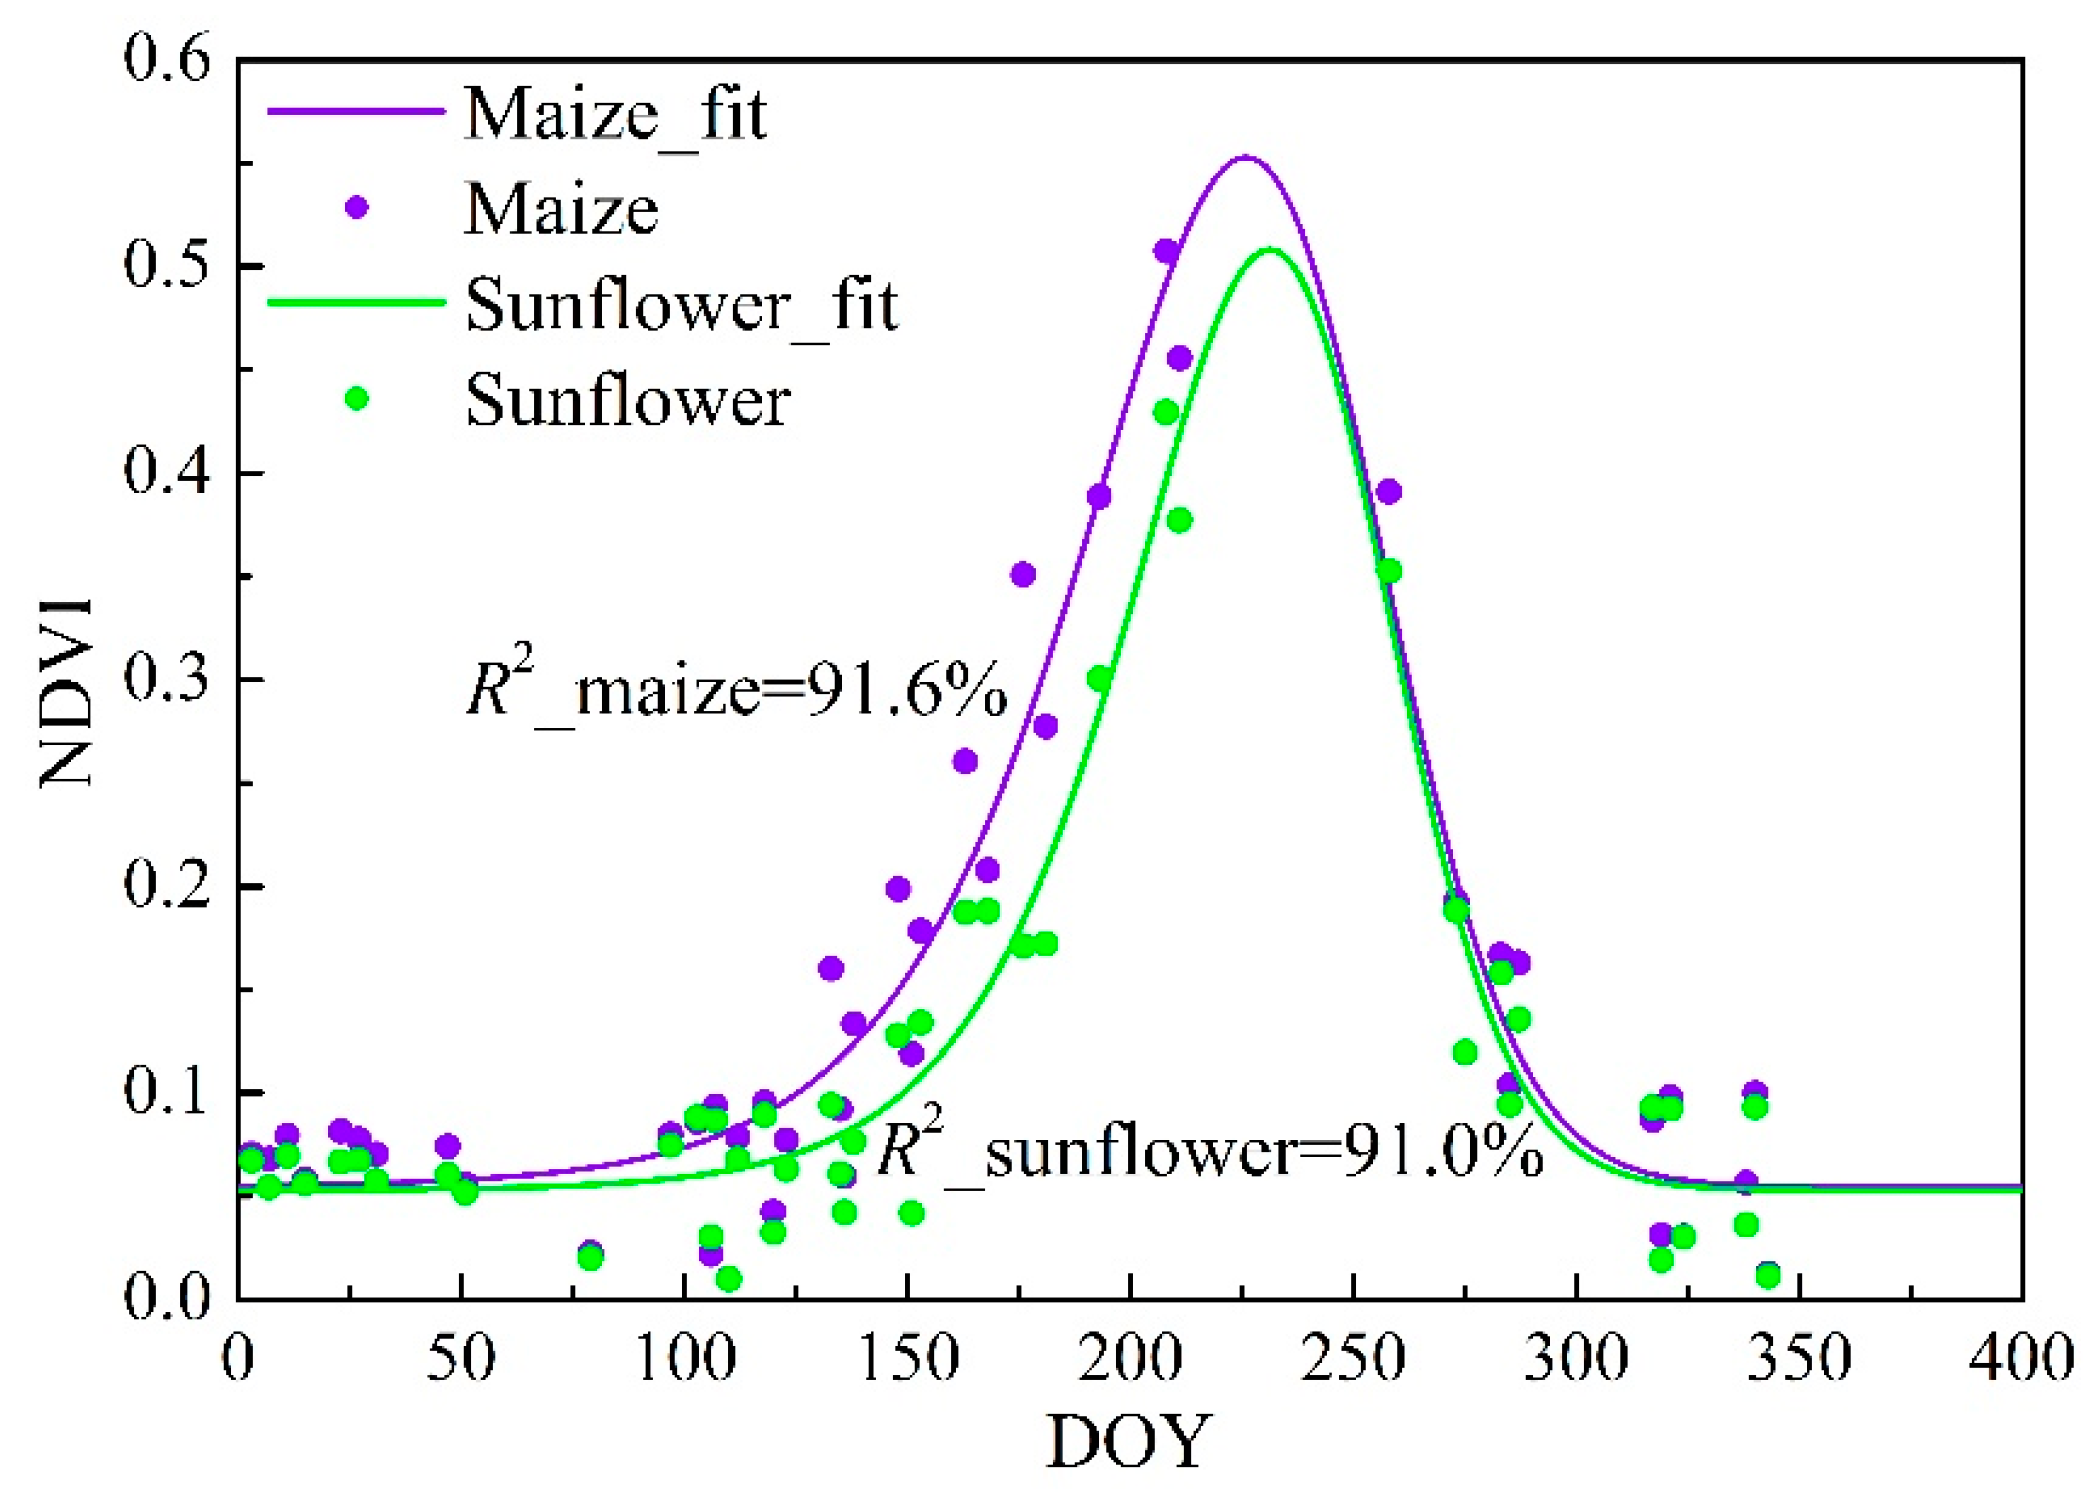
  • The reconstructed NDVI time series based on HJ-1A/1BCCD images could represent the phenological characteristics of maize and sunflower in the study area, and the phenological characteristics of these two crops had significant differences in the NDVI increasing period. The crop identification ellipse normalized with mean grassland NDVI_inf as the NDVI characteristic and FGP as the phenological metric were proved to be the optimal identification ellipse. In future studies, other vegetation indexes can also be used as classification factors for comparative analysis.
  • The multi-year spatial distribution of maize and sunflower in the study area could be effectively identified with the Kappa value of consistency test of 0.62. The sunflower classifier performed better than maize.
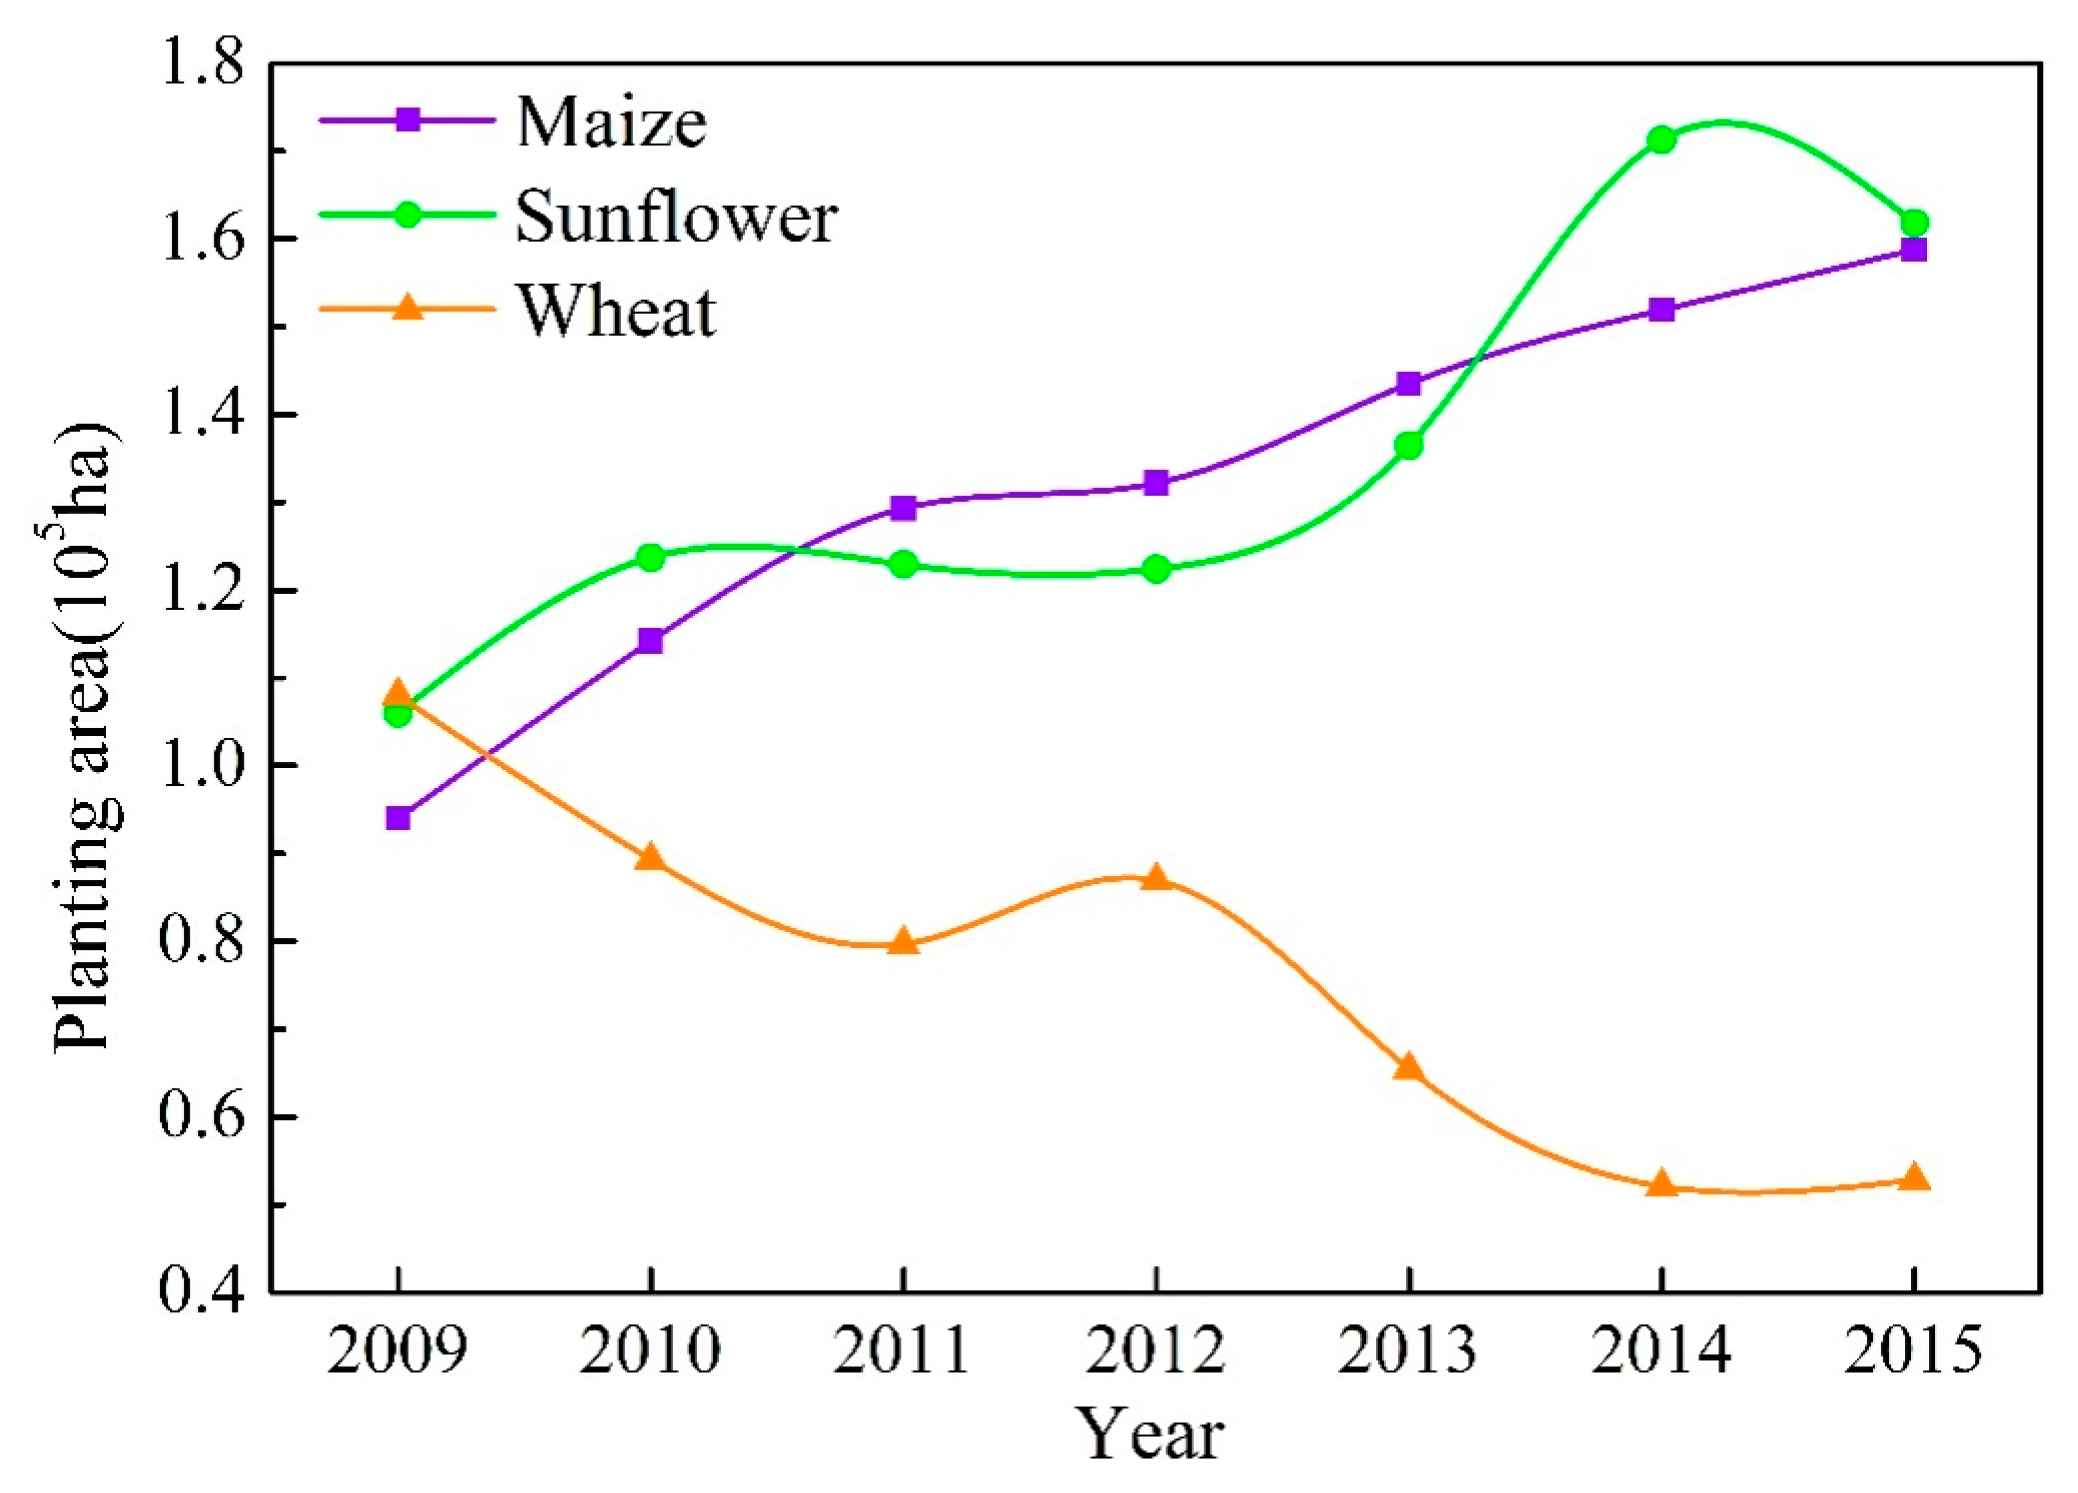
  • The planting areas of maize and sunflower were increasing during the study years. Maize was mainly distributed in Hangjinhouqi and Linhe, while sunflower mainly in Wuyuan, and the planting sites of sunflower were gradually expanded from Wuyuan to the northern part of Hangjinhouqi and Linhe, and these results were in agreement with the local economic policy.

Acknowledgments

This research was partially supported by National Natural Science Foundation of China (grant number: 51479090). We are especially grateful to the research group of Professor Guanhua Huang of China Agricultural University for providing the data of the verification points in 2014 and 2015. We are also grateful to the editor and all the reviewers for their insightful comments and constructive suggestions.

Author Contributions

Songhao Shang outlined the research topic, assisted with manuscript writing, and coordinated the revision activities. Bing Yu performed data collection and processing, data analysis, model building, the interpretation of results, manuscript writing, and coordinated the revision activities.

Conflicts of Interest

The authors declare no conflicts of interest.

References

  1. Johnson, D.M. An assessment of pre- and within-season remotely sensed variables for forecasting corn and soybean yields in the United States. Remote Sens. Environ. 2014, 141, 116–128. [Google Scholar] [CrossRef]
  2. Shao, Y.; Campbell, J.B.; Taff, G.N.; Zheng, B. An analysis of cropland mask choice and ancillary data for annual corn yield forecasting using MODIS data. Int. J. Appl. Earth Obs. Geoinf. 2015, 38, 78–87. [Google Scholar] [CrossRef]
  3. Jiang, Y.; Xu, X.; Huang, Q.; Huo, Z.; Huang, G. Assessment of irrigation performance and water productivity in irrigated areas of the middle Heihe River basin using a distributed agro-hydrological model. Agric. Water Manag. 2015, 147, 67–81. [Google Scholar] [CrossRef]
  4. Ren, D.; Xu, X.; Hao, Y.; Huang, G. Modeling and assessing field irrigation water use in a canal system of Hetao, upper Yellow River basin: Application to maize, sunflower and watermelon. J. Hydrol. 2016, 532, 122–139. [Google Scholar] [CrossRef]
  5. Thenkabail, P.S.; Biradar, C.M.; Noojipady, P.; Dheeravath, V.; Li, Y.; Velpuri, M.; Gumma, M.; Gangalakunta, O.R.P.; Turral, H.; et al. Global irrigated area map (GIAM), derived from remote sensing, for the end of the last millennium. Int. J. Remote Sens. 2009, 30, 3679–3733. [Google Scholar] [CrossRef]
  6. Li, X. Change of arable land area in China during the past 20 years and its policy implications. J. Nat. Resour. 1999, 4, 329–333, (In Chinese with English Abstract). [Google Scholar]
  7. Gómez, C.; White, J.C.; Wulder, M.A. Optical remotely sensed time series data for land cover classification: A review. ISPRS J. Photogramm. Remote Sens. 2016, 116, 55–72. [Google Scholar] [CrossRef]
  8. Liu, J.; Liu, M.; Tian, H.; Zhuang, D.; Zhang, Z.; Zhang, W.; Tang, X.; Deng, X. Spatial and temporal patterns of China’s cropland during 1990–2000: An analysis based on Landsat TM data. Remote Sens. Environ. 2005, 98, 442–456. [Google Scholar] [CrossRef]
  9. Wardlow, B.D.; Egbert, S.L. Large-area crop mapping using time-series MODIS 250 m NDVIdata: An assessment for the U.S. Central Great Plains. Remote Sens. Environ. 2008, 112, 1096–1116. [Google Scholar] [CrossRef]
  10. Xue, Z.; Du, P.; Li, J.; Su, H. Sparse graph regularization for robust crop mapping using hyperspectral remotely sensed imagery with very few in situ data. ISPRS J. Photogramm. Remote Sens. 2017, 124, 1–15. [Google Scholar] [CrossRef]
  11. Jiang, L.; Shang, S.; Yang, Y.; Guan, H. Mapping interannual variability of maize cover in a large irrigation district using a vegetation index-phenological index classifier. Comput. Electron. Agric. 2016, 123, 351–361. [Google Scholar] [CrossRef]
  12. Zhong, L.; Hu, L.; Yu, L.; Gong, P.; Biging, G.S. Automated mapping of soybean and corn using phenology. ISPRS J. Photogramm. Remote Sens. 2016, 119, 151–164. [Google Scholar] [CrossRef]
  13. Löw, F.; Conrad, C.; Michel, U. Decision fusion and non-parametric classifiers for land use mapping using multi-temporal RapidEye data. ISPRS J. Photogramm. Remote Sens. 2015, 108, 191–204. [Google Scholar] [CrossRef]
  14. Chen, Y.; Song, X.; Wang, S.; Huang, J.; Mansaray, L.R. Impacts of spatial heterogeneity on crop area mapping in Canada using MODIS data. ISPRS J. Photogramm. Remote Sens. 2016, 119, 451–461. [Google Scholar] [CrossRef]
  15. Shao, Y.; Taff, G.N.; Ren, J.; Campbell, J.B. Characterizing major agricultural land change trends in the Western Corn Belt. ISPRS J. Photogramm. Remote Sens. 2016, 122, 116–125. [Google Scholar] [CrossRef]
  16. Lunetta, R.S.; Shao, Y.; Ediriwickrema, J.; Lyon, J.G. Monitoring agricultural cropping patterns across the Laurentian Great Lakes Basin using MODIS-NDVI data. Int. J. Appl. Earth Obs. Geoinf. 2010, 12, 81–88. [Google Scholar] [CrossRef]
  17. Shao, Y.; Lunetta, R.S. Comparison of support vector machine, neural network, and CART algorithms for the land-cover classification using limited training data points. ISPRS J. Photogramm. Remote Sens. 2012, 70, 78–87. [Google Scholar] [CrossRef]
  18. Barrett, B.; Nitze, I.; Green, S.; Cawkwell, F. Assessment of multi-temporal, multi-sensor radar and ancillary spatial data for grasslands monitoring in Ireland using machine learning approaches. Remote Sens. Environ. 2014, 152, 109–124. [Google Scholar] [CrossRef]
  19. Zhu, W.; Pan, Y.; He, H.; Wang, L.; Mou, M.; Liu, J. A Changing-Weight Filter Method for Reconstructing a High-Quality NDVI Time Series to Preserve the Integrity of Vegetation Phenology. IEEE Trans. Geosci. Remote Sens. 2012, 50, 1085–1094. [Google Scholar] [CrossRef]
  20. Zhong, L.; Gong, P.; Biging, G.S. Efficient corn and soybean mapping with temporal extendability: A multi-year experiment using Landsat imagery. Remote Sens. Environ. 2014, 140, 1–13. [Google Scholar] [CrossRef]
  21. Ghosh, A.; Joshi, P.K. A comparison of selected classification algorithms for mapping bamboo patches in lower Gangetic plains using very high resolution WorldView 2 imagery. Int. J. Appl. Earth Obs. Geoinf. 2014, 26, 298–311. [Google Scholar] [CrossRef]
  22. Belgiu, M.; Drăguţ, L. Random forest in remote sensing: A review of applications and future directions. ISPRS J. Photogramm. Remote Sens. 2016, 114, 24–31. [Google Scholar] [CrossRef]
  23. Gislason, P.O.; Benediktsson, J.A.; Sveinsson, J.R. Random Forests for land cover classification. Pattern Recogn. Lett. 2006, 27, 294–300. [Google Scholar] [CrossRef]
  24. Zhong, L.; Hawkins, T.; Biging, G.; Gong, P. A phenology-based approach to map crop types in the San Joaquin Valley, California. Int. J. Remote Sens. 2011, 32, 7777–7804. [Google Scholar] [CrossRef]
  25. Hmimina, G.; Dufrêne, E.; Pontailler, J.Y.; Delpierre, N.; Aubinet, M.; Caquet, B.; De Grandcourt, A.; Burban, B.; Flechard, C.; Granier, A.; et al. Evaluation of the potential of MODIS satellite data to predict vegetation phenology in different biomes: An investigation using ground-based NDVI measurements. Remote Sens. Environ. 2013, 132, 145–158. [Google Scholar] [CrossRef]
  26. Parplies, A.; Dubovyk, O.; Tewes, A.; Mund, J.; Schellberg, J. Phenomapping of rangelands in South Africa using time series of RapidEye data. Int. J. Appl. Earth Obs. Geoinf. 2016, 53, 90–102. [Google Scholar] [CrossRef]
  27. Walker, J.J.; de Beurs, K.M.; Wynne, R.H. Dryland vegetation phenology across an elevation gradient in Arizona, USA, investigated with fused MODIS and Landsat data. Remote Sens. Environ. 2014, 144, 85–97. [Google Scholar] [CrossRef]
  28. Li, L.; Friedl, M.; Xin, Q.; Gray, J.; Pan, Y.; Frolking, S. Mapping Crop Cycles in China Using MODIS-EVI Time Series. Remote Sens. 2014, 6, 2473–2493. [Google Scholar] [CrossRef]
  29. Pan, Z.; Huang, J.; Zhou, Q.; Wang, L.; Cheng, Y.; Zhang, H.; Blackburn, G.A.; Yan, J.; Liu, J. Mapping crop phenology using NDVI time-series derived from HJ-1A/B data. Int. J. Appl. Earth Obs. Geoinf. 2015, 34, 188–197. [Google Scholar] [CrossRef]
  30. Huete, A.; Didan, K.; Miura, T.; Rodriguez, E.P.; Gao, X. Overview of the radiometric and biophysical performance of the MODIS vegetation indices. Remote Sens. Environ. 2002, 83, 195–213. [Google Scholar] [CrossRef]
  31. Sehgal, V.K.; Jain, S.; Aggarwal, P.K.; Jha, S. Deriving Crop Phenology Metrics and Their Trends Using Times Series NOAA-AVHRR NDVI Data. J. Indian Soc. Remote Sens. 2011, 39, 373–381. [Google Scholar] [CrossRef]
  32. Lu, L.; Kuenzer, C.; Wang, C.; Guo, H.; Li, Q. Evaluation of Three MODIS-Derived Vegetation Index Time Series for Dryland Vegetation Dynamics Monitoring. Remote Sens. 2015, 7, 7597–7614. [Google Scholar] [CrossRef] [Green Version]
  33. Johnson, M.D.; Hsieh, W.W.; Cannon, A.J.; Davidson, A.; Bédard, F. Crop yield forecasting on the Canadian Prairies by remotely sensed vegetation indices and machine learning methods. Agric. For. Meteorol. 2016, 218–219, 74–84. [Google Scholar] [CrossRef]
  34. Martínez, B.; Gilabert, M.A. Vegetation dynamics from NDVI time series analysis using the wavelet transform. Remote Sens. Environ. 2009, 113, 1823–1842. [Google Scholar] [CrossRef]
  35. Yang, C.; Everitt, J.H.; Murden, D. Evaluating high resolution SPOT 5 satellite imagery for crop identification. Comput. Electron. Agric. 2011, 75, 347–354. [Google Scholar] [CrossRef]
  36. Wardlow, B.; Egbert, S.; Kastens, J. Analysis of time-series MODIS 250 m vegetation index data for crop classification in the U.S. Central Great Plains. Remote Sens. Environ. 2007, 108, 290–310. [Google Scholar] [CrossRef]
  37. Fritz, S.; Massart, M.; Savin, I.; Gallego, J.; Rembold, F. The use of MODIS data to derive acreage estimations for larger fields: A case study in the south-western Rostov region of Russia. Int. J. Appl. Earth Obs. Geoinf. 2008, 10, 453–466. [Google Scholar] [CrossRef]
  38. Otukei, J.R.; Blaschke, T. Land cover change assessment using decision trees, support vector machines and maximum likelihood classification algorithms. Int. J. Appl. Earth Obs. Geoinf. 2010, 12, S27–S31. [Google Scholar] [CrossRef]
  39. Hansen, M.C.; Loveland, T.R. A review of large area monitoring of land cover change using Landsat data. Remote Sens. Environ. 2012, 122, 66–74. [Google Scholar] [CrossRef]
  40. Ke, Y.; Im, J.; Park, S.; Gong, H. Downscaling of MODIS One Kilometer Evapotranspiration Using Landsat-8 Data and Machine Learning Approaches. Remote Sens. 2016, 8, 215–241. [Google Scholar] [CrossRef]
  41. Otukei, J.R.; Blaschke, T.; Collins, M. Fusion of TerraSAR-x and Landsat ETM+ data for protected area mapping in Uganda. Int. J. Appl. Earth Obs. Geoinf. 2015, 38, 99–104. [Google Scholar] [CrossRef]
  42. Wang, Q.; Tenhunen, J.; Dinh, N.Q.; Reichstein, M.; Vesala, T.; Keronen, P. Similarities in ground- and satellite-based NDVI time series and their relationship to physiological activity of a Scots pine forest in Finland. Remote Sens. Environ. 2004, 93, 225–237. [Google Scholar] [CrossRef]
  43. Wang, Q. Technical system design and construction of China’s HJ-1 satellites. Int. J. Digit. Earth 2012, 5, 202–216. [Google Scholar] [CrossRef]
  44. Sun, C.; Liu, Y.; Zhao, S.; Zhou, M.; Yang, Y.; Li, F. Classification mapping and species identification of salt marshes based on a short-time interval NDVI time-series from HJ-1 optical imagery. Int. J. Appl. Earth Obs. Geoinf. 2016, 45, 27–41. [Google Scholar] [CrossRef]
  45. Wang, Q.; Wu, C.; Li, Q.; Li, J. Chinese HJ-1A/B satellites and data characteristics. Sci. China Earth Sci. 2010, 53, 51–57. [Google Scholar] [CrossRef]
  46. Sobrino, J.A.; Jiménez-Muñoz, J.C.; Paolini, L. Land surface temperature retrieval from LANDSAT TM 5. Remote Sens. Environ. 2004, 90, 434–440. [Google Scholar] [CrossRef]
  47. Wang, Y.; Liu, Y.; Li, M.; Tan, L. The reconstruction of abnormal segments in HJ-1A/B NDVI time series using MODIS: A statistical method. Int. J. Remote Sens. 2014, 35, 7991–8007. [Google Scholar] [CrossRef]
  48. Allen, R.G.; Tasumi, M.; Trezza, R. Satellite-Based Energy Balance for Mapping Evapotranspiration with Internalized Calibration(METRIC)-Model. J. Irrig. Drain. Eng. 2007, 133, 380–394. [Google Scholar] [CrossRef]
  49. Brown, J.; Loveland, T.; Merchant, J.; Reed, B.; Ohlen, D. Using Multisource Data in Global Land Cover Characterization Concepts, Requirements and Methods. Photogramm. Eng. Remote Sens. 1993, 59, 977–987. [Google Scholar]
  50. Royo, C.; Aparicio, N.; Blanco, R.; Villegas, D. Leaf and green area development of durum wheat genotypes grown under Mediterranean conditions. Eur. J. Agron. 2004, 20, 419–430. [Google Scholar] [CrossRef]
  51. Sim, J.; Wright, C.C. The Kappa Statistic in Reliability Studies: Use, Interpretation, and Sample Size Requirements. Phys. Ther. 2005, 85, 257–268. [Google Scholar] [PubMed]
Figure 1. Location of the study area and sampling points in 2012 and verification points in 2014 and 2015.
Remotesensing 09 00855 g001
Figure 2. Land use map for the study area.
Remotesensing 09 00855 g002
Figure 3. Variations of major crop planting areas in the Hetao Irrigation District from 2009 to 2015.
Remotesensing 09 00855 g003
Figure 4. The asymmetric logistic curve and characteristic points.
Remotesensing 09 00855 g004
Figure 5. Average Normalized Difference Vegetation Index (NDVI) series of sampling points for maize and sunflower and logistic curve fitting results in 2012.
Remotesensing 09 00855 g005
Figure 6. Relationships between normalized NDVI characteristics and normalized phenological metrics selected for the identification of maize and sunflower ((a1c3) correspond to classifiers in Table 5).
Remotesensing 09 00855 g006
Figure 7. Performance of different classifiers for maize (a) and sunflower (b).
Remotesensing 09 00855 g007
Figure 8. Comparisons of total area of maize (a) and sunflower (b) from official statistics and identified maps.
Remotesensing 09 00855 g008
Figure 9. Crop maps of maize and sunflower from 2009 to 2015 (ag).
Remotesensing 09 00855 g009
Table 1. Field investigated maize and sunflower phenological metrics in 2012.
MaizeSunflower
Growing PeriodDateGrowing PeriodDate
Sowing-Jointing5.1–6.19Sowing-Seedling6.1–7.5
Jointing-Trumpet6.20–7.9Seedling-Emergence7.6–7.24
Trumpet-Heading7.10–7.29Emergence-Blooming7.25–8.6
Heading-Grouting7.30–8.19Blooming-Grouting8.7–8.27
Grouting-Harvest9.1–9.20Grouting-Harvest8.28–9.20
Table 2. ESUNλ of HJ-1A/1B (W·m–2 μm−1).
Image TypeBand 1Band 2Band 3Band 4
HJ-1ACCD11914.321825.421542.661073.83
CCD21929.811831.141549.821078.32
HJ-1BCCD11902.191833.631566.711077.09
CCD21922.901823.991553.201074.54
Table 3. Selected NDVI and phenological indexes.
No.NDVI CharacteristicsPhenological Metrics
1NDVI_max, maximum value of NDVIt_max, time corresponding to NDVI_max
2NDVI_inf, NDVI value of the left inflection point with maximum growth ratet_inf, time corresponding to NDVI_inf
3∆NDVI, difference between NDVI_max and NDVI_infFGP = t_max − t_inf, duration from the left inflection point to the peak point (Fast growth phase)
Table 4. Mean values of NDVI characteristics and phenological metrics from 2009 to 2015.
Land Use TypeIndexes2009201020112012201320142015
FarmlandNDVI_max0.4970.5050.4970.5190.5520.5920.573
NDVI_inf0.3470.3330.3370.3660.3900.4270.405
∆NDVI0.1500.1720.1590.1530.1620.1640.167
FGP39.2335.0032.9633.4731.4227.3632.88
GrasslandNDVI_max0.4720.4670.4530.4870.5080.5470.537
NDVI_inf0.3330.3120.3100.3450.3610.3980.387
∆NDVI0.1390.1530.1430.1430.1470.1490.150
FGP38.5434.5433.0132.4131.4627.5732.17
ForestNDVI_max0.4810.4760.4660.4960.5190.5540.542
NDVI_inf0.3390.3150.3200.3510.3680.4030.387
∆NDVI0.1420.1610.1460.1450.1510.1510.154
FGP38.7434.8232.4932.1831.3527.6132.65
Table 5. The name and details of nine phenology-based classifiers.
ClassifierNormalization WayNDVI IndexMaizeSunflower
FaFbFaFb
a1farmlandNDVI_max1.181.111.321.09
b1farmlandNDVI_inf1.111.111.051.04
c1farmland∆NDVI1.091.061.111.02
a2grasslandNDVI_max1.181.121.221.00
b2grasslandNDVI_inf1.141.021.041.02
c2grassland∆NDVI1.191.041.061.00
a3forestNDVI_max1.181.111.091.00
b3forestNDVI_inf1.181.111.001.00
c3forest∆NDVI1.221.111.041.00
Table 6. The confusion matrix of crop identification accuracy.
Identified ClassActual Class
MaizeSunflowerOthersTotalCorrectCommission
Maize23.63.63.630.97624
Sunflower9.136.43.649.17426
Others2.71.815.520.07723
Total35.541.822.7100.0Kappa = 0.62N = 110

