
Erosion Associated with Seismically-Induced Landslides in the Middle Longmen Shan Region, Eastern Tibetan Plateau, China

1
Key Laboratory of Active Tectonics and Volcano, Institute of Geology, China Earthquake Administration, Beijing 100029, China
2
State Key Laboratory of Earthquake Dynamics, Institute of Geology, China Earthquake Administration, Beijing 100029, China
*
Author to whom correspondence should be addressed.
Remote Sens. 2017, 9(8), 864; https://doi.org/10.3390/rs9080864
Submission received: 17 May 2017
/
Revised: 15 August 2017
/
Accepted: 18 August 2017
/
Published: 21 August 2017
(This article belongs to the Special Issue Remote Sensing of Landslides)
Abstract
:The 2008 Wenchuan earthquake and associated co-seismic landslide was the most recent expression of the rapid deformation and erosion occurring in the eastern Tibetan Plateau. The erosion associated with co-seismic landslides balances the long-term tectonic uplift in the topographic evolution of the region; however, the quantitative relationship between earthquakes, uplift, and erosion is still unknown. In order to quantitatively distinguish the seismically-induced erosion in the total erosion, here, we quantify the Wenchuan earthquake-induced erosion using the digital elevation model (DEM) differential method and previously-reported landslide volumes. Our results show that the seismically-induced erosion is comparable with the pre-earthquake short-term erosion. The seismically-induced erosion rate contributes ~50% of the total erosion rate, which suggests that the local topographic evolution of the middle Longmen Shan region may be closely related to tectonic events, such as the 2008 Wenchuan earthquake. We propose that seismically-induced erosion is a very important component of the total erosion, particularly in active orogenic regions. Our results demonstrate that the remote sensing technique of differential DEM provides a powerful tool for evaluating the volume of co-seismic landslides produced in intermountain regions by strong earthquakes.
1. Introduction
Landscape evolution in active orogenic areas is influenced by both climate-driven denudation and tectonic processes [1,2]. It is widely accepted that large dip-slip or oblique-slip earthquakes are responsible for building high mountains and plateau regions [3,4]. The subsequent effects of strong earthquakes are believed to be very important in shaping the resultant landscape [4,5]; however, the role of erosion associated with strong earthquakes has not been quantitatively studied. The quantitative study of the role of co-seismic landslides is vital to our understanding of the relationship between earthquakes, landslides, and erosion [6,7,8,9], as well as the landscape evolution in tectonically-active mountain belts. The 2008 Mw 7.9 Wenchuan earthquake triggered numerous landslides, and provided a rare opportunity to study the geomorphic response to a strong earthquake (Figure 1). Due to the limitation of available data in previous studies, landslide volumes have typically been derived from landslide areas using statistical equations [4,10,11,12,13]. Researchers also tried using the spaceborne interferometric synthetic aperture radar (InSAR) [14] and remote sensing and digital terrain model (DTM) data [15] to evaluate mass wasting volume, but only concentrated on the giant Daguangbao landslide. Parker et al. [4] suggested that the co-seismic landslide volume is much larger than the co-seismic uplift, thus challenging the role of strong earthquakes in mountain building. However, Li et al. [11] re-evaluated the co-seismic landslide volume based on the Monte Carlo distribution of lower and upper bounds by running random samplings of the scaling parameters 50,000 times, and showed that the total co-seismic landslide mass is comparable with the co-seismic uplift.
The evolution of continental relief is controlled by multiple factors, including tectonic forcing and erosion [2,19,20,21]. The role of erosion on the morphological evolution of plateau margins has been widely reported [22,23,24,25,26,27]; however, the co-seismically-induced erosion associated with strong earthquakes has rarely been quantitatively reported. Most geomorphological studies [20,22,24,28,29,30] have focused on long-term erosion at the million-year scale, and short-term erosion rates at the thousand-year to decade scale. These erosion rates represent a combination of climatic erosion and seismically-induced erosion. However, erosion associated with landslides and earthquakes is also one of the most important influences on topographical evolution [29]. Thus, it is essential to understand the impact of erosion associated with landslides and earthquakes on long-term average erosion rates. The seismically-induced erosion could be considered as the mass balance of a strong earthquake, by removing the landslide materials [31]. A hypothetical erosion variation model which shows the erosion variation pattern associated with strong earthquakes was proposed by Ouimet [29]. In this model, the main variation in erosion rate is represented as a rapid increase in erosion rate associated with the occurrence of an earthquake, which then gradually returns to the pre-earthquake level during a seismic recurrence interval. A recent study by West et al. [32] suggests that the short-term and modern erosion rates obtained before the Wenchuan earthquake are likely to be underestimating the long-term erosion. Thus, quantitatively comparing the seismically-induced erosion and cosmogenic or modern hydrological erosion will enhance our understanding of the role of earthquakes in erosion and geomorphic evolution. Usually, in geomorphological studies, the erosion rates are a mixture of natural erosion including human influence, earthquakes, etc., because it is difficult for us to distinguish the sources of erodible materials. The occurrence of the 2008 Mw 7.9 Wenchuan earthquake provides us with a rare opportunity to quantitatively study the earthquake-induced erosions and distinguish it from the total erosion. Although previous studies have reported the distribution of erosion rates in the eastern Tibetan Plateau [22,24,28,30], there are no detailed data from within the middle Longmen Shan region. In this study, we quantitatively study how co-seismic landslides, particularly those associated with strong earthquakes such as the 2008 Mw 7.9 Wenchuan earthquake, contribute to the long-term erosion of active orogenic regions.
2. Tectonic Setting
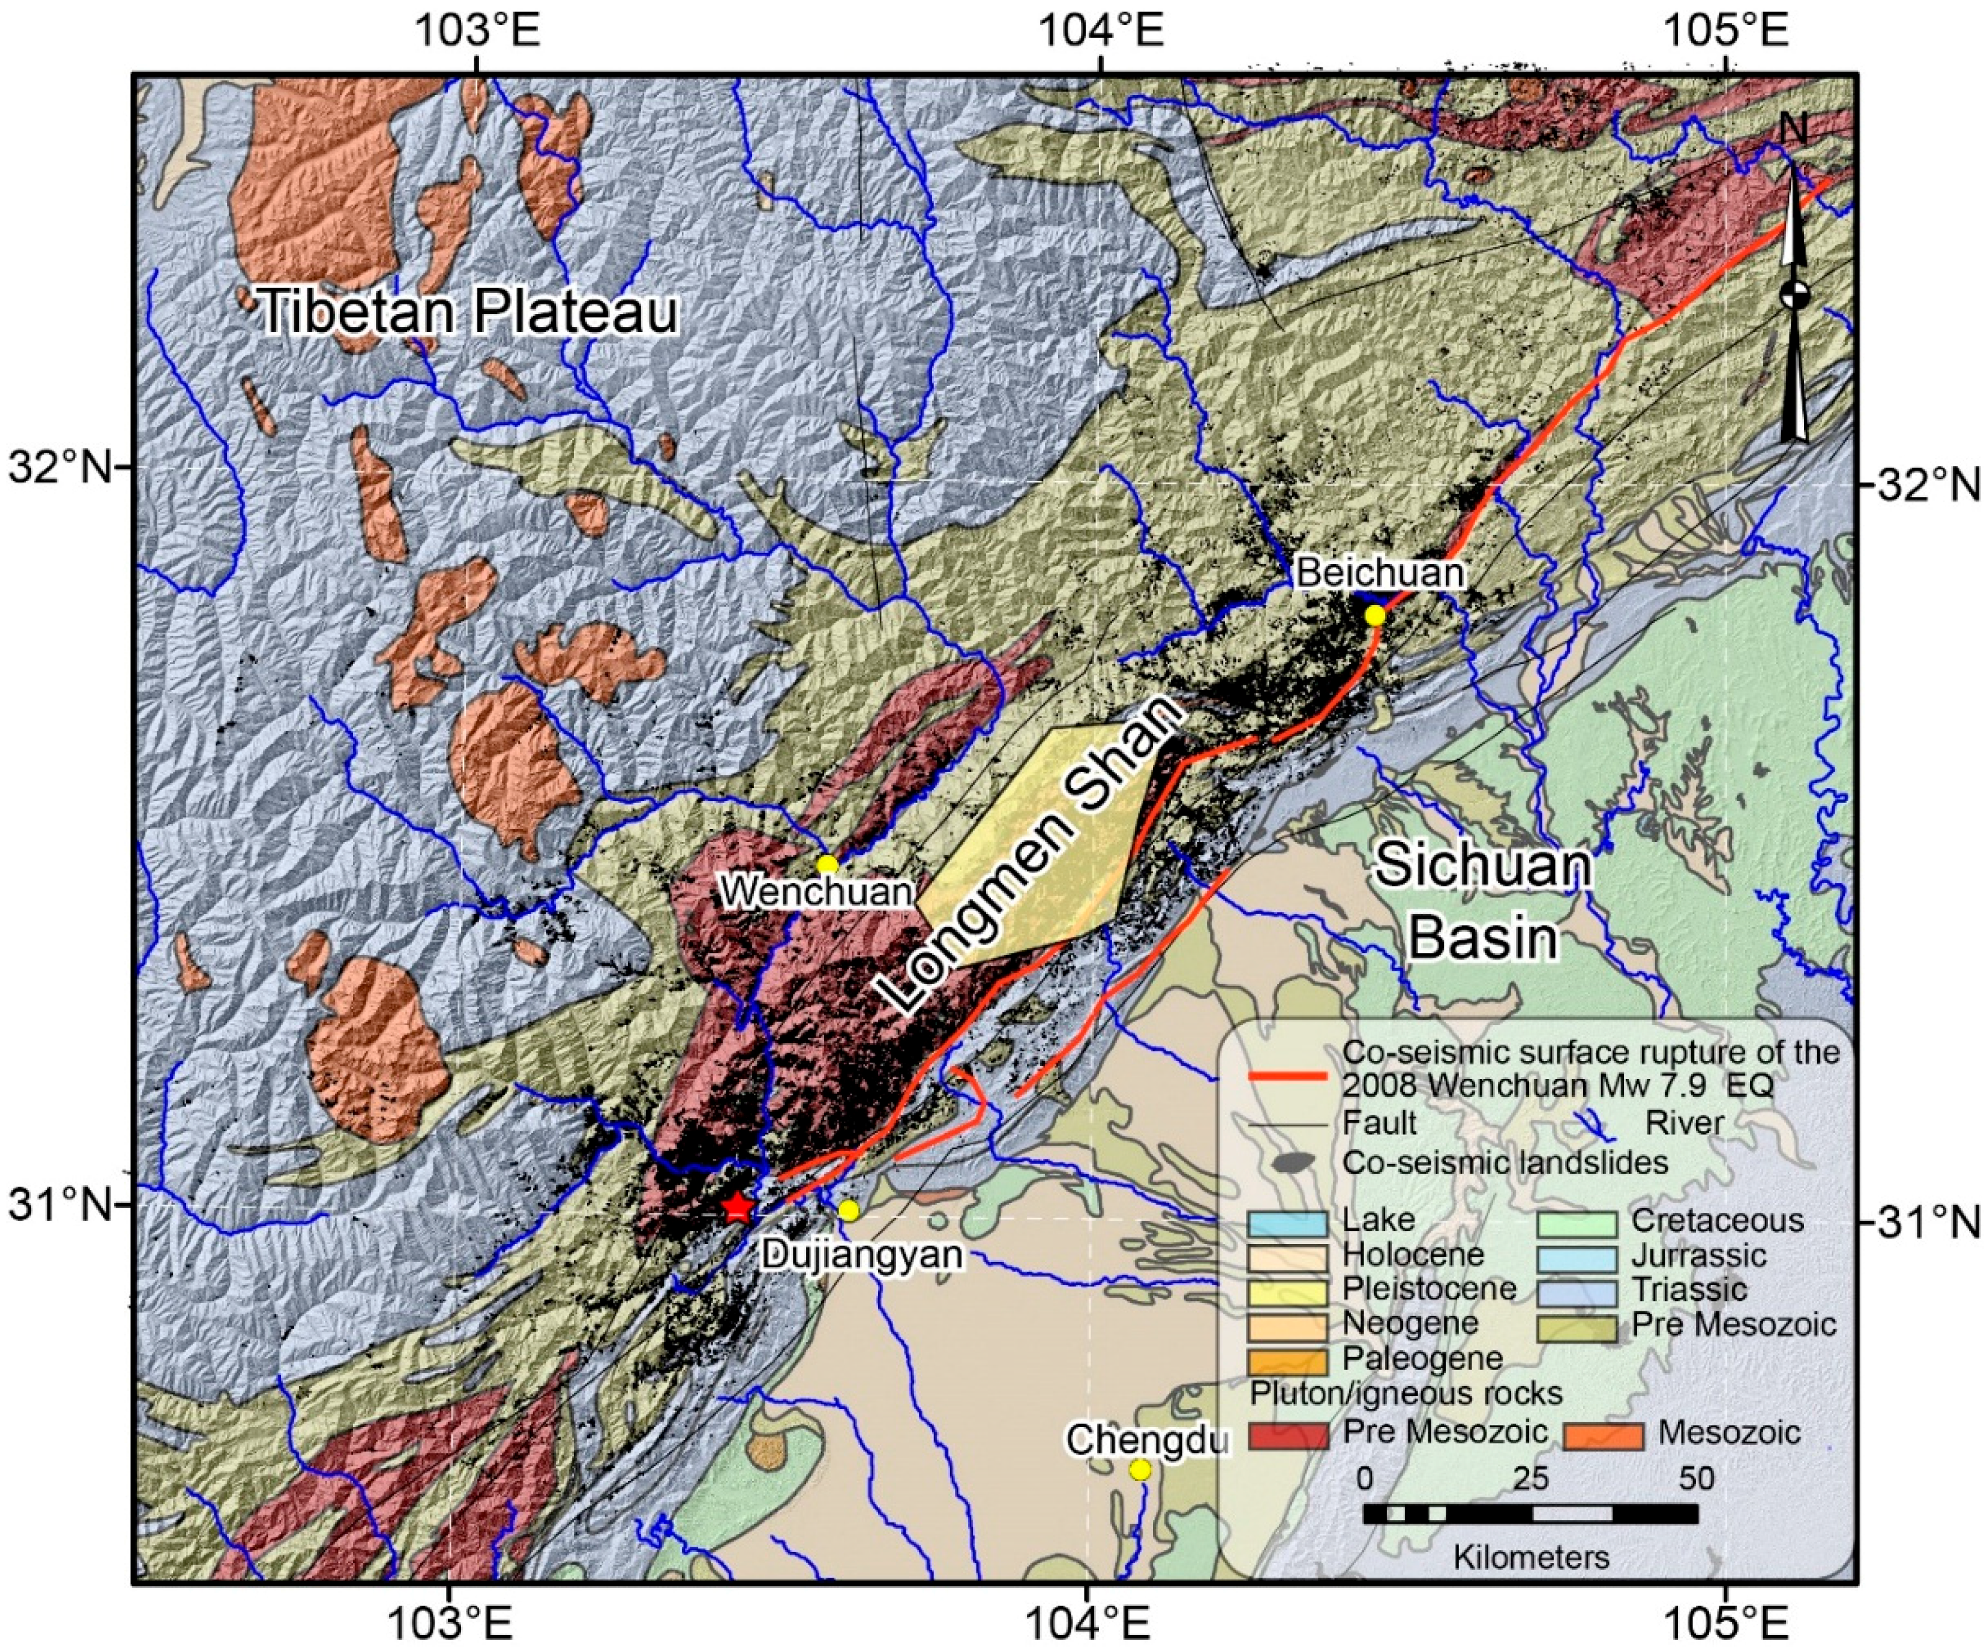
On the eastern margin of the Tibetan Plateau, the Longmen Shan orogenic belt trends NE–SW along the strike of the Longmen Shan Thrust Belt, which marks one of the steepest topographic margins of the plateau. Long-term convergence within the active Longmen Shan region has produced a steep topographic relief of 5000 m within the 50 km distance from the lowland Sichuan Basin to the inter-plateau region (Figure 1; [33,34,35]). The Longmen Shan Thrust Belt consists of three major fault systems: the Wenchuan-Maowen, Yingxiu-Beichuan, and Guanxian-Anxian fault systems [28,36,37,38]. There is a consensus that the Yingxiu-Beichuan and Guanxian-Anxian faults are the seismogenic faults associated with the 2008 Wenchuan earthquake [16,17,18]. Numerous co-seismic landslides were triggered due to the co-seismic deformation and strong ground motion along the rupture zone [4,11,25,39,40], influencing the local erosion rate as well as the topographic evolution.
The erosion rate increases after an earthquake, as the large amount of co-seismic landslide material associated with the earthquake is gradually transported out of the catchments by the rivers [4,7,8,10]. Recent studies reveal that the residence time of fine-grained sediment from co-seismic landslides associated with the Wenchuan earthquake ranges from one year to over a century [31]. Calculations based on 10Be mixing proportions suggest that river sediment fluxes in the 2–3 years following the Wenchuan earthquake increased by a similar order of magnitude in the 0.25–1 mm and the <0.25 mm size fractions, determined from 10Be quartz mixing calculations and hydrological gauging sand, respectively [32]. During the inter-seismic period, the erosion rate will then gradually return to the pre-earthquake level [29].
In this study, we use the pre- and post-earthquake digital elevation models (DEM) to derive the co-seismic landslide volume and to calculate the amount of seismically-induced erosion at one typical region within the Longmen Shan region [26]. We also compare the amount of erosion obtained from the differential DEM method with previous results of landslide volumes proposed by Li et al. [11].
3. Data and Methods
In this study, we estimated the seismically-induced erosion associated with landslides using the DEM differential method [26] and the landslide volume information from Li et al. [11].
Analysis of pre- and post-earthquake DEM data can be used to obtain elevation change information, which can then be used to detect co-seismic deformation [41]. Here, we use the DEM differential method [26] to calculate the minimum landslide volume within the landslide area by subtracting the pre-earthquake DEM from the post-earthquake DEM. In the middle Longmen Shan region, one typical site (near the Pengguan Massif) was selected to derive the pre- and post-earthquake DEM. There are no high-resolution DEMs available before the Wenchuan earthquake. The best pre-earthquake DEM has a resolution of 25 m and has been derived from digital 1:50,000 topographic maps, which were surveyed from stereo pairs of aerial photographs in the 1970s by the National Administration of Surveying, Mapping, and Geoinformation of China. By comparing the pre-earthquake DEM elevation with 14 continuous GPS observation sites, a mean elevation error of ±4.1 m, and a median error of ±3.6 m were determined [26]. In the error analysis, the median error is most appropriate in describing the level of elevation error [42] because the distribution of the elevation errors is not precisely known.
In this study, a 5-m resolution post-earthquake DEM was derived from 2.5-m resolution stereo pairs taken from Indian Remote Sensing Satellite P5 (IRS-P5) images (Table 1). The data were acquired three weeks after the 12 May Wenchuan earthquake in 2008, with almost no cloud [26,27]. In order to improve the quality of the post-earthquake DEM, we also applied a field ground control points (GCP) survey using Trimble R8 GPS for at least 15 min at each point (Figure 1), with a continuous reference station within a range of 50 km. The post-earthquake DEM data is derived using the ground control points and tie points between the Pan fore and Pan after imagery, by applying the rational polynomial coefficient (RPC) camera model [43]. The elevation error of the post-earthquake DEM is obtained by comparing the DEM with 12 field GPS observations spanning approximately ~15–30 min. The observation error of the GPS survey is less than several centimeters [44]. The mean elevation error is estimated to be ±1.5 m, and the median error is estimated to be ±1.2 m [26]. Thus, it is reasonable to estimate the minimum landslide volume (volume of large and deep-seated landslides) using the co-seismic elevation change [26]. In order to obtain a higher resolution and, thus, more reliable results, we first smoothed the post-earthquake DEM data to the same resolution of 25 m as pre-earthquake DEM. The co-seismic elevation change is derived by the subtraction of the pre- from the post-earthquake DEMs, and the minimum landslide volume is calculated by summing up the total volume change within the landslide area. Although our pre-earthquake DEM data is not of as high a resolution as the post-earthquake DEM data, it is possible to derive an estimate of the volume information of large and deep-seated landslides.
4. Results
4.1. Landslide Volume
All landslide volumes within the typical site in the middle Longmen Shan region [26] are derived from the elevation differences between the pre-and post-earthquake DEM; areas are confined using the landslide inventory of Dai et al. [40]. Negative and positive values represent the elevation change in landslide and deposition regions, respectively. The landslide volume is calculated by summing up the negative elevation change within the landslide area in each catchment, which is the minimum volume because the co-seismic deformation is also involved. However, the co-seismic deformation within the deep-seated landslide region is small when compared with the elevation change due to landslide activity. Thus, it is reasonable to use this data to estimate the average seismically-induced erosion rate because the deep landslides are the major contributor to landslide volume whose depth is much larger than the co-seismic uplift. The error represents the volume uncertainties due to the error of DEM data. Uncertainty in landslide volume leads to variability in the seismically-induced erosion, but the variability in seismically-induced erosion is generally less than 1/107 of the landslide volume. Additionally, the variability induced by uncertainty in the landslide volume has little influence on the spatial pattern of seismically-induced erosion. Since we study the spatial distribution of the seismically-induced erosion, the degree of uncertainty in landslide volumes will not alter the spatial distribution of the seismically-induced erosion.
To reveal the details of seismically-induced erosion within the middle Longmen Shan region, we derived small catchments to analyze the detailed distribution features of the seismically-induced erosion within the study area. The landslide volumes within each catchment are derived from the landslide distribution and volume information from Li et al. [11], and then summed up within each catchment.
4.2. Erosion Rate
The average erosion depth is calculated by dividing the summed landslide volume by the corresponding catchment area. A recent study by Wang et al. [31] suggests that the fine-grained sediment from co-seismic landslides associated with the Wenchuan earthquake will be transported out of the Longmen Shan region within timescales ranging from one year to over a century. Although we do not know the precise timescale required for the landslide material to be totally removed from the catchment area, the summed seismically-induced erosion rate ‘e’ can be assumed to be equal to V/R (Figure 2), where ‘R’ is the recurrence interval of a Wenchuan-like earthquake, and ‘V’ is the volume of the landslide material. Thus, if the landslide material is transported out of the catchment within a single recurrence interval of ‘R’, then the seismically-induced erosion rate will be e = V/R. If the removal of the landslide material takes several recurrence intervals, nR, then after each earthquake, there will be a seismically-induced erosion rate of V/nR. However, during each recurrence interval, the summed seismically-induced erosion rate will also be V/R (Figure 2), hence, it is reasonable to assume the seismically-induced erosion rate to be V/R.
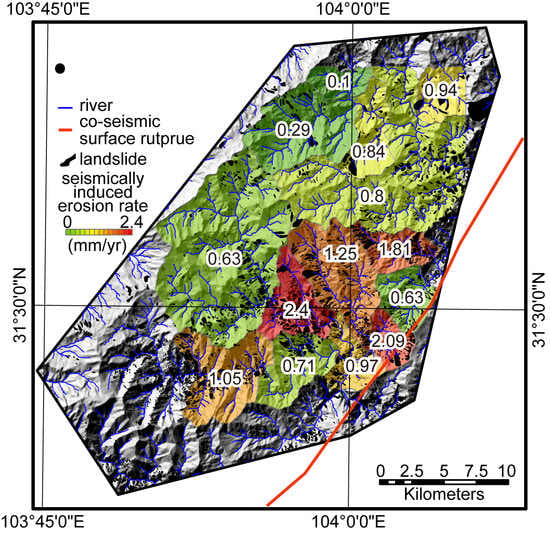
In this study, we used a recurrence interval of 2000–3000 years (much longer than the estimated residence time of fine-grained sediment), determined from Global Positining System (GPS) and paleoseismological data (Figure 3) [45,46,47]. The seismically-induced erosion rates (EMax and EMin) are calculated using the recurrence interval of 2000 and 3000 years, respectively. The mean seismically-induced erosion rate (Eave) is the mean value of EMax and EMin.
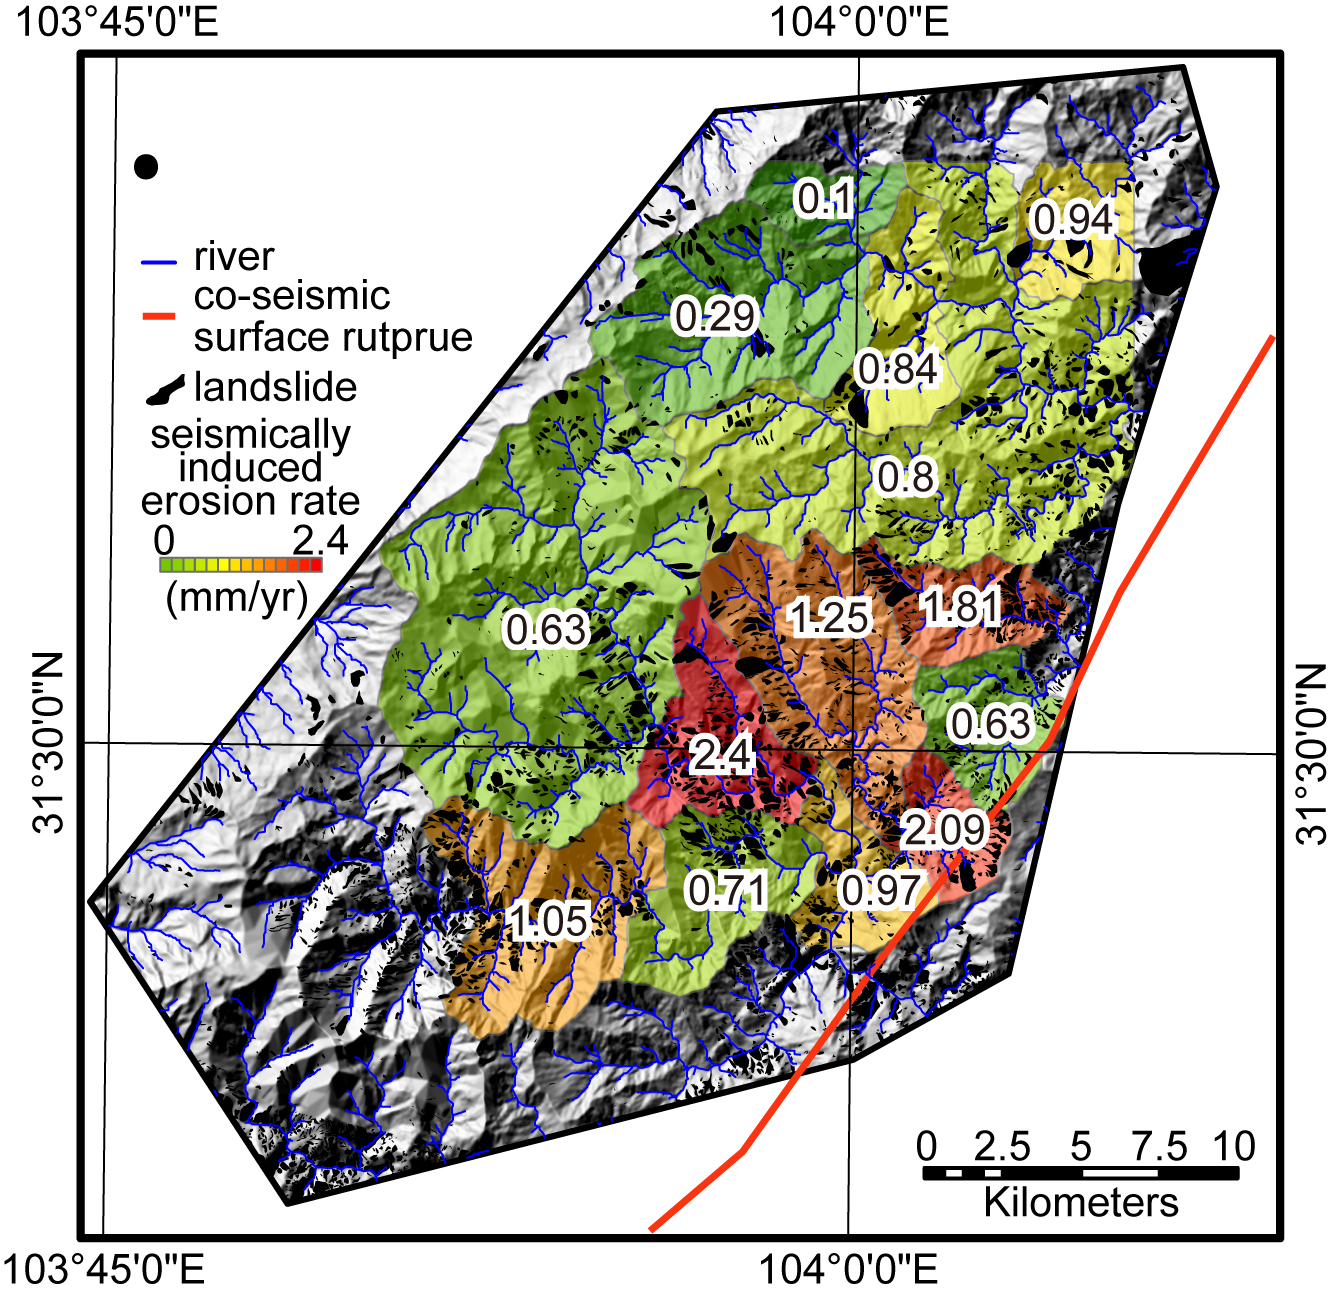
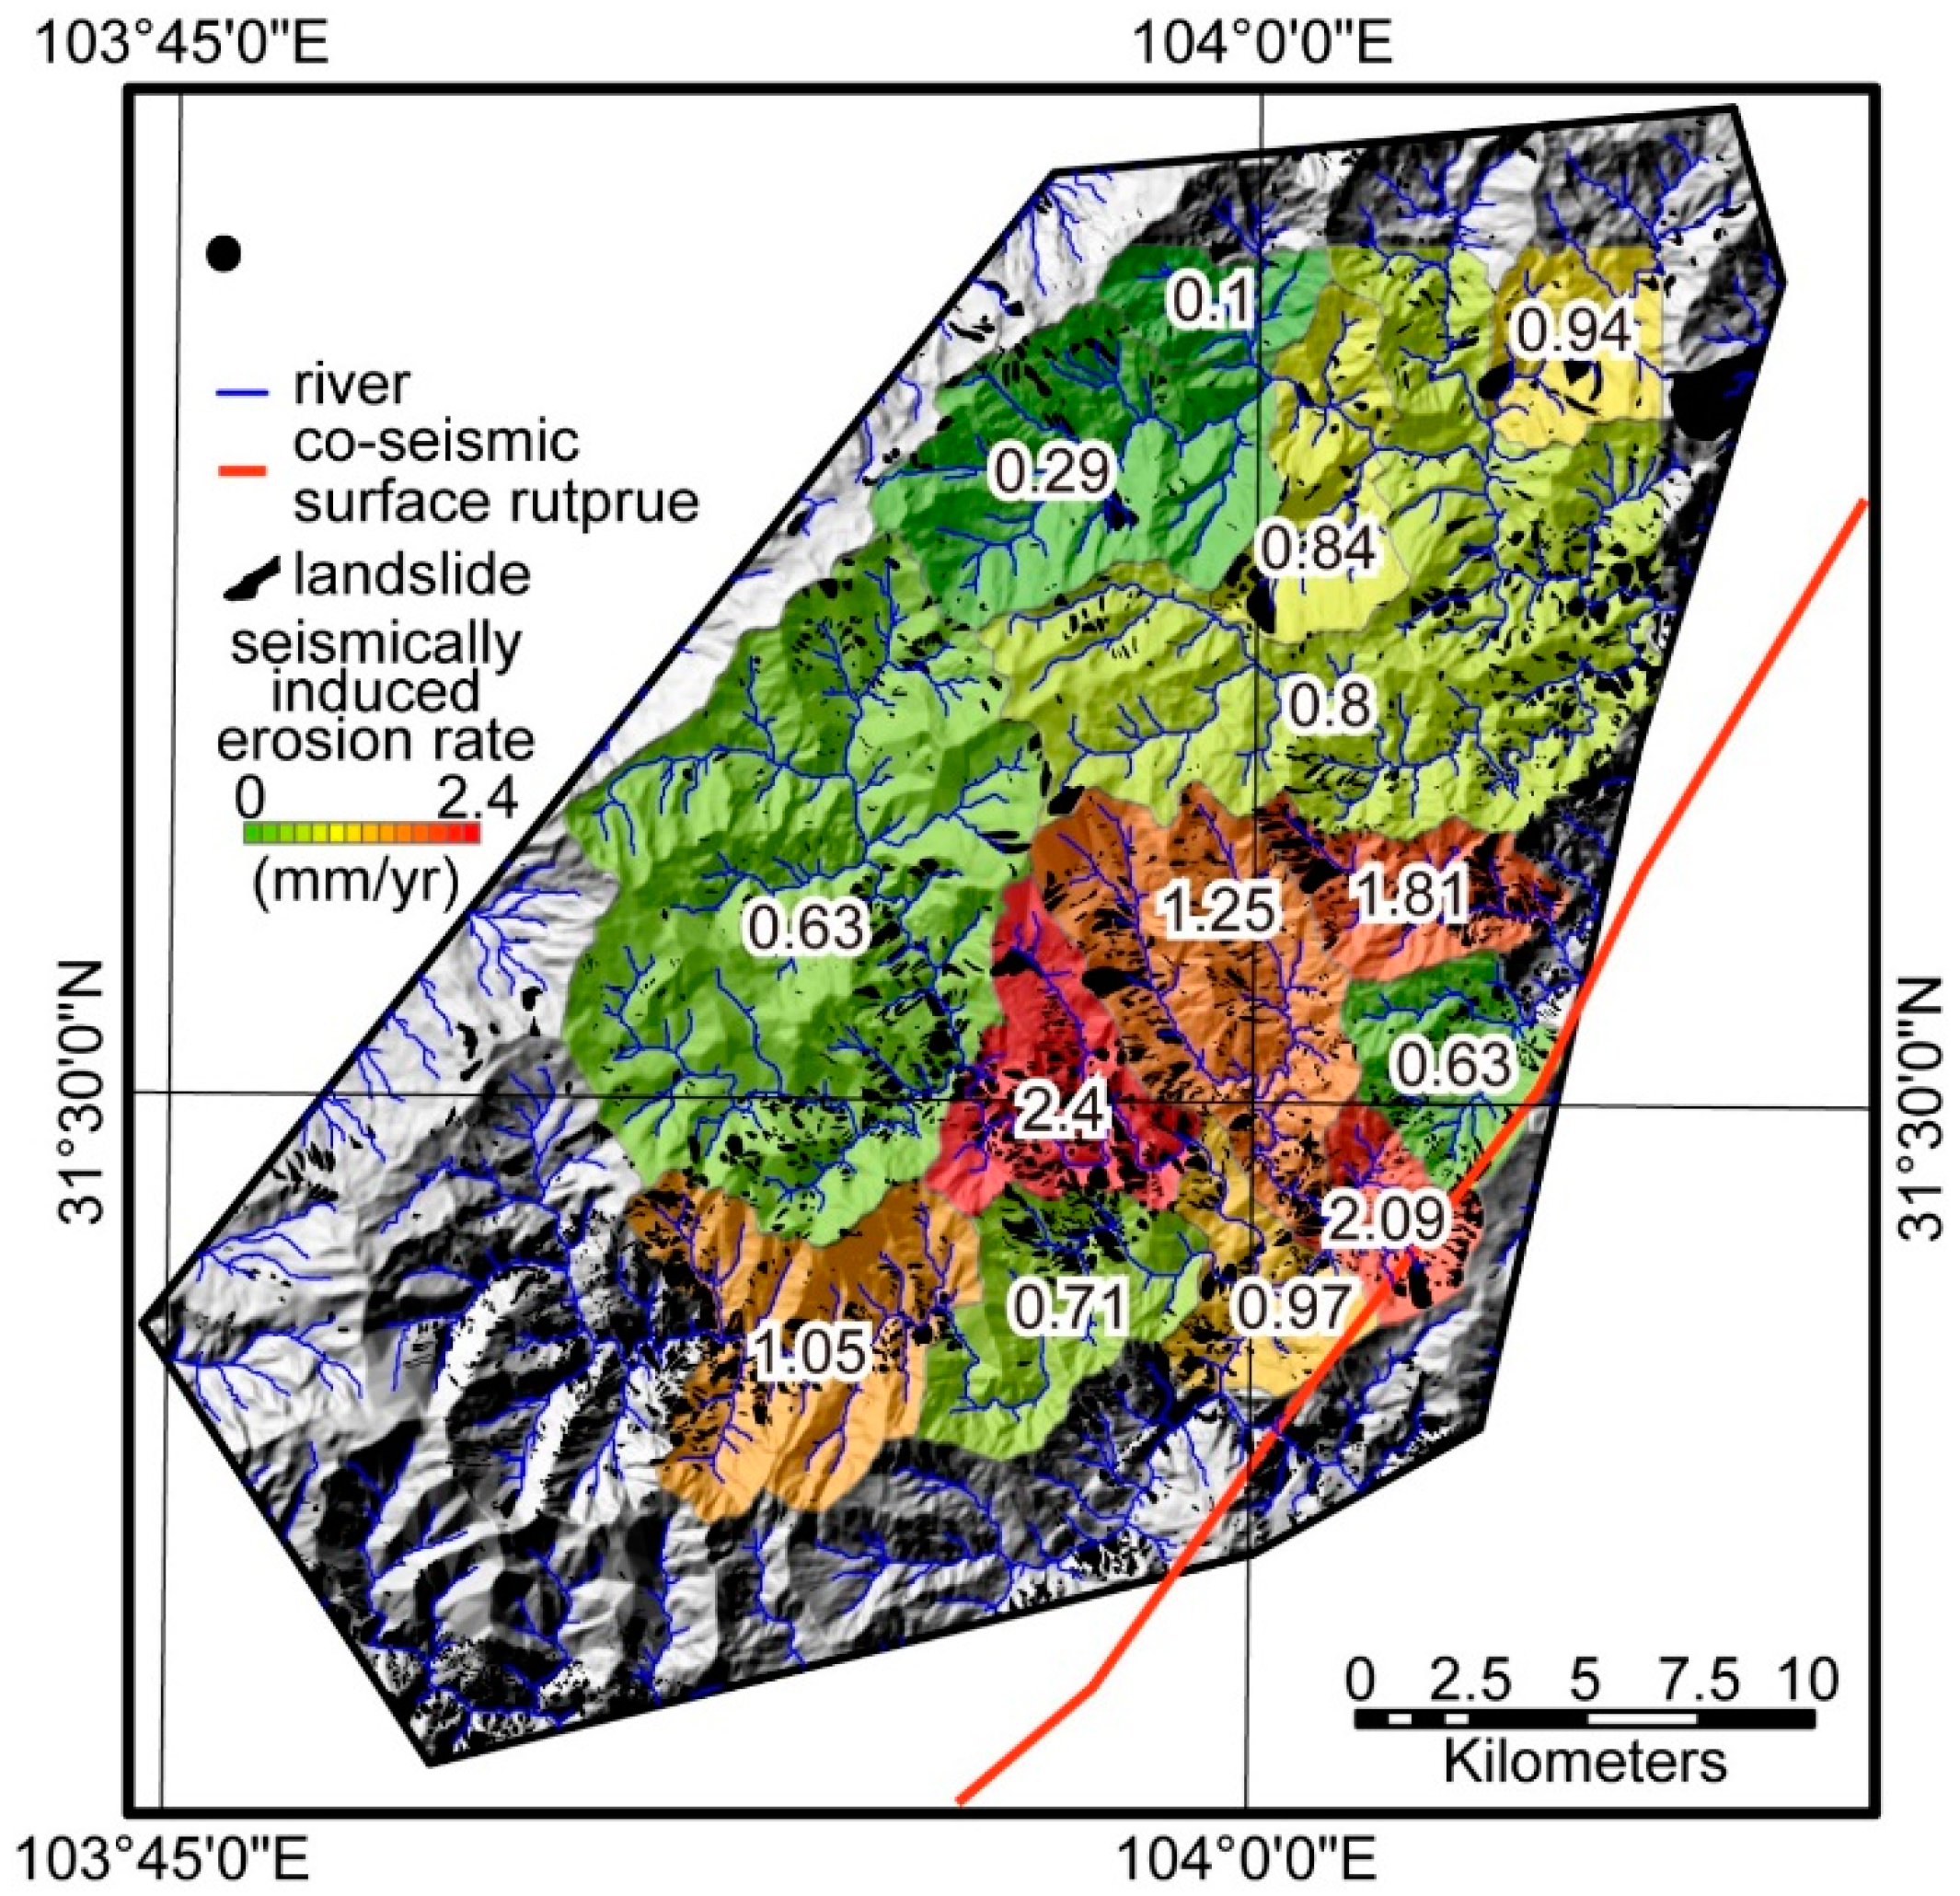
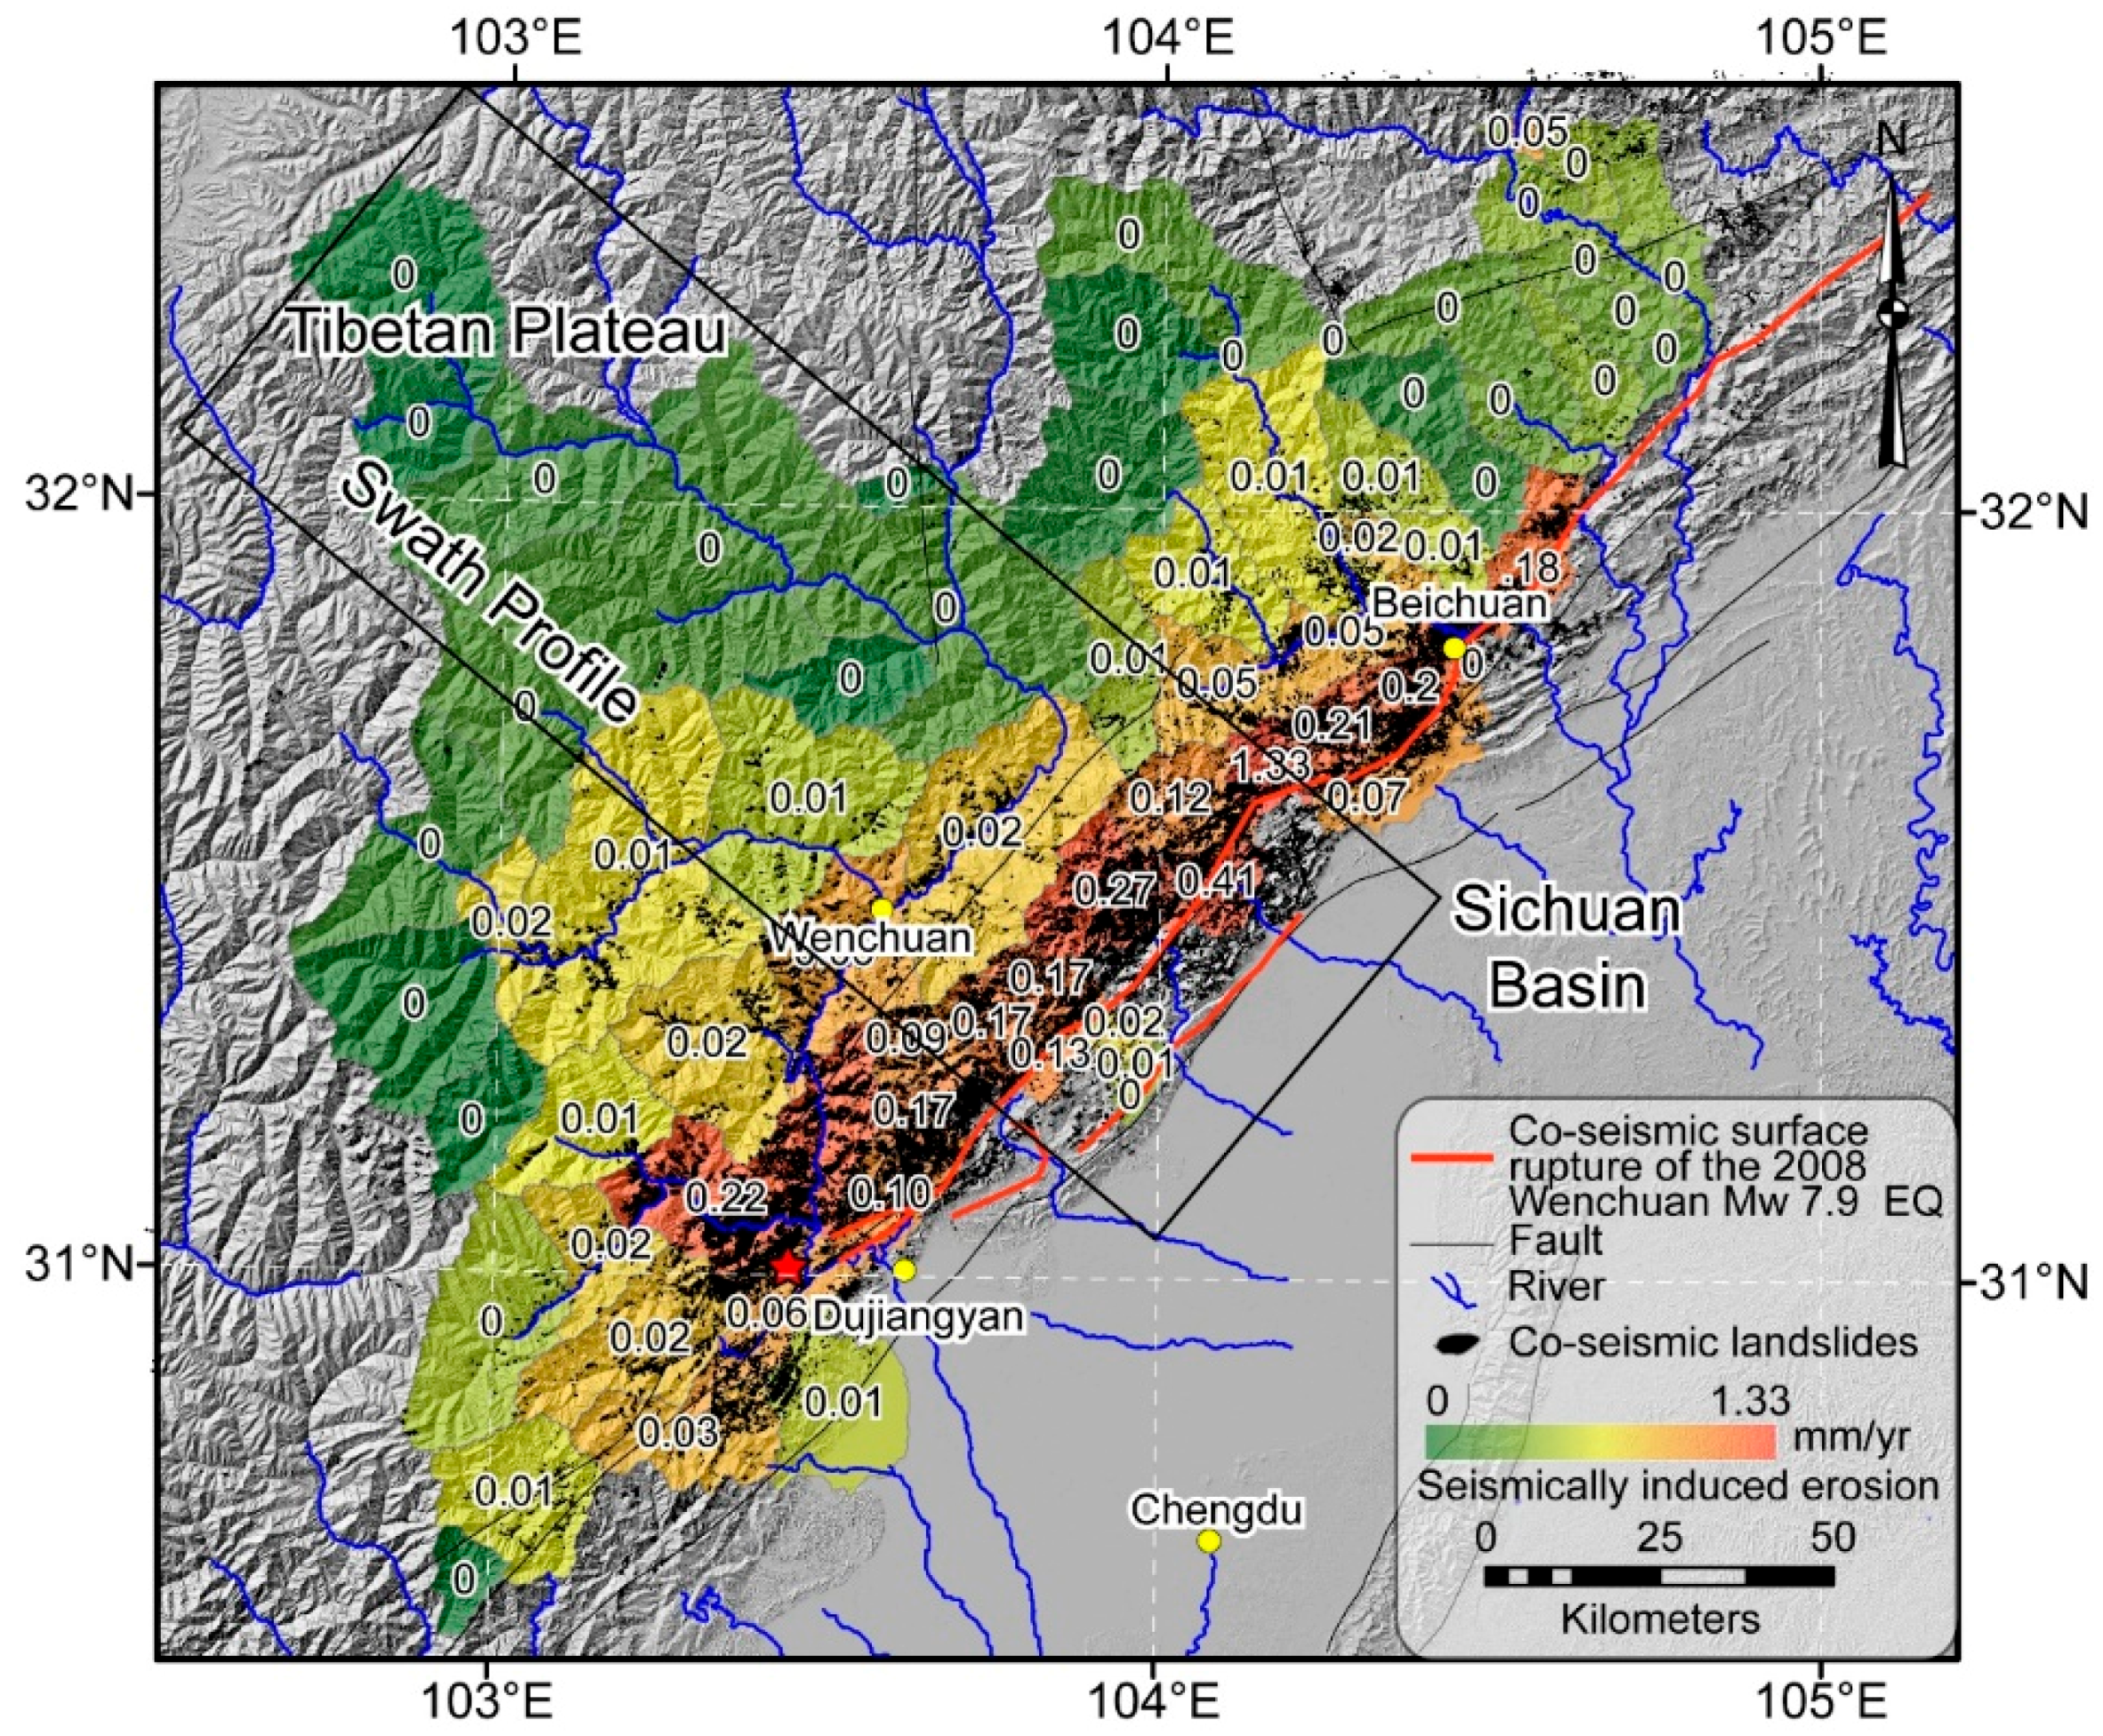
The average seismically-induced erosion rates within small catchments, calculated using the differential DEM method, range from 0.1–2.4 mm/year (Figure 3, Table 2). Within larger catchments, the average seismically-induced erosion rates are derived from landslide volumes of Li et al., and range from 0–1.3 mm/year (Figure 4, Table 3). The distribution of erosion rates within the small catchments reveals that the seismically-induced erosion rates are not homogeneous and that high erosion rates are mainly focused in a narrow corridor near the co-seismic surface rupture zone (Figure 3 and Figure 4). These high seismically-induced erosion rates are typically not included when calculating the short-term erosion rate. The long-term erosion rate is an averaged erosion rate, calculated by averaging all the landslide erosion within numerous recurrence intervals, and is therefore typically higher than the short-term erosion rate [22,32]. Our studies suggest that the average seismically-induced erosion within the Longmen Shan region is ~0.4 mm/year with a maximum value of ~1.3 mm/year (Figure 4). The average pre-earthquake erosion derived from hydrometric stations is ~0.5 mm/year [24], with a maximum value of ~1.0 mm/year, calculated from 10Be dating [22]. A simple comparison indicates that seismically-induced erosion contributes ~50% to the total erosion. The erosion distribution also indicates that the seismically-induced erosion is mainly focused in the Longmen Shan region, and that seismically-induced erosion within the Tibetan Plateau is almost zero.
5. Discussion
The correlation between the erosion rate and topography is central to our understanding of the controls on sediment flux, and of the feedback between tectonics, climate, and erosion in shaping topography [21,48]. In this study, we show the detailed distribution of seismically-induced erosion due to the 2008 Wenchuan earthquake and quantitatively analyze how it has influenced long-term erosion in the region.
In geomorphic studies, long-term erosion typically refers to erosion occurring over million-year timescales, and short-term erosion refers to erosion over timescales ranging from tens to thousands of years. Erosion rates at the thousand-year timescale typically represent non-seismically-induced erosion, and are derived using cosmogenic dating methods, such as 10Be and 26Al. In contrast, decadal erosion rates are derived from sediment load data recorded by hydrographic gauge stations, and may not include seismically-induced erosion. These data are collected prior to 2008, almost at the end of the inter-event time between the prior earthquake and the 2008 Wenchuan earthquake; hence, these erosion rates do not appear to be affected by the co-seismic landslides of both the 2008 Wenchuan and prior earthquakes. Meanwhile, for the purposes of geomorphic study, erosion data is usually collected so as to avoid or minimize the influence of landslides, particularly co-seismic landslides.
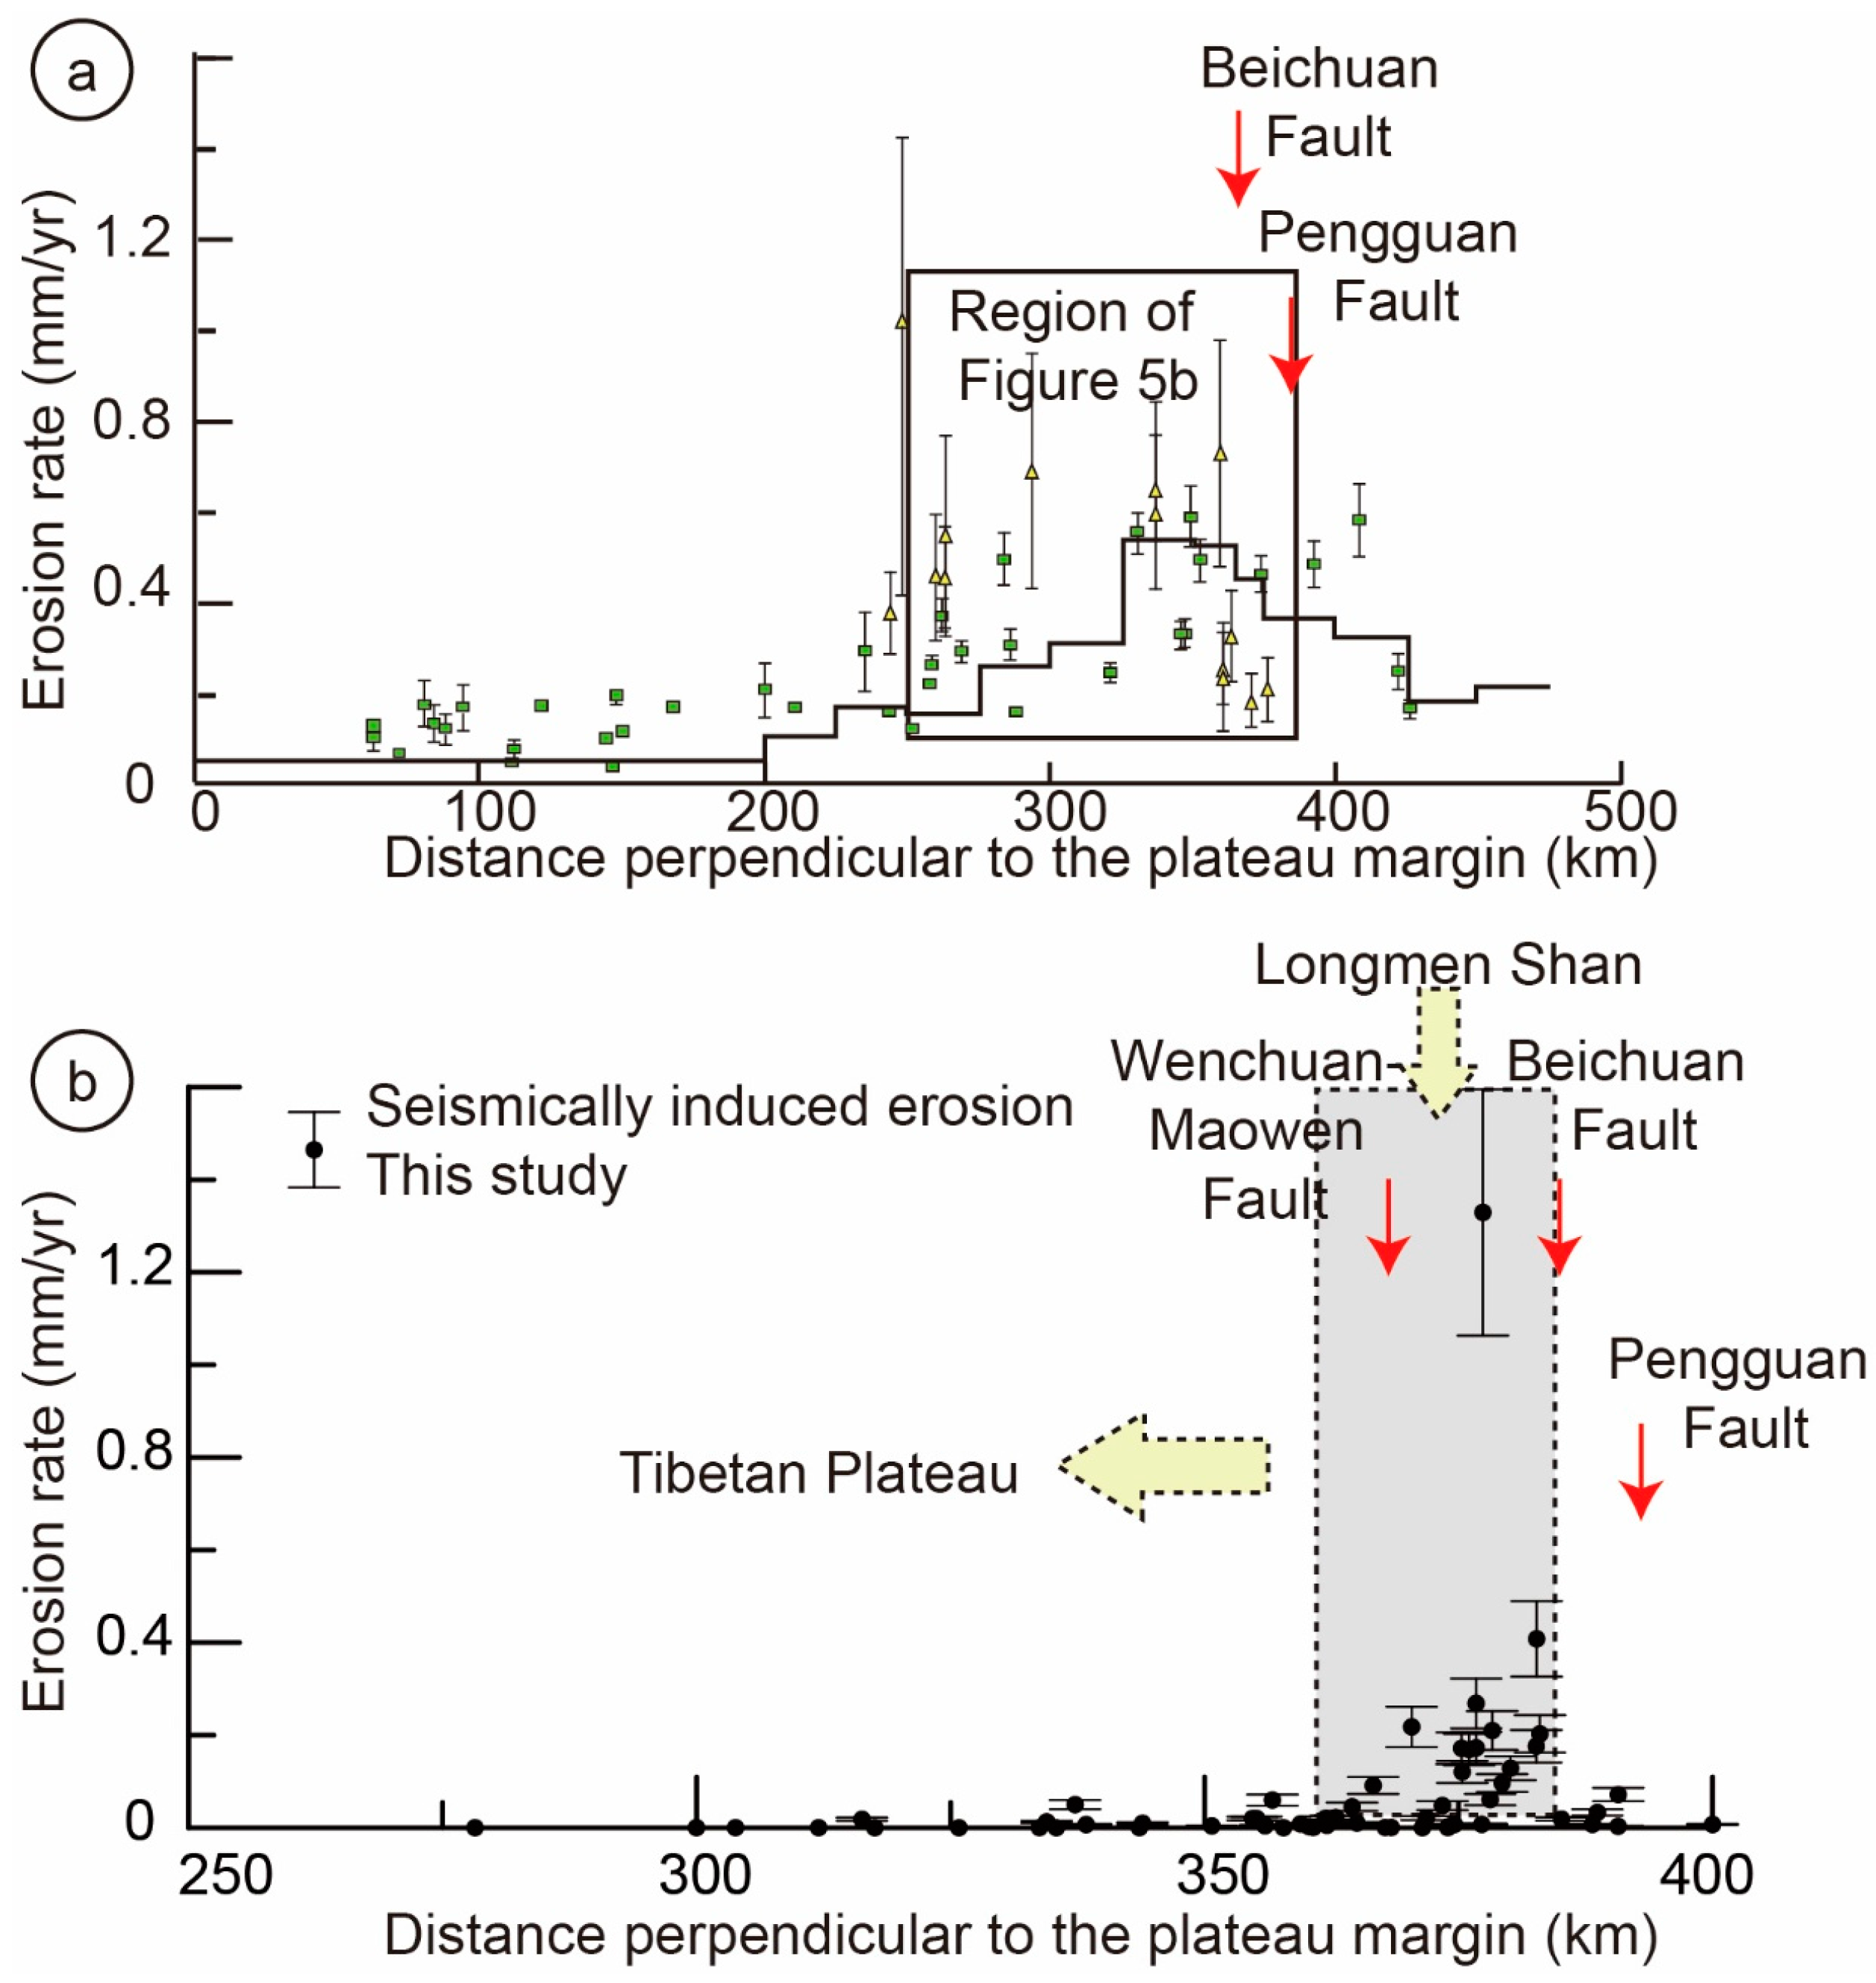
The results from a number of previous studies, utilizing a variety of data and techniques, suggest high erosion rates along the plateau margin: e.g., Kirby et al. [28] calculated long-term erosion rates using low-thermochronology dating, Godard et al. [22] and Ouimet et al. [30] calculated short-term erosion rates using 10Be and 26Al dating, and Liu-Zeng et al. [24] calculated modern erosion from hydrological gauge data. Consequently, we can conclude that high erosion rates are primarily focused in a narrow strip (200 km in width) along the plateau margin and the region bounding the Longmen Shan Thrust Belt. High seismically-induced erosion rates are due to a high concentration of co-seismic landslides, thus, such high erosion rates will occur predominantly in the regions bounding the fault zone, especially the hanging wall near the co-seismic surface rupture. Our results reveal that the high seismically-induced erosion rates are further concentrated within a narrow corridor bounding the Longmen Shan (~50 km in width) within the previously-demonstrated high denudation zone (Figure 5). It is difficult for us to distinguish the sources of erodible materials, hence, we could only compare the erosion associated with co-seismic landslides and the total natural erosion. Our results reveal that the erosion associated with co-seismic landslides contributes ~50% to the total natural erosion rate within the middle Longmen Shan region.
Our results also reveal that the erosion rates distribution was additionally affected by the size of the catchment. The uncertainties of our study indicate that the variability in seismically-induced erosion is generally less than 1/107 of the landslide volume, which also has little influence on the spatial pattern of seismically-induced erosion. The highest seismically-induced erosion rate is ~2.4 mm/year (Figure 3), while the average erosion rate is ~0.7 mm/year, derived from catchments with an average area of ~30 km2 (Table 2). The highest erosion rate in the largest catchment covered by the high-resolution DEM data is ~0.41 mm/year (Figure 4, Table 3), derived from catchments with an average area of ~300 km2, which is 10 times larger than the catchment size used in the differential DEM method. Previously-reported erosion rates in the Longmen Shan region have been calculated using different methods and sizes of catchments. The erosion rates from Ouimet et al. [30] were derived from small catchments (several tens of km2) using cosmogenic dating; in contrast, the erosion rates of Liu-Zeng et al. [24] were derived from large catchments (hundreds to thousands of km2) using hydrological gauge data. The erosion rates from Kirby et al. [28] were roughly estimated using sparsely-distributed low-thermochronological dating results. Thus, when using these erosion rates, we need to consider the size of the catchment, as well as the method used to derive them. Erosion rates derived from larger catchments or regions could reveal large-scale features of regional evolution of the plateau margins [24,28], whereas erosion rates derived from smaller catchments, such as those in this study, may reveal smaller-scale detailed features of the topographic evolution within the Longmen Shan fault zone.
6. Conclusions
In order to quantitatively analyze the contribution from seismically-induced erosion to the topographic erosion in the Longmen Shan region, we have distinguished the seismically-induced erosion from the total erosion and quantitatively compared the seismically-induced erosion, short-term erosion, and long-term erosion rates. The results show that earthquake-triggered erosion has played an important role in shaping the landscape in the middle Longmen Shan region. The comparison indicates that the seismically-induced erosion contributes ~50% of the long-term erosion, which is comparable with the shorter-term erosion (Figure 5). If the seismically-induced erosion could account for ~50% of the long-term erosion, then the topographic evolution in the Longmen Shan region should be closely related to repeated tectonic events, such as the 2008 Wenchuan earthquake. Thus, in tectonically-active mountain ranges, erosion associated with strong earthquakes will play a major role in controlling the landscape evolution.
Based on a comparison of the pre- and post-Wenchuan earthquake topography, previous study also demonstrated that the slope and roughness are closely related to large tectonic events, such as the Wenchuan earthquake [26]. Thus, in conclusion, the role of seismically-induced erosion cannot be ignored in geomorphic studies, particularly in active orogenic regions. Our results also demonstrate that differential DEM is a powerful remote sensing technique for the evaluation of the volume of co-seismic landslides produced in intermountain regions by strong earthquakes.
Acknowledgments
The authors thank Dr. Joshua West and Gen Li, for sharing their results on the co-seismic landslide volumes of the 2008 Wenchuan earthquake, and Dr. Victoria Martin for English revision and helpful suggestions. Thanks are also due to Professor Takashi Oguchi for hosting Zhikun Ren during his visit at the University of Tokyo. This work was funded by the National Natural Science Foundation of China (41472201, 41102136, 41304073), State Key Laboratory of Earthquake Dynamics (LED2014A03), China Scholarship Council (201404190019) awarded to Ren).
Author Contributions
Z. Ren contributed to conceiving the idea, prepared the figures, data compilation, and wrote the manuscript text. Z. Ren, Z. Zhang, and J. Yin discussed the contents of the manuscript.
Conflicts of Interest
Competing financial interests: The authors declare no competing financial interests.
References
- Avouac, J.P. Dynamic processes in extensional and compressional settings-mountain building. In Treatise on Geophysics; Watts, A.B., Ed.; Elsevier: Amsterdam, The Netherlands, 2008; Volume 6, pp. 377–439. [Google Scholar]
- Burbank, D.W.; Anderson, R.S. Tectonic Geomorphology; Blackwell Science: Cambridge, MA, USA, 2012; p. 454. [Google Scholar]
- Hovius, N.; Meunier, P.; Lin, C.-W.; Chen, H.; Chen, Y.-G.; Dadson, S.; Horng, M.-J.; Lines, M. Prolonged seismically induced erosion and the mass balance of a large earthquake. Earth Planet. Sci. Lett. 2011, 304, 347–355. [Google Scholar] [CrossRef]
- Parker, R.N.; Densmore, A.L.; Rosser, N.J.; de Michele, M.; Li, Y.; Huang, R.; Whadcoat, S.; Petley, D.N. Mass wasting triggered by the 2008 wenchuan earthquake is greater than orogenic growth. Nat. Geosci. 2011, 4, 449–452. [Google Scholar] [CrossRef] [Green Version]
- Korup, O.; Densmore, A.L.; Schlunegger, F. The role of landslides in mountain range evolution. Geomorphology 2010, 120, 77–90. [Google Scholar] [CrossRef]
- Dadson, S.J.; Hovius, N.; Chen, H.; Dade, W.B.; Lin, J.-C.; Hsu, M.-L.; Lin, C.-W.; Horng, M.-J.; Chen, T.-C.; Milliman, J.; et al. Earthquake-triggered increase in sediment delivery from an active mountain belt. Geology 2004, 32, 733–736. [Google Scholar] [CrossRef]
- Keefer, D.K. The importance of earthquake-induced landslides to long-term slope erosion and slope-failure hazards in seismically active regions. Geomorphology 1994, 10, 265–284. [Google Scholar] [CrossRef]
- Malamud, B.D.; Turcotte, D.L.; Guzzetti, F.; Reichenbach, P. Landslides, earthquakes, and erosion. Earth Planet. Sci. Lett. 2004, 229, 45–59. [Google Scholar] [CrossRef]
- Meunier, P.; Hovius, N.; Haines, A.J. Regional patterns of earthquake-triggered landslides and their relation to ground motion. Geophys. Res. Lett. 2007, 34. [Google Scholar] [CrossRef]
- Larsen, I.J.; Montgomery, D.R.; Korup, O. Landslide erosion controlled by hillslope material. Nat. Geosci. 2010, 3, 247–251. [Google Scholar] [CrossRef]
- Li, G.; West, A.J.; Densmore, A.L.; Jin, Z.; Parker, R.N.; Hilton, R.G. Seismic mountain building: Landslides associated with the 2008 wenchuan earthquake in the context of a generalized model for earthquake volume balance. Geochem. Geophys. Geosyst. 2014, 15, 833–844. [Google Scholar] [CrossRef]
- Xu, C.; Xu, X.; Gorum, T.; van Westen, C.J.; Fan, X. Did the 2008 Wenchuan earthquake lead to a net volume loss? In Landslide Science for a Safer Geoenvironment: Volume 3: Targeted Landslides; Sassa, K., Canuti, P., Yin, Y., Eds.; Springer International Publishing: Cham, Switzerland, 2014; pp. 191–196. [Google Scholar]
- Xu, C.; Xu, X.; Shen, L.; Yao, Q.; Tan, X.; Kang, W.; Ma, S.; Wu, X.; Cai, J.; Gao, M.; et al. Optimized volume models of earthquake-triggered landslides. Sci. Rep. 2016, 6, 29797. [Google Scholar] [CrossRef] [PubMed]
- Chen, Q.; Cheng, H.; Yang, Y.; Liu, G.; Liu, L. Quantification of mass wasting volume associated with the giant landslide daguangbao induced by the 2008 Wenchuan earthquake from persistent scatterer insar. Remote Sens. Environ. 2014, 152, 125–135. [Google Scholar] [CrossRef]
- Chen, Z.; Zhang, B.; Han, Y.; Zuo, Z.; Zhang, X. Modeling accumulated volume of landslides using remote sensing and dtm data. Remote Sens. 2014, 6, 1514–1537. [Google Scholar] [CrossRef]
- Lin, A.; Ren, Z.; Jia, D.; Wu, X. Co-seismic thrusting rupture and slip distribution produced by the 2008 mw 7.9 wenchuan earthquake, china. Tectonophysics 2009, 471, 203–215. [Google Scholar] [CrossRef]
- Liu-Zeng, J.; Zhang, Z.; Wen, L.; Tapponnier, P.; Sun, J.; Xing, X.; Hu, G.; Xu, Q.; Zeng, L.; Ding, L.; et al. Co-seismic ruptures of the 12 may 2008, ms 8.0 wenchuan earthquake, sichuan: East–west crustal shortening on oblique, parallel thrusts along the eastern edge of tibet. Earth Planet. Sci. Lett. 2009, 286, 355–370. [Google Scholar] [CrossRef]
- Xu, X.; Wen, X.; Yu, G.; Chen, G.; Klinger, Y.; Hubbard, J.; Shaw, J. Coseismic reverse- and oblique-slip surface faulting generated by the 2008 Mw 7.9 wenchuan earthquake, China. Geology 2009, 37, 515–518. [Google Scholar] [CrossRef]
- Burbank, D.W.; Blythe, A.E.; Putkonen, J.; Pratt-Sitaula, B.; Gabet, E.; Oskin, M.; Barros, A.; Ojha, T.P. Decoupling of erosion and precipitation in the Himalayas. Nature 2003, 426, 652–655. [Google Scholar] [CrossRef] [PubMed]
- Godard, V.; Cattin, R.; Lavé, J. Erosional control on the dynamics of low-convergence rate continental plateau margins. Geophys. J. Int. 2009, 179, 763–777. [Google Scholar] [CrossRef]
- Montgomery, D.R.; Brandon, M.T. Topographic controls on erosion rates in tectonically active mountain ranges. Earth Planet. Sci. Lett. 2002, 201, 481–489. [Google Scholar] [CrossRef]
- Godard, V.; Lavé, J.; Carcaillet, J.; Cattin, R.; Bourlès, D.; Zhu, J. Spatial distribution of denudation in Eastern Tibet and regressive erosion of plateau margins. Tectonophysics 2010, 491, 253–274. [Google Scholar] [CrossRef]
- Kirby, E.; Ouimet, W. Tectonic geomorphology along the eastern margin of Tibet: Insights into the pattern and processes of active deformation adjacent to the Sichuan basin. Geol. Soc. Lond. Spec. Publ. 2011, 353, 165–188. [Google Scholar] [CrossRef]
- Liu-Zeng, J.; Wen, L.; Oskin, M.; Zeng, L. Focused modern denudation of the Longmen Shan margin, eastern Tibetan Plateau. Geochem. Geophys. Geosyst. 2012, 12. [Google Scholar] [CrossRef]
- Ren, Z.; Lin, A. Co-seismic landslides induced by the 2008 Wenchuan magnitude 8.0 earthquake, as revealed by alos prism and avnir2 imagery data. Int. J. Remote Sens. 2010, 31, 3479–3493. [Google Scholar] [CrossRef]
- Ren, Z.; Zhang, Z.; Dai, F.; Yin, J.; Zhang, H. Topographic changes due to the 2008 Mw 7.9 Wenchuan earthquake as revealed by the differential dem method. Geomorphology 2014, 217, 122–130. [Google Scholar] [CrossRef]
- Ren, Z.; Zhang, Z.; Yin, J.; Dai, F.; Zhang, H. Morphogenic uncertainties of the 2008 Wenchuan earthquake: Generating or reducing? J. Earth Sci. 2014, 25, 668–675. [Google Scholar] [CrossRef]
- Kirby, E.; Reiners, P.W.; Krol, M.A.; Whipple, K.X.; Hodges, K.V.; Farley, K.A.; Tang, W.; Chen, Z. Late cenozoic evolution of the eastern margin of the Tibetan Plateau: Inferences from 40ar/39ar and (u-th)/he thermochronology. Tectonics 2002, 21. [Google Scholar] [CrossRef]
- Ouimet, W.B. Landslides associated with the May 12, 2008 Wenchuan earthquake: Implications for the erosion and tectonic evolution of the Longmen Shan. Tectonophysics 2010, 491, 244–252. [Google Scholar] [CrossRef]
- Ouimet, W.B.; Whipple, K.X.; Granger, D.E. Beyond threshold hillslopes: Channel adjustment to base-level fall in tectonically active mountain ranges. Geology 2009, 37, 579–582. [Google Scholar] [CrossRef]
- Wang, J.; Jin, Z.; Hilton, R.G.; Zhang, F.; Densmore, A.L.; Li, G.; West, A.J. Controls on fluvial evacuation of sediment from earthquake-triggered landslides. Geology 2015, 43, 115–118. [Google Scholar] [CrossRef] [Green Version]
- West, A.J.; Hetzel, R.; Li, G.; Jin, Z.; Zhang, F.; Hilton, R.G.; Densmore, A.L. Dilution of 10Be in detrital quartz by earthquake-induced landslides: Implications for determining denudation rates and potential to provide insights into landslide sediment dynamics. Earth Planet. Sci. Lett. 2014, 396, 143–153. [Google Scholar] [CrossRef] [Green Version]
- Burchfiel, B.C.; Zhiliang, C.; Yupinc, L.; Royden, L.H. Tectonics of the Longmen Shan and adjacent regions, central China. Int. Geol. Rev. 1995, 37, 661–735. [Google Scholar] [CrossRef]
- Chen, S.F.; Wilson, C.J.L. Emplacement of the Longmen Shan thrust—Nappe belt along the eastern margin of the Tibetan Plateau. J. Struct. Geol. 1996, 18, 413–430. [Google Scholar] [CrossRef]
- Deng, Q.D.; Chen, S.F.; Zhao, X.L. Tectonics, seismicity and dynamics of Longmenshan Mountains and its adjacent regions. Seismol. Geol. 1994, 16, 14. [Google Scholar]
- Densmore, A.L.; Ellis, M.A.; Li, Y.; Zhou, R.; Hancock, G.S.; Richardson, N. Active tectonics of the Beichuan and Pengguan faults at the eastern margin of the Tibetan Plateau. Tectonics 2007, 26. [Google Scholar] [CrossRef] [Green Version]
- Jia, D.; Wei, G.; Chen, Z.; Li, B.; Zeng, Q.; Yang, G. Longmen Shan fold-thrust belt and its relation to the western Sichuan Basin in central China: New insights from hydrocarbon exploration. AAPG Bull. 2006, 90, 1425–1447. [Google Scholar] [CrossRef]
- Kirby, E.; Whipple, K.; Harkins, N. Topography reveals seismic hazard. Nat. Geosci. 2008, 1, 485–487. [Google Scholar] [CrossRef]
- Dai, F.C.; Tu, X.B.; Xu, C.; Gong, Q.M.; Yao, X. Rock avalanches triggered by oblique-thrusting during the 12 May 2008 Ms 8.0 Wenchuan earthquake, China. Geomorphology 2011, 132, 300–318. [Google Scholar] [CrossRef]
- Dai, F.C.; Xu, C.; Yao, X.; Xu, L.; Tu, X.B.; Gong, Q.M. Spatial distribution of landslides triggered by the 2008 Ms 8.0 Wenchuan earthquake, China. J. Asian Earth Sci. 2011, 40, 883–895. [Google Scholar] [CrossRef]
- Cowgill, E.; Bernardin, T.S.; Oskin, M.E.; Bowles, C.; Yıkılmaz, M.B.; Kreylos, O.; Elliott, A.J.; Bishop, S.; Gold, R.D.; Morelan, A.; et al. Interactive terrain visualization enables virtual field work during rapid scientific response to the 2010 Haiti earthquake. Geosphere 2012, 8, 787–804. [Google Scholar] [CrossRef]
- Bohm, G.; Zech, G. Introduction to Statistics and Data Analysis for Physicists; Deutsches Elekstrone-Synchrotron: Hamburg, Germany, 2010. [Google Scholar]
- Tao, C.V.; Hu, Y. A comprehensive study of the rational function model for photogrammetric processing. Anglais 2001, 67, 10. [Google Scholar]
- Gao, C.; Chen, A.; Chen, M.; Wang, X. Test and analysis for precision of gps precise point positioning. J. Chin. Inert. Technol. 2006, 14, 23–26. [Google Scholar]
- Ran, Y.-K.; Chen, W.-S.; Xu, X.-W.; Chen, L.-C.; Wang, H.; Yang, C.-C.; Dong, S.-P. Paleoseismic events and recurrence interval along the Beichuan–Yingxiu fault of longmenshan fault zone, Yingxiu, Sichuan, China. Tectonophysics 2014, 584, 81–90. [Google Scholar] [CrossRef]
- Shen, Z.-K.; Sun, J.; Zhang, P.; Wan, Y.; Wang, M.; Burgmann, R.; Zeng, Y.; Gan, W.; Liao, H.; Wang, Q. Slip maxima at fault junctions and rupturing of barriers during the 2008 Wenchuan earthquake. Nat. Geosci. 2009, 2, 718–724. [Google Scholar] [CrossRef]
- Zhang, P.; Wen, X.; Shen, Z.; Chen, J. Oblique, high-angle, listric-reverse faulting and associated development of strain: The Wenchuan earthquake of May 12, 2008, Sichuan, China. Annu. Rev. Earth Planet. Sci. 2010, 38, 353–382. [Google Scholar] [CrossRef]
- Whipple, K.X.; Kirby, E.; Brocklehurst, S.H. Geomorphic limits to climate-induced increases in topographic relief. Nature 1999, 401, 39–43. [Google Scholar] [CrossRef]
Figure 1.
Simplified geological structures of the Longmen Shan region. Thick red lines indicate the co-seismic surface ruptures of the 2008 Mw 7.9 Wenchuan earthquake [16,17,18]. The gray polygons indicate the landslide inventory (courtesy of Joshua West and Gen Li), and the yellow polygon indicates the area covered by the high-resolution DEM.

Figure 2.
Simplified comparison of erosion rates according to the residence time of the co-seismic landslide material.
Figure 2.
Simplified comparison of erosion rates according to the residence time of the co-seismic landslide material.
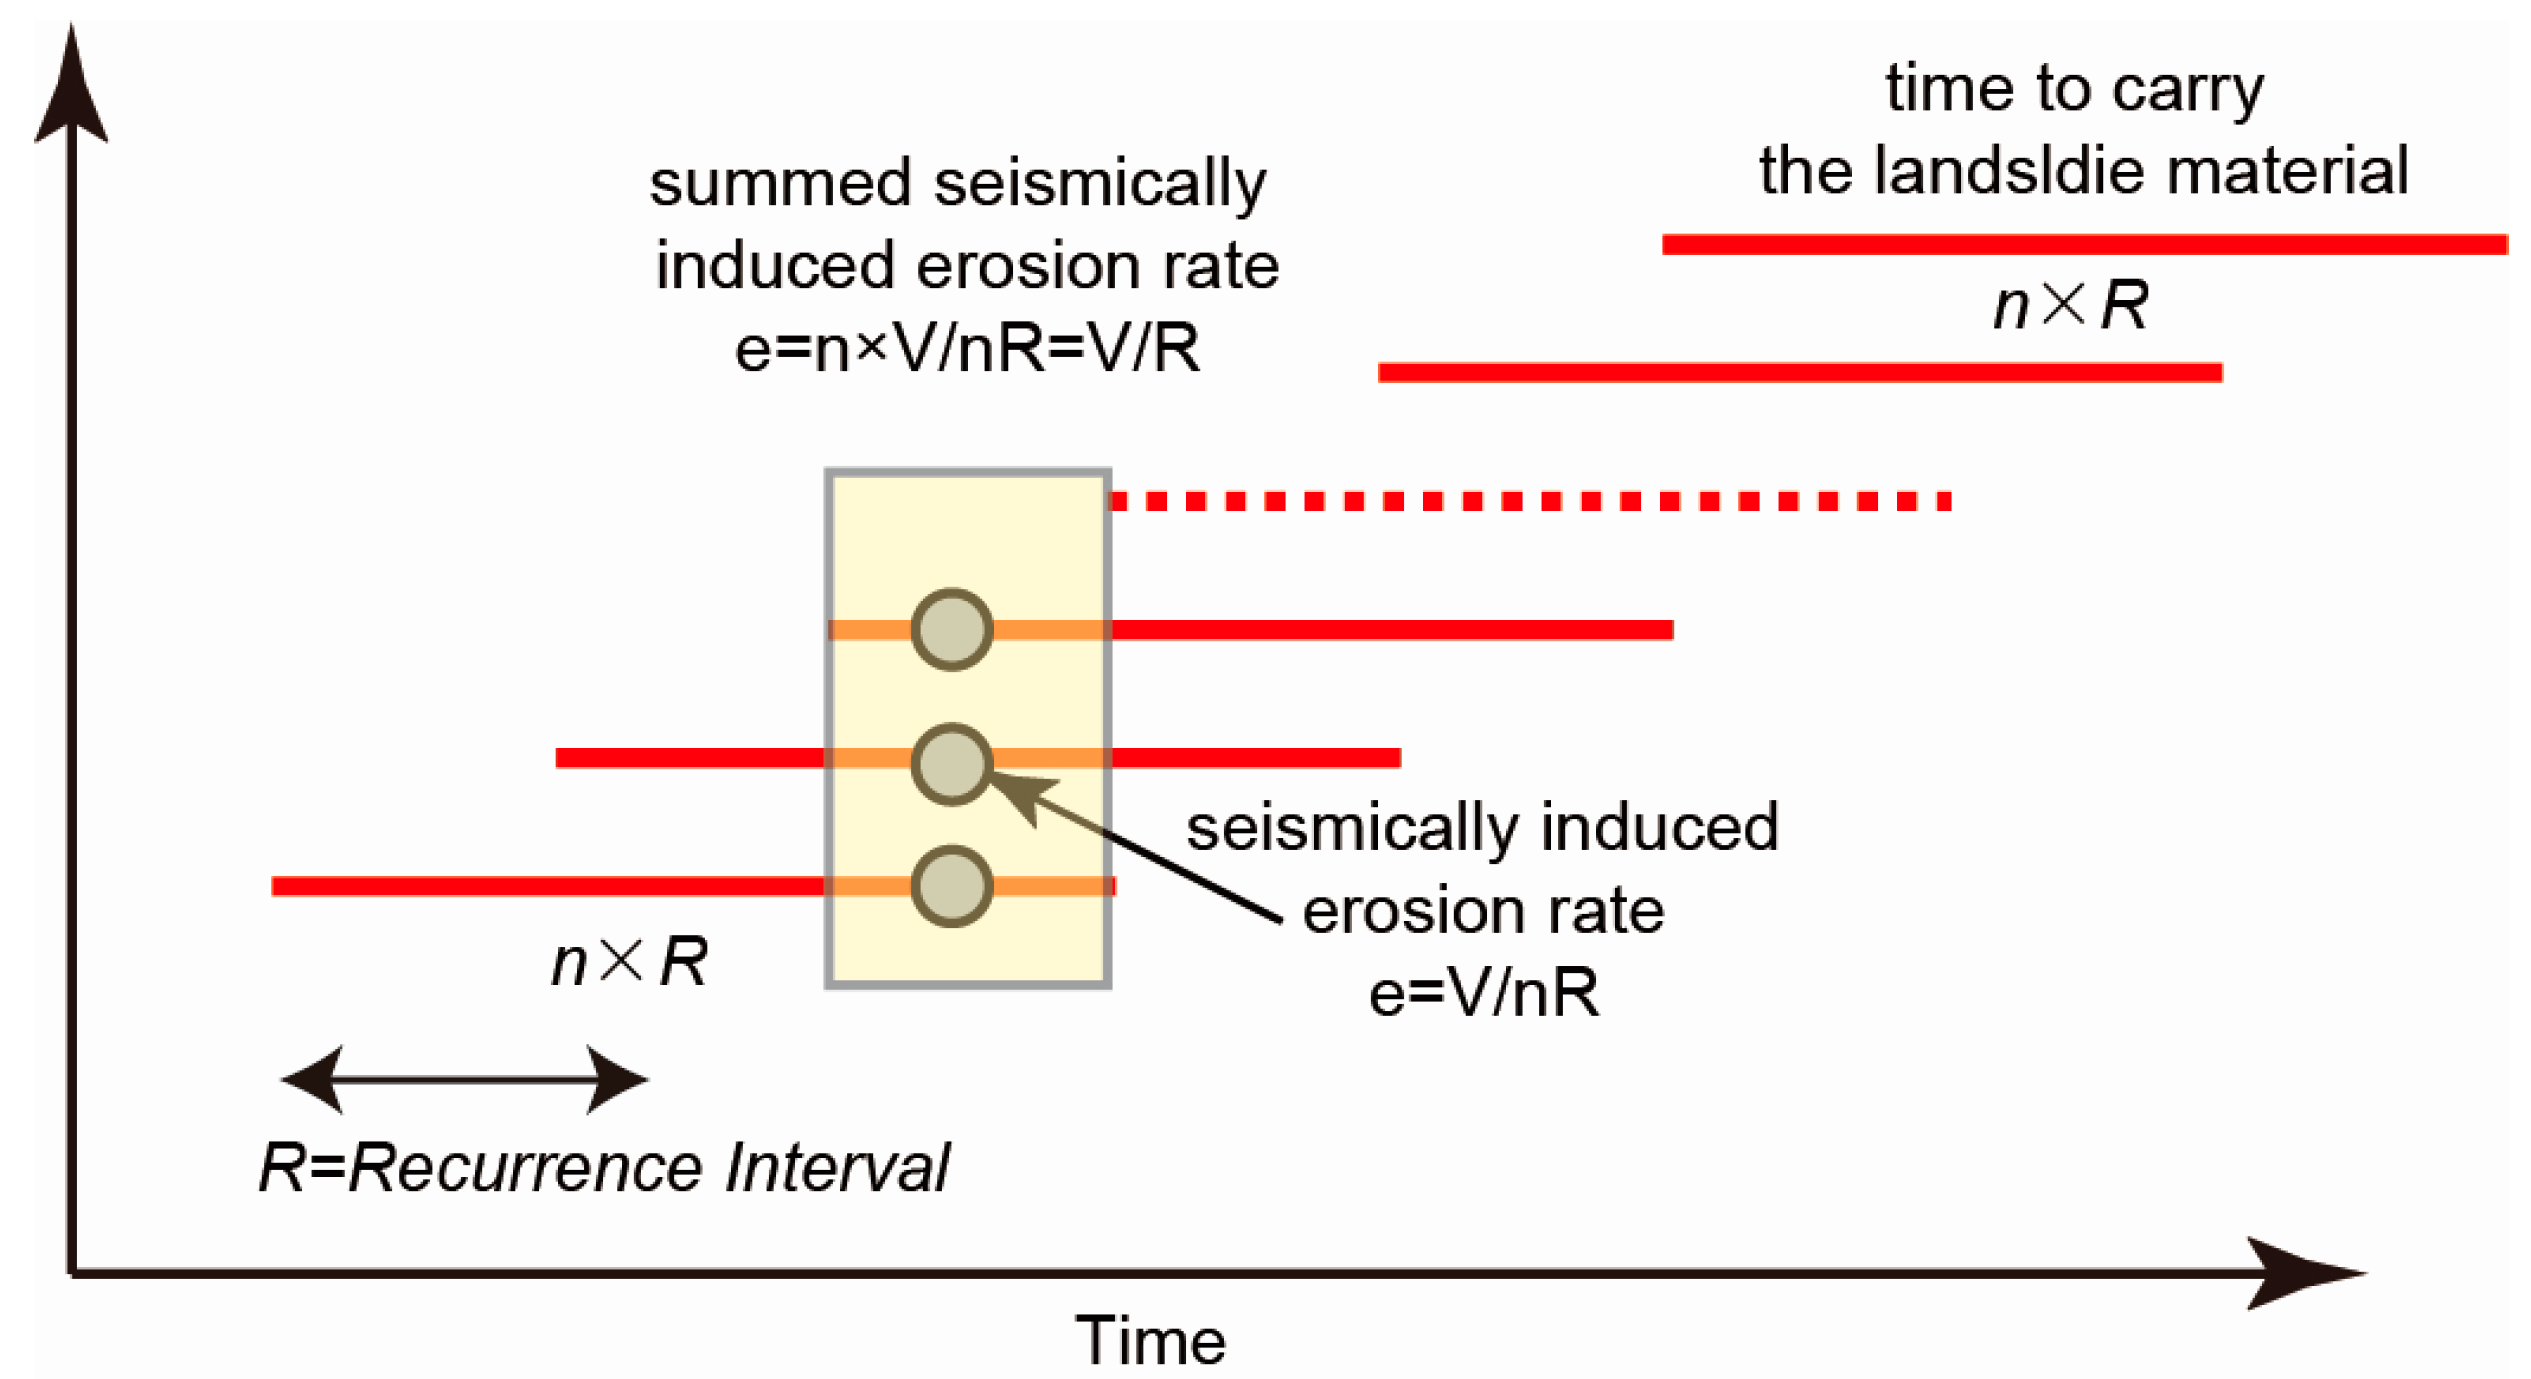
Figure 3.
The seismically-induced erosion rates derived using the differential DEM method shown within the area covered by the high-resolution DEM. Erosion rates are calculated within small catchments by summing up the landslide volume using the elevation difference.
Figure 3.
The seismically-induced erosion rates derived using the differential DEM method shown within the area covered by the high-resolution DEM. Erosion rates are calculated within small catchments by summing up the landslide volume using the elevation difference.

Figure 4.
The seismically-induced erosion rates within each catchment in the Longmen Shan region. Erosion rates are calculated using the summed landslide volumes within each catchment.
Figure 4.
The seismically-induced erosion rates within each catchment in the Longmen Shan region. Erosion rates are calculated using the summed landslide volumes within each catchment.

Figure 5.
(a) Distribution of short-term erosion rates from previous studies (modified from Reference [24]) and (b) seismically- induced erosion rates from this study.
Figure 5.
(a) Distribution of short-term erosion rates from previous studies (modified from Reference [24]) and (b) seismically- induced erosion rates from this study.


Table 1.
Stereo pairs IRS-P5 Imagery used in post-earthquake DEM derivation.
| No. | Path | Row | Date | Resolution (m) |
|---|---|---|---|---|
| 1 | 659 | 250 | 20080603 | 2.5 |
| 2 | 659 | 251 | 20080603 | |
| 3 | 659 | 252 | 20080603 | |
| 4 | 659 | 253 | 20080603 | |
| 5 | 659 | 254 | 20080603 |
Table 2.
Seismically-induced erosion rates calculated using the differential DEM method within each catchment shown in Figure 3.
Table 2.
Seismically-induced erosion rates calculated using the differential DEM method within each catchment shown in Figure 3.
| Catchment Area (1 × 10⁶ m2) | Sum Volume (1 × 10⁶ m3) | Average Erosion (m) | EMax (mm/year) | EMin (mm/year) | Eave (mm/year) | Eerror (mm/year) |
|---|---|---|---|---|---|---|
| 10.06 | 2.51 ± 0.11 | 0.25 | 0.12 | 0.08 | 0.1 | 0.02 |
| 15.03 | 33.97 ± 1.82 | 2.26 | 1.13 | 0.75 | 0.94 | 0.19 |
| 41.97 | 29.50 ± 2.84 | 0.71 | 0.35 | 0.23 | 0.29 | 0.06 |
| 19.62 | 39.21 ± 2.58 | 2.00 | 1.00 | 0.67 | 0.84 | 0.17 |
| 94.66 | 182.12 ± 1.17 | 1.92 | 0.96 | 0.64 | 0.8 | 0.16 |
| 15.98 | 69.31 ± 5.41 | 4.34 | 2.17 | 1.45 | 1.81 | 0.36 |
| 16.61 | 24.82 ± 2.30 | 1.49 | 0.75 | 0.50 | 0.63 | 0.13 |
| 23.12 | 133.00 ± 7.55 | 5.75 | 2.88 | 1.92 | 2.4 | 0.48 |
| 39.73 | 119.08 ± 7.76 | 3.00 | 1.50 | 1.00 | 1.25 | 0.25 |
| 109.11 | 163.27 ± 0.35 | 1.50 | 0.75 | 0.50 | 0.63 | 0.13 |
| 11.27 | 56.14 ± 3.07 | 4.98 | 2.50 | 1.67 | 2.09 | 0.42 |
| 15.15 | 35.08 ± 3.29 | 2.32 | 1.16 | 0.77 | 0.97 | 0.20 |
| 23.73 | 40.34 ± 3.33 | 1.70 | 0.85 | 0.57 | 0.71 | 0.14 |
| 37.46 | 94.62 ± 8.28 | 2.53 | 1.26 | 0.84 | 1.05 | 0.21 |
Emax means the maximum erosion rate, Emin means the minimums erosion rate, Eave means the average erosion rate and Eerror means the errors of the erosion rate.
Table 3.
Seismically-induced erosion rates derived from the landslide volume data of Li et al. [11] within each of the catchments shown in Figure 4.
| Catchment Area (1 × 10⁶ m2) | Sum Volume (1 × 10⁶ m3) | Average Erosion (m) | EMax (mm/year) | EMin (mm/year) | Eave (mm/year) | Eerror (mm/year) |
|---|---|---|---|---|---|---|
| 124.19 | 3.96 | 3.19 | 1.60 | 1.06 | 1.33 | 0.27 |
| 131.45 | 1.29 | 0.98 | 0.49 | 0.33 | 0.41 | 0.08 |
| 310.04 | 2.00 | 0.64 | 0.32 | 0.21 | 0.27 | 0.05 |
| 685.05 | 3.58 | 0.52 | 0.26 | 0.17 | 0.22 | 0.04 |
| 144.67 | 0.73 | 0.50 | 0.25 | 0.17 | 0.21 | 0.04 |
| 134.13 | 0.65 | 0.49 | 0.24 | 0.16 | 0.20 | 0.04 |
| 282.31 | 1.19 | 0.42 | 0.21 | 0.14 | 0.18 | 0.04 |
| 124.54 | 0.52 | 0.41 | 0.21 | 0.14 | 0.17 | 0.03 |
| 130.21 | 0.54 | 0.41 | 0.21 | 0.14 | 0.17 | 0.03 |
| 128.79 | 0.52 | 0.41 | 0.20 | 0.14 | 0.17 | 0.03 |
| 88.53 | 0.27 | 0.31 | 0.15 | 0.10 | 0.13 | 0.03 |
| 245.31 | 0.71 | 0.29 | 0.14 | 0.10 | 0.12 | 0.02 |
| 197.02 | 0.46 | 0.23 | 0.12 | 0.08 | 0.10 | 0.02 |
| 129.22 | 0.28 | 0.22 | 0.11 | 0.07 | 0.09 | 0.02 |
| 244.69 | 0.42 | 0.17 | 0.09 | 0.06 | 0.07 | 0.01 |
| 272.35 | 0.40 | 0.15 | 0.07 | 0.05 | 0.06 | 0.01 |
| 459.91 | 0.66 | 0.14 | 0.07 | 0.05 | 0.06 | 0.01 |
| 30.16 | 0.04 | 0.12 | 0.06 | 0.04 | 0.05 | 0.01 |
| 251.97 | 0.29 | 0.11 | 0.06 | 0.04 | 0.05 | 0.01 |
| 249.58 | 0.27 | 0.11 | 0.05 | 0.04 | 0.05 | 0.01 |
| 327.19 | 0.26 | 0.08 | 0.04 | 0.03 | 0.03 | 0.01 |
| 52.69 | 0.03 | 0.05 | 0.03 | 0.02 | 0.02 | 0.00 |
| 445.14 | 0.22 | 0.05 | 0.03 | 0.02 | 0.02 | 0.00 |
| 808.06 | 0.39 | 0.05 | 0.02 | 0.02 | 0.02 | 0.00 |
| 514.30 | 0.25 | 0.05 | 0.02 | 0.02 | 0.02 | 0.00 |
| 220.88 | 0.11 | 0.05 | 0.02 | 0.02 | 0.02 | 0.00 |
| 65.27 | 0.03 | 0.05 | 0.02 | 0.02 | 0.02 | 0.00 |
| 187.41 | 0.08 | 0.04 | 0.02 | 0.01 | 0.02 | 0.00 |
| 1063.00 | 0.33 | 0.03 | 0.02 | 0.01 | 0.01 | 0.00 |
| 613.53 | 0.15 | 0.02 | 0.01 | 0.01 | 0.01 | 0.00 |
| 346.56 | 0.08 | 0.02 | 0.01 | 0.01 | 0.01 | 0.00 |
| 332.62 | 0.07 | 0.02 | 0.01 | 0.01 | 0.01 | 0.00 |
| 394.67 | 0.07 | 0.02 | 0.01 | 0.01 | 0.01 | 0.00 |
| 18.42 | 0.00 | 0.02 | 0.01 | 0.01 | 0.01 | 0.00 |
| 129.69 | 0.02 | 0.02 | 0.01 | 0.01 | 0.01 | 0.00 |
| 394.32 | 0.07 | 0.02 | 0.01 | 0.01 | 0.01 | 0.00 |
| 692.51 | 0.11 | 0.02 | 0.01 | 0.01 | 0.01 | 0.00 |
| 212.18 | 0.03 | 0.01 | 0.01 | 0.00 | 0.01 | 0.00 |
© 2017 by the authors. Licensee MDPI, Basel, Switzerland. This article is an open access article distributed under the terms and conditions of the Creative Commons Attribution (CC BY) license (http://creativecommons.org/licenses/by/4.0/).
Share and Cite
MDPI and ACS Style
Ren, Z.; Zhang, Z.; Yin, J. Erosion Associated with Seismically-Induced Landslides in the Middle Longmen Shan Region, Eastern Tibetan Plateau, China. Remote Sens. 2017, 9, 864. https://0-doi-org.brum.beds.ac.uk/10.3390/rs9080864
AMA Style
Ren Z, Zhang Z, Yin J. Erosion Associated with Seismically-Induced Landslides in the Middle Longmen Shan Region, Eastern Tibetan Plateau, China. Remote Sensing. 2017; 9(8):864. https://0-doi-org.brum.beds.ac.uk/10.3390/rs9080864
Chicago/Turabian StyleRen, Zhikun, Zhuqi Zhang, and Jinhui Yin. 2017. "Erosion Associated with Seismically-Induced Landslides in the Middle Longmen Shan Region, Eastern Tibetan Plateau, China" Remote Sensing 9, no. 8: 864. https://0-doi-org.brum.beds.ac.uk/10.3390/rs9080864
Note that from the first issue of 2016, this journal uses article numbers instead of page numbers. See further details here.