Effects of an Aqueous Extract of Withania somnifera on Strength Training Adaptations and Recovery: The STAR Trial

 , and
, and
Abstract
:1. Introduction
2. Materials and Methods
2.1. Overview of the Study Design
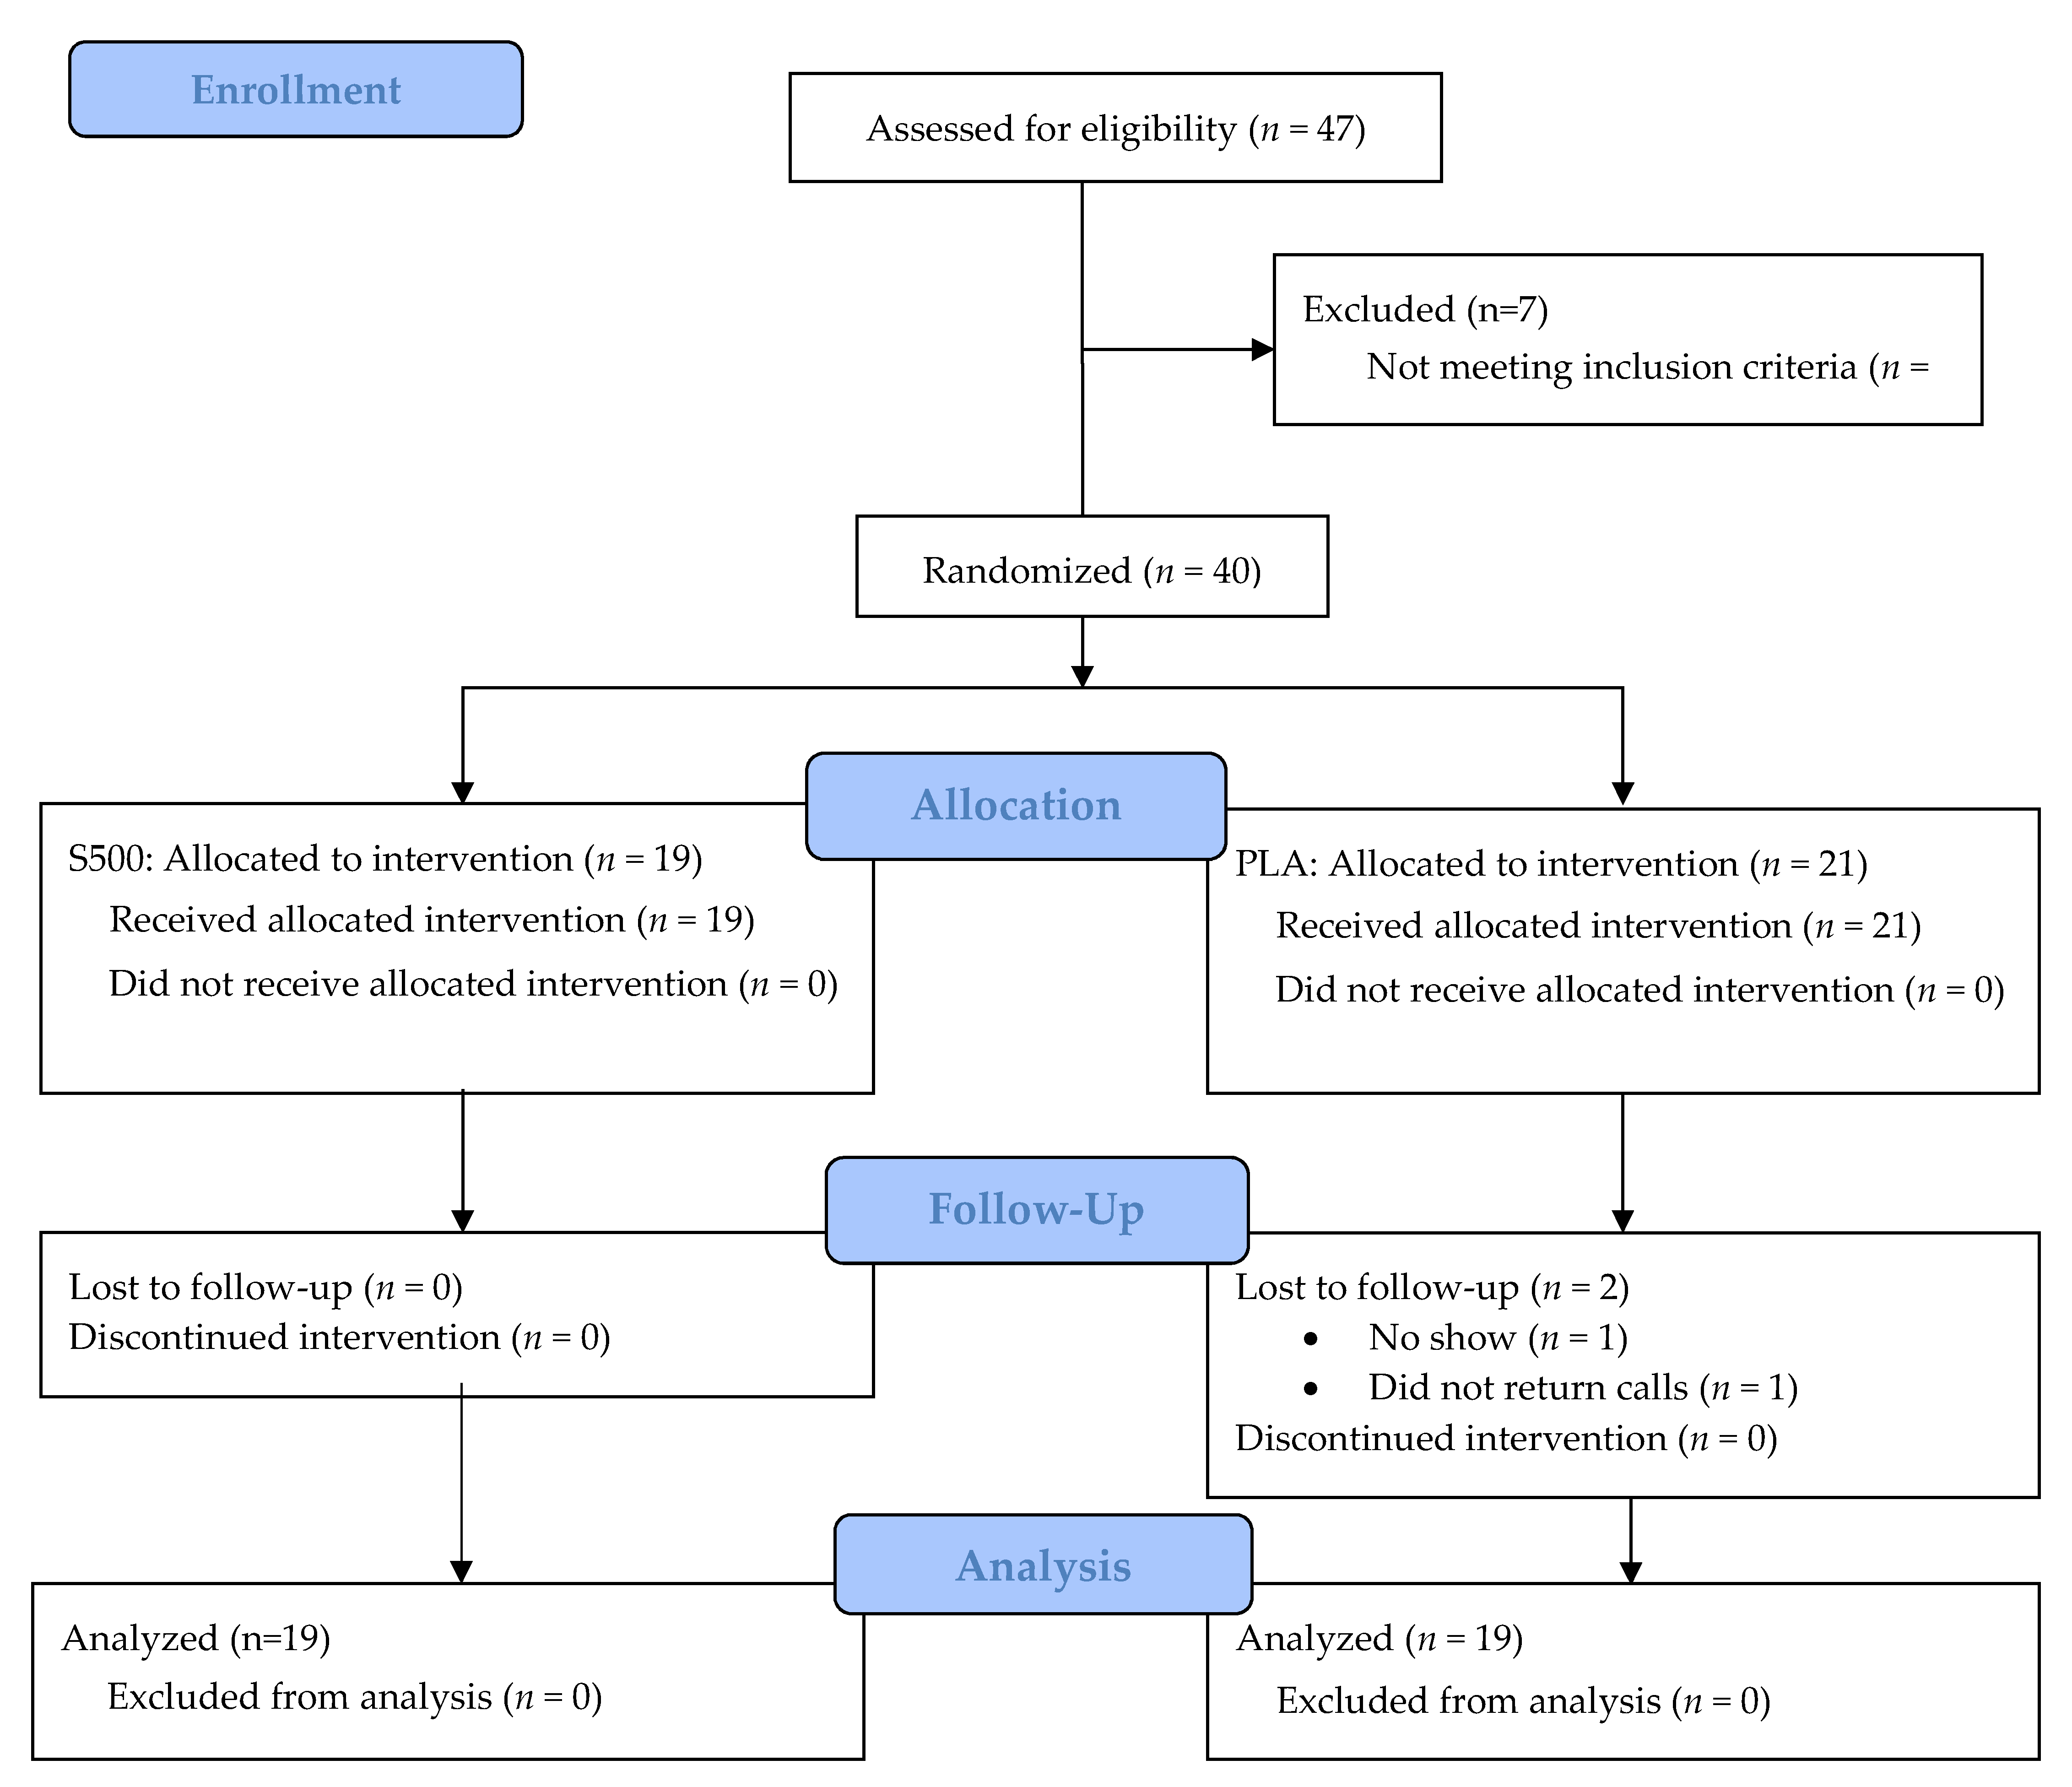
2.2. Study Participants
2.3. Participant Demographics
2.4. Venous Blood Collection
2.5. Body Composition
2.6. Muscular Strength
2.7. Muscular Power
2.8. Muscular Endurance
2.9. Aerobic Endurance
2.10. Visual Analog Scales
2.11. Dietary Intake and Control
2.12. Supplementation
2.13. Resistance Training Program
2.14. Adverse Events
2.15. Statistical Analysis
3. Results
3.1. Dietary Intake Variables
3.2. Body Composition Variables
3.3. Visual Analog Scales
3.4. Exercise Performance
3.5. Clinical Chemistry
4. Discussion
Authors Contributions
Funding
Acknowledgments
Conflicts of Interest
Availability of Data and Materials
References
- Mishra, L.C.; Singh, B.B.; Dagenais, S. Scientific basis for the therapeutic use of Withania somnifera (ashwagandha): A review. Altern. Med. Rev. 2000, 5, 334–346. [Google Scholar] [PubMed]
- Ramakanth, G.S.; Kumar, C.U.; Kishan, P.V.; Usharani, P. A randomized, double blind placebo controlled study of efficacy and tolerability of Withaina somnifera extracts in knee joint pain. J. Ayurveda Integr. Med. 2016, 7, 151–157. [Google Scholar] [CrossRef] [PubMed]
- Usharani, P.; Fatima, N.; Kumar, C.; Kishan, P.V. Evaluation of a Highly Standardized Withania Somnifera Extract on Endothelial Dysfunction and Biomarkers of Oxidative Stress in Patients with Type II Diabetes Mellitus: A Randomized, Double Blind, Placebo Controlled Study. IJAPR 2014, 2, 23–32. [Google Scholar]
- Archana, R.; Namasivayam, A. Antistressor effect of Withania somnifera. J. Ethnopharmacol. 1999, 64, 91–93. [Google Scholar] [CrossRef]
- Nalini, P.; KManjunath, K.; SunilKumarReddy, K.; Usharani, P. Evaluation of the analgesic activity of standardized aqueous extract of Withania somnifera in healthy human volunteers using Hot Air Pain Model. Res. J. Life Sci. 2013, 1, 1–6. [Google Scholar]
- Sandhu, J.S.; Shah, B.; Shenoy, S.; Chauhan, S.; Lavekar, G.S.; Padhi, M.M. Effects of Withania somnifera (Ashwagandha) and Terminalia arjuna (Arjuna) on physical performance and cardiorespiratory endurance in healthy young adults. Int. J. Ayurveda Res. 2010, 1, 144–149. [Google Scholar] [CrossRef] [PubMed]
- Bhattacharyya, S.; Pal, D.; Banerjee, D.; Majumder, U.; Ghosal, S. Comparative effect of withania somnifera and panax ginseng on swim-stress induced impaired energy status of mice. Pharmacologyonline 2009, 2, 421–432. [Google Scholar]
- Raut, A.A.; Rege, N.N.; Tadvi, F.M.; Solanki, P.V.; Kene, K.R.; Shirolkar, S.G.; Pandey, S.N.; Vaidya, R.A.; Vaidya, A.B. Exploratory study to evaluate tolerability, safety, and activity of Ashwagandha (Withania somnifera) in healthy volunteers. J. Ayurveda Integr. Med. 2012, 3, 111–114. [Google Scholar] [CrossRef] [PubMed]
- Wankhede, S.; Langade, D.; Joshi, K.; Sinha, S.R.; Bhattacharyya, S. Examining the effect of Withania somnifera supplementation on muscle strength and recovery: a randomized controlled trial. J. Int. Soc. Sports Nutr. 2015, 12, 43. [Google Scholar] [CrossRef] [PubMed]
- Cuka, S.; Dvornik, S.; Drazenovic, K.; Mihic, J. Evaluation of the Dade Behring Dimension RxL clinical chemistry analyzer. Clin. Lab. 2001, 47, 35–40. [Google Scholar] [PubMed]
- Ziegenfuss, T.N.; Hofheins, J.E.; Mendel, R.W.; Landis, J.; Anderson, R.A. Effects of a water-soluble cinnamon extract on body composition and features of the metabolic syndrome in pre-diabetic men and women. J. Int. Soc. Sports Nutr. 2006, 3, 45–53. [Google Scholar] [CrossRef] [PubMed]
- Baechle, T.R.; Earle, R.W. Essentials of Strength Training and Conditioning; Human Kinetics: Champaign, IL, USA, 2000. [Google Scholar]
- Hoffman, J.R.; Ratamess, N.A.; Kang, J.; Rashti, S.L.; Faigenbaum, A.D. Effect of betaine supplementation on power performance and fatigue. J. Int. Soc. Sports Nutr. 2009, 6, 7. [Google Scholar] [CrossRef] [PubMed] [Green Version]
- Stock, M.S.; Beck, T.W.; DeFreitas, J.M.; Dillon, M.A. Test-retest reliability of barbell velocity during the free-weight bench-press exercise. J. Strength Cond. Res. 2011, 25, 171–177. [Google Scholar] [CrossRef] [PubMed]
- Alemany, J.A.; Pandorf, C.E.; Montain, S.J.; Castellani, J.W.; Tuckow, A.P.; Nindl, B.C. Reliability assessment of ballistic jump squats and bench throws. J. Strength Cond. Res. 2005, 19, 33–38. [Google Scholar] [PubMed]
- Astorino, T.A.; Cottrell, T. Reliability and validity of the velotron racermate cycle ergometer to measure anaerobic power. Int. J. Sports Med. 2012, 33, 205–210. [Google Scholar] [CrossRef] [PubMed]
- Lee, K.A.; Hicks, G.; Nino-Murcia, G. Validity and reliability of a scale to assess fatigue. Psychiatry Res. 1991, 36, 291–298. [Google Scholar] [CrossRef]
- Kulovitz, M.G.; Kravitz, L.R.; Mermier, C.; Gibson, A.L.; Conn, C.A.; Kolkmeyer, D.; Kerksick, C.M. Potential role of meal frequency as a strategy for weight loss and health in overweight or obese adults. Nutrition 2014, 30, 386–392. [Google Scholar] [CrossRef] [PubMed]
- Kerksick, C.M.; Wilborn, C.D.; Campbell, B.I.; Roberts, M.D.; Rasmussen, C.J.; Greenwood, M.; Kreider, R.B. Early-phase adaptations to a split-body, linear periodization resistance training program in college-aged and middle-aged men. J. Strength Cond. Res. 2009, 23, 962–971. [Google Scholar] [CrossRef] [PubMed]
- Corrigan, F.E.; Kelli, H.M.; Dhindsa, D.S.; Heinl, R.E.; Al Mheid, I.; Hammadah, M.; Hayek, S.S.; Sher, S.; Eapen, D.J.; Martin, G.S.; et al. Changes in truncal obesity and fat distribution predict arterial health. J. Clin. Lipidol. 2017, 11, 1354–1360.e3. [Google Scholar] [CrossRef] [PubMed]
- Kang, S.M.; Yoon, J.W.; Ahn, H.Y.; Kim, S.Y.; Lee, K.H.; Shin, H.; Choi, S.H.; Park, K.S.; Jang, H.C.; Lim, S. Android fat depot is more closely associated with metabolic syndrome than abdominal visceral fat in elderly people. PLoS ONE 2011, 6, e27694. [Google Scholar] [CrossRef] [PubMed]
- Walker, G.E.; Marzullo, P.; Ricotti, R.; Bona, G.; Prodam, F. The pathophysiology of abdominal adipose tissue depots in health and disease. Horm. Mol. Biol. Clin. Investig. 2014, 19, 57–74. [Google Scholar] [CrossRef] [PubMed]
- Ahtiainen, J.P.; Walker, S.; Peltonen, H.; Holviala, J.; Sillanpaa, E.; Karavirta, L.; Sallinen, J.; Mikkola, J.; Valkeinen, H.; Mero, A.; et al. Heterogeneity in resistance training-induced muscle strength and mass responses in men and women of different ages. Age (Dordr) 2016, 38, 10. [Google Scholar] [CrossRef] [PubMed]
- Jager, R.; Kerksick, C.M.; Campbell, B.I.; Cribb, P.J.; Wells, S.D.; Skwiat, T.M.; Purpura, M.; Ziegenfuss, T.N.; Ferrando, A.A.; Arent, S.M.; et al. International Society of Sports Nutrition Position Stand: Protein and exercise. J. Int. Soc. Sports Nutr. 2017, 14, 20. [Google Scholar] [CrossRef] [PubMed]
- Kerksick, C.M.; Arent, S.; Schoenfeld, B.J.; Stout, J.R.; Campbell, B.; Wilborn, C.D.; Taylor, L.; Kalman, D.; Smith-Ryan, A.E.; Kreider, R.B.; et al. International society of sports nutrition position stand: Nutrient timing. J. Int. Soc. Sports Nutr. 2017, 14, 33. [Google Scholar] [CrossRef] [PubMed]


| Procedure | Visit 1 Screening | Visit 2 Practice | Visit 3 (Week 0) | Visit 4 (Week 12) |
|---|---|---|---|---|
| Informed Consent | X | |||
| Inclusion/Exclusion Criteria | X | |||
| Medical History | X | |||
| Physical | X | |||
| Height, weight, BP, HR | X | X | X | X |
| Safety Screen (CMP, CBC, lipid panel) | X | X | X | |
| Informed Consent | X | |||
| 24 h Diet Recall | X | |||
| DEXA–Body Composition | X | X | ||
| Visual Analog Scales/PRS | X | X | X | |
| Strength, Endurance, and Power | X | X | X | |
| 7.5 km Time Trial | X | X | X | |
| 3-Day Diet Records/Analysis | X | X | ||
| Protocol Compliance (pill counts and log check) | X | X | ||
| Adverse Events Monitoring | X | X | X | X |
| S500 (n = 19) | PLA (n = 19) | Significance | |
|---|---|---|---|
| Age (years) | 24.4 ± 4.2 | 28.6 ± 7.6 | 0.04 |
| Height (m) | 181 ± 6 | 180 ± 7 | 0.68 |
| Body Mass (kg) | 85.5 ± 10.5 | 88.3 ± 14.4 | 0.50 |
| Body Mass Index (kg/m2) | 26.2 ± 3.4 | 27.2 ± 3.9 | 0.38 |
| Systolic Blood Pressure (mmHg) | 124.7 ± 9.7 | 125.8 ± 8.4 | 0.71 |
| Diastolic Blood Pressure (mmHg) | 71.4 ± 7.7 | 74.0 ± 8.6 | 0.33 |
| Resting HR (beats/min) | 68.4 ± 9.0 | 67.5 ± 8.8 | 0.77 |
| Squat 1 RM (kg) | 105.0 ± 30.2 | 103.8 ± 27.4 | 0.90 |
| Bench Press 1 RM (kg) | 93.7 ± 21.3 | 97.0 ± 22.4 | 0.64 |
| DEXA Body Fat (%) | 23.8 ± 6.4 | 25.1 ± 7.0 | 0.56 |
| Between-Group Comparison | |||||||
|---|---|---|---|---|---|---|---|
| Variables | n | Baseline (Week 0) | Post (Week 12) | Within p-Value | Mean Difference | 95% CI | p-Value |
| Calorie Intake (kcals/day) | |||||||
| S500 PLA | 19 19 | 2027 ± 568 1956 ± 808 | 2087 ± 512 2093 ± 1171 | 0.54 0.45 | −77 ± 200 | (−483, 329) | 0.70 |
| Carbohydrate Intake (g/day) | |||||||
| S500 PLA | 19 19 | 219 ± 84 214 ± 125 | 221 ± 78 204 ± 107 | 0.88 0.62 | 12.1 ± 24 | (−36.4, 60.7) | 0.62 |
| Protein Intake (g/day) | |||||||
| S500 PLA | 19 19 | 104 ± 38 115 ± 39 | 113 ± 42 112 ± 51 | 0.32 0.67 | 11.8 ± 11.1 | (−10.6, 34.2) | 0.29 |
| Fat Intake (g/day) | |||||||
| S500 PLA | 19 19 | 78 ± 29 73 ± 32 | 82 ± 28 94 ± 79 | 0.88 0.34 | −17.1 ± 13.1 | (−43.7, 9.4) | 0.20 |
| Between-Group Comparison | |||||||
|---|---|---|---|---|---|---|---|
| Variables | n | Baseline (Week 0) | Post (Week 12) | Within p-Value | Mean Difference | 95% CI | p-Value |
| Percent Body Fat (%) | |||||||
| S500 PLA | 19 19 | 23.8 ± 6.4 25.1 ± 7.0 | 23.2 ± 6.1 25.3 ± 6.5 | 0.25 0.49 | −0.80 ± 0.57 | (−1.96, 0.36) | 0.17 |
| DXA Lean Mass (kg) | |||||||
| S500 PLA | 19 19 | 61.9 ± 7.6 62.9 ± 8.4 | 62.3 ± 7.6 62.9 ± 8.4 | 0.43 0.91 | 3.95 ± 5.6 | (−7.41, 1.53) | 0.49 |
| DXA Fat Mass (kg) | |||||||
| S500 PLA | 19 19 | 19.7 ± 7.1 21.8 ± 8.6 | 19.1 ± 6.3 22.0 ± 8.6 | 0.19 0.57 | −8.9 ± 6.3 | (−2.2, 3.8) | 0.17 |
| DXA Lean/Fat Ratio | |||||||
| S500 PLA | 19 19 | 3.52 ± 1.33 3.30 ± 1.26 | 3.64 ± 1.39 3.21 ± 1.09 | 0.24 0.21 | 0.21 ± 0.12 | (−0.03, 0.44) | 0.09 |
| DXA Android/Gynoid Ratio | |||||||
| S500 PLA | 19 19 | 0.992 ± 0.26 1.095 ± 0.29 | 0.992 ± 0.28 1.185 ± 0.31 | 0.99 0.001 † | (−0.09 ± 0.04) | (−0.17, −0.01) | 0.03 ‡ |
| DXA Visceral Adipose Tissue (kg) | |||||||
| S500 PLA | 19 19 | 0.43 ± 0.36 1.02 ± 0.98 | 0.41 ± 0.34 0.99 ± 0.93 | 0.37 0.53 | 0.05 ± 49.1 | (−99.6, 99.7) | 0.99 |
| Body Mass (kg) | |||||||
| S500 PLA | 19 19 | 85.5 ± 10.5 88.3 ± 14.4 | 84.9 ± 10.5 87.7 ± 14.3 | 0.52 0.58 | 0.03 ± 1.35 | (−2.71, 2.77) | 0.98 |
| Between-Group Comparison | |||||||
|---|---|---|---|---|---|---|---|
| Variables | n | Baseline (Week 0) | Post (Week 12) | Within p-Value | Mean Difference | 95% CI | p-Value |
| Perceived Recovery Score | |||||||
| S500 PLA | 19 19 | 6.58 ± 1.22 7.00 ± 1.37 | 7.53 ± 1.02 7.47 ± 1.90 | 0.003 † 0.25 | 0.47 ± 0.48 | (−0.51, 1.45) | 0.33 |
| Invigorated | |||||||
| S500 PLA | 19 19 | 6.58 ± 1.30 6.43 ± 1.64 | 6.75 ± 1.31 6.78 ± 1.43 | 0.64 0.31 | −0.18 ± 0.49 | (−1.18, 0.82) | 0.72 |
| Mood | |||||||
| S500 PLA | 19 19 | 7.22 ± 1.25 6.56 ± 1.67 | 7.61 ± 1.17 7.24 ± 1.50 | 0.19 0.08 † | −0.28 ± 0.47 | (−1.22, 0.67) | 0.55 |
| Desire to Workout | |||||||
| S500 PLA | 19 19 | 6.46 ± 1.55 6.46 ± 1.56 | 7.08 ± 1.57 7.05 ± 1.62 | 0.18 0.13 | 0.04 ± 0.58 | (−1.14, 1.22) | 0.95 |
| Willingness to Train | |||||||
| S500 PLA | 19 19 | 7.41 ± 1.67 7.01 ± 1.84 | 7.92 ± 1.40 7.59 ± 1.35 | 0.27 0.07 † | −0.07 ± 0.53 | (−1.16, 1.01) | 0.89 |
| Optimism | |||||||
| S500 PLA | 19 19 | 7.37 ± 1.86 7.23 ± 1.98 | 7.88 ± 2.09 7.79 ± 1.46 | 0.25 0.09 † | −0.06 ± 0.53 | (1.13, 1.02) | 0.91 |
| Soreness | |||||||
| S500 PLA | 19 19 | 3.33 ± 1.87 2.63 ± 2.19 | 3.93 ± 2.47 3.83 ± 2.37 | 0.37 0.04 † | −0.61 ± 0.83 | (−2.30, 1.09) | 0.47 |
| Between-Group Comparison | |||||||
|---|---|---|---|---|---|---|---|
| Variables | N | Baseline (Week 0) | Post (Week 12) | Within p-Value | Mean Difference | 95% CI | p-Value |
| 7.5 km Time Trial (seconds) | |||||||
| S500 PLA | 19 19 | 1241 ± 268 1189 ± 389 | 977 ± 119 1020 ± 189 | <0.001 † 0.18 | −95.5 ± 133 | (−366, 174) | 0.48 |
| Average Power All Sets Squats (Watts) | |||||||
| S500 PLA | 19 19 | 1443 ± 206 1442 ± 240 | 1510 ± 220 1486 ± 227 | 0.007 † 0.12 | 19.2 ± 41.1 | (−64.1, 102.4) | 0.52 |
| Peak Power All Sets Squats (Watts) | |||||||
| S500 PLA | 19 19 | 2424 ± 347 2444 ± 271 | 2628 ± 197 2580 ± 217 | <0.001 † 0.01 † | 68.5 ± 67.4 | (−68.1, 205.1) | 0.32 |
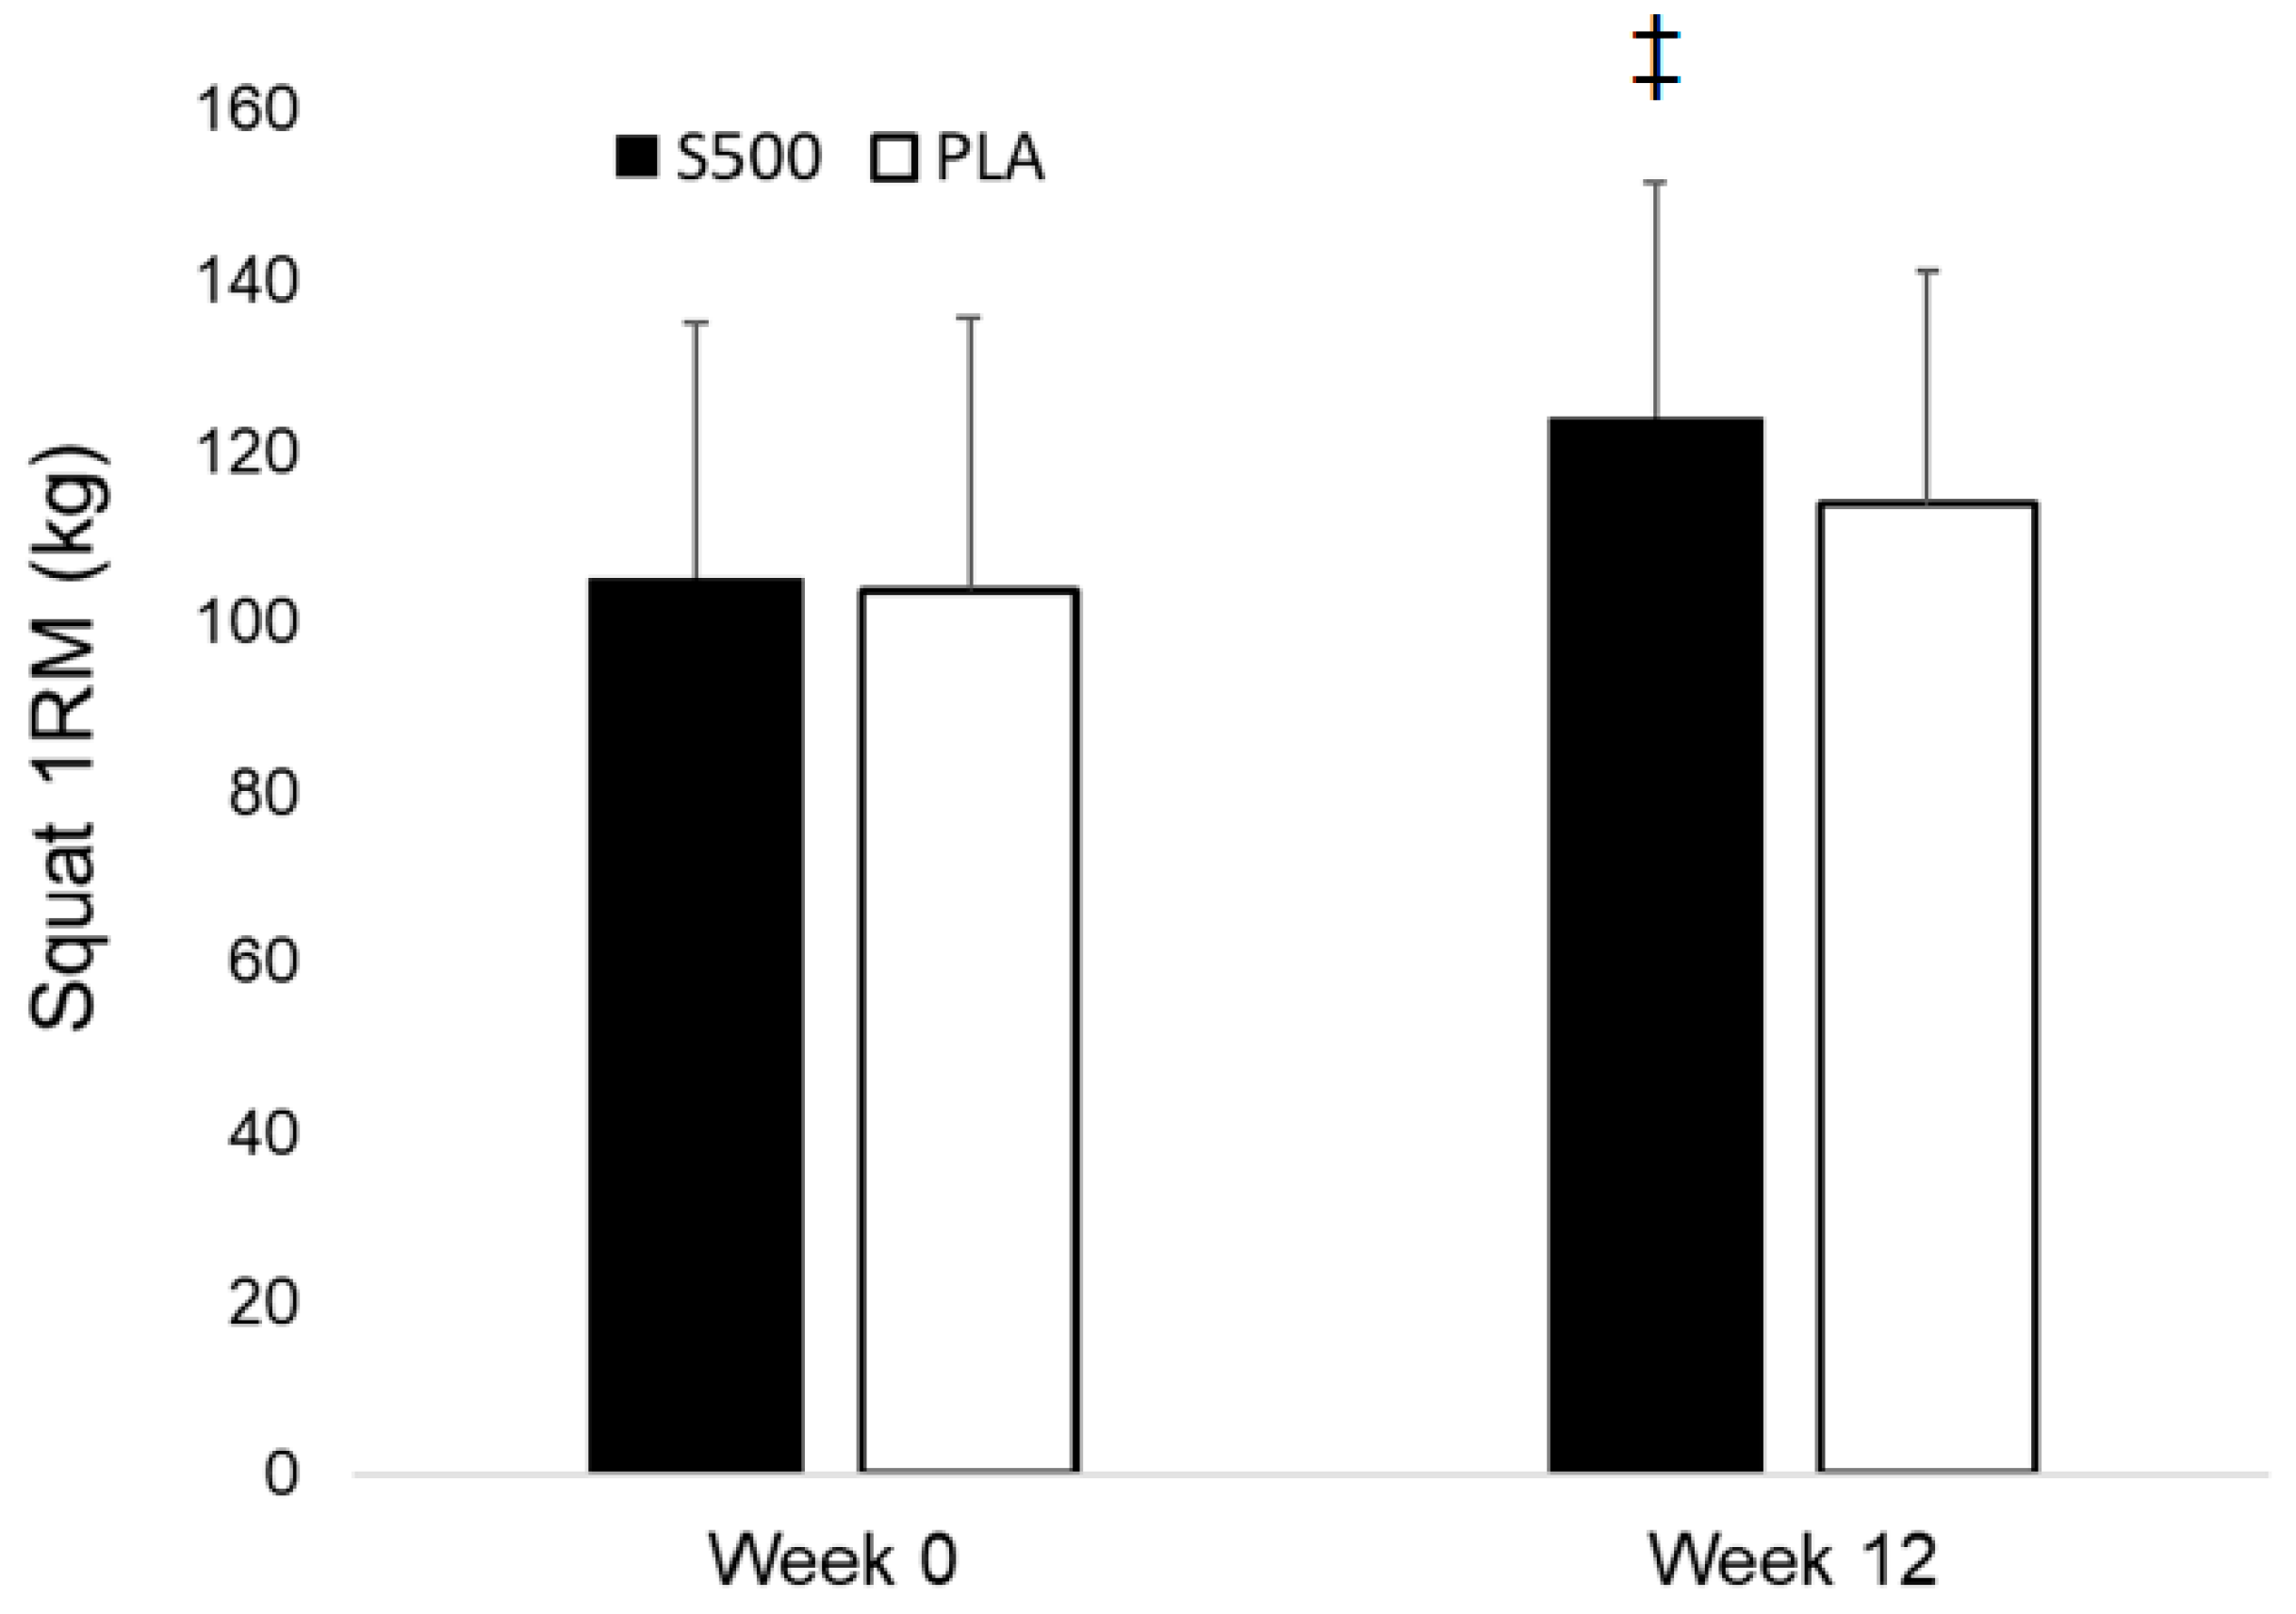
| Squat 1-RM (kg) | |||||||
| S500 PLA | 19 19 | 105.0 ± 30.2 103.8 ± 27.4 | 124.1 ± 32.0 113.9 ± 27.2 | <0.001 † <0.001 † | 9.1 ± 3.3 | (2.4, 15.8) | 0.009 ‡ |
| Squat Repetitions All Sets (repetitions) | |||||||
| S500 PLA | 19 19 | 29.8 ± 11.7 32.7 ± 12.0 | 36.6 ± 10.0 44.4 ± 19.5 | 0.01 † 0.002 † | −4.9 ± 4.2 | (−13.4, 3.5) | 0.24 |
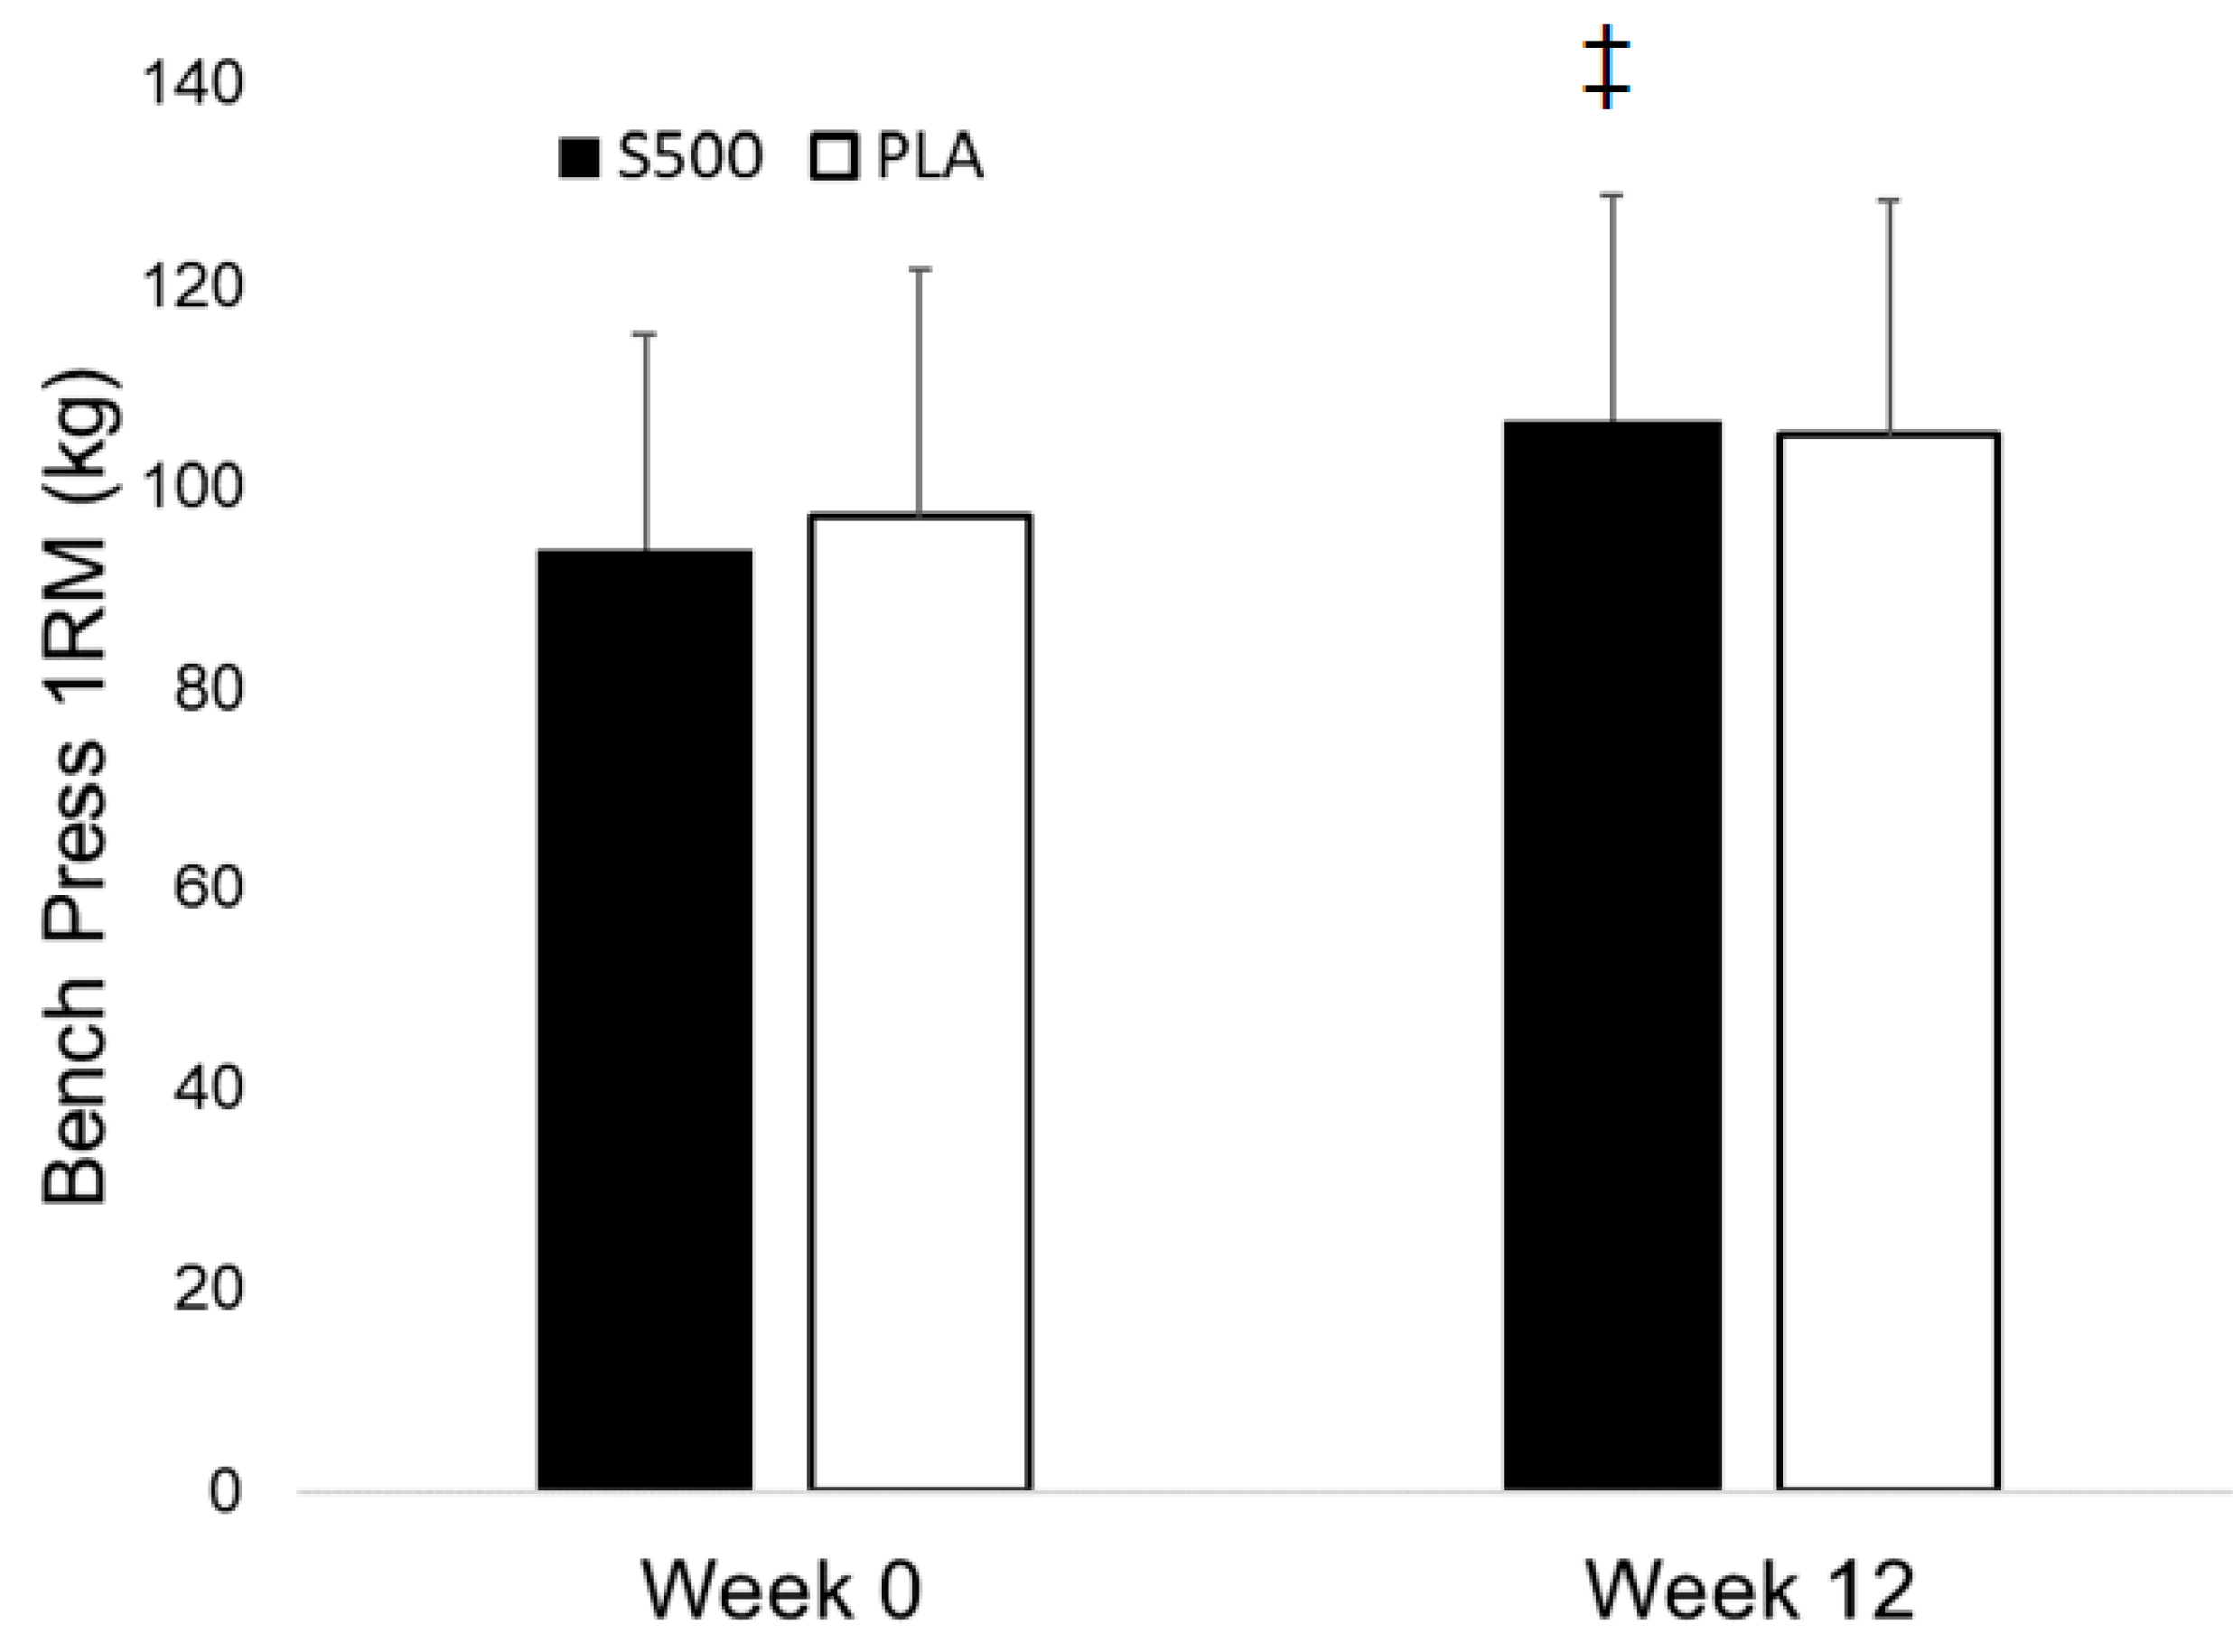
| Bench Press 1-RM (kg) | |||||||
| S500 PLA | 19 19 | 93.7 ± 21.3 97.0 ± 22.4 | 106.5 ± 24.7 105.0 ± 23.3 | <0.001 † <0.001 † | 4.78 ± 2.34 | (0.03, 9.52) | 0.048 ‡ |
| Average Bench Press Power All Sets (Watts) | |||||||
| S500 PLA | 19 19 | 379 ± 101 396 ± 127 | 423 ± 107 423 ± 111 | 0.005 † 0.04 | 17.1 ± 18.8 | (−21.1, 55.3) | 0.37 |
| Peak Power Bench Press All Sets (Watts) | |||||||
| S500 PLA | 19 19 | 492 ± 131 529 ± 154 | 548 ± 133 554 ± 156 | 0.007 † 0.21 | 30.4 ± 26.3 | (−23.0, 83.8) | 0.26 |
| Bench Press Repetitions Completed All Sets | |||||||
| S500 PLA | 19 19 | 29.8 ± 5.3 30.8 ± 8.4 | 38.2 ± 9.6 36.8 ± 12.4 | <0.001 † 0.03 † | 2.4 ± 3.1 | (−3.95, 8.69) | 0.45 |
| Between-Group Comparison | |||||||
|---|---|---|---|---|---|---|---|
| Variables | N | Baseline (Week 0) | Post (Week 12) | Within p-Value | Mean Difference | 95% CI | p-Value |
| White blood cell count (cells/μL) | |||||||
| S500 PLA | 19 19 | 5.88 ± 1.36 5.54 ± 1.50 | 6.48 ± 1.40 5.68 ± 1.83 | 0.14 0.68 | 0.46 ± 0.51 | (−0.56, 1.49) | 0.37 |
| Red blood cell count (cells/μL) | |||||||
| S500 PLA | 19 19 | 5.08 ± 0.29 5.07 ± 0.36 | 5.08 ± 0.24 5.21 ± 0.42 | 0.97 0.01 † | −0.15 ± 0.07 | (−0.29, −0.01) | 0.04 ‡ |
| Hemoglobin (g/dL) | |||||||
| S500 PLA | 19 19 | 15.5 ± 0.24 15.4 ± 0.90 | 15.2 ± 0.53 15.8 ± 0.94 | 0.03 † 0.02 † | −0.64 ± 0.19 | (−1.03, −0.26) | 0.002 ‡ |
| Hematocrit (%) | |||||||
| S500 PLA | 19 19 | 43.5 ± 2.42 43.4 ± 2.33 | 43.5 ± 1.75 44.7 ± 2.87 | 0.85 0.01 † | −1.37 ± 0.62 | (−2.63, −0.11) | 0.03 ‡ |
| Glucose (g/dL) | |||||||
| S500 PLA | 19 19 | 87.9 ± 8.4 89.5 ± 6.3 | 90.8 ± 4.7 90.4 ± 5.7 | 0.18 0.63 | 2.11 ± 2.69 | (−3.35, 7.56) | 0.44 |
| Blood Urea Nitrogen (mg/dL) | |||||||
| S500 PLA | 19 19 | 14.5 ± 3.55 15.1 ± 3.85 | 14.3 ± 3.0 14.7 ± 3.1 | 0.72 0.60 | 0.16 ± 0.91 | (−1.69, 2.00) | 0.86 |
| Creatinine (mg/dL) | |||||||
| S500 PLA | 19 19 | 1.01 ± 0.15 0.98 ± 0.13 | 1.08 ± 0.14 1.02 ± 0.13 | 0.03 † 0.11 | 0.02 ± 0.04 | (−0.05, 0.10) | 0.56 |
| Blood Urea Nitrogen/Creatinine Ratio | |||||||
| S500 PLA | 19 19 | 14.5 ± 3.2 15.8 ± 5.3 | 13.5 ± 2.9 14.8 ± 4.1 | 0.19 0.24 | −0.05 ± 1.13 | (−2.34, 2.23) | 0.96 |
| Sodium (mEq/L) | |||||||
| S500 PLA | 19 19 | 141.6 ± 1.39 141.2 ± 1.64 | 141.1 ± 1.24 140.5 ± 1.78 | 0.29 0.13 | 0.21 ± 0.61 | (−1.02, 1.45) | 0.73 |
| Potassium (mEq/L) | |||||||
| S500 PLA | 19 19 | 4.44 ± 0.32 4.40 ± 0.22 | 4.33 ± 0.26 4.34 ± 0.21 | 0.10 0.21 | −0.04 ± 0.08 | (−0.20, 0.12) | 0.59 |
| Chloride (mEq/L) | |||||||
| S500 PLA | 19 19 | 101.1 ± 1.99 100.9 ± 1.70 | 101.2 ± 1.99 100.6 ± 1.77 | 0.77 0.48 | 0.47 ± 0.70 | (−0.94, 1.89) | 0.50 |
| Carbon Dioxide (mEq/L) | |||||||
| S500 PLA | 19 19 | 24.7 ± 1.77 24.1 ± 1.78 | 24.3 ± 1.73 23.2 ± 2.41 | 0.34 0.18 | 0.47 ± 0.77 | (−1.09, 2.03) | 0.54 |
| Protein (g/dL) | |||||||
| S500 PLA | 19 19 | 7.36 ± 0.43 7.15 ± 0.28 | 7.20 ± 0.40 7.31 ± 0.33 | 0.16 0.12 | −0.32 ± 0.14 | (−0.61, −0.02) | 0.04 |
| Albumin (g/dL) | |||||||
| S500 PLA | 19 19 | 4.80 ± 0.30 4.74 ± 0.19 | 4.67 ± 0.25 4.78 ± 0.20 | 0.04 † 0.53 | −0.16 ± 0.08 | (−0.33, 0.00) | 0.05 |
| Globulin (g/dL) | |||||||
| S500 PLA | 19 19 | 2.56 ± 0.26 2.41 ± 0.28 | 2.53 ± 0.25 2.53 ± 0.34 | 0.72 0.23 | −0.15 ± 0.13 | (−0.41, 0.11) | 0.24 |
| Albumin/Globulin Ratio | |||||||
| S500 PLA | 19 19 | 1.89 ± 0.22 2.00 ± 0.29 | 1.86 ± 0.21 1.93 ± 0.28 | 0.60 0.42 | 0.03 ± 0.11 | (−0.19, 0.25) | 0.77 |
| Bilirubin (mg/dL) | |||||||
| S500 PLA | 19 19 | 0.58 ± 0.32 0.71 ± 0.45 | 0.59 ± 0.28 0.74 ± 0.41 | 0.88 0.52 | −0.03 ± 0.09 | (−0.21, 0.16) | 0.77 |
| Alkaline Phosphatase (U/L) | |||||||
| S500 PLA | 19 19 | 66.4 ± 14.4 73.9 ± 21.4 | 64.2 ± 11.5 74.3 ± 19.9 | 0.46 0.85 | −2.58 ± 3.5 | (−9.68, 4.52) | 0.47 |
| Aspartate Aminotransferase (U/L) | |||||||
| S500 PLA | 19 19 | 24.3 ± 9.2 24.8 ± 7.8 | 22.8 ± 8.2 25.9 ± 8.1 | 0.24 0.61 | −2.68 ± 2.56 | (−7.88, 2.51) | 0.30 |
| Alanine Aminotransferase (U/L) | |||||||
| S500 PLA | 19 19 | 20.6 ± 9.1 24.8 ± 7.8 | 22.8 ± 8.2 25.9 ± 8.1 | 0.88 0.24 | −2.37 ± 2.40 | (−7.23, 2.50) | 0.33 |
| Total Cholesterol (mg/dL) | |||||||
| S500 PLA | 19 19 | 157.2 ± 31.9 181.3 ± 44.9 | 155.2 ± 28.6 184.3 ± 43.5 | 0.51 0.49 | −5.0 ± 5.2 | (−15.5, 5.5) | 0.34 |
| Triglycerides (mg/dL) | |||||||
| S500 PLA | 19 19 | 72.7 ± 21.7 130.4 ± 114.8 | 80.5 ± 35.6 116.5 ± 66. | 0.36 0.38 | 21.7 ± 17.5 | (−13.8, 57.2) | 0.22 |
| High Density Lipoprotein Cholesterol (mg/dL) | |||||||
| S500 PLA | 19 19 | 53.3 ± 10.8 47.7 ± 7.2 | 51.4 ± 11.5 47.9 ± 7.7 | 0.23 0.86 | −2.16 ± 1.95 | (−6.11, 1.80) | 0.28 |
| Very Low Density Lipoprotein Cholesterol (mg/dL) | |||||||
| S500 PLA | 19 19 | 14.4 ± 4.5 21.8 ± 14.2 | 16.1 ± 7.0 23.3 ± 13.4 | 0.33 0.94 | 1.74 ± 2.23 | (−2.78, 6.27) | 0.44 |
| Low Density Lipoprotein Cholesterol (mg/dL) | |||||||
| S500 PLA | 19 19 | 89.4 ± 30.5 107.1 ± 34.3 | 87.8 ± 25.3 113.2 ± 36.6 | 0.59 0.33 | −6.19 ± 5.34 | (−17.0, 4.6) | 0.25 |
© 2018 by the authors. Licensee MDPI, Basel, Switzerland. This article is an open access article distributed under the terms and conditions of the Creative Commons Attribution (CC BY) license (http://creativecommons.org/licenses/by/4.0/).
Share and Cite
Ziegenfuss, T.N.; Kedia, A.W.; Sandrock, J.E.; Raub, B.J.; Kerksick, C.M.; Lopez, H.L. Effects of an Aqueous Extract of Withania somnifera on Strength Training Adaptations and Recovery: The STAR Trial. Nutrients 2018, 10, 1807. https://0-doi-org.brum.beds.ac.uk/10.3390/nu10111807
Ziegenfuss TN, Kedia AW, Sandrock JE, Raub BJ, Kerksick CM, Lopez HL. Effects of an Aqueous Extract of Withania somnifera on Strength Training Adaptations and Recovery: The STAR Trial. Nutrients. 2018; 10(11):1807. https://0-doi-org.brum.beds.ac.uk/10.3390/nu10111807
Chicago/Turabian StyleZiegenfuss, Tim N., Anurag W. Kedia, Jennifer E. Sandrock, Betsy J. Raub, Chad M. Kerksick, and Hector L. Lopez. 2018. "Effects of an Aqueous Extract of Withania somnifera on Strength Training Adaptations and Recovery: The STAR Trial" Nutrients 10, no. 11: 1807. https://0-doi-org.brum.beds.ac.uk/10.3390/nu10111807