Article

Dietary Intakes and Dietary Quality during Pregnancy in Women with and without Gestational Diabetes Mellitus - A Norwegian Longitudinal Study

1
Department of Clinical and Molecular Medicine, Norwegian University of Science and Technology (NTNU), 7089 Trondheim, Norway
2
Children’s Clinic, St. Olavs Hospital, Trondheim University Hospital, 7006 Trondheim, Norway
3
Clinic of Clinical Services, St. Olavs Hospital, Trondheim University Hospital, 7006 Trondheim, Norway
4
Department of Public Health and Nursing, Norwegian University of Science and Technology (NTNU), 7089 Trondheim, Norway
5
Department of Obstetrics and Gynecology, St. Olavs Hospital, Trondheim University Hospital, 7006 Trondheim, Norway
*
Author to whom correspondence should be addressed.
Submission received: 8 October 2018 / Revised: 1 November 2018 / Accepted: 16 November 2018 / Published: 20 November 2018
(This article belongs to the Special Issue Nutrition and Gestational Diabetes)

Abstract

:
Gestational diabetes mellitus (GDM) is associated with maternal diet, however, findings are inconsistent. The aims of the present study were to assess whether intakes of foods and beverages during pregnancy differed between women who developed GDM and non-GDM women, and to compare dietary intakes with dietary recommendations of pregnancy. This is a longitudinal study using participants of a randomized controlled trial. Women with complete measurements of a 75 g oral glucose tolerance test (OGTT) at 18–22 and 32–36 weeks gestation were included in the cohort (n = 702). Women were diagnosed for GDM according to the simplified International Association of Diabetes and Pregnancy Study Group criteria at 32–36 weeks (GDM women: n = 40; non-GDM women: n = 662). Dietary data (food frequency questionnaire) was collected at both time points and compared between GDM and non-GDM women. Variability in OGTT values was assessed in a general linear model. Marginal differences between GDM and non-GDM women in intakes of food groups were found. No associations were found between dietary variables and OGTT values. Not all dietary recommendations were followed in the cohort, with frequently reported alcohol consumption giving largest cause for concern. This study did not find dietary differences that could help explain why 40 women developed GDM.

1. Introduction

Gestational diabetes mellitus (GDM) is defined as carbohydrate intolerance resulting in hyperglycemia of variable severity with onset or first recognition during pregnancy [1]. The pathophysiology is an inadequate pancreatic β-cell compensation for the increased insulin resistance of pregnancy [1,2,3]. GDM is associated with adverse pregnancy outcomes and increased short- and long-term morbidity in both mother and child [4,5,6,7]. Known risk factors for GDM are diabetes in first degree relatives, maternal age >25 years, non-European ethnicity, previous GDM, impaired glucose tolerance pre-pregnancy, pre-pregnancy BMI ≥25 kg/m2, and high gestational weight gain [8].
Maternal diet before and during pregnancy could be a modifiable risk factor of GDM, but findings have been inconsistent and flaws to the current body of evidence have been pointed out [9]. Diets resembling the Mediterranean diet or the Dietary Approach to Stop Hypertension before or during pregnancy are most consistently found to reduce risk or odds of GDM [10]. These diets include higher consumption of foods with high fiber content, such as legumes, whole grain, and vegetables, lean meats, fish, and poultry, and limited intakes of processed foods and foods with high fat and/or sugar content. GDM is reported to be positively associated with a high fat intake, the consumption of ≥7 eggs/week, ≥300 mg cholesterol/day, and an intake of ≥1.1 mg/day of heme iron during pregnancy [11,12,13].
The aims of the present study are (1) to assess whether intakes of foods and beverages during pregnancy differ between Nordic Caucasian women with and without GDM, and (2) to compare dietary intakes with dietary recommendations of pregnancy.

2. Materials and Methods

2.1. Study Population

This is a longitudinal study using participants of a randomized controlled trial. The study population was participants in the Training in Pregnancy trial [14], a two-armed, two-centered randomized controlled trial that aimed to investigate whether a 12-week regular exercise program during the second half of pregnancy could prevent GDM. The study sites of St. Olavs hospital and Stavanger University hospital in Norway recruited pregnant women from April 2007 to September 2009. Written information about the trial and invitation to participate were sent by mail, along with invitation to an ultrasound scan at 17–19 weeks gestation. The ultrasound scan is free of charge and routinely offered to all pregnant women in Norway. Inclusion criteria were Caucasian women aged ≥18 years with a singleton live fetus, living ≤30 min drive from either of the two hospitals. Exclusion criteria were high-risk pregnancies and/or diseases that could interfere with participation, including, but not exclusively, a history of giving birth before 34 weeks gestation, preeclampsia, serious growth retardation in the fetus, asthma, heart disease, hypertonia, renal disease, known substance abuse, and/or in the current pregnancy, placenta previa, elevated blood pressure (>140/90 ≥two measurements) before gestational week 20, and/or identified high risk for preterm labor. Women willing to participate were not compensated financially. The study was approved by the Regional Committee for Medical and Health Research Ethics (REK 4.2007.81), and procedures followed were in accordance with ethical standards of research and the Helsinki declaration. Eligible women were enrolled the following week after the ultrasound scan and met at the study sites for assessments at 18–22 (study entry) and 32–36 weeks gestation (follow-up after the exercise intervention).
Details on the exercise program are reported elsewhere [14]. A total of 855 women were included. All women received the brochure “Nutrition in Pregnancy”, based upon the nutritional recommendations for the Norwegian population given in 2005 [15]. The brochure gives information on nutritional requirements during pregnancy and provides suggestions on how to meet nutritional needs through examples of balanced meal compositions.

2.2. Outcome Measures

At both time points (week 18–22 and week 32–36) women underwent a 2-h oral glucose tolerance test (OGTT). GDM was diagnosed according to the simplified International Association of Diabetes and Pregnancy Study Groups (IADPSG) criteria [16] as fasting plasma glucose ≥5.1 mmol/L, or 2-h value ≥8.5 mmol/L, using a 75-g glucose load. Blood samples were analyzed using standard laboratory procedures at the hospitals.
Data on daily intakes of foods and beverages were collected at week 18–22 and 32–36 using a food frequency questionnaire (FFQ) developed for use in national dietary surveys of the general adult population (see supplementary file, Figure S1). The FFQ was administered before the OGTT results were available. The women were instructed to provide information about their dietary intake as it was the previous four weeks. The FFQ is quantitative, self-administered, and optical mark readable, and has been validated against the Norwegian population [17,18,19]. Three versions of the FFQ have been developed; the NORKOST 1997 version was used in the current study. It includes questions about 180 food items, including nutritional supplements. Alternatives for frequency of use varied between per day, per week, or per month, depending on the food item. Portion sizes were specified in household units, which were later computed into edible amounts of food based on standardized scales. Related food items were categorized into 15 main groups of foods and beverages with 62 subgroups. The results were compared with the Norwegian food guidelines for the general population, which give quantitative recommendations for red and processed meat, fish and shellfish, fatty fish, and fruit and vegetables combined and separately [20]. The Norwegian food guidelines [20] are in line with recommendations given by the World Cancer Research Fund [21] and the Nordic Nutrition Recommendations [22].
Estimations of daily intake of energy and nutrients were computed by using a food database, based on the official Norwegian Food Composition Table [23], and a software system developed at the Institute of Nutrition Research at the University of Oslo. Factors for energy percentage (E%) calculations were: 4 kcal/g for protein and carbohydrates (minus fiber), 9 kcal/g for fat, 7 kcal/g for alcohol, and 2 kcal/g for fiber. The E% results were compared with recommended ranges of energy distribution for the general population, and micronutrient results were compared with recommendations for pregnant women [22].
Data on pre-pregnancy weight and height, level of exercise before pregnancy, smoking, and family history of diabetes were self-reported through questionnaires. Current weights were measured at the sites at 18–22 and 32–36 weeks gestation; all women were weighed on the same scale, fasting, without shoes, and with light clothes. BMI was calculated with the formula weight (kg)/(height (m))2. Level of exercise before pregnancy was presented as a categorical variable (yes/no), defined as “exercised at least three times per week at moderate to high intensity, perceived strenuous or very strenuous”.

2.3. Statistical Analysis

The software package IBM SPSS 22.0 (SPSS Inc., Chicago, IL, USA) was used for statistical analysis. Assumptions of normality were assessed using Kolmogorov-Smirnov and Shapiro-Wilk tests, and by visual inspections of histograms displaying the normal curve. Due to skewed dietary data and unequal variance in sample sizes, non-parametric testing of differences between groups was done for continuous data. Group medians (50th) and 25th and 75th percentiles were computed for continuous variables, which were analyzed using Mann-Whitney U-Test. Differences between women with and without GDM in intakes of foods and beverages were tested with a total of 15 tests for the main food groups and 62 tests for the food subgroups. Categorical variables were analyzed using Pearson’s Chi Square Test or Fisher’s exact test. Variability in glucose levels was assessed with one-way ANOVA (Univariate Analysis of Variance). Predictor variables in the model were selected based on correlations with glucose variables, assessed with Pearson’s correlation coefficient and Spearman rank correlation coefficient. Two-sided significance was assumed at the 5% level (p ≤ 0.05).

3. Results

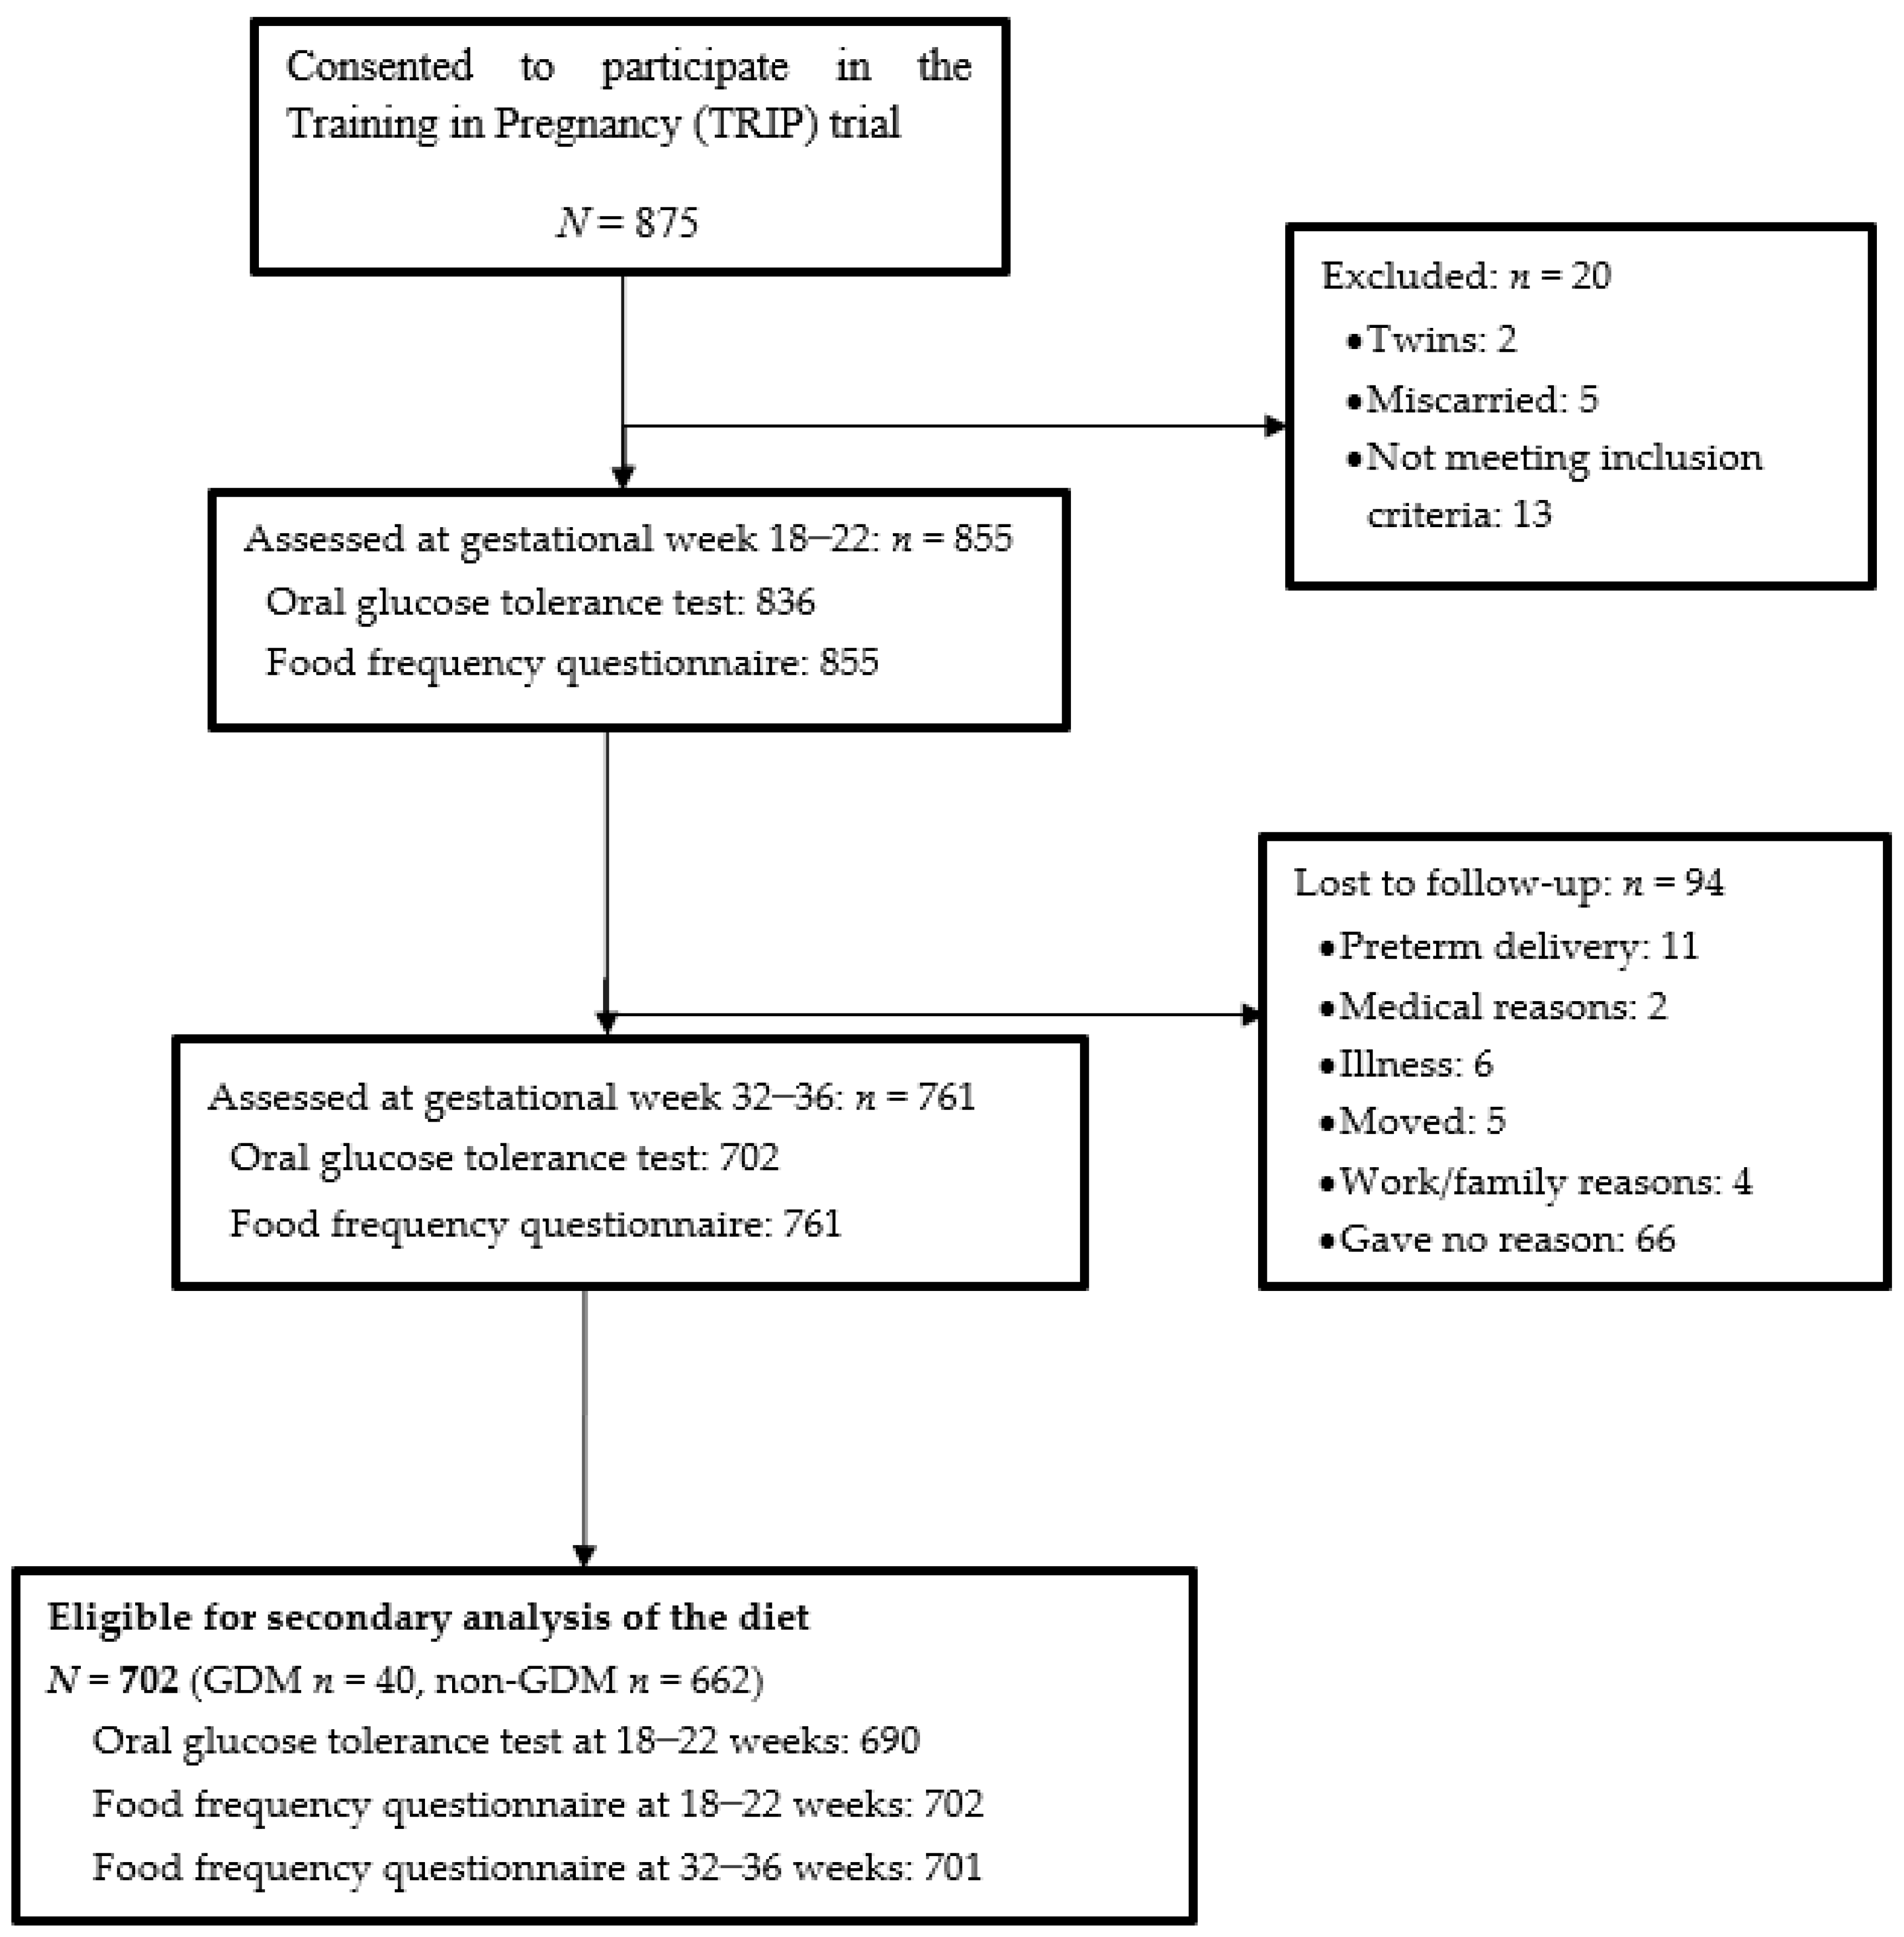
3.1. Study Population

Approximately 12,000 pregnant women had routine ultrasound scans at St. Olavs hospital and Stavanger University hospital between 2007 and 2009, whereof 875 (7%) consented to participate. A total of 855 women met the inclusion criteria. The current study includes all women who completed the OGTT at both time points, resulting in a cohort of 702 women (Figure 1). Women were analyzed as cases (GDM women; n = 40) or controls (non-GDM women; n = 662), as diagnosed after the OGTT at 32–36 weeks.
GDM women had higher pre-pregnancy weight (67 vs. 64 kg, p = 0.028) and pre-pregnancy BMI (24.2 vs. 22.5, p = 0.009), and gained more weight during pregnancy compared with non-GDM women (5.4 vs. 4.5 kg, p = 0.025 and 14.3 vs. 11.8 kg, p = 0.012 at 18–22 and 32–36 weeks gestation, respectively) (Table 1). Fifteen GDM women (38%) had a pre-pregnancy BMI ≥25 compared with 129 (20%) non-GDM women (p = 0.014). Further, both fasting glucose and 2-h glucose were higher in GDM women at 18–22 weeks gestation, and a higher proportion of GDM women had a family history of diabetes in first-degree relatives (Table 1). There were no differences between the two groups in maternal age at study entry, height, self-reported exercise before pregnancy, smoking, allocation, or protocol adherence in the trial (Table 1).

3.2. Intakes of Foods and Beverages during Pregnancy

There were no differences between GDM and non-GDM women in intake of the 15 main groups of foods and beverages at either time point during pregnancy (Table 2). Regarding food subgroups, GDM women reported lower intake of whey cheese (0 vs. 10 g/day, p = 0.009) in week 18–22, higher intake of French fries (7 vs. 3 g/day, p = 0.042) in week 32–36, and lower intake of fruit juices at both time points (62 vs. 108 g/day, p = 0.027, and 54 vs. 107 g/day, p = 0.010, in 18–22 and 32–36 weeks of pregnancy, respectively) (Table 2).

3.3. Intakes of Energy and Nutrients during Pregnancy

Energy intake, fiber intake, and energy distribution did not differ between GDM and non-GDM women at any time point during pregnancy (Table 3). Regarding micronutrients, GDM women had higher estimates of thiamin (1.7 vs. 1.5 mg/day, p = 0.008) and riboflavin (2.0 vs. 1.8 mg/day, p = 0.028) at pregnancy week 32–36. Estimates of micronutrients did not differ between GDM and non-GDM women at 18–22 weeks (Table 3).

3.4. Dietary Intakes in Relation to Dietary Recommendations

Intakes of red and processed meat, fish and shellfish, and fruit and vegetables combined and separately did not differ between GDM and non-GDM women at any time point, except for a lower intake of fatty fish among the GDM women at pregnancy week 32–36 (28 vs. 57 g/week, p = 0.014) (Table 3). For both groups, the weekly intake of red and processed meat exceeded the recommendation of ≤500 g/week, and intakes of vegetables and fatty fish were below the recommendations of ≥250 g/day (vegetables) and 200 g/week (fatty fish). Further, both groups reported an intake of fish and shellfish close to the lowest recommendation of intake (300 g/week) and met the recommendation of a daily intake of fruit and vegetables combined of ≥500 g/day.
Energy distribution was equal and within the recommended ranges for both groups at both time points, even the limit of <10 E% from sugar was kept. Further, fiber intake was within the recommendation of 25–35 g/day. Most women reported zero intake of alcohol (Table 3). However, 243 (35%) and 246 (35%) women reported drinking light beer/lager at 18–22 and 32–36 weeks, respectively. Also, 35 (5%) and 21 (3%) reported drinking wine, and 5 (1%) and 1 (<1%) reported drinking liquor at 18–22 and 32–36 weeks, respectively. At 18–22 weeks, the median intakes were 35 g/day (25th, 75th percentiles: 14, 49 g/day) for light beer/lager, 5 g/day (1, 17 g/day) for wine, and 6 g/day (4, 6 g/day) for liquor, among women who reported intake of those beverages. At 32–36 weeks, the respective median intakes were 25 g/day (14, 49 g/day) for light beer/lager, 5 g/day (1, 15 g/day) for wine, and 6 g/day for liquor. Among those women who reported alcohol consumption (35%), the intake of pure alcohol was 0.5 g/day (0.2, 0.7 g/day) at 18–22 weeks, and 0.6 g/day (0.2, 0.6 g/day) at 32–36 weeks. In Norway, the alcohol content of light beer is 0.7–2.7%, for lager is 2.7–4.7%, and for wine is 8–14% (red, rosé, white wines). Alcohol-free beers are not included in the light beer/lager variable.
Intake of folate and iron were too low according to the recommendations for all women at both time points. GDM women met the vitamin D recommendations at 32–36 weeks gestation, whereas non-GDM women had intakes lower than the recommendation at both time points (Table 3). In all, 122 (17%) and 46 (7%) women met the recommendations and had intakes of ≥10 µg/day of vitamin D, ≥400 µg/day of folate, and ≥ 15 mg/day for iron at 18–22 and 32–36 weeks, respectively. Daily intake of other micronutrients was in accordance with recommendations at both time points (Table 3).

3.5. Variability in Glucose Concentrations

Correlations between fasting and 2-h glucose values (both time points) and dietary variables (both time points) and known GDM risk factors were assessed (see supplementary material, Tables S1–4). The correlations were weak and the effect differences minor.
Variables correlating with glucose values (fasting and 2-h) were analyzed with one-way ANOVA in order to quantify linear relationships. In all, four one-way ANOVA models were made for both fasting and 2-h glucose at both 18–22 and at 32–36 weeks gestation (see supplementary materials, Tables S5–8). At 32–36 weeks, linear relationships were found between pre-pregnancy BMI, body weight (both pre-pregnancy and at 18–22 weeks), and fasting glucose (see supplementary materials, Table S7). For the 32–36 week 2-h value, linearity was found with maternal age, pre-pregnancy BMI, and not exercising before pregnancy, with the highest β-coefficient found for not exercising before pregnancy (see supplementary materials, Table S8). The correlations between dietary variables and both fasting and 2-h glucose disappeared when pre-pregnancy BMI, weight variables, maternal age, and pre-pregnancy exercising were controlled for (see supplementary materials, Tables S5–8).

4. Discussion

Only marginal differences between GDM and non-GDM women in dietary intakes were found. However, not all dietary recommendations were followed, with too low intakes of vitamin D, folate, and iron, and frequently reported alcohol consumption, giving the largest cause for concern. GDM women had higher gestational weight gain and known pre-pregnancy risk factors (overweight and maternal age) were confirmed in the present population.
The few dietary differences between GDM and non-GDM women could have been due to chance. The statistical analysis of dietary data included many variables, and multiple testing was not accounted for. Thus, with a significance level of 0.05, one expects three tests of the food subgroups and one test of the micronutrients to be significant due to chance per time point for testing.
The differences between GDM and non-GDM women in intakes of fruit juices, whey cheese, and French fries did not generate differences in the main food groups or alter energy distribution or total energy intake between groups. Therefore, it is uncertain whether the different consumption levels by GDM women of these food subgroups is of clinical significance. As prevalence of overweight was low in the present study, we could speculate the possibility that β-cell insufficiency and not insulin resistance was a plausible primary cause of GDM in these women. If the women had been more overweight, insulin resistance could have been more pronounced and dietary factors could have had greater impact on blood glucose concentrations.
The reported diet of the present population was not optimal according to dietary recommendations [16,18], as an excess intake of red and processed meat, along with low intakes of vegetables and fatty fish, were observed for all women, GDM or not. This is supported by findings from the Norwegian Mother and Child Cohort Study (MoBa), where only 45% of the pregnant women followed the recommendation for red and processed meat, and <10% followed the recommendations for vegetables and fatty fish [24]. When evaluating the whole diet of a group, one must be aware that no clear cut-off values for intakes of food groups is established regarding risk of chronic diseases, and that individual dietary needs may differ from recommended ranges of intake. All women in the present study were given written information on food guidelines during pregnancy available at that time. However, quantitative recommendations of food groups were not included in the food guidelines until 2011 [17].
Despite supplementation being included in the nutrient estimates, too low intakes of vitamin D, folate, and iron were observed for women in both groups, with the exception of adequate vitamin D intake in GDM women at 32–36 weeks. The low reported intake of vitamin D has recently been verified by serum analyses in the present population, as 34% had low vitamin D serum levels (25(OH)D <50 nmol/L) at 32–36 weeks gestation [25]. Similar results have been observed in Sweden [26], where dietary vitamin D intakes <10 µg/day in fair-skinned pregnant women were found, and most women were vitamin D deficient by their third trimester. Norway and Sweden are comparable regarding diet, latitude, and economy and the large number of pregnant women with low vitamin D levels raise concern. Folate supplementation of 400 µg/day before pregnancy and in the first trimester is recommended [27]. Dietary data was collected at the second and third trimester, which could explain folate estimates below recommended levels. However, data from the Medical Birth Registry of Norway show that only 33% and 79% of women took folate supplements before and during pregnancy, respectively [28]. It is difficult to evaluate whether women met their iron needs, as iron needs during pregnancy are dependent upon iron stores at conception. Considering that this cohort consisted of healthy Caucasian women, dietary inadequacies of greater severity may possibly be found in the general pregnant population.
Surprisingly, 35% of women reported alcohol consumption during pregnancy. A similar proportion of pregnant women reported alcohol consumption in a study from Oslo, Norway [29]. With Trondheim, Stavanger, and Oslo being three of the five largest cities in Norway, this may indicate that a significant proportion of urban Norwegian women do not abstain from alcohol while pregnant, despite total abstinence being strongly recommended [17]. Light beer/lager beer were the most frequently reported alcoholic beverages in the present study, followed by wine and liquor. Interestingly, in public surveys of the general population, beer only accounts for 25% of the alcohol use among Norwegian women, while wine accounts for >60% [30]. The different alcohol pattern observed in the present study versus the general female population could indicate that pregnant women may perceive beer as less harmful to the fetus than wine or liquor.
Advanced maternal age and high pre-pregnancy BMI are known to increase the risk of elevated OGTT values [31], as supported by our results. Regular exercise before pregnancy is found to decrease GDM risk in observational studies [32], corresponding to our results of a negative linear relationship between the 2-h glucose value at 32–36 weeks and pre-pregnancy exercise. Neither food groups nor nutrients were associated with glucose values in the present study, which is in line with findings from Project Viva [33]. Apart from the non-modifiable risk factor of maternal age, the present results mainly show a relationship with glucose values for behavior before rather than during pregnancy. Findings from the Nurses’ Health Study II also suggest that a healthy lifestyle before pregnancy is protective against GDM, with a risk reduction of 52% for normal weight, physically active, non-smoking women with a healthy diet [34]. The associations with glucose values were weak in the present study, however, with increasing obesity rates [35] and age [36] among Norwegian primiparous women, the higher pre-pregnancy weight and BMI, and higher gestational weight gain in GDM women are of concern to public health.
The presentation of dietary data as food groups and nutrients is the primary strength of the present study, as it gives comprehensive information about the whole diet of a selected group of pregnant women. Collecting dietary data before OGTT results were available limits the possibility of social-desirability bias affecting dietary reports. Further, this study used validated assessment methods. The two-centered design and confirmation of known GDM risk factors increases the generalizability of our findings. Limitations to the present study are related to the study design for the primarily analysis [14]. The World Health Organization’s diagnostic criteria (fasting glucose ≥7.0 mmol/L or 2-hour value ≥7.8 mmol/L) [37] for GDM was the standard diagnostic criteria in Norway at the time when this study was initiated and conducted, which is why we do not have data on 1-h glucose. Even though the 1-h glucose value is missing, we believe that diagnosing according to the simplified IADPSG criteria [16] enhances the scientific value of our paper. Not grouping the women according to the original randomized allocation increases the risk of selection bias. FFQs have been criticized as being a dietary assessment method of low precision [38,39]. Since dietary assessment was not the primary aim [14], the dietary assessment method needed to provide low respondent burden, be low-cost, and easy to administer.
The total number of eligible pregnant women served by St. Olavs hospital and Stavanger University hospital between 2007 and 2009 is not known, however, the present study included less than 10% of the women attending ultrasounds during that period. In comparison, MoBa had included 42% of all eligible women in 2009 [40]. Because the MoBa study population had characteristics similar to the present population, we find the external validity of the present study acceptable for Norway. Caution is still advised regarding the generalization of these findings to overweight and ethnic diverge pregnant populations.

5. Conclusions

In conclusion, this study did not find dietary differences that could help explain why 40 healthy Caucasian women developed GDM. We suggest that measures must be taken to ensure adequate nutrition and abstinence from alcohol in pregnant women.

Supplementary Materials

The following is available online at https://www.mdpi.com/2072-6643/10/11/1811/s1, Figure S1: Food frequency questionnaire (in Norwegian); Tables S1–4: Variables showing correlations with glucose values; Tables S5–8: Variables showing linear relationships with glucose values.

Author Contributions

Conceptualization, T.E., I.L.M., and S.N.S.; Methodology, T.E., I.L.M., and S.N.S.; Formal analysis, T.E. and I.L.M.; Investigation, S.N.S.; Resources, S.N.S.; Data Curation, S.N.S.; Writing–original draft preparation, T.E.; Writing–review and editing, I.L.M., S.M., K.Å.S., and S.N.S.; Visualization, T.E.; Supervision, I.L.M. and S.N.S.; Project administration, S.M., K.Å.S., and S.N.S.; Funding Acquisition, S.M.

Funding

This research was funded by the Norwegian Fund for Postgraduate Training in Physiotherapy, the Liaison Committee for Central Norway Regional Health Authority (RHA), and the Norwegian University of Science and Technology (NTNU).

Acknowledgments

The authors thank all physiotherapists and medical secretaries at the two hospitals for their effort in performing this study. We are indebted to the women who participated in this study.

Conflicts of Interest

The authors declare no conflict of interest. The funders had no role in the design of the study; in the collection, analyses, or interpretation of data; in the writing of the manuscript, or in the decision to publish the results.

References

  1. American Diabetes Association. Report of the Expert Committee on the Diagnosis and Classification of Diabetes Mellitus. Diabetes Care 1997, 20, 1183–1197. [Google Scholar]
  2. Buchanan, T.A. Pancreatic B-cell defects in gestational diabetes: Implications for the pathogenesis and prevention of type 2 diabetes. J. Clin. Endocrinol. Metab. 2001, 86, 989–993. [Google Scholar] [CrossRef] [PubMed]
  3. Nolan, C.J. Controversies in gestational diabetes. Best Pract. Res. Clin. Obstet. Gynaecol. 2011, 25, 37–49. [Google Scholar] [CrossRef] [PubMed]
  4. Catalano, P.M. Obesity, insulin resistance, and pregnancy outcome. Reproduction 2010, 140, 365–371. [Google Scholar] [CrossRef] [PubMed] [Green Version]
  5. Metzger, B.E.; Lowe, L.P.; Dyer, A.R.; Trimble, E.R.; Chaovarindr, U.; Coustan, D.R.; Hadden, D.R.; McCane, D.R.; Hod, M.; McIntyre, H.D. Hyperglycemia and adverse pregnancy outcomes. N. Engl. J. Med. 2008, 358, 1991–2002. [Google Scholar] [CrossRef] [PubMed]
  6. Beharier, O.; Shoham-Vardi, I.; Pariente, G.; Sergienko, R.; Kessous, R.; Baumfeld, Y.; Szaingurten-Solodkin, I.; Sheiner, E. Gestational Diabetes Mellitus is a Significant Risk Factor for Long Term Maternal Renal Disease. J. Clin. Endocrinol. Metab. 2015, 100, 1412–1416. [Google Scholar] [CrossRef] [PubMed]
  7. Engeland, A.; Bjorge, T.; Daltveit, A.K.; Skurtveit, S.; Vangen, S.; Vollset, S.E.; Furu, K. Risk of diabetes after gestational diabetes and preeclampsia. A registry-based study of 230,000 women in Norway. Eur. J. Epidemiol. 2011, 26, 157–163. [Google Scholar] [CrossRef] [PubMed] [Green Version]
  8. Coustan, R.D. Diabetes Mellitus in Pregnancy: Screening and Diagnosis. 2017. Available online: https://www.uptodate.com/contents/diabetes-mellitus-in-pregnancy-screening-and-diagnosis (accessed on 12 November 2017).
  9. Schoenaker, D.A.; Mishra, G.D. The Role of Energy, Nutrients, Foods, and Dietary Patterns in the Development of Gestational Diabetes Mellitus: A Systematic Review of Observational Studies. Diabetes Care 2016, 39, 16–23. [Google Scholar] [CrossRef] [PubMed]
  10. Mijatovic-Vukas, J.; Capling, L.; Cheng, S.; Stamatakis, E.; Louie, J.; Cheung, N.W.; Markovic, T.; Ross, G.; Senior, A.; Brand-Miller, J.C. Associations of Diet and Physical Activity with Risk for Gestational Diabetes Mellitus: A Systematic Review and Meta-Analysis. Nutrients 2018, 10. [Google Scholar] [CrossRef] [PubMed]
  11. Saldana, T.M.; Siega-Riz, A.M.; Adair, L.S. Effect of macronutrient intake on the development of glucose intolerance during pregnancy. Am. J. Clin. Nutr. 2004, 79, 479–486. [Google Scholar] [CrossRef] [PubMed] [Green Version]
  12. Qiu, C.; Frederick, I.O.; Zhang, C.; Sorensen, T.K.; Enquobahrie, D.A.; Williams, M.A. Risk of gestational diabetes mellitus in relation to maternal egg and cholesterol intake. Am. J. Epidemiol. 2011, 173, 649–658. [Google Scholar] [CrossRef] [PubMed]
  13. Qiu, C.; Zhang, C.; Gelaye, B.; Enquobahrie, D.A.; Frederick, I.O.; Williams, M.A. Gestational diabetes mellitus in relation to maternal dietary heme iron and nonheme iron intake. Diabetes Care 2011, 34, 1564–1569. [Google Scholar] [CrossRef] [PubMed]
  14. Stafne, S.N.; Salvesen, K.A.; Romundstad, P.R.; Eggebo, T.M.; Carlsen, S.M.; Morkved, S. Regular exercise during pregnancy to prevent gestational diabetes: A randomized controlled trial. Obstet. Gynecol. 2012, 119, 29–36. [Google Scholar] [CrossRef] [PubMed]
  15. Elvebakken, K.T.; Thommessen, M. Nutrition in Pregnancy; Social- and Health Directorate: Oslo, Norway, 2005; pp. 1–11. [Google Scholar]
  16. Metzger, B.E.; Gabbe, S.G.; Persson, B.; Buchanan, T.A.; Catalano, P.A.; Damm, P.; Dyer, A.R.; Leiva, A.D.; Hod, M.; Kitzmiler, J.L. International association of diabetes and pregnancy study groups recommendations on the diagnosis and classification of hyperglycemia in pregnancy. Diabetes Care 2010, 33, 676–682. [Google Scholar] [CrossRef] [PubMed]
  17. Andersen, L.F.; Solvoll, K.; Drevon, C.A. Very-long-chain n-3 fatty acids as biomarkers for intake of fish and n-3 fatty acid concentrates. Am. J. Clin. Nutr. 1996, 64, 305–311. [Google Scholar] [CrossRef] [PubMed]
  18. Andersen, L.F.; Solvoll, K.; Johansson, L.R.; Salminen, I.; Aro, A.; Drevon, C.A. Evaluation of a food frequency questionnaire with weighed records, fatty acids, and alpha-tocopherol in adipose tissue and serum. Am. J. Epidemiol. 1999, 150, 75–87. [Google Scholar] [CrossRef] [PubMed]
  19. Andersen, L.F.; Veierod, M.B.; Johansson, L.; Sakhi, A.; Solvoll, K.; Drevon, C.A. Evaluation of three dietary assessment methods and serum biomarkers as measures of fruit and vegetables intake, using the method of triads. Br. J. Nutr. 2005, 93, 519–527. [Google Scholar] [CrossRef] [PubMed]
  20. Blomhoff, R.; Andersen, L.F.; Iversen, P.O.; Johansson, R.; Smeland, S. (Eds.) Kostråd for å fremme folkehelsen og forebygge kroniske sykdommer: Metodologi og vitenskapelig kunnskapsbidrag; Nasjonalt råd for ernæring. Norwegian Directorate of Health: Oslo, Norway, 2011; pp. 7–284, IS-1881. Available online: https://helsedirektoratet.no/Lists/Publikasjoner/Attachments/400/Kostrad-for-a-fremme-folkehelsen-og-forebygge-kroniske-sykdommer-metodologi-og-vitenskapelig-kunnskapsgrunnlag-IS-1881.pdf (accessed on 3 October 2018).
  21. World Cancer Research Fund / American Institute for Cancer Research. Food, Nutrition, Physical Activity, and the Prevention of Cancer: A Global Perspective. AICR: Washington, DC, USA, 2007. Available online: http://www.aicr.org/assets/docs/pdf/reports/Second_Expert_Report.pdf (accessed on 1 May 2018).
  22. Nordic Nutrition Recommendations 2012—Integrating Nutrition and Physical Activity. Nordic Counsil of Ministers: Copenhagen, Denmark, 2014, 5th ed. pp. 19–627. Available online: http://norden.diva-portal.org/smash/record.jsf?pid=diva2%3A704251&dswid=mainwindow (accessed on 4 April 2018).
  23. Norwegian Food Safety Authority. The Food Composition Table. 2011. Available online: http://www.matportalen.no/kontaktoss/about_us (accessed on 5 April 2018).
  24. von Ruesten, A.; Brantsaeter, A.L.; Haugen, M.; Meltzer, H.M.; Mehlig, K.; Winkvist, A.; Lissner, L. Adherence of pregnant women to Nordic dietary guidelines in relation to postpartum weight retention: Results from the Norwegian Mother and Child Cohort Study. BMC Public Health 2014, 14, 75. [Google Scholar] [CrossRef] [PubMed] [Green Version]
  25. Gustafsson, M.K.; Stafne, S.N.; Romundstad, P.R.; Mørkved, S.; Salvesen, K.; Helvik, A.S.; Syversen, U. Variation of 25-hydroxyvitamin D and 1,25-dihydroxyvitamin D levels during pregnancy: A Norwegian longitudinal study. PLoS ONE 2018, 13, e0195041. [Google Scholar]
  26. Brembeck, P.; Winkvist, A.; Olausson, H. Determinants of vitamin D status in pregnant fair-skinned women in Sweden. Br. J. Nutr. 2013, 110, 856–864. [Google Scholar] [CrossRef] [PubMed] [Green Version]
  27. Klovning, A.; Backe, B.; Eide, B.I.; Blix, E.; Aarseth, J.; Mathiesen, M.R.; Holan, S.; Roland, B. Guidelines for Antenatal Care; Social- and Health Directorate: Oslo, Norway, 2005. [Google Scholar]
  28. Norwegian Institute of Public Health. Medical Birth Registry of Norway. 2016. Available online: http://statistikkbank.fhi.no/mfr/ (accessed on 11 February 2018).
  29. Alvik, A.; Heyerdal, S.; Haldorsen, T.; Lindemann, R. Alcohol use before and during pregnancy: A population-based study. Acta. Obstet. Gynecol. Scand. 2006, 85, 1292–1298. [Google Scholar] [CrossRef] [PubMed]
  30. Skretting, A.; Vedøy, T.F.; Lund, K.E.; Bye, E.K. Alkohol, tobakk, vanedannede legemidler, narkotika, sniffing, doping og tjenestetilbudet. In Rusmidler i Norge 2016; Norwegian Institute of Public Health: Oslo, Norway, 2016; pp. 14–115. [Google Scholar]
  31. Aberg, A.; Rydhstroem, H.; Frid, A. Impaired glucose tolerance associated with adverse pregnancy outcome: A population based-study in southern Sweden. AJOG 2001, 184, 77–83. [Google Scholar] [CrossRef] [PubMed]
  32. Tobias, D.K.; Zhang, C.; Van Dam, R.M.; Bowers, K.; Hu, F.B. Physical activity before and during pregnancy and risk of gestational diabetes mellitus: A meta-analysis. Diabetes Care 2011, 34, 223–229. [Google Scholar] [CrossRef] [PubMed] [Green Version]
  33. Radesky, J.S.; Oken, E.; Rifas-Shiman, S.L.; Kleinman, K.P.; Rich-Edwards, J.W.; Gillman, M.W. Diet during early pregnancy and development of gestational diabetes. Paediatr. Perinat. Epidemiol. 2008, 22, 47–59. [Google Scholar] [CrossRef]
  34. Zhang, C.; Tobias, D.K.; Chavarro, J.E.; Bao, W.; Wang, D.; Ley, S.H.; Hu, F.B. Adherence to healthy lifestyle and risk of gestational diabetes mellitus: Prospective cohort study. BMJ 2014, 349, g5450. [Google Scholar] [CrossRef] [PubMed] [Green Version]
  35. Public Health Development. The HUNT Study, Norway: HUNT 1 (1984-86)—HUNT 2 (1995-97)—HUNT 3 (2006-08). Krokstad, S., Knudtsen, M.S., Eds.; HUNT forskningssenter: Levanger, Norway, 2011. Available online: https://www.ntnu.no/documents/10304/1130562/folkehelse-i-endring-huntrapport-2011.pdf (accessed on 18 April 2018).
  36. Jenum, A.K.H.; Hanssen, K.F.; Thordarson, H.B.; Henriksen, T.; Bjerkan, K.; Holm, H.O.; Gudin, H.B. Gestational Diabetes. Norwegian Clinical Guideline for Gestational Diabetes. 2017. Available online: https://helsedirektoratet.no/retningslinjer/svangerskapsdiabetes (accessed on 4 April 2018).
  37. World Health Organization. Definition and Diagnosis of Diabetes Mellitus and Intermediate Hyperglycemia: Report of a WHO/IDF Consultation; WHO Production Services: Geneva, Switzerland, 2006; pp. 9–34. [Google Scholar]
  38. Byers, T. Food frequency dietary assessment: How bad is good enough? Am. J. Epidemiol. 2001, 154, 1087–1088. [Google Scholar] [CrossRef] [PubMed]
  39. Kristal, A.R.; Peters, U.; Potter, J.D. Is it time to abandon the food frequency questionnaire? Cancer Epidemiol. Biomarkers Prev. 2005, 14, 2826–2828. [Google Scholar] [CrossRef] [PubMed]
  40. Owe, K.M.; Nystad, W.; Bø, K. Correlates of regular exercise during pregnancy: The Norwegian Mother and Child Cohort Study. Scand. J. Med. Sci. Sports 2009, 19, 637–645. [Google Scholar] [CrossRef] [PubMed]
Figure 1. Flow chart of study participants.
Nutrients 10 01811 g001
Table 1. Characteristics of the Study Population.
GDM Women
n = 40
Non-GDM Women
n = 662
25thMedian75th25thMedian75thp *
Pre-pregnancy
   Height (m)1.651.691.721.641.681.730.495
   Weight (kg)6167745964700.028
   BMI (kg/m2)21.624.227.021.022.524.30.009
Exercised regularly n (%) 12 (30) 220 (33) 0.732
Gestational week 18–22
   Age (year)2732352830330.281
   Weight (kg) 66.373.981.563.568.474.70.003
   Weight gained (kg)3.75.47.92.94.56.30.025
   OGTT glucose level (mmol/L)
     Fasting4.44.75.04.14.34.5<0.001
     2-h4.85.66.34.24.85.4<0.001
Had one or more children before n (%)20 (50)276 (42)0.325
   Smoking n (%)1 (3)5 (1)0.298
   Diabetes in first degree-relatives n (%)
     Yes3 (8)58 (9)0.024
     No30 (84)570 (90)
     Do not know3 (8)6 (1)
Allocated to intervention group n (%)17 (43) 358 (54)0.191
Adhered to the exercise protocol n (%)9 (28)203 (40)0.197
Gestational week 32–36
   Weight (kg)73.281.889.470.075.982.30.001
   Weight gained (kg)10.814.317.69.011.813.90.012
OGTT glucose level (mmol/L)
     Fasting4.95.25.44.04.24.5<0.001
     2-h6.07.29.04.85.56.3<0.001
Smoking n (%) 0 (0) 4 (1) 1.00
* Analysis is performed with Mann-Whitney U-test for continuous data, and Pearson’s Chi Square or Fisher’s Exact Test for categorical data. Exercised regularly was defined as “exercising three times per week or more at moderate to high intensity”. OGTT, oral glucose tolerance test. GDM, Gestational diabetes mellitus.
Table 2. Daily intakes of main groups of foods and beverages during pregnancy, with selected subgroups.
Gestational Week 18–22 Gestational Week 32–36
GDM Women
n = 40
Non-GDM Women
n = 662
GDM Women
n = 40
Non-GDM Women
n = 661
Edible Amounts, g/day25thMedian75th25thMedian75thp *25thMedian75th25thMedian75thp *
Bread1461892421331742170.1981241752181341682070.762
Cereals4060893961860.84442631033859870.294
Cakes917311019310.4961321371221330.641
Potatoes2037612441610.7912248612134580.652
French fries031013100.96517111370.042
Vegetables1502332841272002960.3031051772711171772560.898
Fruit and berries1912963822293224480.3432112753972223294790.729
Fruit juices3462140541081570.0272354108471071610.010
Meat6496139771041370.610659312771981260.611
Fish and shellfish2841612948710.4792538582743670.266
Eggs91828917220.378101722814200.190
Dairy products 2103675021763415140.4843194055152023635540.287
Cheese1023521532510.2521332521429450.627
Whey cheese005410240.009021005100.140
Butter, margarine, oil1934471529450.1351933511528420.089
Sugar and sweets1121371017280.1521319311119300.681
Beverages 7739151531728102815100.9257791080155165895713410.055
Various intake §82122187771141640.33273107161741061500.728
* Differences between groups analyzed with Mann-Whitney U-test. The “Dairy products” variable mainly includes milk and yoghurt. The “Beverages” variable includes water, coffee, tea, mineral water, and alcoholic beverages. § The “various intake” variable includes salty snacks, potato chips, nuts, and various other products that do not fit into the other categories above.
Table 3. Intake of food groups, energy, and nutrients, including supplements, in relation to recommendations.
Gestational Week 18–22 Gestational Week 32–36
RecommendationsGDM Women
n = 40
Non-GDM Women
n = 662
GDM Women
n = 40
Non-GDM Women
n = 661
25thMedian75th25thMedian75thp *25thMedian75th25thMedian75thp *
Food groups, per day or week
Fruit and vegetables g/day≥500 g/day3915426524045317100.4303634946703765217120.604
Vegetables g/day≥250 g/day1502332841272002960.3031051772711171772560.898
Red and processed meat g/week≤500 g/week 4235889644626468640.7713835908424386138080.721
Fish and shellfish g/week300–450 g/week 1982884272043374980.4791742634031892984680.266
Fatty fish g/week200 g/week 84911625641230.1570288317571160.014
Energy and macronutrients per day
Total energy intake kcal 1963216425611755208624510.2381826221326051741206024210.208
Total fat E%25–40 E% 2934372933360.6902933372933360.587
Protein E%10–20 E% 1516171516170.9621415171416200.456
Carbohydrates E%45–60 E% 4549524548510.7964550534649520.880
Added sugar E%<10 E% 4795690.5486695790.962
Alcohol E%Abstinence §000.1000.10.930000.1000.10.612
Fiber g25–35 g 2528332328330.4532327362227330.600
Micronutrients per day
Cholesterol (mg/mL) 1932743312052663250.9372052552881972523120.867
Vitamin A RAE 800 µg 83913861686879119516170.64074411621258838114215420.925
Vitamin D (µg)10 µg 6.09.213.75.58.614.10.7127.010.214.05.28.313.90.166
Tocopherol (mg)10 µg 10.417.522.211.716.722.60.95511.817.825.410.816.422.00.220
Thiamin (mg)1.5 mg 1.41.62.31.31.62.00.2041.41.72.41.21.52.00.008
Riboflavin (mg)1.6 mg 1.61.92.61.41.92.40.3291.62.02.91.41.82.40.028
Folate (µg)400 µg #2443145812323134530.5152232994432092703620.062
Vitamin C (mg)85 mg 1111642201101532170.548106158252991452020.241
Calcium (mg)900 mg 758930126071891911540.4818531003123971193211550.068
Fe (mg)15 mg **9.011.013.18.910.914.00.9328.511.018.68.610.714.20.236
Magnesium (mg)280 mg 3013544032883414100.5423083594312853424080.867
* Differences between groups analyzed with Mann-Whitney U-test. Norwegian Council of Nutrition Recommendation of 2011. Nordic Nutrition Recommendations (NNR) of 2012. § NNR (2012), reference applies to pregnant women. Retinol activity equivalents (RAE); 1 RAE: 1 µg retinol = 12 µg β-carotene. NNR (2012), references apply to pregnant and breastfeeding women. # NNR (2012), reference applies to women of reproductive age. ** NNR (2012), reference applies to women in age groups 18–30 and 31–60 years.

