Effect of a Whey Protein Supplement on Preservation of Fat Free Mass in Overweight and Obese Individuals on an Energy Restricted Very Low Caloric Diet


Abstract
:1. Introduction
2. Materials and Methods
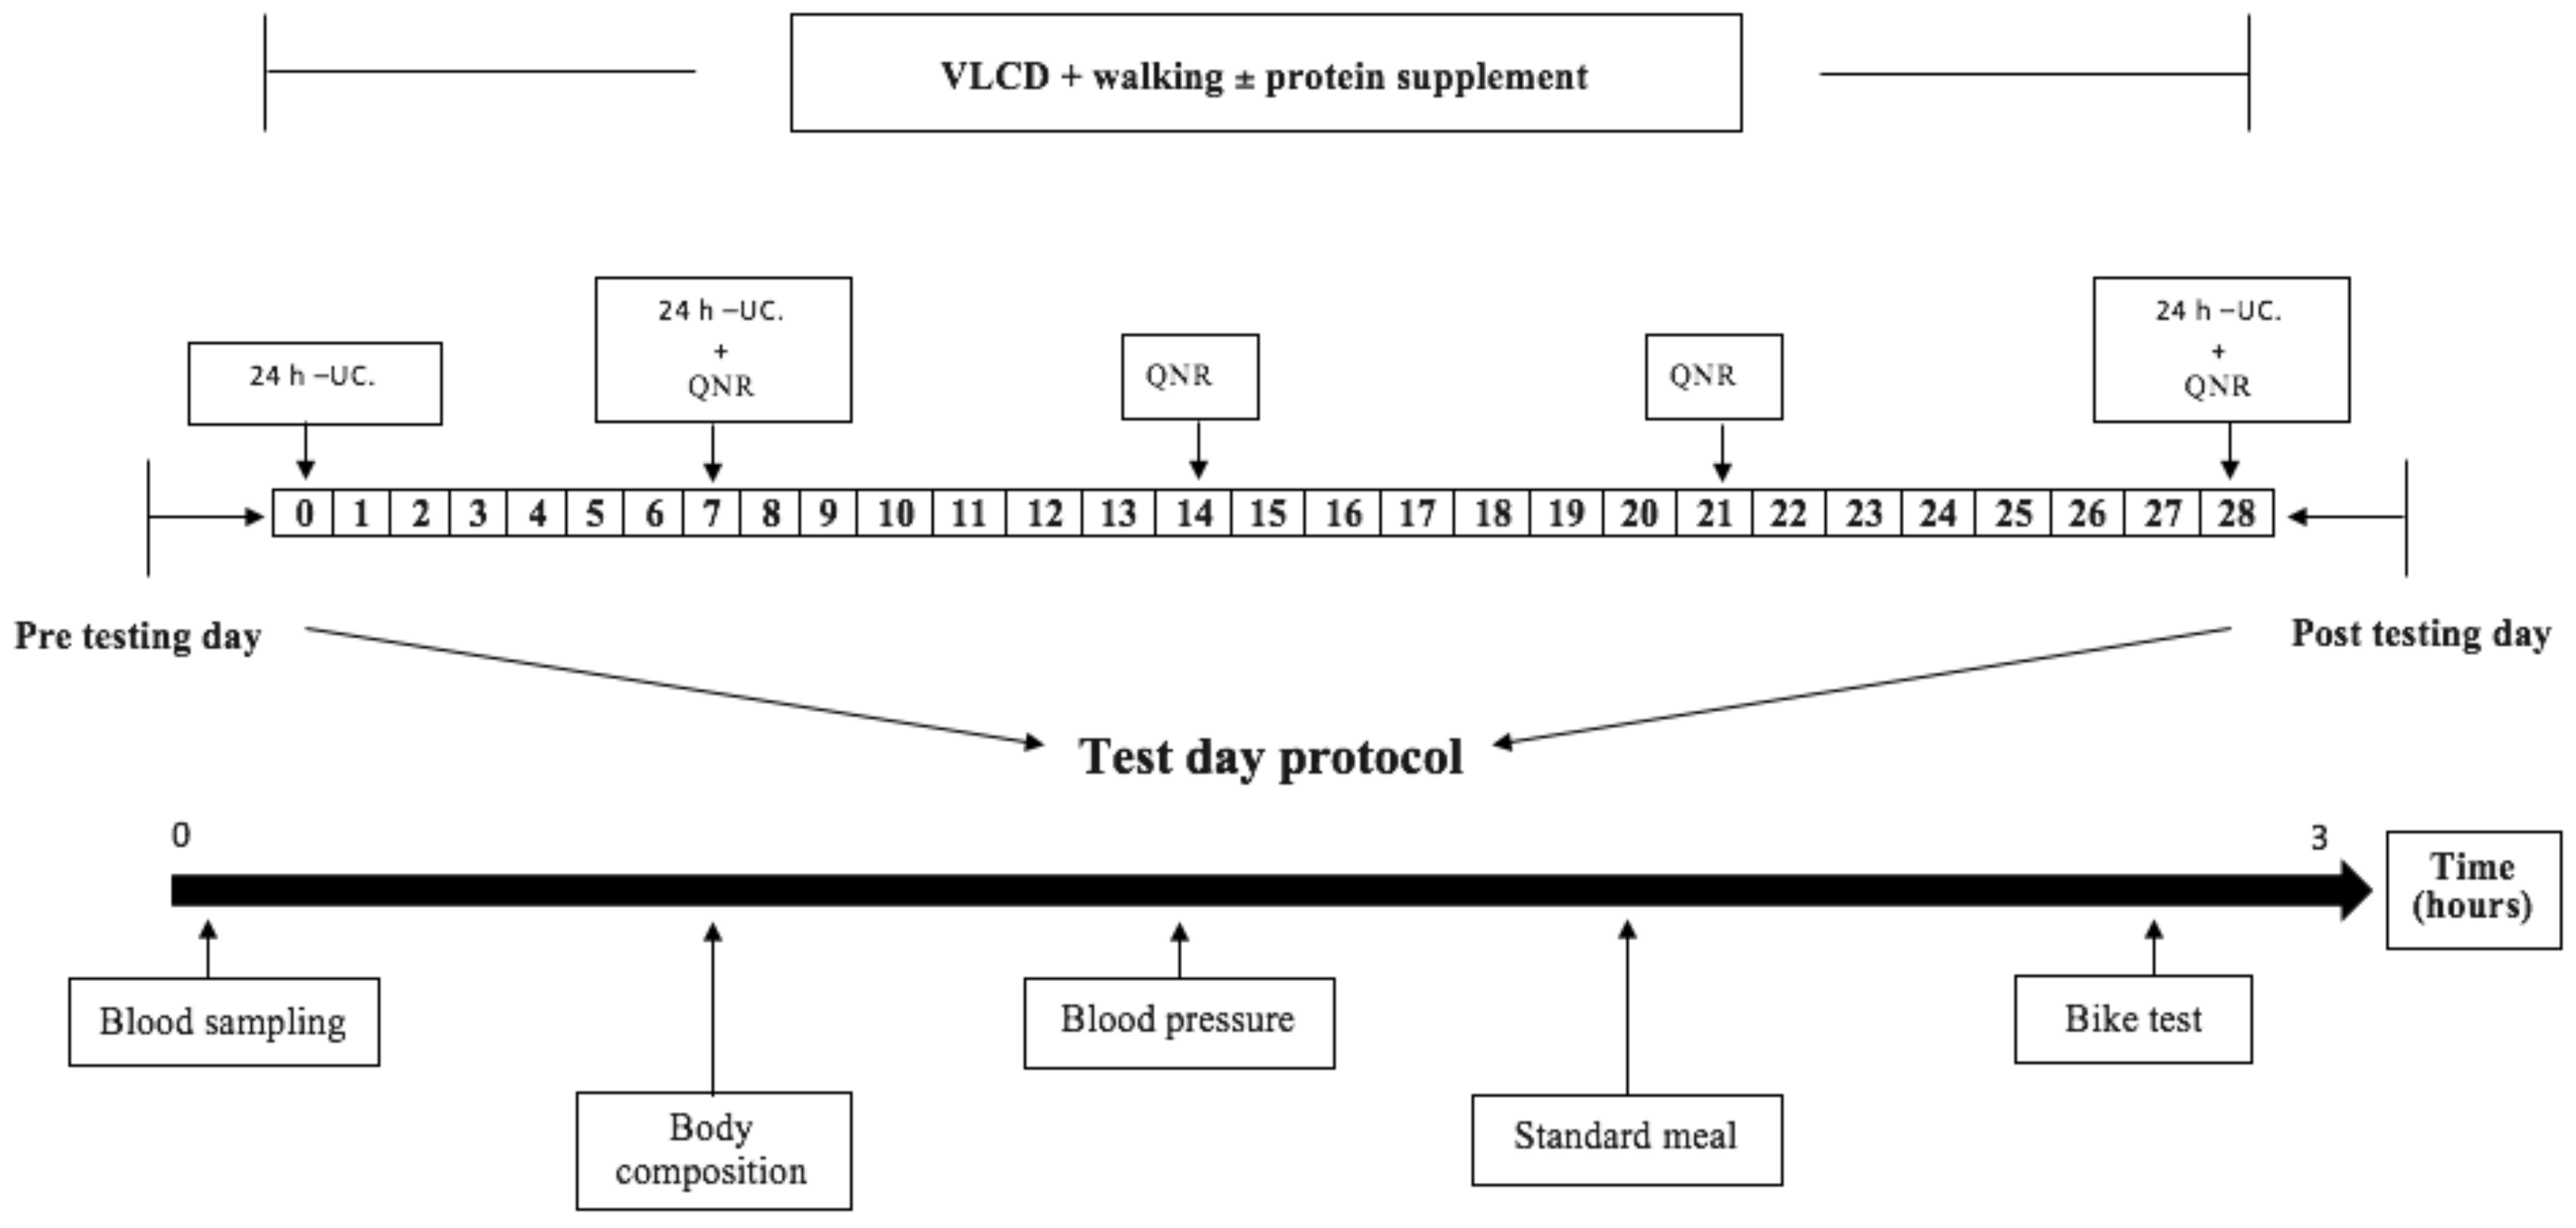
2.1. Design
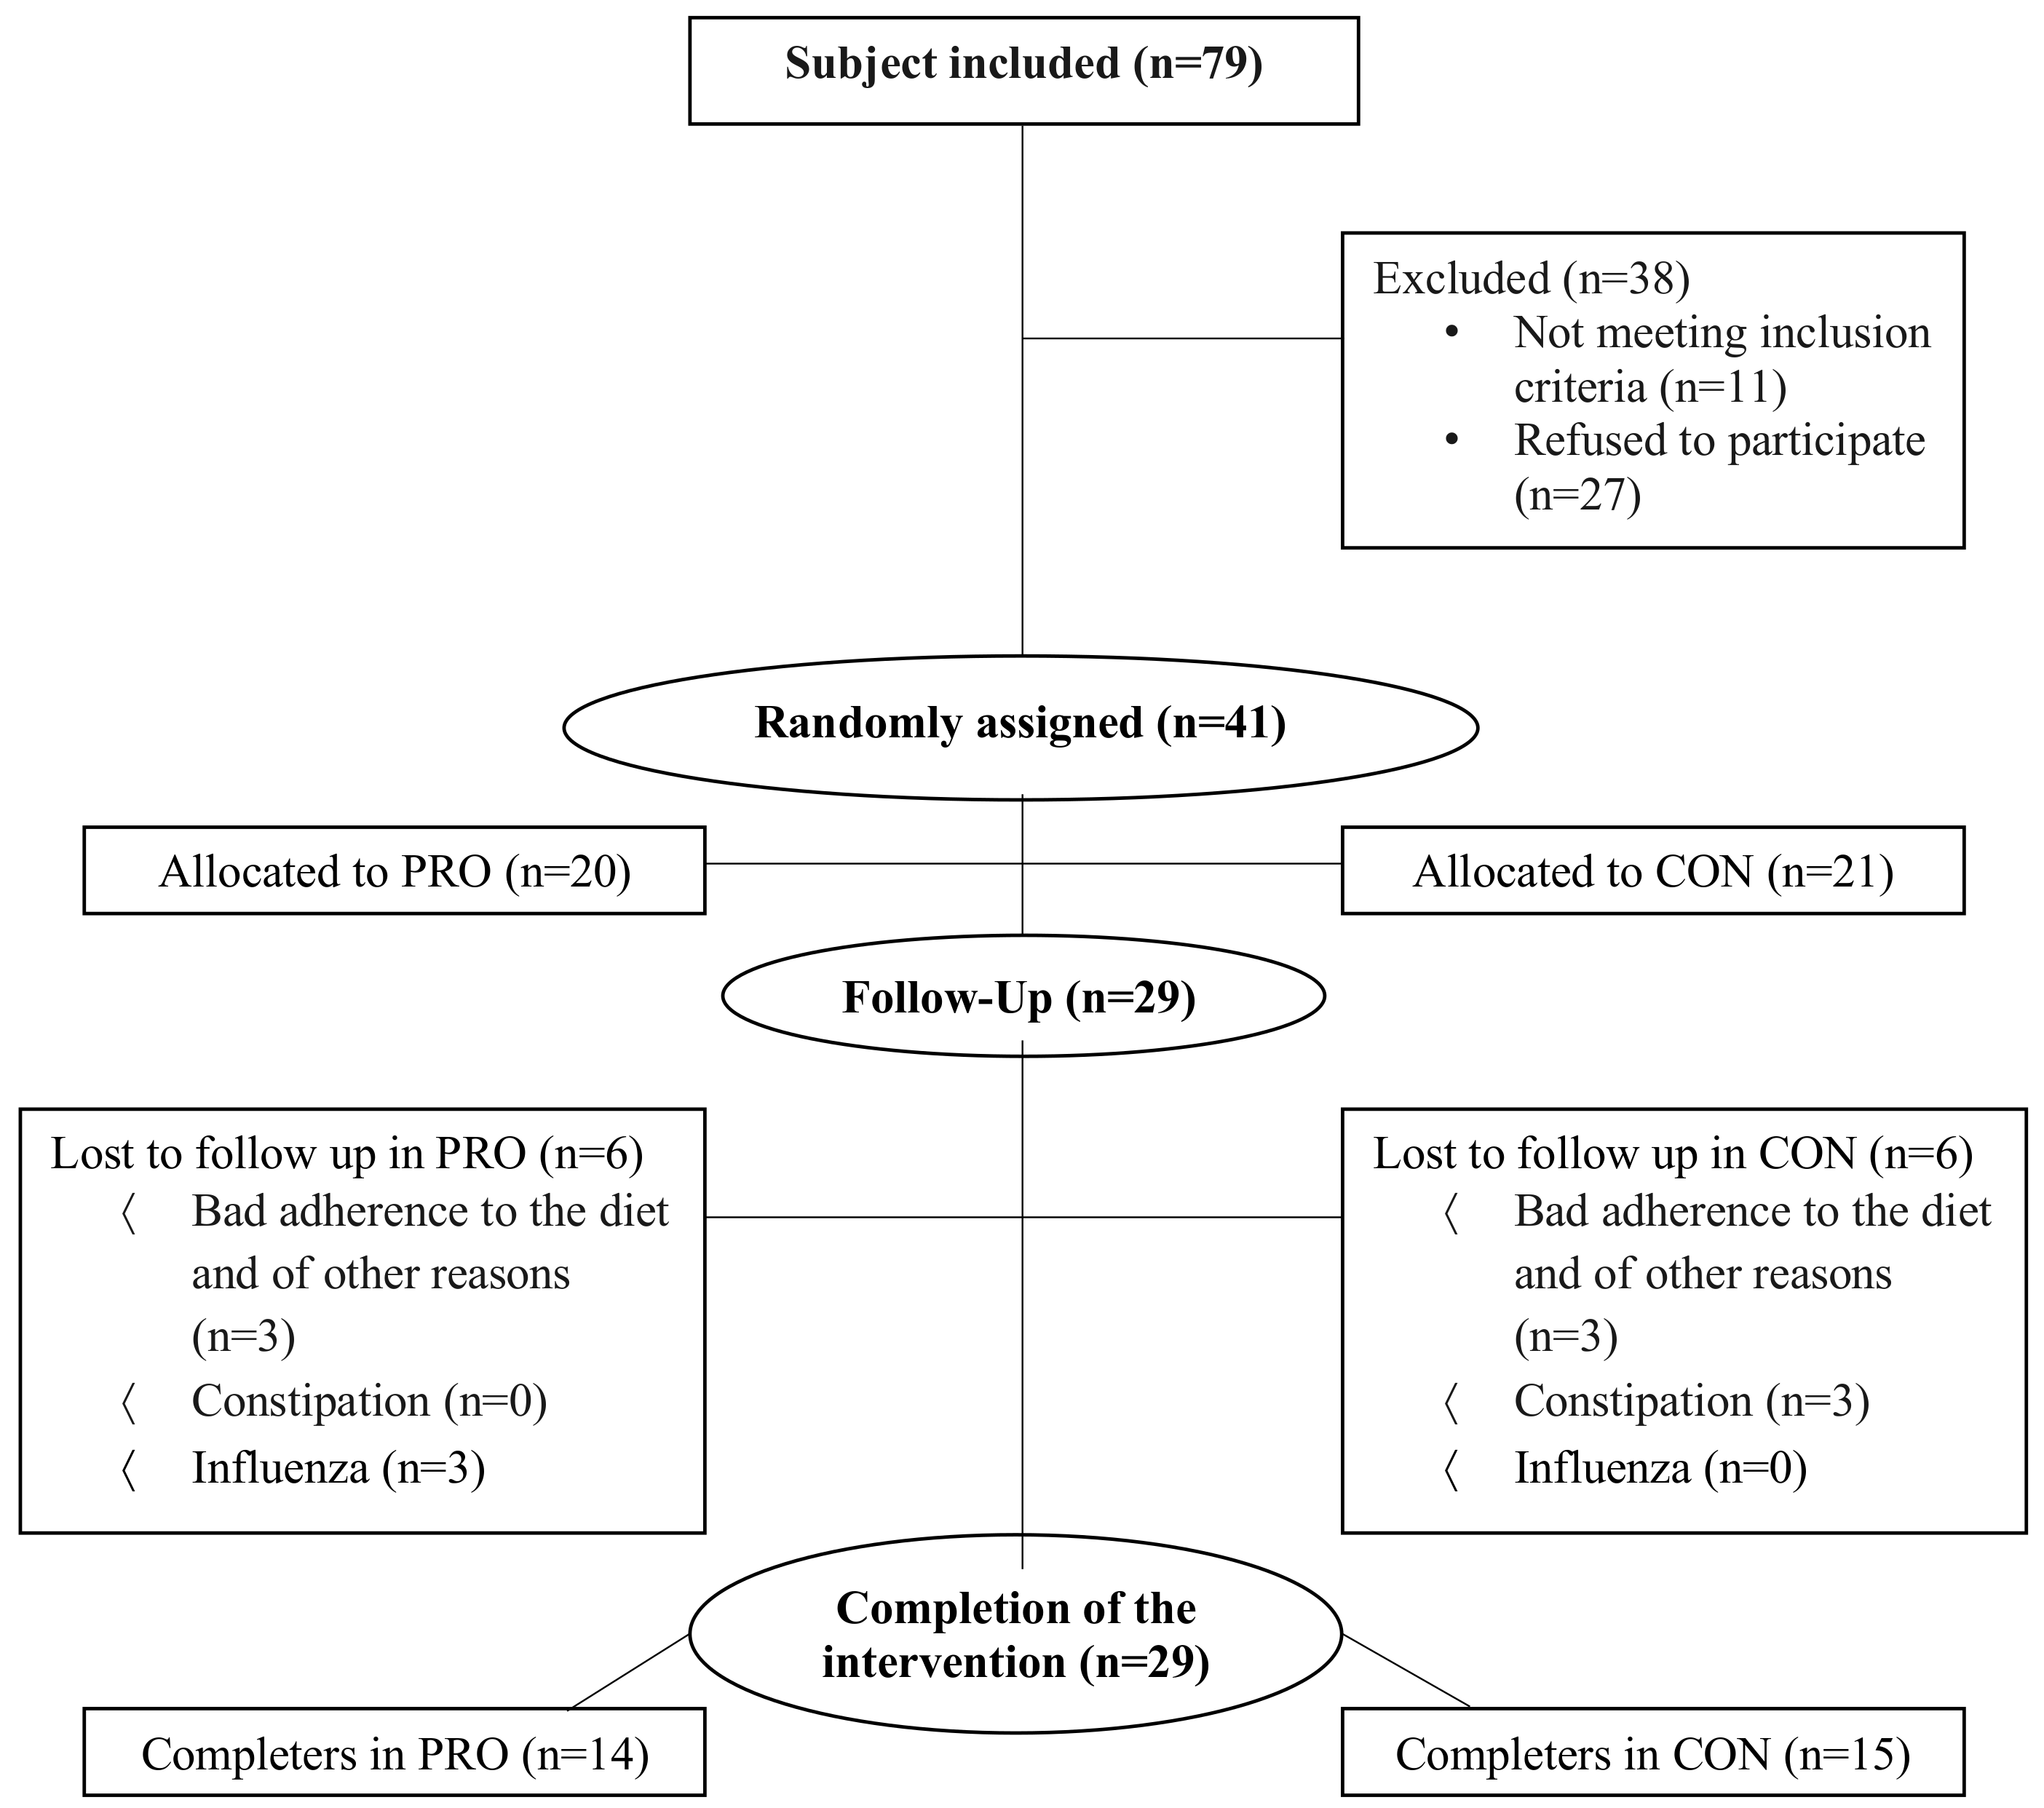
2.2. Subjects
2.3. Diet
2.4. Exercise Training
2.5. Experimental Days before and after the Intervention Period
2.6. Statistical Analysis
3. Results
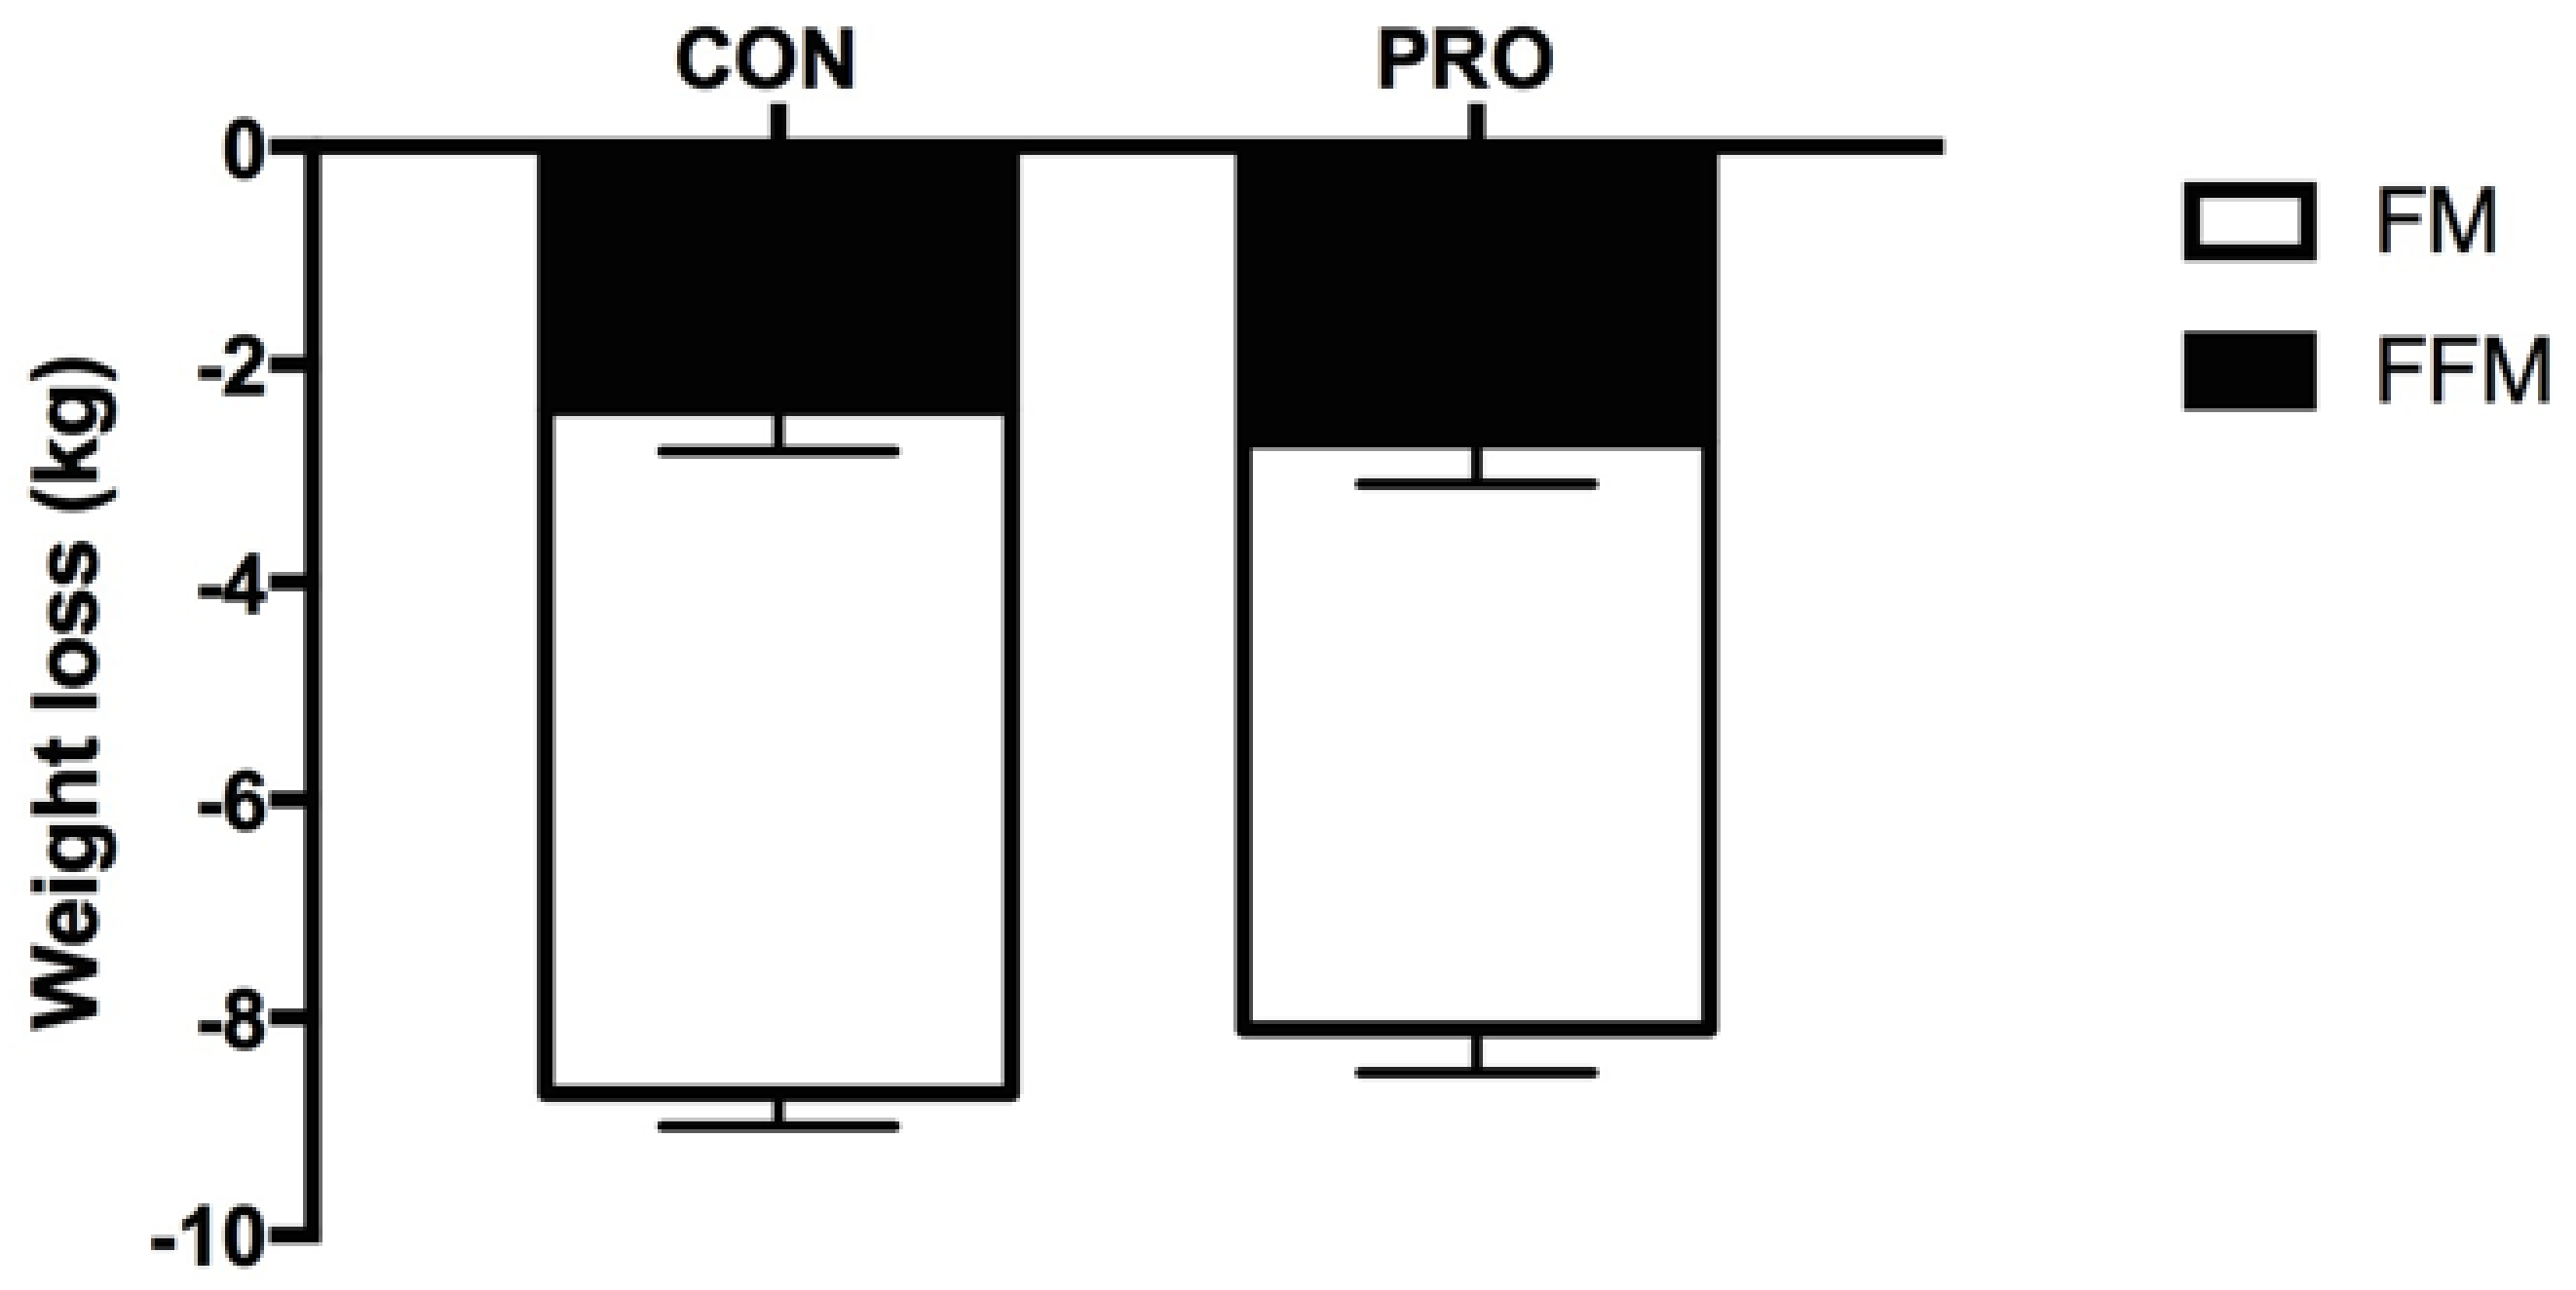
3.1. Body Composition
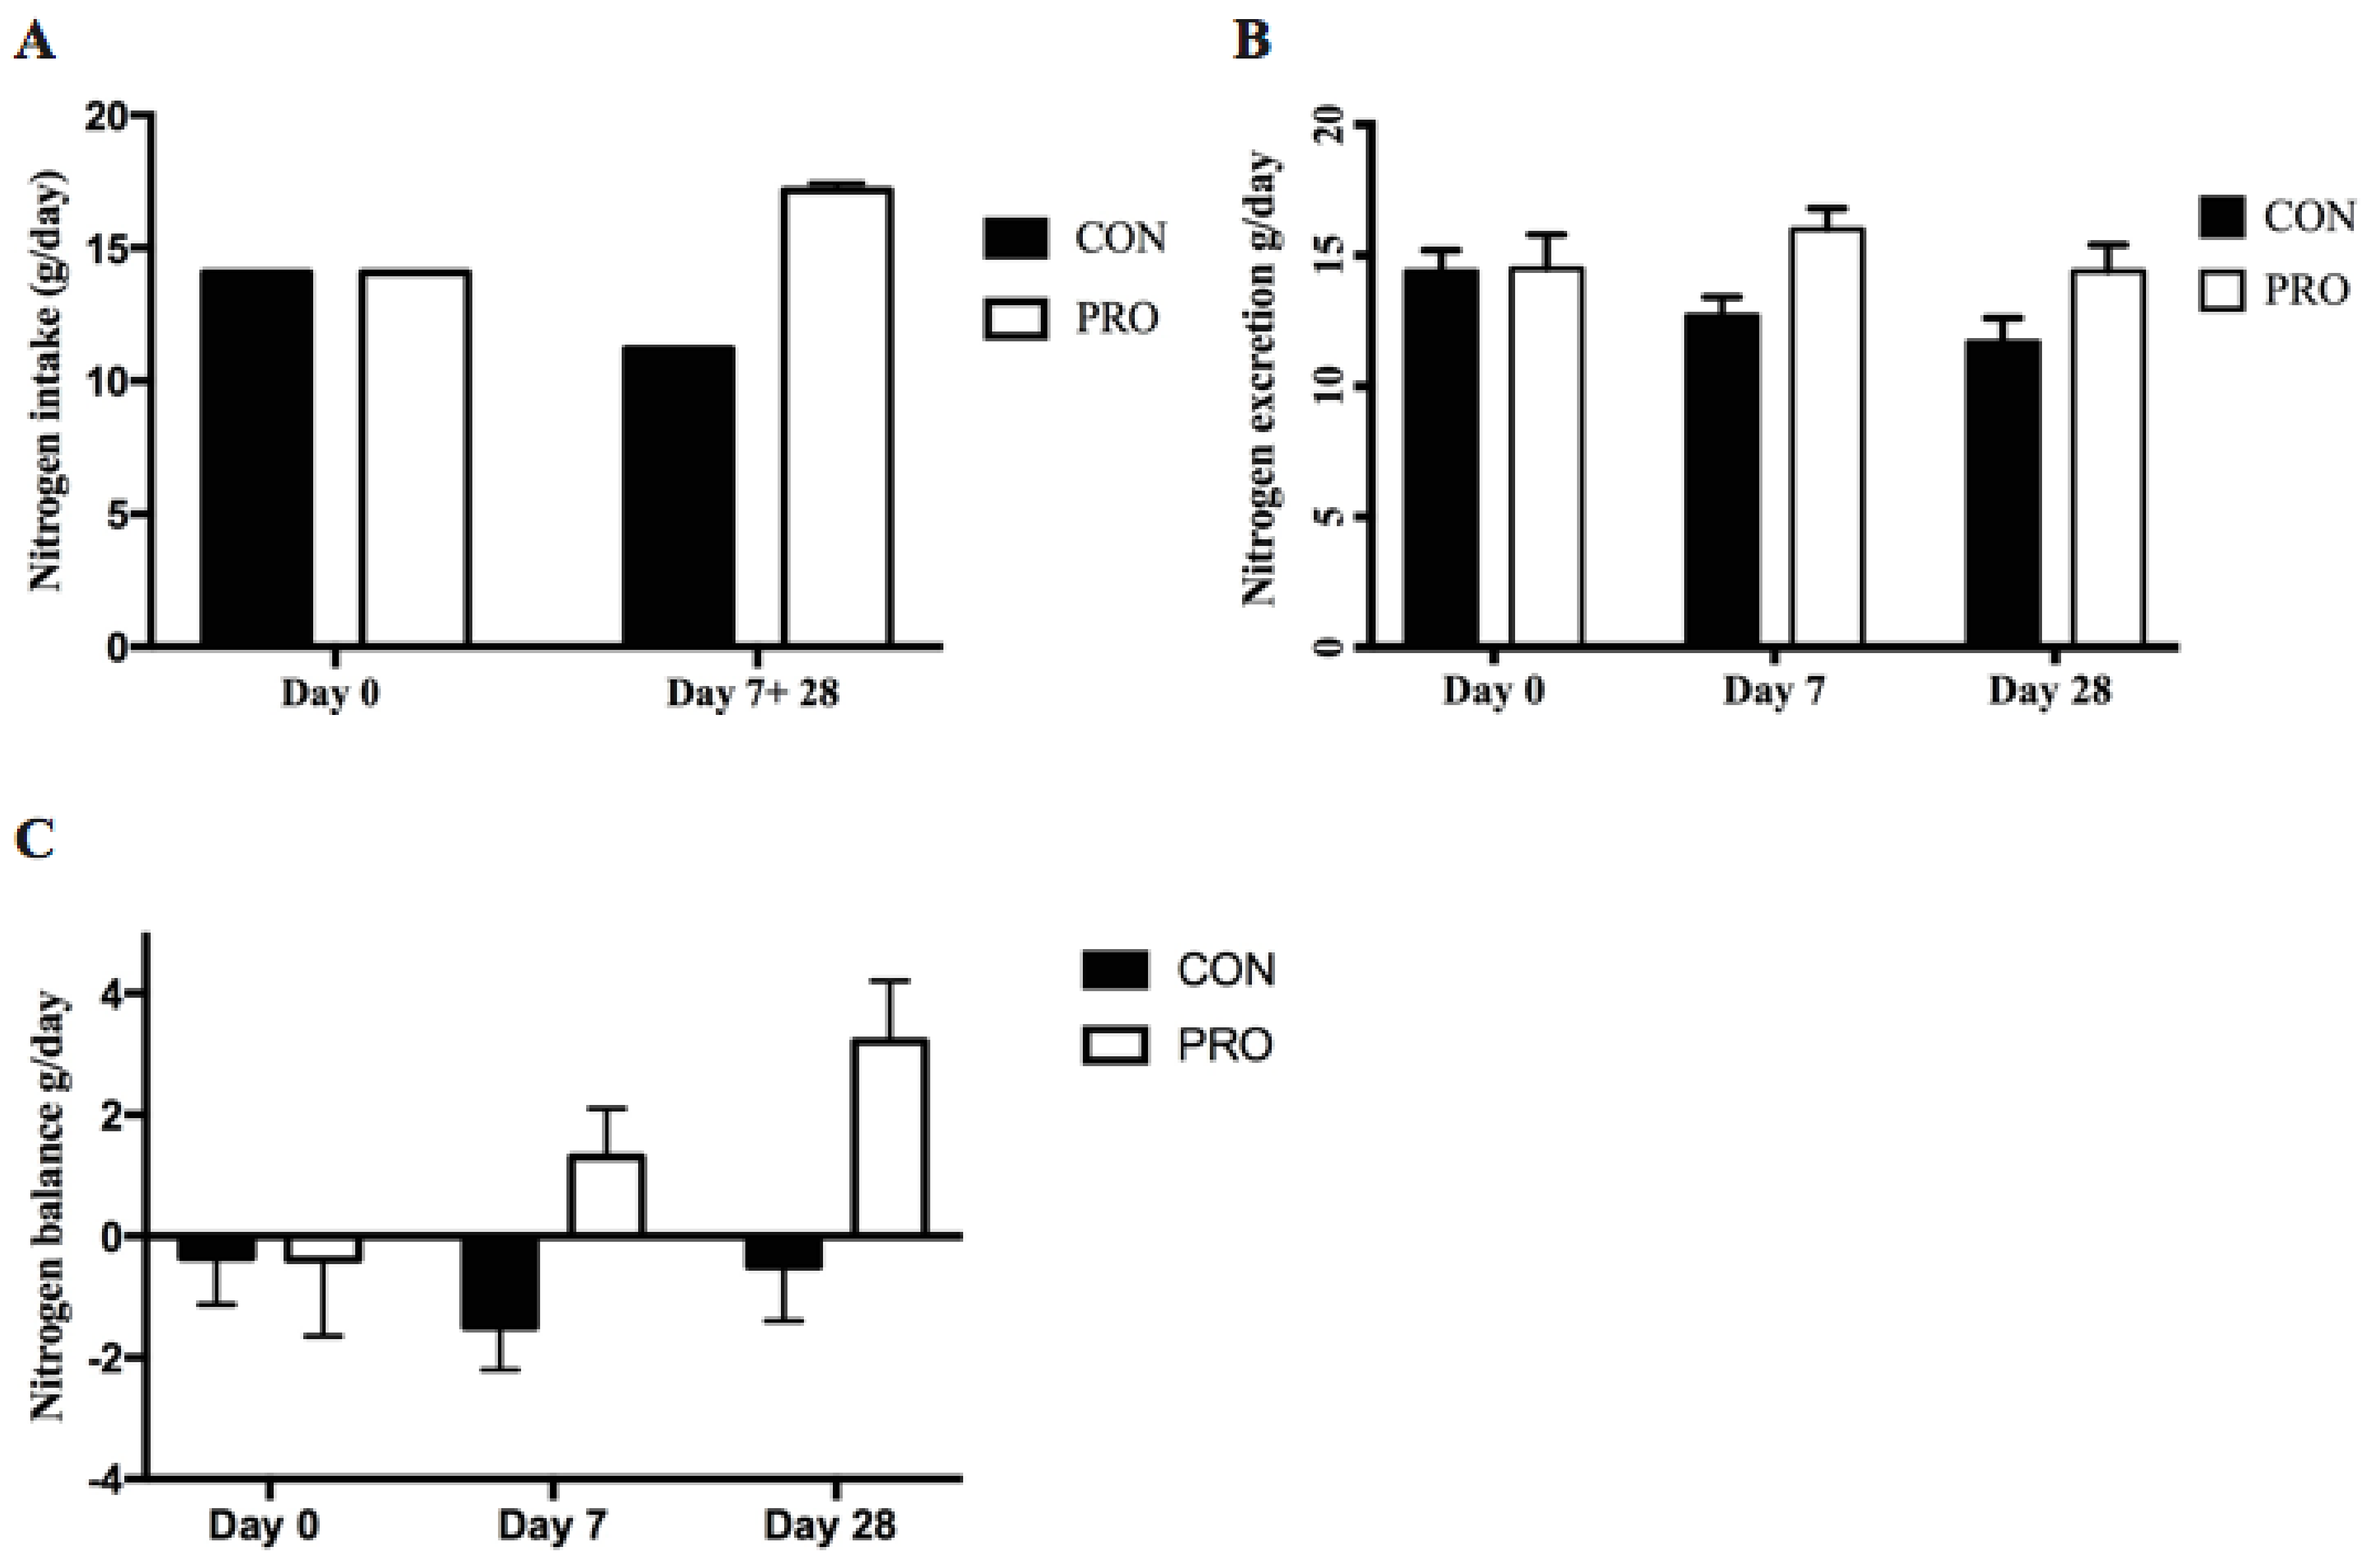
3.2. Nitrogen Balance
3.3. Blood Parameters
3.4. Blood Pressure
3.5. Aerobic Capacity
4. Discussion
4.1. Body Weight and Fat Mass
4.2. Effect of Protein Supplement on Nitrogen Balance and Fat Free Mass
4.3. Effect of Walking Intervention on Fat Free Mass
4.4. Effect of the Intervention on Fitness and Health Parameters
4.5. Limitations
4.6. Future Directions
4.7. Conclusions
Author Contributions
Funding
Acknowledgments
Conflicts of Interest
References
- Eston, R.G.; Shephard, S.; Kreitzman, S.; Coxon, A.; Brodie, D.A.; Lamb, K.L.; Baltzopoulos, V. Effect of very low calorie diet on body composition and exercise response in sedentary women. Eur. J. Appl. Physiol. Occup. Physiol. 1992, 65, 452–458. [Google Scholar] [CrossRef] [PubMed]
- Murphy, C.H.; Hector, A.J.; Phillips, S.M. Considerations for protein intake in managing weight loss in athletes. Eur. J. Sport Sci. 2015, 15, 21–28. [Google Scholar] [CrossRef] [PubMed]
- Pedersen, B.K.; Febbraio, M.A. Muscles, exercise and obesity: Skeletal muscle as a secretory organ. Nat. Rev. Endocrinol. 2012, 8, 457–465. [Google Scholar] [CrossRef] [PubMed]
- Srikanthan, P.; Karlamangla, A.S. Muscle mass index as a predictor of longevity in older adults. Am. J. Med. 2014, 127, 547–553. [Google Scholar] [CrossRef] [PubMed]
- Wannamethee, S.G.; Shaper, A.G.; Lennon, L.; Whincup, P.H. Decreased muscle mass and increased central adiposity are independently related to mortality in older men. Am. J. Clin. Nutr. 2007, 86, 1339–1346. [Google Scholar] [CrossRef] [Green Version]
- Zamboni, M.; Mazzali, G.; Zoico, E.; Harris, T.B.; Meigs, J.B.; Di Francesco, V.; Fantin, F.; Bissoli, L.; Bosello, O. Health consequences of obesity in the elderly: A review of four unresolved questions. Int. J. Obes. 2005, 29, 1011–1029. [Google Scholar] [CrossRef] [PubMed]
- Snel, M.; Gastaldelli, A.; Ouwens, D.M.; Hesselink, M.K.; Schaart, G.; Buzzigoli, E.; Frolich, M.; Romijn, J.A.; Pijl, H.; Meinders, A.E.; et al. Effects of adding exercise to a 16-week very low-calorie diet in obese, insulin-dependent type 2 diabetes mellitus patients. J. Clin. Endocrinol. Metab. 2012, 97, 2512–2520. [Google Scholar] [CrossRef]
- Ross, A.C.; Caballero, B.H.; Cousins, R.J.; Tucker, K.L.; Ziegler, T.R. Modern Nutrition in Health and Disease: Eleventh edition; Wolters Kluwer Health Adis (ESP): Alphen aan den Rijn, The Netherlands, 2012. [Google Scholar]
- Pasiakos, S.M.; Cao, J.J.; Margolis, L.M.; Sauter, E.R.; Whigham, L.D.; McClung, J.P.; Rood, J.C.; Carbone, J.W.; Combs, G.F., Jr.; Young, A.J. Effects of high-protein diets on fat-free mass and muscle protein synthesis following weight loss: A randomized controlled trial. FASEB J. 2013, 27, 3837–3847. [Google Scholar] [CrossRef] [PubMed]
- Paddon-Jones, D.; Sheffield-Moore, M.; Urban, R.J.; Sanford, A.P.; Aarsland, A.; Wolfe, R.R.; Ferrando, A.A. Essential amino acid and carbohydrate supplementation ameliorates muscle protein loss in humans during 28 days bedrest. J. Clin. Endocrinol. Metab. 2004, 89, 4351–4358. [Google Scholar] [CrossRef]
- Areta, J.L.; Burke, L.M.; Ross, M.L.; Camera, D.M.; West, D.W.; Broad, E.M.; Jeacocke, N.A.; Moore, D.R.; Stellingwerff, T.; Phillips, S.M.; et al. Timing and distribution of protein ingestion during prolonged recovery from resistance exercise alters myofibrillar protein synthesis. J. Physiol. 2013, 591, 2319–2331. [Google Scholar] [CrossRef] [Green Version]
- Res, P.T.; Groen, B.; Pennings, B.; Beelen, M.; Wallis, G.A.; Gijsen, A.P.; Senden, J.M.; van Loon, L.J. Protein ingestion before sleep improves postexercise overnight recovery. Med. Sci. Sports Exerc. 2012, 44, 1560–1569. [Google Scholar] [CrossRef] [PubMed]
- Kraemer, W.; Volek, J.S.; Clark, K.L.; Gordon, S.E.; Puhl, S.M.; Koziris, L.P.; McBride, J.M.; Triplett-McBride, N.T.; Putukian, M.; Newton, R.U.; et al. Influence of exercise training on physiological and performance changes with weight loss in men. Med. Sci. Sports Exerc. 1999, 31, 1320–1329. [Google Scholar] [CrossRef] [PubMed]
- Donnelly, J.E.; Pronk, N.P.; Jacobsen, D.J.; Pronk, S.J.; Jakicic, J.M. Effects of a very-low-calorie diet and physical-training regimens on body composition and resting metabolic rate in obese females. Am. J. Clin. Nutr. 1991, 54, 56–61. [Google Scholar] [CrossRef] [PubMed]
- World Health Organization. Waist Circumference and Waist-Hip Ratio; World Health Organization: Geneva, Switzerland, 2011. [Google Scholar]
- Frayn, K.N. Metabolic Regulation—A Human Perspective, 3rd ed.; Wiley Blackwell: Hoboken, NJ, USA, 2010. [Google Scholar]
- Kos, S.; van Meerkerk, A.; van der Linden, J.; Stiphout, T.; Wulkan, R. Validation of a new generation POCT glucose device with emphasis on aspects important for glycemic control in the hospital care. Clin. Chem. Lab. Med. 2012, 50, 1573–1580. [Google Scholar] [CrossRef] [PubMed]
- Reddy, V.R.S.; Sumathi, M.E.; Gowda, Y.C.B.; Suhail, S.M. Comparison of Point of Care (POC) Testing of Glucose by B Braun Glucometer and Hemocue Glucose 201+ Analyser Versus Centralised Testing in Neonatal Intensive Care Unit (NICU). J. Clin. Diagn. Res. 2014, 8, Pc10-3. [Google Scholar]
- Luley, C.; Ronquist, G.; Reuter, W.; Paal, V.; Gottschling, H.D.; Westphal, S.; King, G.L.; Bakker, S.J.; Heine, R.J.; Hattemer, A. Point-of-care testing of triglycerides: Evaluation of the Accutrend triglycerides system. Clin. Chem. 2000, 46, 287–291. [Google Scholar] [PubMed]
- Coqueiro Rda, S.; Santos, M.C.; Neto Jde, S.; Queiroz, B.M.; Brugger, N.A.; Barbosa, A.R. Validity of a portable glucose, total cholesterol, and triglycerides multi-analyzer in adults. Biol. Res. Nurs. 2014, 16, 288–294. [Google Scholar] [CrossRef] [PubMed]
- Ceriotti, F.; Kaczmarek, E.; Guerra, E.; Mastrantonio, F.; Lucarelli, F.; Valgimigli, F.; Mosca, A. Comparative performance assessment of point-of-care testing devices for measuring glucose and ketones at the patient bedside. J. Diabetes Sci. Technol. 2015, 9, 268–277. [Google Scholar] [CrossRef]
- Ekblom, O. Testing the validity of three submaximal ergometer tests for estimating maximal aerobic capacity in children. Acta Paediatr. 2014, 103, 559–563. [Google Scholar] [CrossRef]
- Macsween, A. The reliability and validity of the Astrand nomogram and linear extrapolation for deriving VO2max from submaximal exercise data. J. Sports Med. Phys. Fit. 2001, 41, 312–317. [Google Scholar]
- Bryner, R.W.; Ullrich, I.H.; Sauers, J.; Donley, D.; Hornsby, G.; Kolar, M.; Yeater, R. Effects of resistance vs. aerobic training combined with an 800 calorie liquid diet on lean body mass and resting metabolic rate. J. Am. Coll. Nutr. 1999, 18, 115–121. [Google Scholar] [CrossRef] [PubMed]
- Farnsworth, E.; Luscombe, N.D.; Noakes, M.; Wittert, G.; Argyiou, E.; Clifton, P.M. Effect of a high-protein, energy-restricted diet on body composition, glycemic control, and lipid concentrations in overweight and obese hyperinsulinemic men and women. Am. J. Clin. Nutr. 2003, 78, 31–39. [Google Scholar] [CrossRef] [PubMed] [Green Version]
- American Diabetes Association. Standards of Medical Care in Diabetes; American Diabetes Association: Arlington, VA, USA, 2016; p. 16. [Google Scholar]
- Clemens, K.; Payne, W.; Van Uum, S.H.M. Central hypothyroidism. Can. Fam. Physician 2011, 57, 677–680. [Google Scholar] [PubMed]
- Wilcox, G. Insulin and Insulin Resistance. Clin. Biochem. Rev. 2005, 26, 19–39. [Google Scholar] [PubMed]
- Whitworth, J.A. World Health Organization (WHO)/International Society of Hypertension (ISH) statement on management of hypertension. J. Hypertens. 2003, 21, 1983–1992. [Google Scholar] [PubMed]
- Mikkelsen, P.B. Effect of fat-reduced diets on 24-h energy expenditure:comparisons between animal protein, vegetable protein and carbohydrate. Am. J. Clin. Nutr. 2000, 72, 1135–1141. [Google Scholar] [CrossRef] [PubMed]
- Fothergill, E.; Guo, J.; Howard, L.; Kerns, J.C.; Knuth, N.D.; Brychta, R.; Chen, K.Y.; Skarulis, M.C.; Walter, M.; Walter, P.J.; et al. Persistent metabolic adaptation 6 years after “The Biggest Loser” competition. Obesity 2016, 24, 1612–1619. [Google Scholar] [CrossRef] [Green Version]
- Agnihothri, R.V.; Courville, A.B.; Linderman, J.D.; Smith, S.; Brychta, R.; Remaley, A.; Chen, K.Y.; Simchowitz, L.; Celi, F.S. Moderate weight loss is sufficient to affect thyroid hormone homeostasis and inhibit its peripheral conversion. Thyroid 2014, 24, 19–26. [Google Scholar] [CrossRef]
- Borup, D.V. Biokemi. In Biokemi, 1st ed.; FADL’s Forlag: Copenhagen, Denmark, 2010. [Google Scholar]
- Baba, N.H.; Sawaya, S.; Torbay, N.; Habbal, Z.; Azar, S.; Hashim, S.A. High protein vs high carbohydrate hypoenergetic diet for the treatment of obese hyperinsulinemic subjects. Int. J. Obes. Relat. Metab. Disord. 1999, 23, 1202–1206. [Google Scholar] [CrossRef]
- Manninen, A.H. Very-low-carbohydrate diets and preservation of muscle mass. Nutr. Metab. 2006, 3, 9. [Google Scholar] [CrossRef] [PubMed]
- Snijders, T.; Res, P.T.; Smeets, J.S.; van Vliet, S.; van Kranenburg, J.; Maase, K.; Kies, A.K.; Verdijk, L.B.; van Loon, L.J. Protein Ingestion before Sleep Increases Muscle Mass and Strength Gains during Prolonged Resistance-Type Exercise Training in Healthy Young Men. J. Nutr. 2015, 145, 1178–1184. [Google Scholar] [CrossRef] [PubMed] [Green Version]
- Longland, T.M.; Oikawa, S.Y.; Mitchell, C.J.; Devries, M.C.; Phillips, S.M. Higher compared with lower dietary protein during an energy deficit combined with intense exercise promotes greater lean mass gain and fat mass loss: A randomized trial. Am. J. Clin. Nutr. 2016, 103, 738–746. [Google Scholar] [CrossRef] [PubMed]
- Weinheimer, E.M.; Sands, L.P.; Campbell, W.W. A systematic review of the separate and combined effects of energy restriction and exercise on fat-free mass in middle-aged and older adults: Implications for sarcopenic obesity. Nutr. Rev. 2010, 68, 375–388. [Google Scholar] [CrossRef] [PubMed]
- Josse, A.R.; Atkinson, S.A.; Tarnopolsky, M.A.; Phillips, S.M. Increased consumption of dairy foods and protein during diet- and exercise-induced weight loss promotes fat mass loss and lean mass gain in overweight and obese premenopausal women. J. Nutr. 2011, 141, 1626–1634. [Google Scholar] [CrossRef] [PubMed]
- Mettler, S.; Mitchell, N.; Tipton, K.D. Increased protein intake reduces lean body mass loss during weight loss in athletes. Med. Sci. Sports Exerc. 2010, 42, 326–337. [Google Scholar] [CrossRef] [PubMed]
- Leidy, H.J.; Carnell, N.S.; Mattes, R.D.; Campbell, W.W. Higher protein intake preserves lean mass and satiety with weight loss in pre-obese and obese women. Obesity 2007, 15, 421–429. [Google Scholar] [CrossRef]
- Weijs, P.J.; Wolfe, R.R. Exploration of the protein requirement during weight loss in obese older adults. Clin. Nutr. 2016, 35, 394–398. [Google Scholar] [CrossRef]
- Hector, A.J.; Marcotte, G.R.; Churchward-Venne, T.A.; Murphy, C.H.; Breen, L.; von Allmen, M.; Baker, S.K.; Phillips, S.M. Whey protein supplementation preserves postprandial myofibrillar protein synthesis during short-term energy restriction in overweight and obese adults. J. Nutr. 2015, 145, 246–252. [Google Scholar] [CrossRef]
- Watson, N.; Dyer, K.; Buckley, J.; Brinkworth, G.; Coates, A.; Parfitt, G.; Howe, P.; Noakes, M.; Murphy, K. Effects of Low-Fat Diets Differing in Protein and Carbohydrate Content on Cardiometabolic Risk Factors during Weight Loss and Weight Maintenance in Obese Adults with Type 2 Diabetes. Nutrients 2016, 8, 289. [Google Scholar] [CrossRef]
- Chaston, T.B.; Dixon, J.B.; O’Brien, P.E. Changes in fat-free mass during significant weight loss: A systematic review. Int. J. Obes. 2007, 31, 743–750. [Google Scholar] [CrossRef]
- Krieger, J.W.; Sitren, H.S.; Daniels, M.J.; Langkamp-Henken, B. Effects of variation in protein and carbohydrate intake on body mass and composition during energy restriction: A meta-regression 1. Am. J. Clin. Nutr. 2006, 83, 260–274. [Google Scholar] [CrossRef] [PubMed]
- Ballor, D.L.; Poehlman, E.T. Exercise-training enhances fat-free mass preservation during diet-induced weight loss: A meta-analytical finding. Int. J. Obes. Relat. Metab. Disord. 1994, 18, 35–40. [Google Scholar]
- Murphy, M.H.; Nevill, A.M.; Murtagh, E.M.; Holder, R.L. The effect of walking on fitness, fatness and resting blood pressure: A meta-analysis of randomised, controlled trials. Prev. Med. 2007, 44, 377–385. [Google Scholar] [CrossRef] [PubMed]
- Dengel, D.R.; Hagberg, J.M.; Coon, P.J.; Drinkwater, D.T.; Goldberg, A.P. Effects of weight loss by diet alone or combined with aerobic exercise on body composition in older obese men. Metab. Clin. Exp. 1994, 43, 867–871. [Google Scholar] [CrossRef]
- Cicero, A.F.; Benelli, M.; Brancaleoni, M.; Dainelli, G.; Merlini, D.; Negri, R. Middle and Long-Term Impact of a Very Low-Carbohydrate Ketogenic Diet on Cardiometabolic Factors: A Multi-Center, Cross-Sectional, Clinical Study. High Blood Press. Cardiovasc. Prev. 2015, 22, 389–394. [Google Scholar] [CrossRef] [PubMed] [Green Version]
- Noren, E.; Forssell, H. Very low calorie diet without aspartame in obese subjects: Improved metabolic control after 4 weeks treatment. Nutr. J. 2014, 13, 77. [Google Scholar] [CrossRef] [PubMed]
- Kahn, B.B.; Flier, J.S. Obesity and insulin resistance. J. Clin. Investig. 2000, 106, 473–481. [Google Scholar] [CrossRef] [Green Version]
- Poirier, P.; Giles, T.D.; Bray, G.A.; Hong, Y.; Stern, J.S.; Pi-Sunyer, F.X.; Eckel, R.H. Obesity and cardiovascular disease: Pathophysiology, evaluation, and effect of weight loss. Arterioscler. Thromb. Vasc. Biol. 2006, 26, 968–976. [Google Scholar] [CrossRef]
- Endocrine Society. Overweight Men Can Boost Low Testosterone Levels by Losing Weight; Science Daily: Rockville, MD, USA, 2012. [Google Scholar]
- Mathias, J.K.; Liu, Y.; Stein, H.H. Values for digestible indispensable amino acid scores (DIAAS) for some dairy and plant proteins may better describe protein quality than values calculated using the concept for protein digestibility-corrected amino acid scores (PDCAAS). Br. J. Nutr. 2017, 117, 490–499. [Google Scholar]
- Devries, M.C.; Phillips, S.M. Supplemental protein in support of muscle mass and health: Advantage whey. J. Food Sci. 2015, 80 (Suppl. 1), A8–A15. [Google Scholar] [CrossRef]
- Boirie, Y.; Danjin, M.; Gachon, P.; Vasson, M.P.; Maubois, J.L.; Beaufrére, B. Slow and fast dietary proteins differently modulate postprandial protein accretion. Proc. Natl. Acad. Sci. USA 1997, 94, 14930–14935. [Google Scholar] [CrossRef] [PubMed] [Green Version]
- Abdulla, H.; Smith, K.; Atherton, P.J.; Idris, I. Role of insulin in the regulation of human skeletal muscle protein synthesis and breakdown: A systematic review and meta-analysis. Diabetologia 2016, 59, 44–55. [Google Scholar] [CrossRef] [PubMed]

| CON | PRO | ||||
|---|---|---|---|---|---|
| Nutrient Content | VLCD | Protein Supplement | VLCD + Supplement | ||
| Energy (kJ/kcal) | 2906/690 | 895/211 | 3801/902 | ||
| Protein (g/day) | 70 | 41.3 | [30.8; 52.4] | 111.3 | [100.8; 122.4] |
| Fat (g/day) | 15 | 3.3 | [2.5; 4.2] | 18.3 | [17.5; 19.2] |
| Carbohydrate (g/day) | 80 | 3.6 | [2.7; 4.6] | 83.6 | [82.7; 84.6] |
| Fiber (g) | 20.4 | 0.4 | [0.2; 0.5] | 20.8 | [20.6; 20.9] |
| Control | Protein | Df Groups | Control | Protein | Interaction | |||||
|---|---|---|---|---|---|---|---|---|---|---|
| Weight (kg) | 102.1 | [9.5; 10,9] | 102.6 | [92.7; 112.5] | 0.92 | −8.7 | [7.8; 9.7] | −8.1 | [6.7; 9.6] * | 0.47 |
| BMI (kg/m2) | 35.1 | [32.5; 38.3] | 34.9 | [32.2; 37.6] | 0.99 | −3.2 | [2,8; 3.6] | −2.7 | [2.4; 3.1] * | 0.18 |
| FFM (kg) | 59.0 | [52.0; 61.0] | 57.2 | [50.9; 63.5] | 0.62 | −2.4 | [1.6; 3.2] | −2.7 | [1.7; 3.6] * | 0.65 |
| Body Fat (%) | 41.9 | [37.5; 46.2] | 44.1 | [40.0; 48.1] | 0.43 | −3.0 | [0.2; 0.4] | −2.2 | [1.3; 3.0] * | 0.35 |
| Android Fat (%) | 52.3 | [47.8; 56.8] | 54.6 | [50.6; 58.5] | 0.42 | −4.6 | [0.3; 0.6] | −3.4 | [1.8; 5.1] * | 0.26 |
| Gynoid Fat (%) | 41.6 | [36.1; 47.1] | 45.9 | [40.7; 51.0] | 0.23 | −2.3 | [1.5; 3.0] | −1.9 | [0.1; −0.2] * | 0.35 |
| Waist c (cm) | 111.0 | [102.3; 119.3] | 105.0 | [97.9; 113.2] | 0.89 | −10.0 | [8.6; 12.2] | −8.0 | [5.9; 9.8] | 0.05 |
| Hip c (cm) | 120.0 | [113.6; 126.5] | 121.0 | 114.1; 127.3] | 0.89 | −6.0 | [3.6; 7.3] | −6.0 | [4.8; 7.2] * | 0.62 |
| Control | Protein | Df Groups | Control | Protein | Interaction | |||||
|---|---|---|---|---|---|---|---|---|---|---|
| SBP (mmHg) | 139.0 | [131.5; 146.9] | 138.0 | [125.1; 151.2] | 0.88 | −15.0 | [8.3; 21.2] * | −18.0 | [12.3; 23.4] * | 0.44 |
| DBP (mmHg) | 87.0 | 80.7; 92.5] | 88.0 | [69.2; 80.2] | 0.68 | −8.0 | [3.3; 12.3] # | −14.0 | [8.5; 18.8] * | 0.08 |
| Chol (mmol/L) | 5.1 | [4.5; 5.6] | 5.3 | [4.6; 5.9] | 0.66 | −0.6 | [0.1; 1.0] # | −1.1 | [0.7; 1.6] * | 0.08 |
| Ketones (mM) | 0.1 | [0.1; 0.2] | 0.1 | [0.1; 0.2] | 0.85 | 0.3 | [0.0; 0.8] # | 0.5 | [0.2; 0.8] * | 0.27 |
| Glucose (mmol/L) | 5.9 | [5.4; 6.4] | 5.4 | [5.0; 5.9] | 0.13 | −0.7 | [0.4; 1.1] # | 0.1 | [−0.8; 0.5] | 0.02 |
| Testo (nmol/L) | 15.9 | [10.2; 21.6] | 11.1 | [6.2; 16.0] | 0.30 | 8.8 | [1.5; 19.05] # | 2.8 | [0.9; 4.7] # | 0.32 |
| Estradiol (pmol/L) | 232 | [−232; 695] | 176 | [61; 291] | 0.68 | 158 | [−221; 536] | −9 | [−170; 188] | 0.77 |
| T3 (pmol/L) | 5.8 | [5.3; 6.3] | 5.4 | [5.0; 5.8] | 0.05 | −0.6 | [0.1; 1.1] * | −0.8 | [0.4; 1.3] * | 0.60 |
| Insulin (pmol/L) | 139.7 | [73.8; 204.3] | 118.0 | [50.1; 186.0] | 0.28 | −75.4 | [19.6; 72.6] * | −43.7 | [−83.4; −4.1] # | 0.18 |
© 2018 by the authors. Licensee MDPI, Basel, Switzerland. This article is an open access article distributed under the terms and conditions of the Creative Commons Attribution (CC BY) license (http://creativecommons.org/licenses/by/4.0/).
Share and Cite
Larsen, A.E.; Bibby, B.M.; Hansen, M. Effect of a Whey Protein Supplement on Preservation of Fat Free Mass in Overweight and Obese Individuals on an Energy Restricted Very Low Caloric Diet. Nutrients 2018, 10, 1918. https://0-doi-org.brum.beds.ac.uk/10.3390/nu10121918
Larsen AE, Bibby BM, Hansen M. Effect of a Whey Protein Supplement on Preservation of Fat Free Mass in Overweight and Obese Individuals on an Energy Restricted Very Low Caloric Diet. Nutrients. 2018; 10(12):1918. https://0-doi-org.brum.beds.ac.uk/10.3390/nu10121918
Chicago/Turabian StyleLarsen, Anne Ellegaard, Bo Martin Bibby, and Mette Hansen. 2018. "Effect of a Whey Protein Supplement on Preservation of Fat Free Mass in Overweight and Obese Individuals on an Energy Restricted Very Low Caloric Diet" Nutrients 10, no. 12: 1918. https://0-doi-org.brum.beds.ac.uk/10.3390/nu10121918