Cognitive Functioning of Geriatric Patients: Is Hypovitaminosis D the Next Marker of Cognitive Dysfunction and Dementia?

Abstract
:1. Introduction
2. Materials and Methods
2.1. Response Variables
2.2. Patient Characteristics as Potential Explanatory Variables
2.3. Statistical Analysis
3. Results
4. Discussion
5. Conclusions
Author Contributions
Funding
Acknowledgments
Conflicts of Interest
References
- Petersen, R.C. Mild cognitive impairment. N. Engl. J. Med. 2011, 364, 2227–2234. [Google Scholar] [CrossRef] [PubMed]
- Knopman, D.S.; DeKosky, S.T.; Cummings, J.L.; Chui, H.; Corey-Bloom, J.; Relkin, N.; Small, G.W.; Miller, B.; Stevens, J.C. Practice parameter: Diagnosis of dementia (an evidence-based review). Report of the Quality Standards Subcommittee of the American Academy of Neurology. Neurology 2001, 56, 1143–1153. [Google Scholar] [CrossRef] [PubMed]
- Grant, W.B. A Review of the Evidence Supporting the Vitamin D-Cancer Prevention Hypothesis in 2017. Anticancer Res. 2018, 38, 1121–1136. [Google Scholar] [CrossRef] [PubMed]
- Park, S.M.; Li, T.; Wu, S.; Li, W.Q.; Qureshi, A.A.; Cho, E. Vitamin D intake and risk of Skin Cancer in US Women and Men. PLoS ONE 2016, 11, e0160308. [Google Scholar] [CrossRef] [PubMed]
- Aleksandrova, K.; Jenab, M.; Leitzmann, M.; Bueno-de-Mesquita, B.; Kaaks, R.; Trichopoulou, A.; Bamia, C.; Lagiou, P.; Rinaldi, S.; Freisling, H.; et al. Physical activity, mediating factors and risk of colon cancer: Insights into adiposity and circulating biomarkers from the EPIC cohort. Int. J. Epidemiol. 2017, 46, 1823–1835. [Google Scholar] [CrossRef] [PubMed]
- Pérez-Hernández, N.; Aptilon-Duque, G.; Nostroza-Hernández, M.C.; Vargas-Alarcón, G.; Rodríguez-Pérez, J.M.; Blachman-Braun, R. Vitamin D and its effects on cardiovascular diseases: A comprehensive review. Korean J. Intern. Med. 2016, 31, 1018–1029. [Google Scholar] [CrossRef] [PubMed]
- Sergeev, I.N. 1,25-Dihydroxyvitamin D3 and type 2 diabetes: Ca2+-dependent molecular mechanisms and the role of vitamin D. status. Horm. Mol. Biol. Clin. Investig. 2016, 26, 61–65. [Google Scholar] [CrossRef] [PubMed]
- Chu, F.; Ohinmaa, A.; Klarenbach, S.; Wong, Z.W.; Veugelers, P. Serum 25-Hydroxyvitamin D Concentrations and indicators of mental Health: An Analysis of the Canadian Health Measures Survey. Nutrients 2017, 9. [Google Scholar] [CrossRef] [PubMed]
- Lapid, M.I.; Cha, S.S.; Takahashi, P.Y. Vitamin D and depression in geriatric primary care patients. Clin. Interv. Aging 2013, 8, 509–514. [Google Scholar] [CrossRef] [PubMed]
- Cherniack, E.P.; Florez, H.; Roos, B.A.; Troen, B.R.; Levis, S. Hypovitaminosis D in the elderly: From bone to brain. J. Nutr. Health Aging 2008, 12, 366–373. [Google Scholar] [CrossRef] [PubMed]
- Eyles, D.W.; Smith, S.; Kinobe, R.; Hewison, M.; McGrath, J.J. Distribution of the vitamin D receptor and 1alpha-hydroxylase in human brain. J. Chem. Neuroanat. 2005, 29, 21–30. [Google Scholar] [CrossRef] [PubMed]
- Eyles, D.W.; Burne, T.H.; McGrath, J.J. Vitamin D, effects on brain development, adult brain function and the links between low levels of vitamin D and neuropsychiatric disease. Front. Neuroendocrinol. 2013, 34, 47–64. [Google Scholar] [CrossRef] [PubMed]
- Brouwer-Brolsma, E.M.; de Groot, L.C. Vitamin D and cognition in older adults: An update of recent findings. Curr. Opin. Clin. Nutr. Metab. Care 2015, 18, 11–16. [Google Scholar] [CrossRef] [PubMed]
- Schlögl, M.; Holick, M.F. Vitamin D and neurocognitive function. Clin. Interv. Aging 2014, 9, 559–568. [Google Scholar] [CrossRef] [PubMed] [Green Version]
- Grant, W.B.; Wimalawansa, S.J.; Holick, M.F.; Cannell, J.J.; Pludowski, P.; Lappe, J.M.; Pittaway, M.; May, P. Emphasizing the Health Benefits of Vitamin D for Those with Neurodevelopmental Disorders and Intellectual Disabilities. Nutrients 2015, 7, 1538–1564. [Google Scholar] [CrossRef] [PubMed] [Green Version]
- Annweiler, C.; Schott, A.M.; Berrut, G.; Chauviré, V.; Le Gall, D.; Inzitari, M.; Beauchet, O. Vitamin D and ageing: Neurological issues. Neuropsychobiology 2010, 62, 139–150. [Google Scholar] [CrossRef] [PubMed]
- Annweiler, C.; Annweiler, T.; Montero-Odasso, M.; Bartha, R.; Beauchet, O. Vitamin D and brain volumetric changes: Systematic review and meta-analysis. Maturitas 2014, 78, 30–39. [Google Scholar] [CrossRef] [PubMed]
- Brouwer-Brolsma, E.M.; van der Zwaluw, N.L.; van Wijngaarden, J.P.; Dhonukshe-Rutten, R.A.; in’t Veld, P.H.; Feskens, E.J.; Smeets, P.A.; Kessels, R.P.; van de Rest, O.; de Groot, L.C. Higher serum 25-hydroxyvitamin D and lower plasma glucose are associated with larger gray matter volume but not with white matter or total brain volume in Dutch community-dwelling older adults. J. Nutr. 2015, 145, 1817–1823. [Google Scholar] [CrossRef] [PubMed]
- Brøndum-Jacobsen, P.; Nordestgaard, B.G.; Schnohr, P.; Benn, M. 25-Hydroxyvitamin D and symptomatic ischemic stroke: An original study and meta-analysis. Ann. Neurol. 2013, 73, 38–47. [Google Scholar] [CrossRef] [PubMed]
- Annweiler, C.; Bartha, R.; Karras, S.N.; Gautier, J.; Roche, F.; Beauchet, O. Vitamin D and white matter abnormalities in older adults: A quantitative volumetric analysis of brain MRI. Exp. Gerontol. 2015, 63, 41–47. [Google Scholar] [CrossRef] [PubMed]
- Annweiler, C.; Annweiler, T.; Bartha, R.; Herrmann, F.R.; Camicioli, R.; Beauchet, O. Vitamin D and white matter abnormalities in older adults: A cross-sectional neuroimaging study. Eur. J. Neurol. 2014, 21, 1436-e95. [Google Scholar] [CrossRef] [PubMed]
- Li, Y.C. Vitamin D regulation of the renin-angiotensin system. J. Cell. Biochem. 2003, 88, 327–331. [Google Scholar] [CrossRef] [PubMed]
- Forman, J.P.; Williams, J.S.; Fisher, N.D. Plasma 25-hydroxyvitamin D and regulation of the renin-angiotensin system in humans. Hypertension 2010, 55, 1283–1288. [Google Scholar] [CrossRef] [PubMed]
- Chen, S.; Law, C.S.; Grigsby, C.L.; Olsen, K.; Hong, T.T.; Zhang, Y.; Yeghiazarians, Y.; Gardner, D.G. Cardiomyocyte-specific deletion of the vitamin D receptor gene results in cardiac hypertrophy. Circulation 2011, 124, 1838–1847. [Google Scholar] [CrossRef] [PubMed]
- Caprio, M.; Mammi, C.; Rosano, G.M. Vitamin D: A novel player in endothelial function and dysfunction Arch. Med. Sci. 2012, 8, 4–5. [Google Scholar] [CrossRef]
- Uemura, H.; Katsuura-Kamano, S.; Yamaguchi, M.; Nakamoto, M.; Hiyoshi, M.; Arisawa, K. Association between dietary calcium intake and arterial stiffness according to dietary vitamin D. intake in men. Br. J. Nutr. 2014, 112, 1333–1340. [Google Scholar] [CrossRef] [PubMed]
- Li, X.; Lyu, P.; Ren, Y.; An, J.; Dong, Y. Arterial stiffness and cognitive impairment. J. Neurol. Sci. 2017, 380, 1–10. [Google Scholar] [CrossRef] [PubMed]
- Goldstein, F.C.; Levey, A.I.; Steenland, N.K. High blood pressure and cognitive decline in mild cognitive impairment. J. Am. Geriatr. Soc. 2013, 61, 67–73. [Google Scholar] [CrossRef] [PubMed]
- Mirhosseini, N.; Vatanparast, H.; Kimball, S.M. The Association between Serum 25(OH)D Status and Blood Pressure in Participants of a Community-Based Program Taking Vitamin D Supplements. Nutrients 2017, 9. [Google Scholar] [CrossRef] [PubMed]
- Etgen, T.; Sander, D.; Bickel, H.; Sander, K.; Förstl, H. Vitamin D deficiency, cognitive impairment and dementia: A systematic review and meta-analysis. Dement. Geriatr. Cogn. Disord. 2012, 33, 297–305. [Google Scholar] [CrossRef] [PubMed]
- Olsson, E.; Byberg, L.; Karlström, B.; Cederholm, T.; Melhus, H.; Sjögren, P.; Kilander, L. Vitamin D is not associated with incident dementia or cognitive impairment: An 18-y follow-up study in community-living old men. Am. J. Clin. Nutr. 2017, 105, 936–943. [Google Scholar] [CrossRef] [PubMed]
- Bień, B.; Bień-Barkowska, K.; Wojskowicz, A.; Kasiukiewicz, A.; Wojszel, Z.B. Prognostic factors of long-term survival in geriatric inpatients. Should we change the recommendations for the oldest people? J. Nutr. Health Aging 2015, 19, 481–488. [Google Scholar] [CrossRef] [PubMed]
- Folstein, M.F.; Folstein, S.E.; McHugh, P.R. “Mini-mental state”. A practical method for grading the cognitive state of patients for the clinician. J. Psychiatr. Res. 1957, 12, 189–198. [Google Scholar] [CrossRef]
- Rubenstein, L.Z. An overview of comprehensive geriatric assessment. In Geriatric Assessment Technology. The State of Art; Rubenstein, L.Z., Wieland, D., Bernabei, R., Eds.; Editrice Kurtis: Milan, Italy, 1995. [Google Scholar]
- International Statistical Classification of Diseases and Related Health Problems, ICD-10, Version 2016. Available online: http://apps.who.int/classifications/icd10/browse/2016/en (accessed on 9 June 2018).
- Podsiadlo, D.; Richardson, S. The timed up & go: A test of basic functional mobility for frail elderly persons. J. Am. Geriatr. Soc. 1991, 39, 142–148. [Google Scholar] [PubMed]
- Ermens, A.A.; Vlasveld, L.T.; Lindemans, J. Significance of elevated cobalamin (vitamin B12) levels in blood. Clin. Biochem. 2003, 36, 585–590. [Google Scholar] [CrossRef] [PubMed]
- Andrès, E.; Serraj, K.; Zhu, J.; Vermorken, A.J. The pathophysiology of elevated vitamin B12 in clinical practice. QJM 2013, 106, 505–515. [Google Scholar] [CrossRef] [PubMed] [Green Version]
- Freedman, D.A. On the so-called “Huber Sandwich Estimator” and “Robust Standard Errors”. Am. Stat. 2006, 60, 299–302. [Google Scholar] [CrossRef]
- Raftery, A.E. Bayesian Model Selection in Social Research. Sociol. Methodol. 1995, 25, 111–163. [Google Scholar] [CrossRef]
- Hoeting, J.A.; Madigan, D.; Raftery, A.E.; Volinsky, C.T. Bayesian Model Averaging: A. Tutorial. Stat. Sci. 1999, 14, 382–417. [Google Scholar]
- Viallefont, V.; Raftery, A.E.; Richardson, S. Variable selection and Bayesian model averaging in case-control studies. Stat. Med. 2001, 20, 3215–3230. [Google Scholar] [CrossRef] [PubMed] [Green Version]
- Genell, A.; Nemes, S.; Steineck, G.; Dickman, P.W. Model selection in Medical Research: A simulation study comparing Bayesian Model Averaging and Stepwise Regression. BMC Med. Res. Methodol. 2010, 10. [Google Scholar] [CrossRef] [PubMed]
- Wang, D.; Zhang, W.; Bakhai, A. Comparison of Bayesian model averaging and stepwise methods for model selection in logistic regression. Stat. Med. 2004, 23, 3451–3467. [Google Scholar] [CrossRef] [PubMed]
- Yeung, K.Y.; Bumgarner, R.E.; Raftery, A.E. Bayesian model averaging: Development of an improved multi-class, gene selection and classification tool for microarray data. Bioinformatics 2005, 21, 2394–2402. [Google Scholar] [CrossRef] [PubMed]
- Package for Bayesian Model Averaging and Variable Selection for Linear Models, Generalized Linear Models and Survival Models (Cox Regression). Available online: https://cran.r-project.org/web/packages/BMA (accessed on 13 April 2018).
- Dementia a Public Health Priority. Available online: http://apps.who.int/iris/bitstream/handle/10665/75263/9789241564458_eng.pdf;jsessionid=D124D1B349E4797499DC1994B490D14F?sequence=1 assessed on 11th of April 2018 (accessed on 12 June 2018).
- Cappello, S.; Cereda, E.; Rondanelli, M.; Klersy, C.; Cameletti, B.; Albertini, R.; Magno, D.; Caraccia, M.; Turri, A.; Caccialanza, R. Elevated Plasma Vitamin B12 Concentrations Are Independent Predictors of In-Hospital Mortality in Adult Patients at Nutritional Risk. Nutrients 2016, 9. [Google Scholar] [CrossRef] [PubMed]
- Perez, L.; Heim, A.; Sherzai, A.; Jaceldo-Siegl, K.; Sherzai, A. Nutrition and vascular dementia. J. Nutr. Health Aging 2011, 16, 319–324. [Google Scholar] [CrossRef]
- Kassi, E.; Adamopoulos, C.; Basdra, E.K.; Papavassiliou, A.G. Role of vitamin D in arteriosclerosis. Circulation 2013, 128, 2517–2531. [Google Scholar] [CrossRef] [PubMed]
- Bell, S.P.; Liu, D.; Samuels, L.R.; Shah, A.S.; Gifford, K.A.; Hohman, T.J.; Jefferson, A.L. Late-Life Body Mass Index, Rapid Weight Loss, Apolipoprotein E ε4 and the Risk of Cognitive Decline and Incident Dementia. J. Nutr. Health Aging 2017, 21, 1259–1267. [Google Scholar] [CrossRef] [PubMed]
- Joo, S.H.; Yun, S.H.; Kang, D.W.; Hahn, C.T.; Lim, H.K.; Lee, C.U. Body Mass Index in Mild Cognitive Impairment According to Age, Sex, Cognitive Intervention, and Hypertension and Risk of Progression to Alzheimer’s Disease. Front. Psychiatry 2018, 9. [Google Scholar] [CrossRef] [PubMed]
- Cao, L.; Tan, L.; Wang, H.F.; Jiang, T.; Zhu, X.C.; Lu, H.; Tan, M.S.; Yu, J.T. Dietary Patterns and Risk of Dementia: A Systematic Review and Meta-Analysis of Cohort Studies. Mol. Neurobiol. 2016, 53, 6144–6154. [Google Scholar] [CrossRef] [PubMed]
- Martyn, C.N.; Singh, S.; Wood, P.J. Calcium metabolism in Alzheimer’s disease. A case-control study. Gerontology 1989, 35, 153–157. [Google Scholar] [CrossRef] [PubMed]
- Wilkins, C.H.; Sheline, Y.I.; Roe, C.M.; Birge, S.J.; Morris, J.C. Vitamin D deficiency is associated with low mood and worse cognitive performance in older adults. Am. J. Geriatr. Psychiatry 2006, 14, 1032–1040. [Google Scholar] [CrossRef] [PubMed]
- Littlejohns, T.J.; Henley, W.E.; Lang, I.A.; Annweiler, C.; Beauchet, O.; Chaves, P.H.M.; Fried, L.; Kestenbaum, B.R.; Kuller, L.H.; Langa, K.M.; et al. Vitamin D and the risk of dementia and Alzheimer disease. Neurology 2014, 83, 920–928. [Google Scholar] [CrossRef] [PubMed] [Green Version]
- Afzal, S.; Bojesen, S.E.; Nordestgaard, B.G. Reduced 25-hydroxyvitamin D and risk of Alzheimer’s disease and vascular dementia. Alzheimer Dement. 2014, 10, 296–302. [Google Scholar] [CrossRef] [PubMed]
- Pettersen, J.A. Does high dose vitamin D supplementation enhance cognition? A randomized trial in healthy adults. Exp. Gerontol. 2017, 90, 90–97. [Google Scholar] [CrossRef] [PubMed]
- Rossom, R.C.; Espeland, M.A.; Manson, J.A.E.; Dysken, M.W.; Johnson, K.C.; Lane, D.S.; LeBlanc, E.S.; Lederle, F.A.; Masaki, KH.; Margolis, K.L. Calcium and Vitamin D Supplementation and Cognitive Impairment in the Women’s Health Initiative. J. Am. Geriatr. Soc. 2012, 60, 2197–2205. [Google Scholar] [CrossRef] [PubMed]
- Ouma, S.; Suenaga, M.; Bölükbaşı Hatip, F.F.; Hatip-Al-Khatib, I.; Tsuboi, Y.; Matsunaga, Y. Serum vitamin D in patients with mild cognitive impairment and Alzheimer’s disease. Brain Behav. 2018, 8, e00936. [Google Scholar] [CrossRef] [PubMed]
- Przybelski, R.J.; Binkley, N.C. Is vitamin D important for preserving cognition? A positive correlation of serum 25- hydroxyvitamin D concentration with cognitive function. Arch. Biochem. Biophys. 2007, 460, 202–205. [Google Scholar] [CrossRef] [PubMed]
- Vance, D.E.; Marson, D.C.; Triebel, K.L.; Ball, K.; Wadley, V.G.; Humphrey, S.C. (Physical Activity and Cognitive Function in Older Adults: The Mediating Effect of Depressive Symptoms. J. Neurosci. Nurs. 2016, 48. [Google Scholar] [CrossRef] [PubMed]
- Lee, J.E.; Shin, D.W.; Jeong, S.M.; Son, K.Y.; Cho, B.; Yoon, J.L.; Park, B.J.; Kwon, I.S.; Lee, J.; Kim, S. Timed Up and Go Test and Future Dementia Occurrence. J. Gerontol. A Biol. Sci. Med. Sci. 2018. [Google Scholar] [CrossRef] [PubMed]
- Mulero, J.; Zafrilla, P.; Martinez-Cacha, A. Oxidative stress, frailty and cognitive decline. J. Nutr. Health Aging 2011, 15, 756–760. [Google Scholar] [CrossRef] [PubMed]
- Ioannidis, J.P.A. The Proposal to Lower P Value Thresholds to .005. JAMA 2018, 319, 1429–1430. [Google Scholar] [CrossRef] [PubMed]
- Wasserstein, R.L.; Lazar, N.A. The ASA’s statement on p-values: Context, process, and purpose. Am. Stat. 2016, 70, 129–133. [Google Scholar] [CrossRef]


| Characteristics | Dichotomous Variables | Continuous or Polytomous Variables | |||||
|---|---|---|---|---|---|---|---|
| n | % | Min | Max | Median | Mean | SD | |
| Dependent variables | |||||||
| MMSE (0–30) | 0 | 30 | 22 | 20.86 | 7.06 | ||
| Dementia diagnosis (yes) | 152 | 42.5 | |||||
| Independent variables | |||||||
| Age (years) | 62 | 102 | 83 | 82.30 | 6.67 | ||
| Male (yes) | 121 | 33.9 | |||||
| Number of years in education | 0 | 23 | 9 | 9.31 | 4.29 | ||
| Urban place of living (yes) | 266 | 74.5 | |||||
| Living alone (yes) | 115 | 32.2 | |||||
| Fall(s) in last year (yes) | 193 | 54.1 | |||||
| BMI (kg/m2) | 15.9 | 67.89 | 27.47 | 28.29 | 5.94 | ||
| sBP (mmHg) | 87 | 201 | 130 | 130.96 | 19.54 | ||
| dBP (mmHg) | 41 | 102 | 66 | 67.33 | 11.19 | ||
| Hemoglobin (g/dL) | 7.08 | 17.7 | 12.79 | 12.58 | 1.69 | ||
| Lymphocytes (count per mm3) | 570 | 9400 | 1650 | 1763.17 | 801.39 | ||
| Sodium (mmol/L) | 116.0 | 149.0 | 140.0 | 139.94 | 3.19 | ||
| Potassium (mmol/L) | 3.04 | 6.66 | 4.34 | 4.40 | 0.50 | ||
| TSH (µIU/L) | 0.003 | 71.65 | 1.19 | 1.81 | 4.86 | ||
| CRP (g/L) | 0.0 | 374 | 2 | 9.500 | 29.14 | ||
| Albumin (g/dL) | 2.38 | 4.9 | 4.1 | 3.9 | 0.4 | ||
| Fasting glucose (mg/mL) | 36.0 | 406.0 | 99.0 | 107.28 | 30.81 | ||
| GFR (in mL/min/1.73 m2) | 6.35 | 169.54 | 56.72 | 61.38 | 25.53 | ||
| Total cholesterol (mmol/L) | 75.0 | 315 | 170 | 174.74 | 46.35 | ||
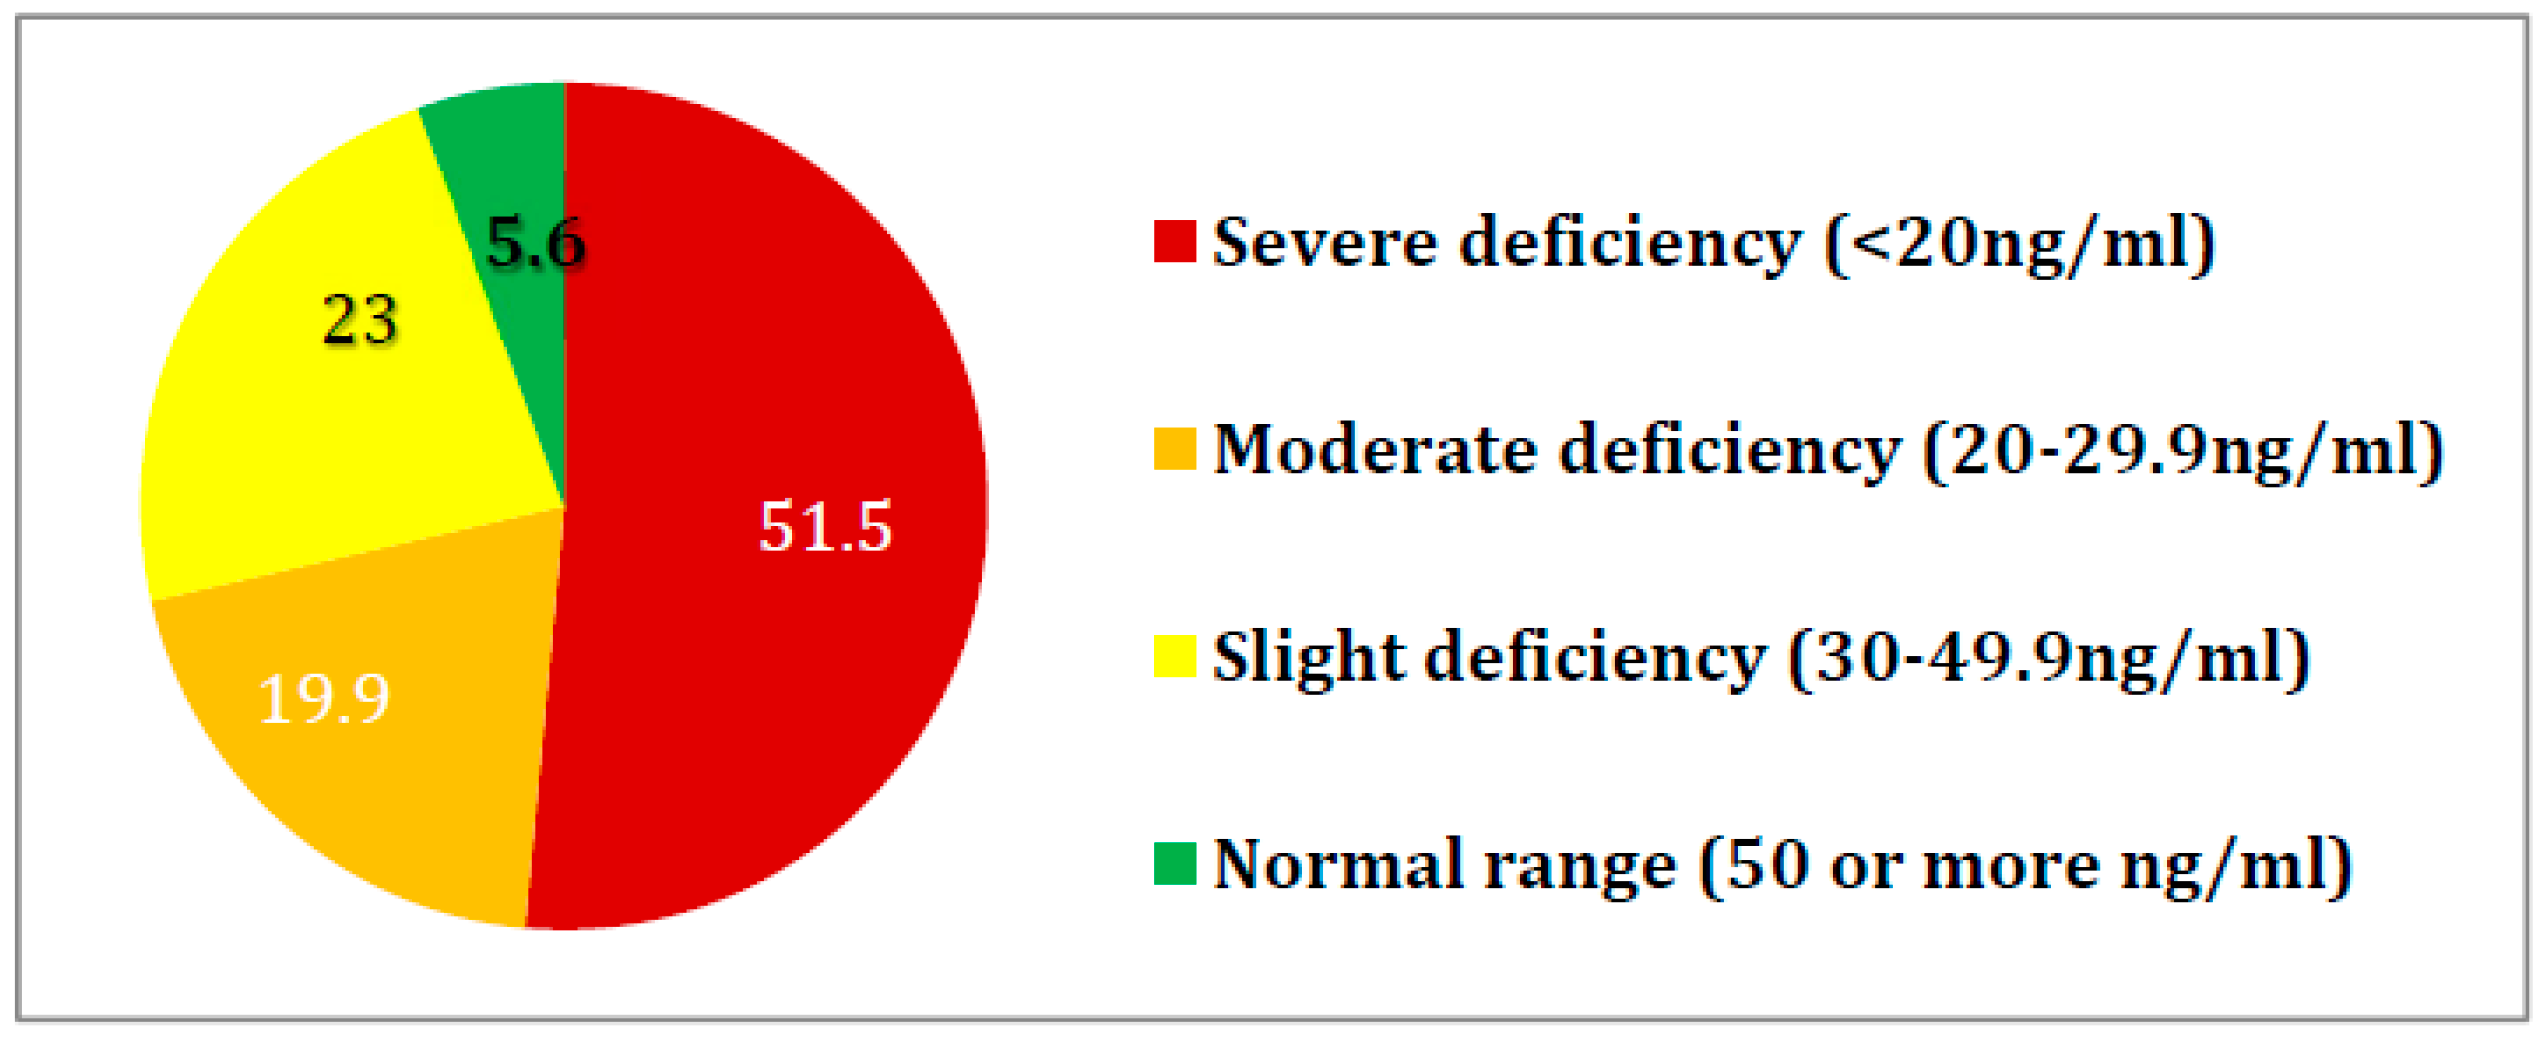
| Vitamin D (ng/mL) | 2.0 | 70.0 | 19.3 | 22.31 | 14.99 | ||
| Vitamin B12 (pg/mL) | 50.0 | 2000 | 335 | 390.58 | 248.97 | ||
| Speed of TUG (m/s) | 0 | 2.07 | 0.32 | 0.35 | 0.26 | ||
| Sum of conditions out of top 18 | 0 | 11 | 5 | 5.29 | 1.92 | ||
| Explanatory Variable | Univariate Models | Multiple Variable Models | ||||||
|---|---|---|---|---|---|---|---|---|
| MMSE | Dementia Diagnosis | MMSE | Dementia Diagnosis | |||||
| Coefficient (95% CI) | p-Value | OR (95% CI) | p-Value | Coefficient (95% CI) | p-Value | OR (95% CI) | p-Value | |
| Age (years) | −0.327 (−0.428; 0.226) | <0.001 | 1.079 (1.042; 1.119) | <0.001 | - | - | 1.043 (1.004; 1.083) | 0.031 |
| Male (yes) | 1.266 (−244; 2.776) | 0.100 | 0.973 (0.625; 1.518) | 0.907 | - | - | - | - |
| Number of years in education | 0.556 (0.401; 0.711) | <0.001 | 0.959 (0.912; 1.009) | 0.109 | 0.426 (0.300; 0.553) | <0.001 | - | - |
| Urban place of living (yes) | −1.785 (−3.547;0.022) | 0.047 | 0.899 (0.554; 1.460) | 0.669 | - | - | - | - |
| Living alone (yes) | 1.327 (−0.097; 2.750) | 0.068 | 0.554 (0.348; 0.881) | 0.013 | - | - | - | - |
| Fall(s) in last year (yes) | −0.095 (−1.589; 1.398) | 0.900 | 1.088 (0.713; 1.658) | 0.695 | - | - | - | - |
| BMI (kg/m2) | 0.228 (0.120; 0.334) | <0.001 | 0.953 (0.918; 0.988) | 0.010 | 0.311 (0.211; 0.411) | <0.001 | 0.933 (0.888; 0.979) | 0.005 |
| sBP (mmHg) | 0.031 (−0.094; 0.047) | 0.089 | 0.993 (0.998; 1.036) | 0.228 | - | - | - | - |
| dBP (mmHg) | −0.024 (−0.005; 0.066) | 0.514 | 1.017 (0.983; 1.004) | 0.074 | - | - | - | - |
| Hemoglobin (g/dL) | 0.163 (−0.308; 0.634) | 0.497 | 1.087 (0.959; 1.233) | 0.191 | - | - | 1.256 (1.083; 1.457) | 0.003 |
| Ln (Lymphocytes) (count per mm3) | 2.582 (0.703; 4.461) | 0.007 | 0.359 (0.199; 0.646) | 0.001 | - | - | 0.473 (0.240; 0.933) | 0.031 |
| Sodium (mmol/L) | −0.232 (−0.464; −0.000) | 0.050 | 1.063 (0.992; 1.138) | 0.084 | −0.231 (−0.425; −0.038) | 0.019 | - | - |
| Potassium (mmol/L) | 1.579 (0.103; 3.055) | 0.036 | 0.714 (0.463; 1.100) | 0.127 | - | - | - | - |
| Ln (TSH) | −0.258 (−1.088; 0.571) | 0.540 | 1.058 (0.833; 1.345) | 0.641 | - | - | - | - |
| CRP (g/L) | −0.013 (−0.040; 0.014) | 0.343 | 0.994 (0.986; 1.002) | 0.184 | - | - | - | - |
| Albumin (g/dL) | 0.079 (0.011; 0.147) | 0.022 | 0.634 (0.376; 1.071) | 0.089 | - | - | - | - |
| Ln (Fasting glucose) (mg/mL) | 4.127 (1.221; 7.033) | 0.005 | 0.273 (0.102; 0.728) | 0.010 | - | - | - | - |
| GFR (mL/min/1.73 m2) | 0.051 (0.026; 0.075) | <0.001 | 0.992 (0.984; 1.000) | 0.062 | - | - | - | - |
| Total cholesterol (mmol/L) | 1.008 (−2.002; 4.017) | 0.510 | 1.124 (0.510; 2.475) | 0.772 | - | - | - | - |
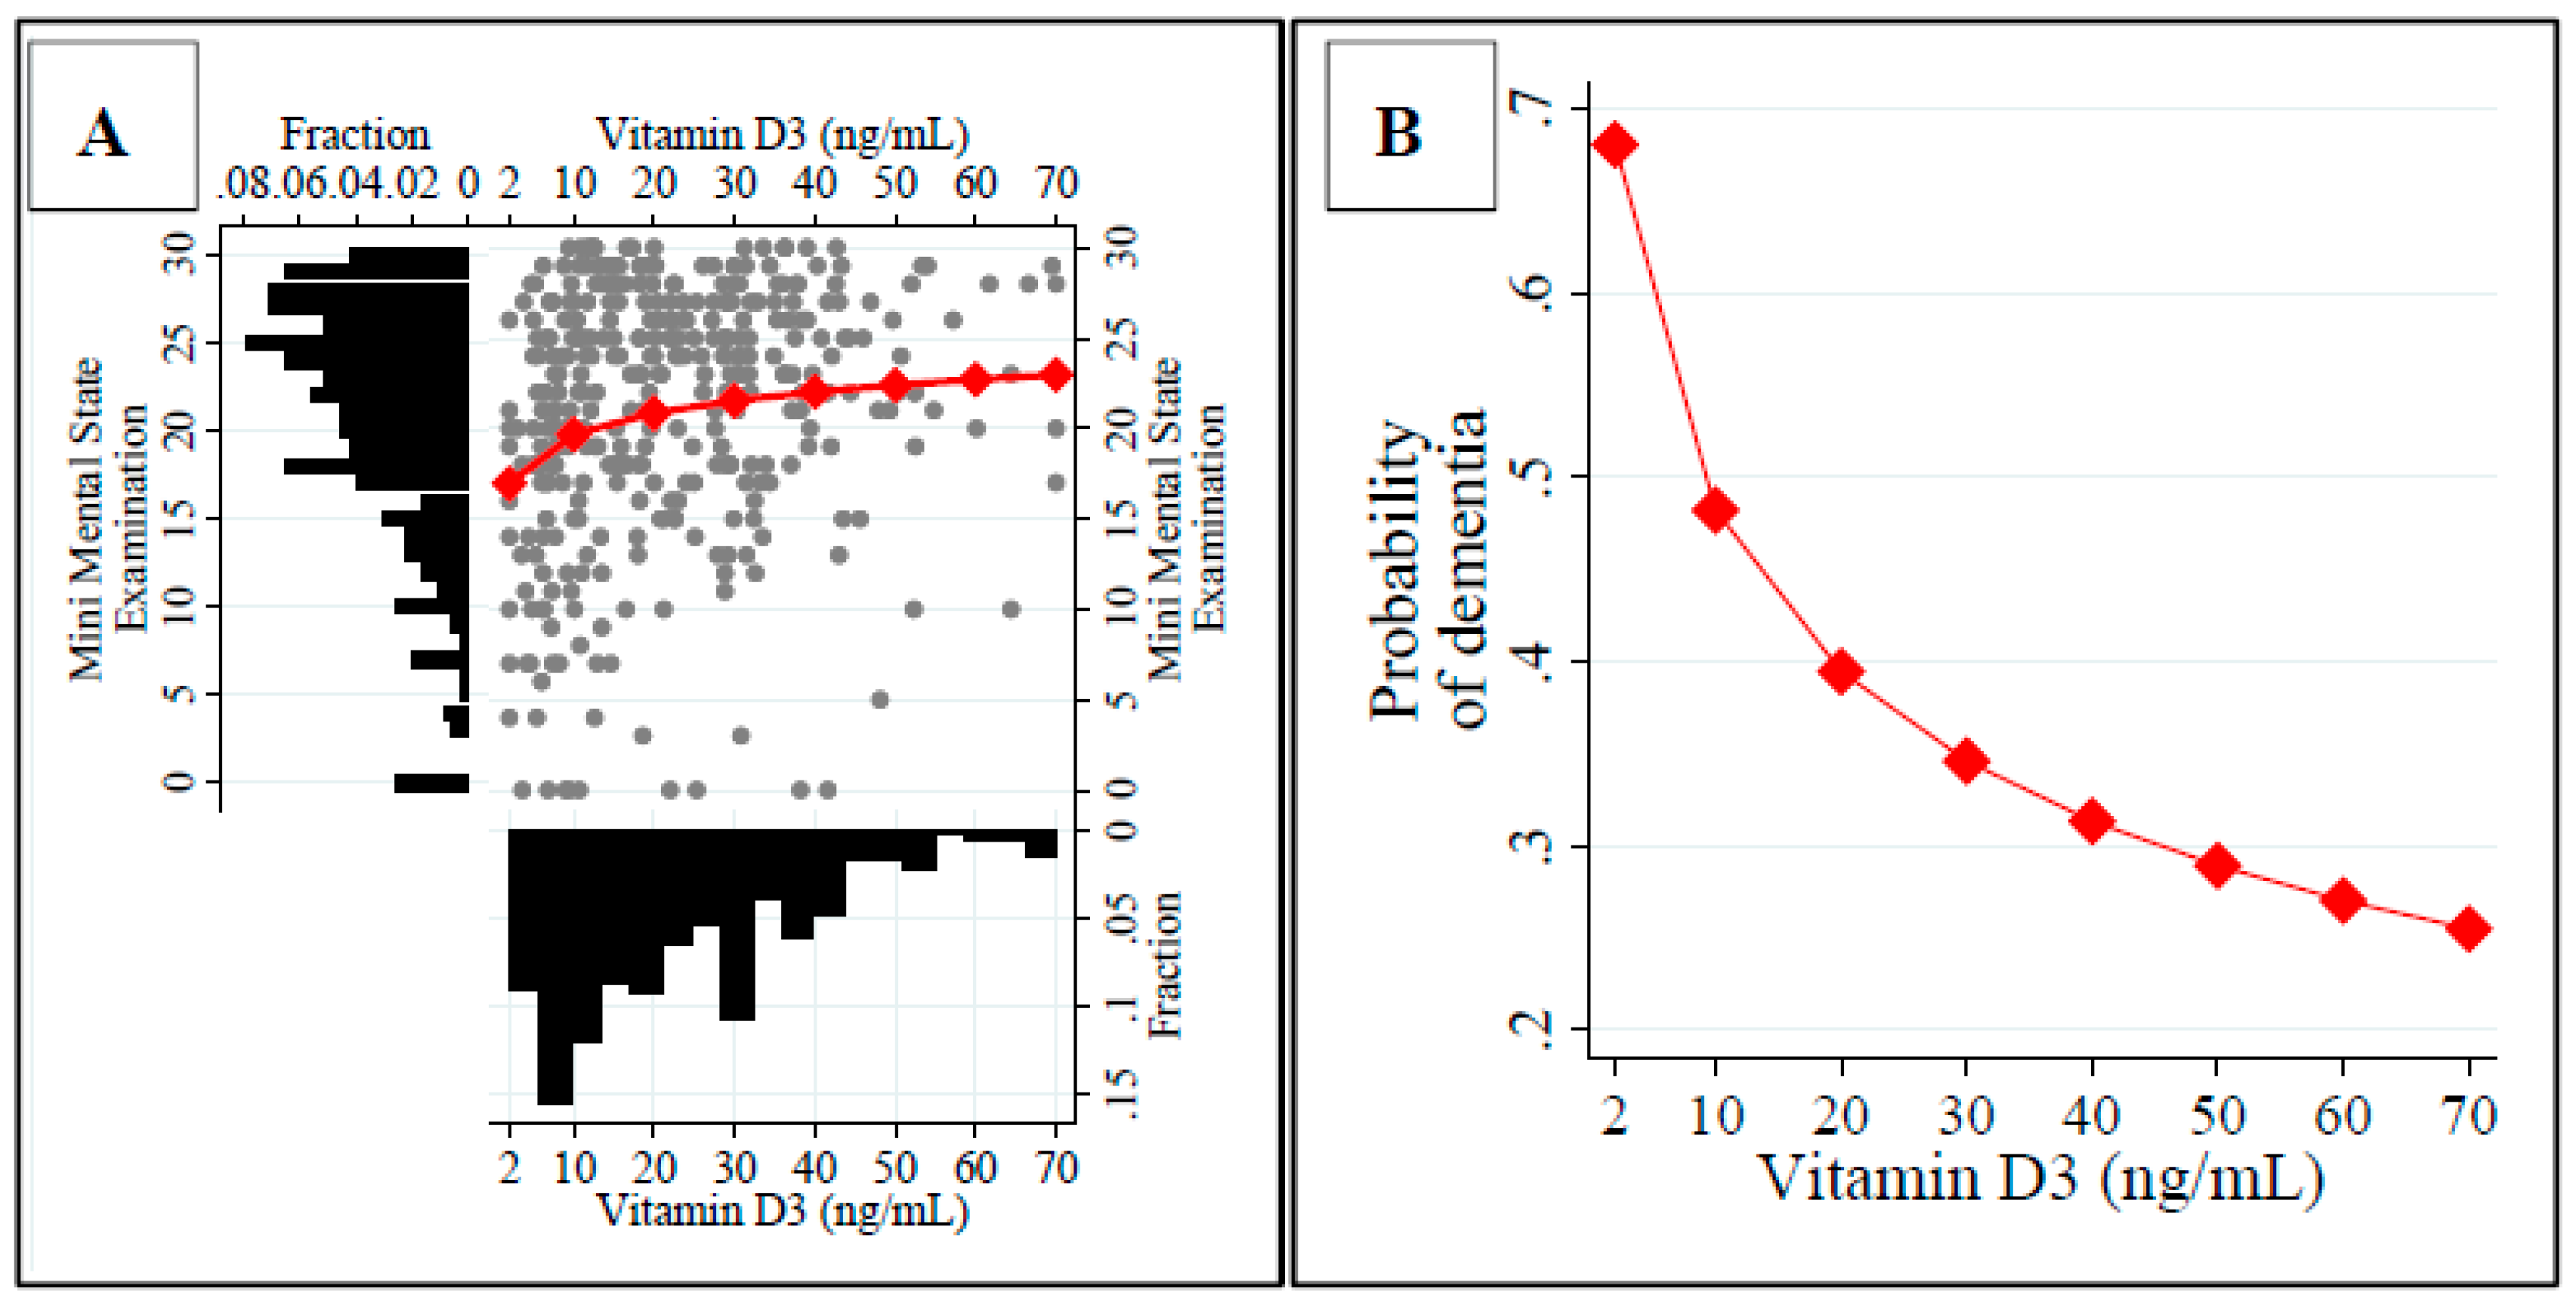
| Ln (Vitamin D) (ng/mL) | 2.327 (1.412; 3.242) | <0.001 | 0.586 (0.446; 0.771) | <0.001 | 1.713 (0.922; 2.502) | <0.001 | 0.600 (0.444; 0.809) | 0.001 |
| Ln T(Vitamin B12) (pg/mL) | 3.584 (1.654; 5.513) | <0.001 | 0.486 (0.290; 0.816) | 0.006 | 3.219 (1.597; 4.841) | <0.001 | 0.438 (0.245; 0.784) | 0.006 |
| Vitamin B12 > 800 pg/mL | −5.962 (−9.882; −2.043) | 0.003 | 4.794 (1.512; 15.204) | 0.008 | −5.159 (−8.439; −1.879) | 0.002 | 5.764 (1.576; 21.083) | 0.008 |
| Ln (TUG speed+1) (m/s) | 17.589 (13.684; 21.495) | <0.001 | 0.029 (0.007; 0.124) | <0.001 | 14.905 (11.375; 18.435) | <0.001 | 0.036 (0.007; 0.193) | <0.001 |
| Sum of conditions out of top 18 | −0.472 (−0.840; −0.102) | 0.012 | 1.121 (1.004; 1.252) | 0.043 | - | - | - | - |
| MMSE | Dementia Diagnosis | |||
|---|---|---|---|---|
| Predictors | E(β|D) (SD(β|D) | P(β≠0|D) * | E(β|D) (SD(β|D) | P(β≠0|D) |
| Age (years) | - | - | 0.024 (0.028) | 0.501 |
| Number of years in education | 0.422 (0.070) | 1 | - | - |
| BMI (kg/m2) | 0.306 (0.050) | 1 | −0.072 (0.028) | 0.955 |
| Hemoglobin (g/dL) | - | - | 0.147 (0.110) | 0.730 |
| Sodium (mmol/L) | −0.133 (0.136) | 0.568 | - | - |
| Ln (Vitamin D) (ng/mL) | 1.694 (0.380) | 1 | −0.514 (0.171) | 0.984 |
| Ln (Vitamin B12) (pg/mL) | 3.315 (0.754) | 1 | −0.380 (0.453) | 0.493 |
| Vitamin B12 > 800 pg/mL | −5.150 (1.860) | 0.961 | 0.700 (0.948) | 0.418 |
| Ln (Speed of TUG) (m/s) | 14.950 (1.687) | 1 | −3.411 (0.831) | 1 |
© 2018 by the authors. Licensee MDPI, Basel, Switzerland. This article is an open access article distributed under the terms and conditions of the Creative Commons Attribution (CC BY) license (http://creativecommons.org/licenses/by/4.0/).
Share and Cite
Łukaszyk, E.; Bień-Barkowska, K.; Bień, B. Cognitive Functioning of Geriatric Patients: Is Hypovitaminosis D the Next Marker of Cognitive Dysfunction and Dementia? Nutrients 2018, 10, 1104. https://0-doi-org.brum.beds.ac.uk/10.3390/nu10081104
Łukaszyk E, Bień-Barkowska K, Bień B. Cognitive Functioning of Geriatric Patients: Is Hypovitaminosis D the Next Marker of Cognitive Dysfunction and Dementia? Nutrients. 2018; 10(8):1104. https://0-doi-org.brum.beds.ac.uk/10.3390/nu10081104
Chicago/Turabian StyleŁukaszyk, Ewelina, Katarzyna Bień-Barkowska, and Barbara Bień. 2018. "Cognitive Functioning of Geriatric Patients: Is Hypovitaminosis D the Next Marker of Cognitive Dysfunction and Dementia?" Nutrients 10, no. 8: 1104. https://0-doi-org.brum.beds.ac.uk/10.3390/nu10081104