Article

Effects of Different Doses of Fructooligosaccharides (FOS) on the Composition of Mice Fecal Microbiota, Especially the Bifidobacterium Composition

1
State Key Laboratory of Food Science and Technology, Jiangnan University, Wuxi 214122, China
2
School of Food Science and Technology, Jiangnan University, Wuxi 214122, China
3
National Engineering Research Center for Functional Food, Jiangnan University, Wuxi 214122, China
4
Beijing Innovation Center of Food Nutrition and Human Health, Beijing Technology and Business University (BTBU), Beijing 100048, China
*
Author to whom correspondence should be addressed.
Submission received: 13 July 2018 / Revised: 12 August 2018 / Accepted: 14 August 2018 / Published: 16 August 2018

Abstract

:
Fructooligosaccharides (FOS) are a well-known class of prebiotic and are considered to selectively stimulate the growth of bifidobacteria in the gut. Previous studies focused on the growth stimulation of Bifidobacterium, but they did not further investigate the bifidobacterial composition and the specific species that were stimulated. In this study, mice were fed with FOS in different doses for four weeks and the composition of fecal microbiota, in particular Bifidobacterium, was analyzed by sequencing the V3–V4 region and the groEL gene on the MiSeq platform, respectively. In the high-dose group, the relative abundance of Actinobacteria was significantly increased, which was mainly contributed by Bifidobacterium. At the genus level, the relative abundances of Blautia and Coprococcus were also significantly increased. Through the groEL sequencing, 14 species of Bifidobacterium were identified, among which B. pseudolongum was most abundant. After FOS treatment, B. pseudolongum became almost the sole bifidobacterial species (>95%). B. pseudolongum strains were isolated and demonstrated their ability to metabolize FOS by high performance liquid chromatography (HPLC). Therefore, we inferred that FOS significantly stimulated the growth of B. pseudolongum in mice. Further investigations are needed to reveal the mechanism of selectiveness between FOS and B. pseudolongum, which would aid our understanding of the basic principles between dietary carbohydrates and host health.

Graphical Abstract

1. Introduction

The intestinal tract is an important habitat for bacteria; the colon contains more than 1012 bacteria per gram [1], which are mainly anaerobic bacteria [2]. Intestinal bacteria play important roles in the well-being of the large intestine [3]. Among the over 1000 species, many are beneficial to human health, while some are harmful, produce toxins, and cause disease [4]. Resistant starch, dietary fiber, and oligosaccharides in food can successfully reach the large intestine, and are used by the intestinal bacteria as a source of energy [5] and essential nutrients [6]. The resulting metabolites, like short-chain fatty acids, are beneficial for intestinal health.
Bifidobacteria are known to be closely related with intestinal health and are commonly used as health-promoting probiotics [7]. Some carbohydrates in food can escape the digestion and absorption in the stomach and small intestine, and become the main food sources of bacteria in the large intestine. The non-digestible carbohydrates that selectively stimulate the growth of beneficial microbes are called prebiotics, among which the most common are functional oligosaccharides, like lactulose, fructooligosaccharides (FOS), and galactooligosaccharides [8]. In recent years, prebiotics have received much attention and the relationships between prebiotics and the intestinal microbiota have been deeply studied with the aid of high-throughput sequencing techniques. The non-digestible carbohydrates, in particular non-digestible oligosaccharides, have been studied intensely [9]. However, an increasing number of studies have shown that oligosaccharides are not the exclusive substrates for bifidobacteria [10]. It remains unclear how oligosaccharides affect the intestinal microbiota, especially those bacteria with the ability to metabolize oligosaccharides.
FOS are a well-established class of prebiotics and show beneficial health effects to the host. Previous studies using plate counting, quantitative polymerase chain reaction (qPCR), or metagenomic sequencing have demonstrated that FOS selectively stimulated the growth of Bifidobacterium [11,12,13]. However, there was no investigation of specifically which bifidobacterial species were stimulated.
Junick et al. developed a method to quantify the human fecal Bifidobacterium species using quantitative real-time PCR analysis targeting the groEL gene [14], while Hu et al. analyzed the bifidobacterial composition of human and rat gut using the groEL gene through high-throughput sequencing on the MiSeq platform [15]. To the best of our knowledge, there are no reports on the bifidobacterial community in mice or its changes upon oligosaccharide treatment.
In this study, mice were fed with FOS in different doses for four weeks and the composition of fecal microbiota was analyzed using MiSeq sequencing to evaluate the effects of FOS treatment. Furthermore, the bifidobacterial communities were analyzed to reveal the relationship between FOS and specific Bifidobacterium species.

2. Materials and Methods

2.1. Chemicals and Reagents

Fructooligosaccharides (GFn, high performance liquid chromatography (HPLC) purity 95.93%) were obtained from Bao Lingbao Biotechnology Co., Ltd. (Shandong, China), the main components of which were 1F-fructofuranosylnystose (2.88%), nistose (32.45%), and 1-kestose (60.60%). AIN-93-VX Vitamin Mix and AIN-93G Mineral Mix were obtained from MP Biomedicals, LLC (Santa Ana, CA, USA).
FastDNA Spin Kit for Soil was obtained from Beijing Lianlixin BioTech Co., Ltd (Beijing, China). QIAquick Gel Extraction Kit was obtained from QIAGEN GmbH (Venlo, The Netherlands). Quanta iTico PicoGreen dsDNA Assay Kit was obtained from USA Life Technologies (Waltham, MA, USA). KAPA Biosystems Library Quantification Kit was obtained from KAPA Biosystems (Woburn, MA, USA). QubitTM dsDNA BR Assay Kit was obtained from Thermo Fisher Scientific (Waltham, MA, USA). TruSeq DNA LT Sample Preparation Kit and MiSeq Reagent Kit were obtained from Illumina Corporation (San Diego, CA, USA).

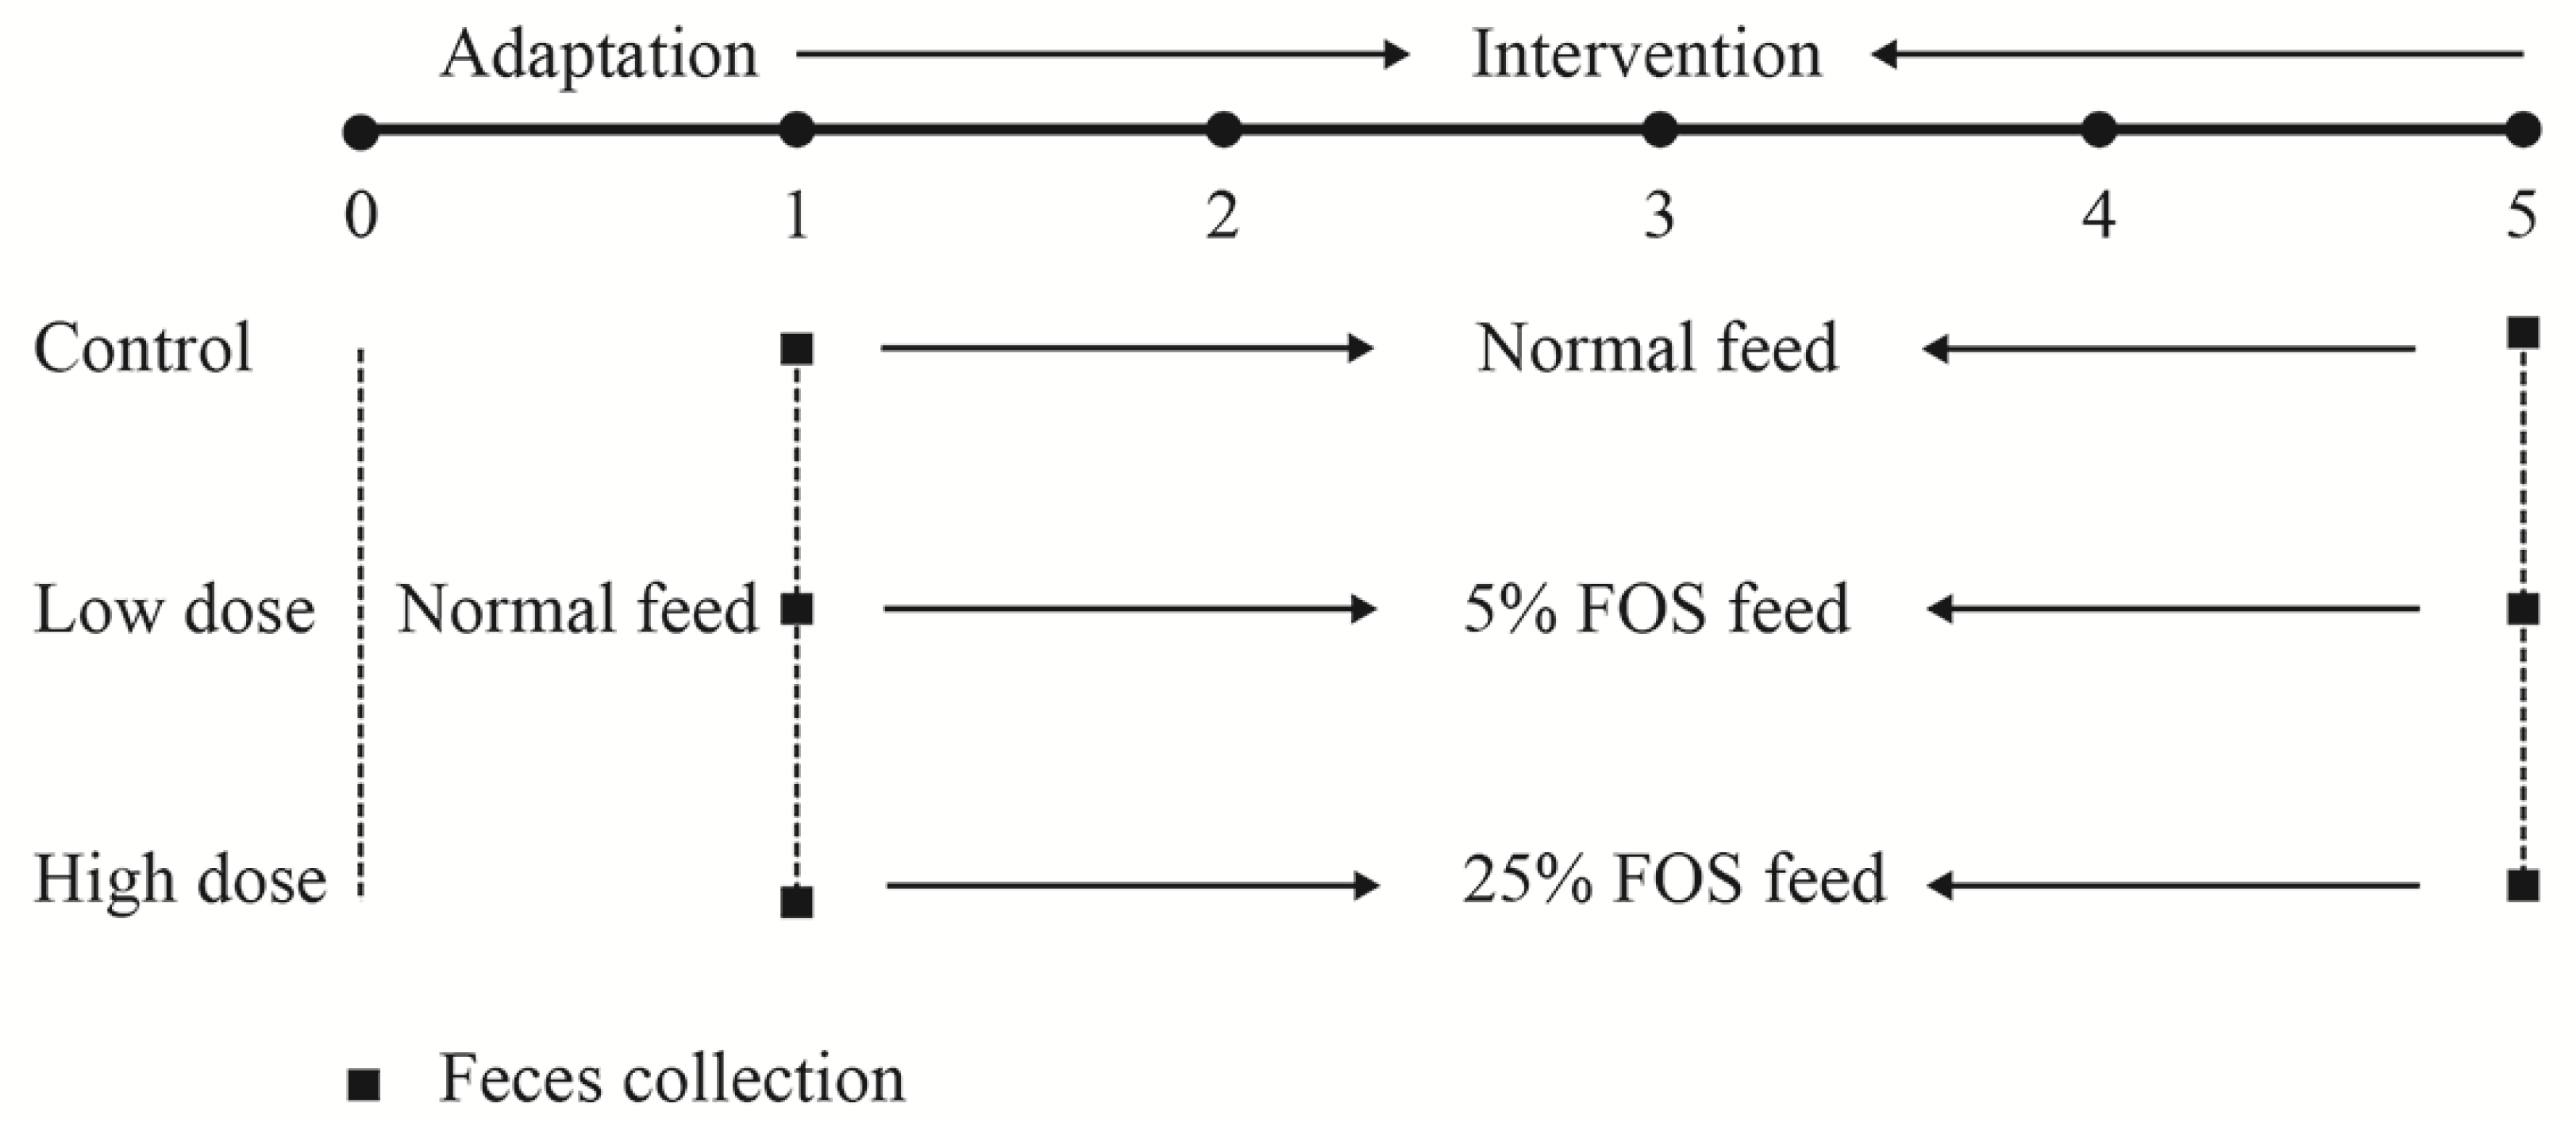
2.2. Animal Experiment Design and Sample Collection

Seven-week-old male C57BL/6J mice were purchased from Shanghai Experimental Animal Center (Shanghai, China). The mice were randomly assigned to three groups, named the control, low-dose, and high-dose groups. Each group contained 10 mice, which were fed in an independent ventilation system (IVC) in the Laboratory Animal Center of Jiangnan University. The conditions of the room were strictly controlled, with a 12 h light/dark cycle and an ambient temperature of 22 °C. The mice were allowed free access to food and water. All of the methods in the animal experiment were reviewed and approved by the ethics committee of Jiangnan University (JN No. 20160927-20161105(67)) and were in accordance with the European Union (EU) guidelines for experimental animals (Directive 2010/63/EU).
As shown in Figure 1, the mice were kept for five weeks. The mice in the control group were fed a normal diet according to Campbell’s formula [16] throughout the experiment. The mice in the low-dose and high-dose groups were fed a normal diet during the adaptation period and then modified diets containing 5% or 25% FOS (w/w), respectively, in the intervention period. The dietary formulae are shown in Table S1. The feed was weighed daily for calculation of FOS intake and the body weight of the mice was recorded every day. The feces were collected according to the methods described by Mao et al. [17] in the first and the last week as shown in Figure 1. The feces were stored at −80 °C for future analysis. At the end of the experiment, the mice were sacrificed and the blood was collected prior to sacrifice. Serum was obtained by centrifugation at 5000 g for 15 min and stored at −80 °C before analysis. The serum biochemical markers were determined by an automatic biochemical analyzer, including glucose, total cholesterol (TC), triglyceride (TG), low-density lipoprotein cholesterol (C-LDL), high-density lipoprotein cholesterol (C-HDL), IgA, IgM, and IgG.
The amount of short-chain fatty acids (SCFAs) in the feces was determined according to the method described by Mao et al. [18]. The SCFAs included acetic acid, propionic acid, butyric acid, isobutyric acid, valeric acid, and isovaleric acid, and the concentration was expressed as μmol/g feces.

2.3. Genomic DNA Extraction and PCR Amplification of the V3–V4 Region and the groEL Gene

Bacterial genomes were extracted from the feces using the FastDNA Spin Kit for Soil following the manufacturer’s instructions. To analyze the composition of the fecal microbiota, the V3–V4 region of the 16S rDNA was amplified by PCR with the bacterial genome as the template. The primers were as follows: (forward primer 341F, 5′-CCTAYGGGRBGCASCAG-3′; reverse primer 806R, 5′-GGACTACNNGGGTATCTAAT-3′). The PCR conditions were 95 °C for 5 min; 95 °C for 30 s, 52 °C for 30 s, 72 °C for 30 s, repeat for 30 cycles; and 72 °C for 10 min. To distinguish the species within the genus Bifidobacterium, the groEL gene was amplified with the primers Bif-groEL-F (5′-TCC GAT TAC GAY CGY GAG AAG CT-3′)/Bif-groEL-R (5′-CSG CYT CGG TSG TCA GGAACA G-3′) [15]. The bacterial genome was set as the template. The samples were distinguished by a barcode consisting of seven bases that were added to the 5′ end of the forward primer 341F or Bif-groEL-F, respectively.

2.4. Quantification and Sequencing

The PCR products were recovered from the agarose gel using the QIAquick Gel Extraction Kit and quantified using the QubitTM dsDNA BR Assay Kit according to the manufacturer’s instructions. Libraries were constructed using the TruSeq DNA LT Sample Preparation Kit and sequenced on Illumina MiSeq using the MiSeq v3 Reagent Kit (600 cycles-PE) following the manufacturer’s instructions.

2.5. Bioinformatic Analysis

The sequence reads were processed with the QIIME package (Quantitative Insights Into Microbial Ecology). The raw sequences were screened according to the criteria given by Mao et al. [17]. Pair-end reads with an overlap of >10 bp and without mismatches were assembled. Barcodes and sequencing primers were trimmed from the assembled sequences. The operational taxonomic unit (OTU) was established de novo using uclust with 97% sequence identity cutoff. The OTUs of Bif-groEL sequences were taxonomically assigned using the Chaperonin Sequence Database [19] and the OTUs of the V3–V4 region were taxonomically assigned using the Ribosomal Database Project (RDP) Naive Bayes classifier [20]. The first sequence in each OTU cluster was chosen as the representative sequence, and then aligned to the greengenes core set in QIIME using the PyNAST aligner [21,22]. The α- and β-diversity calculations were performed using QIIME and the similarities within the microbial communities were estimated using UniFrac analysis with weighted and unweighted principal coordinate analysis (PCoA) [23].

2.6. Isolation and Identification of Bifidobacteria from Mice Feces

To isolate bifidobacteria from the mice feces, fecal samples were collected from the mice in the high-dose group on the fifth week and placed in pre-reduced NaCl solution (0.9% w/v). The samples were gently dispersed, diluted, plated on Gut Microbiota Medium (GMM) agar [12] containing l-cysteine hydrochloride (0.5 g L−1) and mupirocin (0.05 g L−1), and incubated in an anaerobic workstation (Whitley DG250, Don Whitley Scientific Limited, West Yorkshire, UK) at 37 °C for 48 h. Colonies were picked up, purified, Gram-stained, and then species-identified by 16S rRNA gene sequencing. The 16S rRNA sequences were deposited in GenBank under the accession number MG820037 to MG820042.

2.7. Growth of Bifidobacteria on FOS

The identified bifidobacteria were inoculated on GMM agar containing FOS as the sole carbon source and bromocresol purple as the indicator. Colonies with yellow surroundings on the plates were assumed to be FOS-metabolizing bacteria [12], which was confirmed by high performance liquid chromatography (HPLC) analysis of FOS in the culture supernatant. HPLC was carried out using a Waters 1525 system equipped with a refractive index detector. The separation was performed on an aminopropyl column (250 mm, i.d. 4.6 μm) with a column temperature of 30 °C. The mobile phase was acetonitrile and water (75:25) with a flow rate of 1 mL min−1.

2.8. Statistical Analysis

The abundance count of different taxa was transformed by log2, and then normalized as follows: From each log transformed measure, the arithmetic mean of all transformed values was subtracted and the difference divided by the standard deviation of all log transformed values for the given sample. After this procedure, the abundance profiles for all samples will exhibit a mean of 0 and a standard deviation of 1 [24]. Analysis of variance (ANOVA) and a t-test were used for the comparisons of body weight, serum biochemical markers, SCFAs, Shannon index, and taxa abundance count in different groups (SPSS 16.0). The differences among groups were judged by ANOVA and the differences between two groups were judged by the t-test. p < 0.05 was considered as significant.

3. Results

3.1. Body Weight and Dietary Intake

The mice in the three groups had a similar initial body weight (Figure 2A). During the intervention period, the body weight of the mice in the control group increased gradually from the initial 20.5 g to the final 25.7 g (p < 0.05), and similar growth was observed for the mice in the low-dose group. The average body weight of the mice in the high-dose group was 21.8 g after intervention, which was lower than that in the control and low-dose groups (p < 0.01). As shown in Figure 2B, the dietary intakes in the control and low-dose groups were stable at around 3.2 g and 3.1 g, respectively. However, the dietary intake in the high-dose group fluctuated from 1.3 g to 3.3 g with an average of 2.6 g. The FOS intake remained at about 0.15 g in the low-dose group and the FOS intake in the high-dose group varied over time, ranging from 0.33 g to 0.83 g (Figure 2C).
Despite these considerable variations in body weight of the mice after FOS intervention, the serum biochemical markers, including glucose, HDL-C, LDL-C, TC, and TG, showed no significant differences among the three groups (p > 0.05, Table 1).

3.2. Short-Chain Fatty Acids (SCFAs) Determination in Feces of Mice

The concentrations of six SCFAs in the feces were determined and expressed as μmol/g feces (Table 2). Acetic, propionic, butyric, and isobutyric acid were the dominant SCFAs, and the FOS treatments showed no significant influences on the individual levels of these acids. However, the concentration of total acids in the high-dose group was significantly higher than that in the control and low-dose groups (p < 0.05). The percentage of butyric acid in the total acids decreased after FOS treatments.

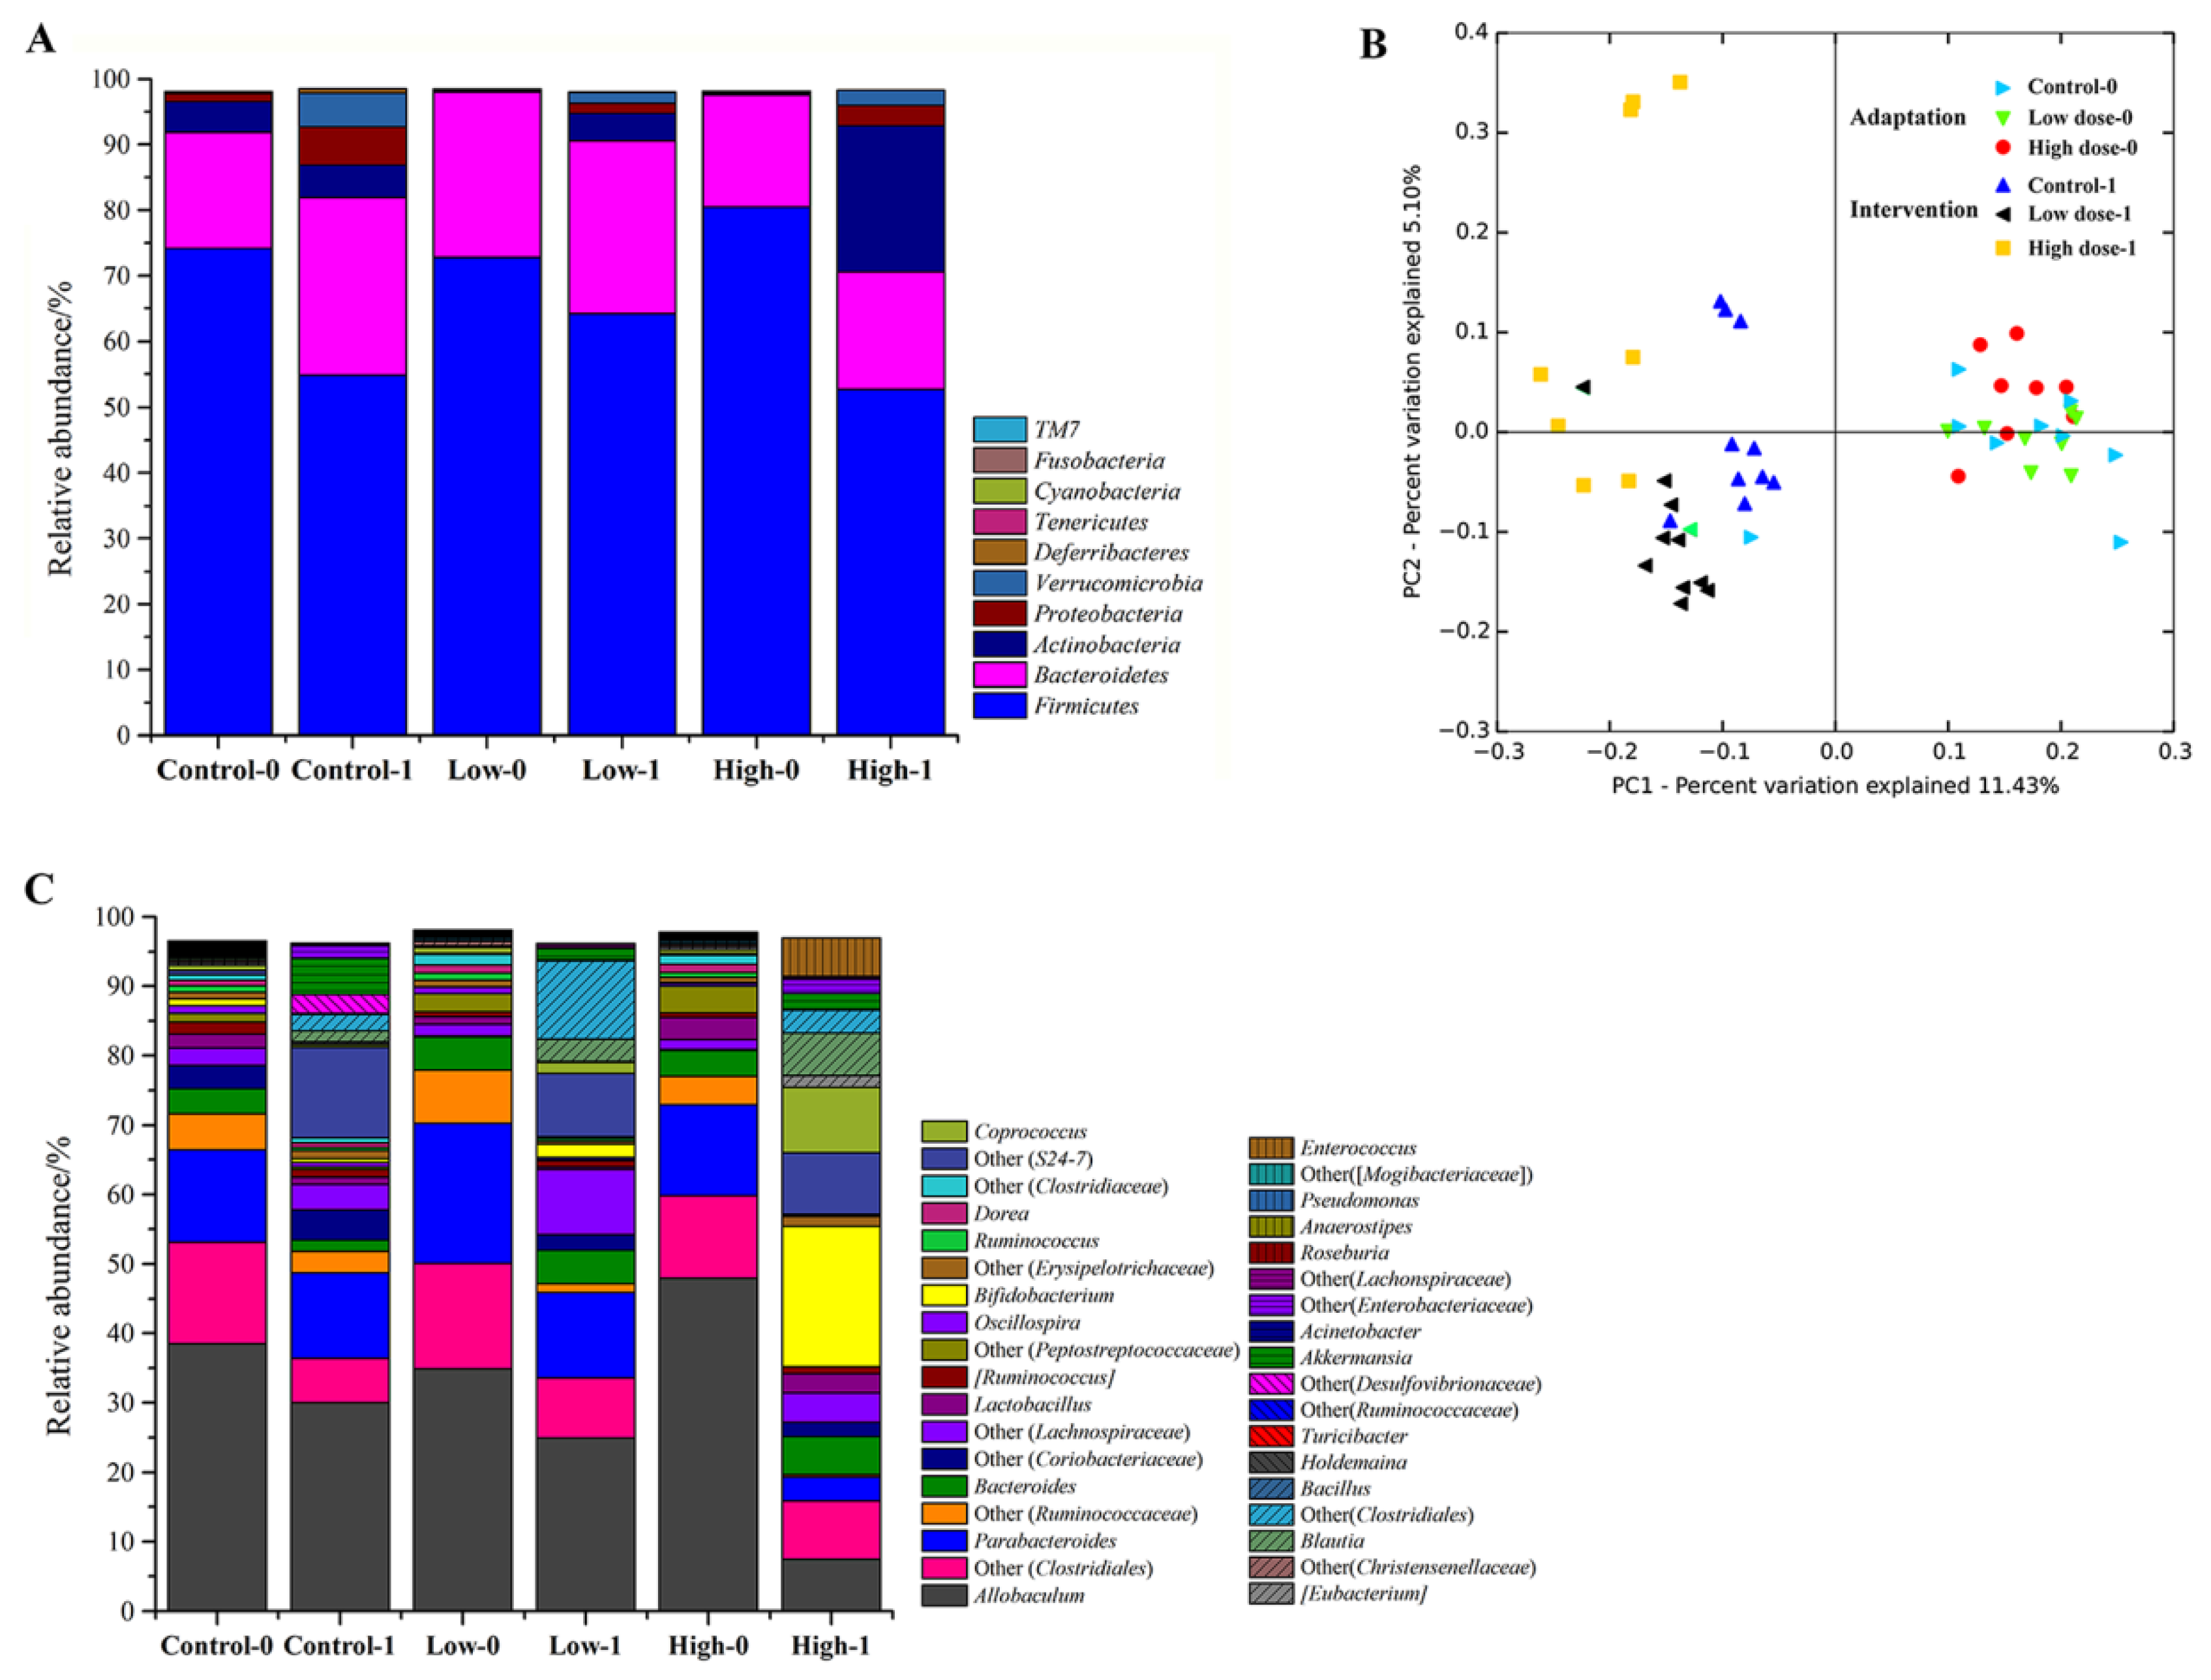
3.3. The Effects of FOS on the Fecal Microbiota of Mice

A total of 1,435,395 high-quality V3–V4 region sequences were generated from 54 samples through MiSeq sequencing, with an average of 26,581 reads per sample. The filtered sequences were clustered with the reference sequences and a 97% identity cutoff was used to define each OTU. The numbers of OTUs ranged from 529 to 3564 for each sample.
PCoA showed that the fecal microbiota of the mice in each group were similar during the adaptation period. After intervention, the fecal microbiota changed considerably, even in the control group, indicating that the normal diet also affected the microbiota composition. In Figure 3B, the data of mice microbiota in the three groups are concentrated in the right quadrant and the data are concentrated in the left quadrant after intervention. In addition, the FOS treatment groups can be distinguished from the control group, indicating that FOS intake strongly affected the fecal microbiota.
The bacteria in the mice feces mainly belonged to the phyla Firmicutes, Bacteroidetes, Actinobacteria, and Proteobacteria, among which Firmicutes was the most abundant phylum, accounting for over 70% (Figure 3A). After intervention, the relative abundance of Bacteroidetes, Proteobacteria, and Verrucomicrobia increased and the relative abundance of Firmicutes decreased in the control group. In the low-dose group, there was a significant increase in the relative abundance of Actinobacteria from 0.3% to 4.2% (p < 0.05). In the high-dose group, the relative abundance of Actinobacteria was even higher at 22.3%, indicating that the Actinobacteria abundance was positively related to the dose of FOS.
Taxonomically, 235 genera belonging to 10 phyla were identified in the mice feces, of which 36 genera with a relative abundance of >0.1% comprised >96% of the microbiota (Figure 3C). During the adaptation period, the most abundant genus was Allobaculum (>30%), which belongs to the phylum of Firmicutes. However, its abundance was decreased after intervention, especially in the high-dose group. An unknown genus “Other (S24-7)” belonging to Bacteroidales was significantly increased after FOS intervention compared with that before intervention in all three groups (p < 0.05). In the high-dose group, the most obvious change was the significant increase of Bifidobacterium from 0.2% to 20.2% (Figure 4A, p < 0.01), which contributed most of the increase of Actinobacteria at the phylum level.
Besides Bifidobacterium, the relative abundance of Coprococcus was also significantly increased (Figure 4B, p < 0.05). As shown in Figure 4C, the relative abundance of Enterococcus varied a lot among mice in the high-dose group and there was a significant increase in the relative abundance of Blautia in the high-dose group (Figure 4D), indicating that the FOS dose had an important effect on the microbiotic composition. As measured by the Shannon index (Table 3), the diversity of the intestinal microbiota was significantly increased in the low-dose group (p < 0.05), indicating that FOS intake in low doses acted to broaden bacterial diversity in the mice.

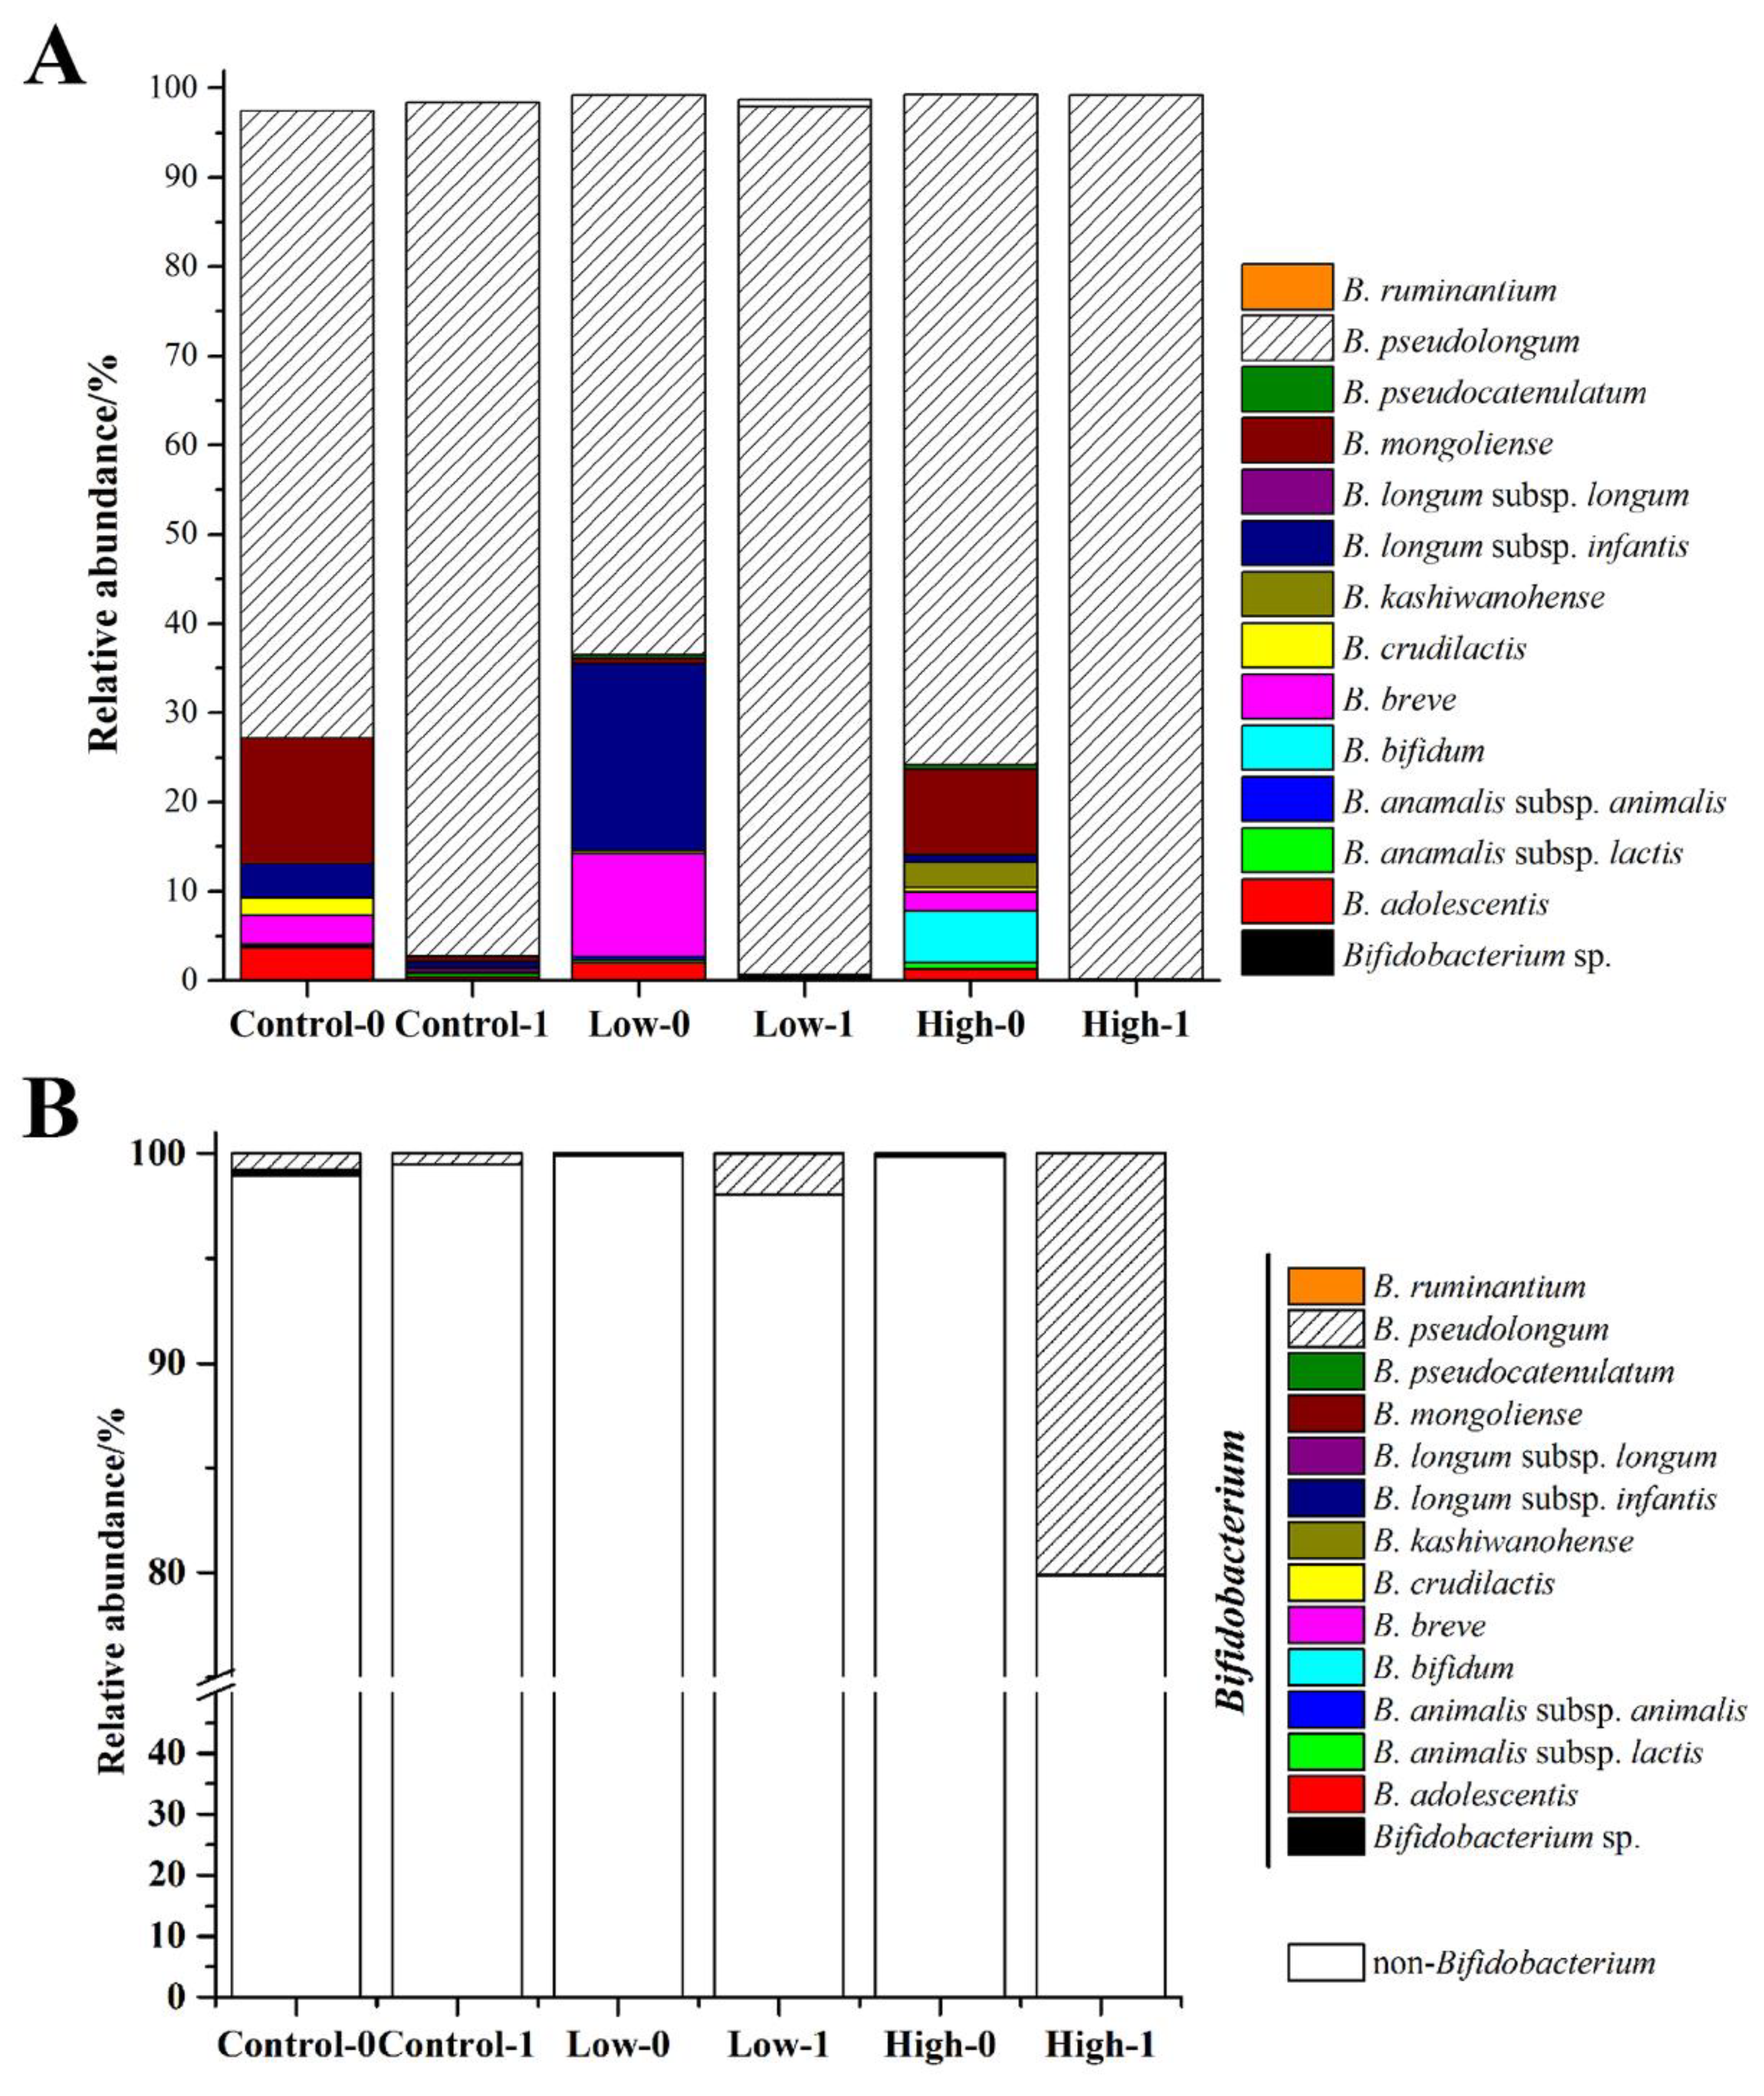
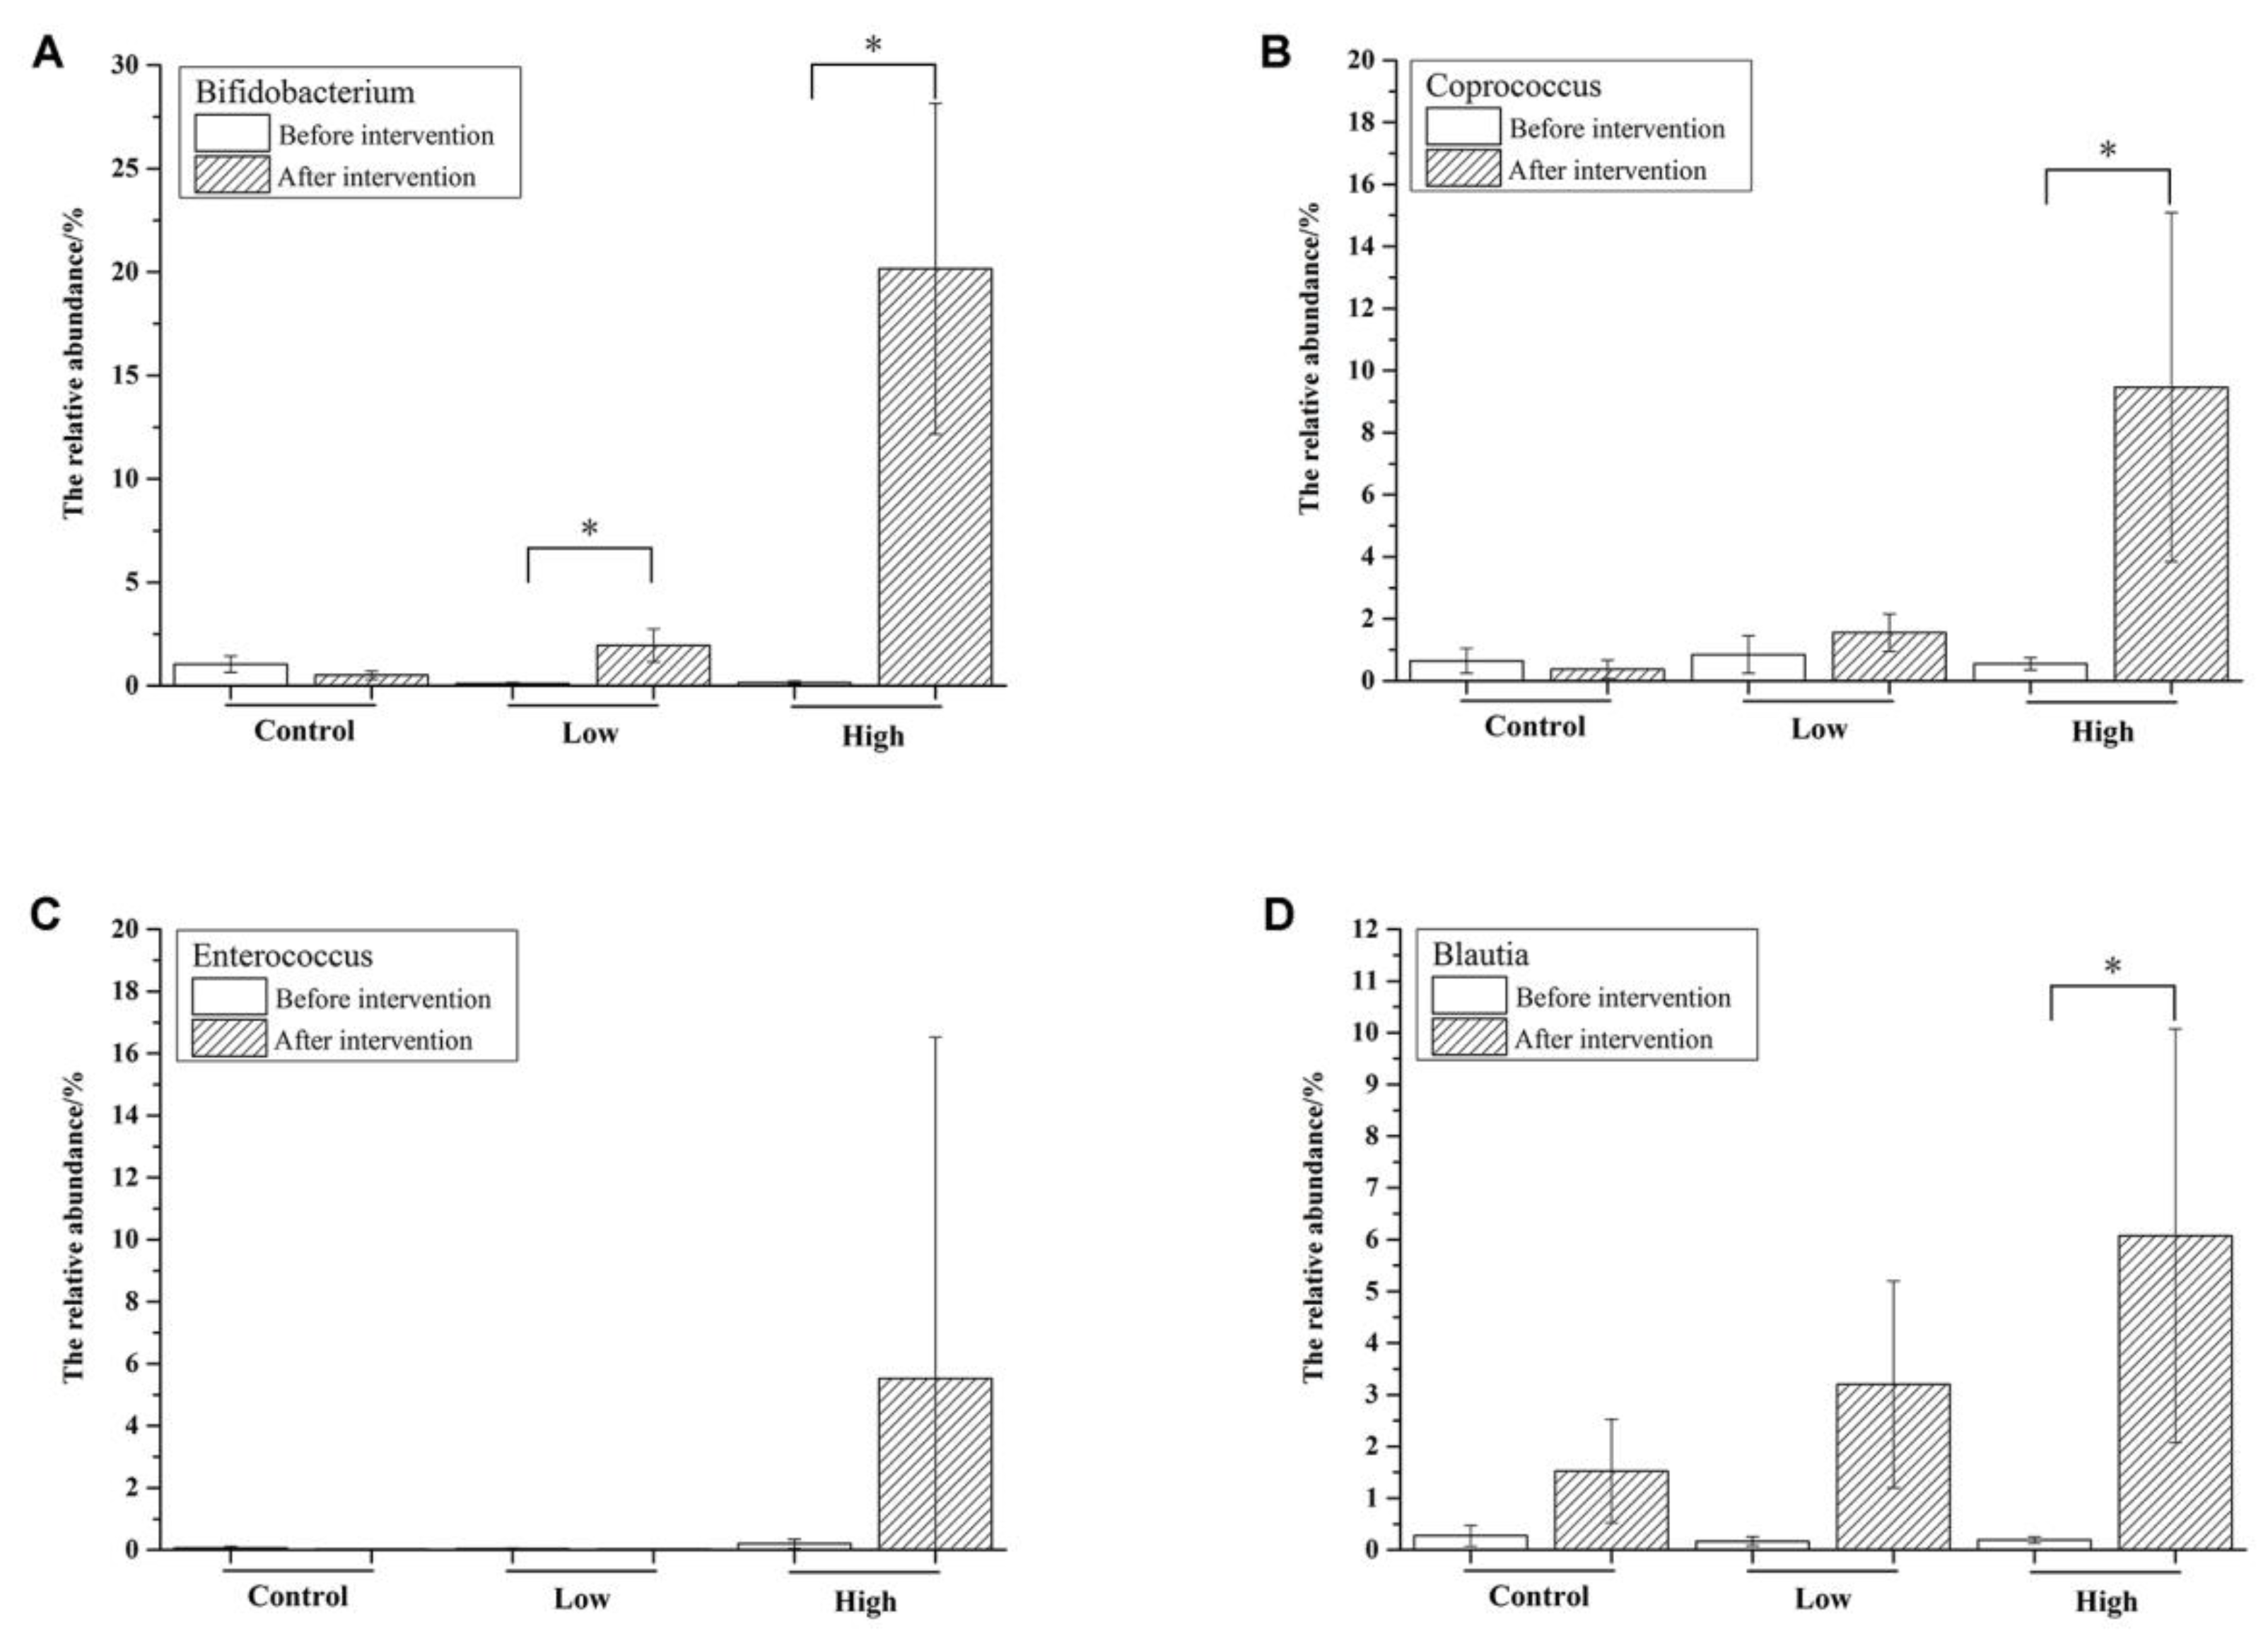
3.4. The Effects of FOS on the Composition of Bifidobacterium in Feces

The groEL gene was used to study the composition of Bifidobacterium at the species level. A total of 1,133,485 sequences were generated from 38 samples, and 14 species/subspecies were detected among all of the samples. As shown in Figure 5A, the Bifidobacterium species differed markedly in relative abundance before intervention. B. pseudolongum, B. longum subsp. infantis, B. breve, B. bifidum, B. mongoliense, and B. adolescentis were the dominant species, of which B. pseudolongum was the most abundant (18–54%). After intervention, B. pseudolongum became almost the sole bifidobacterial species, whose abundance increased to 95% in all three groups. The abundance of B. pseudolongum reached as far as 98% in the high-dose group. The relative abundances of Bifidobacterium in the fecal microbiota were 0.5%, 2.0%, and 20.2% after FOS intervention in the control, low-dose, and high-dose groups (Figure 3C), respectively. Thus, the relative abundance of B. pseudolongum reached 19.8% in the fecal microbiota in the high-dose group (Figure 5B), indicating that a high dose of FOS significantly stimulated the growth of Bifidobacterium in the gut, especially the B. pseudolongum species.

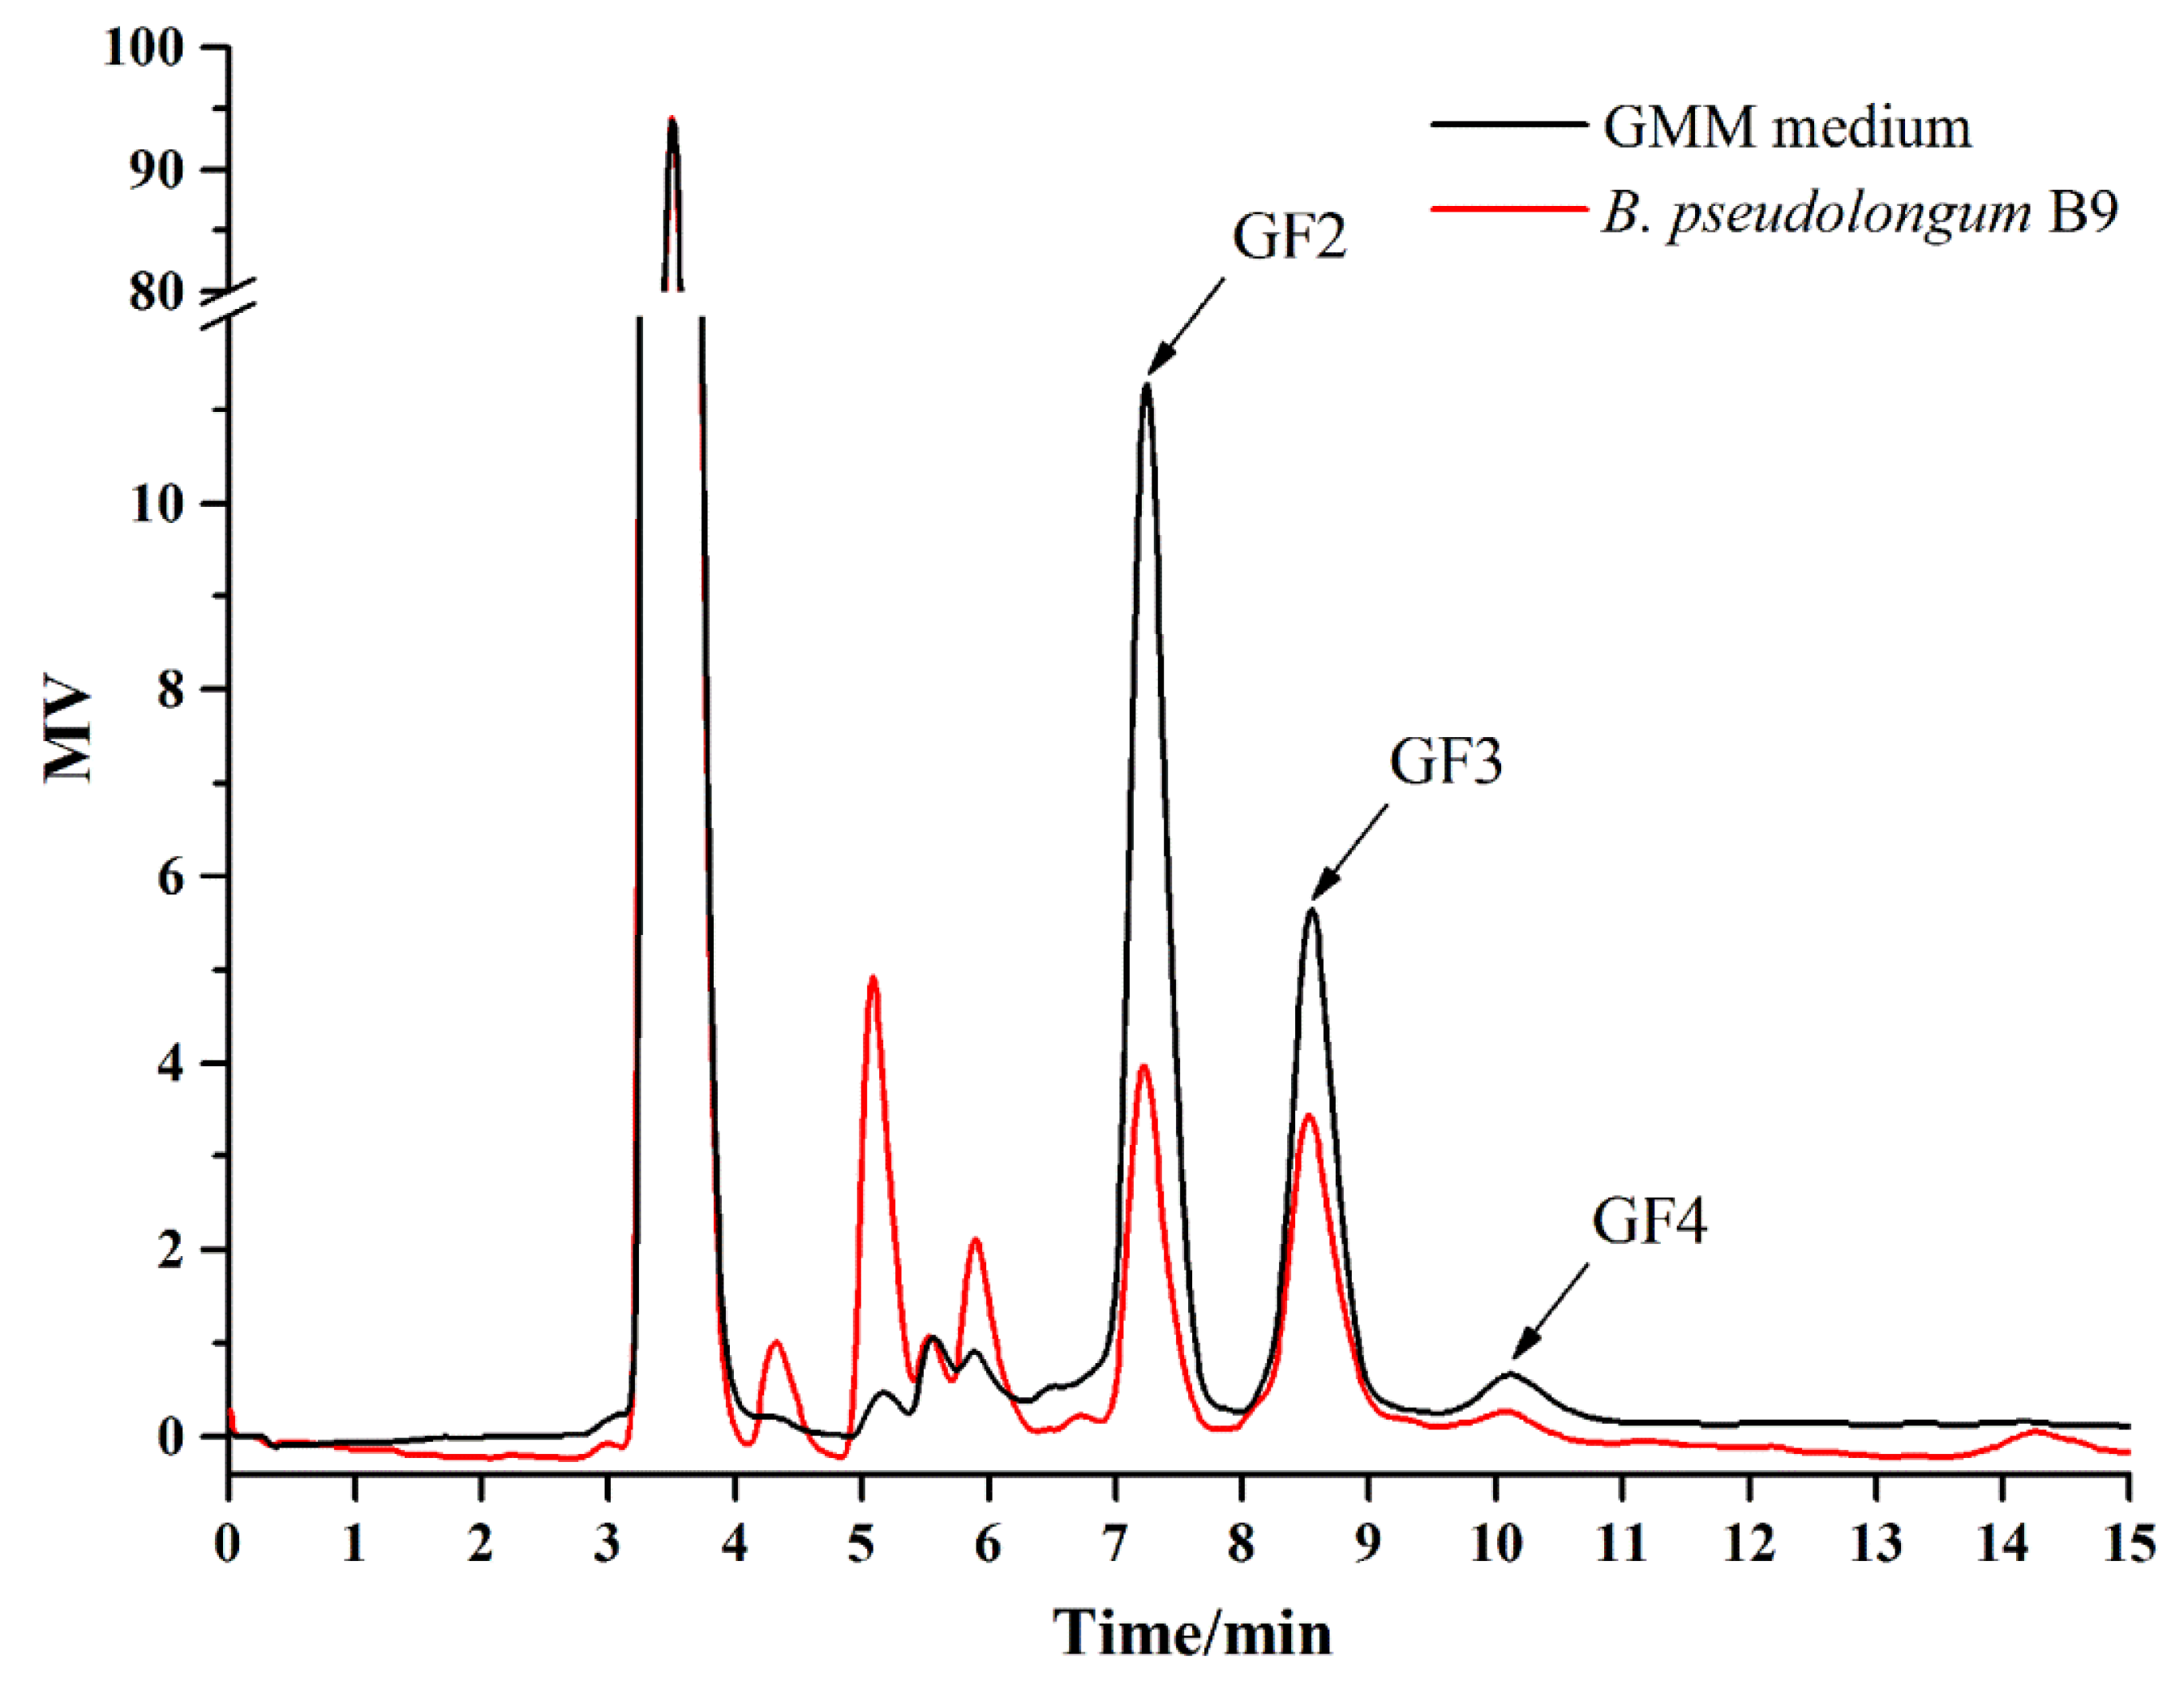
3.5. Isolation of B. pseudolongum from Mice Feces and Characterization of Its Growth on FOS

After purification and Gram staining, six strains were identified as B. pseudolongum (Table 4), and all of them had the ability to metabolize FOS according to the experiments using GMM agar containing bromocresol purple. The HPLC analysis directly confirmed that B. pseudolongum B9 was able to metabolize FOS, especially the components GF2 and GF3 (Figure 6).

4. Discussion

In this study, the effects of different doses of FOS on the composition of the intestinal microbiota of mice were investigated using high-throughput MiSeq sequencing. This was not the first and is unlikely to be the last study of the FOS effects on the gut microbiota. During the intervention period, the mice were observed to reduce their dietary intake and their feces became softer, with some feces even becoming sticky in the high-dose group, suggesting that some mice might have excess FOS that leads to slight diarrhea [25,26].
Through the MiSeq sequencing, we were able to analyze the composition of the intestinal microbiota of the mice. Before intervention, Firmicutes and Bacteroidetes were the most abundant phyla, which was in accord with our previous studies [17]. Allobaculum, belonging to Firmicutes, was most abundant (>30%) at the genus level in this study. However, in previous studies, Allobaculum accounted for <0.1% and Alitipes, belonging to Bacteroidetes, was the most abundant genus (>30%) [17].
Diet can alter the gut microbiome within 24 h and these rapid changes are reproducible [27]. Dietary FOS has a modulating effect on the fecal microbiota of the host [28,29,30], which has always been studied using bifidobacteria as the target bacteria. Bifidobacterium includes 48 species [31], but not all of them can metabolize FOS. In this study the relative abundance of Bifidobacterium was significantly increased after FOS treatment, especially in the high-dose group. We further investigated the composition of Bifidobacterium at the species level. There were 14 species/subspecies in the mice feces, dominated by B. pseudolongum, B. longum subsp. infantis, B. breve, B. bifidum, B. mongoliense, and B. adolescentis. This appears to be the first description of the composition of Bifidobacterium in mice. Hu et al. [15] found that the predominant Bifidobacterium species were B. pseudocatenulatum, B. adolescentis, and B. longum in adult human feces, while the dominant species in the gut of rats was B. animalis (>90%), suggesting that the composition of Bifidobacterium varies substantially among different hosts. It is well known that FOS can selectively stimulate the growth of bifidobacteria in hosts. However, few studies have investigated which species of Bifidobacterium were specifically stimulated. In this study, we found that after FOS treatment, the relative abundance of B. pseudolongum was significantly increased (>95%), while the other 13 species accounted for only a very small percentage. As shown in Figure 3C, the relative abundance of Bifidobacterium at the genus level reached 20% in the high-dose group, nearly all of which was contributed by B. pseudolongum (Figure 5A). Bifidobacterium species differ in a number of ways, and B. pseudolongum is particularly versatile in nutrition. As reported by Hopkins et al. [32], B. pseudolongum showed higher specific growth rates and bacterial cell yields than B. longum, B. bifidum, B. infantis, B. catenulatum, and B. adolescentis in a medium with FOS as the sole carbon source. We succeeded in isolating the B. pseudolongum strains from the mice feces and verified their abilities to metabolize FOS. Thus, we inferred that FOS significantly stimulated the growth of B. pseudolongum in mice.
Besides Bifidobacterium, the gut contains many other genera capable of utilizing FOS, such as Clostridium, Streptococcus, Coprococcus, and Enterococcus [12,33,34,35]. In this study, Clostridium and Streptococcus remained at a very low level (<0.1%), while Coprococcus was significantly increased in the high-dose group (p < 0.05) after FOS treatment (Figure 4B). Olsenella, a genus belonging to Actinobacteria, has been shown to have the ability to utilize FOS [17]. Previously, Olsenella was significantly increased to a high level, comparable with Bifidobacterium, after FOS treatment in high doses. However, Olsenella was not detected in the present study. Blautia, in the family Lachnospiraceae, is a particularly important microbial genus for nutrient assimilation [36] and has been shown to supply energy to the host via polysaccharide degradation [37,38]. Moreover, through an earlier BLASTP search, Blautia was predicted to contain genes related to FOS transport and hydrolysis [12]. Therefore, we propose that Blautia may have the ability to utilize FOS, leading to the increase in its abundance herein (Figure 4D).
In this study, we found that FOS significantly increased the abundance of Bifidobacterium in mice microbiota. Although a total of 14 Bifidobacterium species are known in mice, the increase in this genus was almost entirely contributed by B. pseudolongum. We isolated the B. pseudolongum strains from mice feces, but the mechanism for the selective stimulation remained unclear. We speculate that the location of these bacteria within the gut, the extent of their access to FOS in the gut, and their inherent abilities to metabolize FOS may be responsible for the selectiveness. It is likely that many species capable of metabolizing FOS could in future be isolated from mice feces. Further in vitro and in vivo investigations are needed to reveal the mechanism of the selective stimulation of B. pseudolongum by FOS. This would enable a deeper understanding of the basic principles of dietary carbohydrates and gut microbiota and the development of guidelines to promote health.

Supplementary Materials

The following are available online at https://0-www-mdpi-com.brum.beds.ac.uk/2072-6643/10/8/1105/s1. Table S1: Dietary formula (g).

Author Contributions

B.M., H.Z., and W.C. conceived and designed the work. B.M., J.G., and D.L. conducted the experiments, analyzed and interpreted the data. S.C. and J.Z. facilitated the experiments. B.M. and J.G. performed the statistical analysis and wrote the manuscript. D.L., J.Z., and W.C. reviewed and edited the manuscript. All authors read and approved the final version of this manuscript.

Funding

This work was supported by National Natural Science Foundation of China (Grant No. 31601453, 31530056, 31471721), National First-Class Discipline Program of Food Science and Technology (JUFSTR20180102), and Collaborative Innovation Center of Food Safety and Quality Control in Jiangsu Province.

Acknowledgments

The authors would like to thank Mingluo Pan (Shisheng Shi’an Biotech. Ltd., Wuxi, China) for his help with the data analysis.

Conflicts of Interest

The authors declare no conflict of interest.

References

  1. Backhed, F.; Ley, R.E.; Sonnenburg, J.L.; Peterson, D.A.; Gordon, J.I. Host-bacterial mutualism in the human intestine. Science 2005, 307, 1915–1920. [Google Scholar] [CrossRef] [PubMed]
  2. Sekirov, I.; Russell, S.L.; Antunes, L.C.M.; Finlay, B.B. Gut microbiota in health and disease. Physiol. Rev. 2010, 90, 859–904. [Google Scholar] [CrossRef] [PubMed]
  3. Collins, M.D.; Gibson, G.R. Probiotics, prebiotics, and synbiotics: Approaches for modulating the microbial ecology of the gut. Am. J. Clin. Nutr. 1999, 69, 1052s–1057s. [Google Scholar] [CrossRef] [PubMed]
  4. Picard, C.; Fioramonti, J.; Francois, A.; Robinson, T.; Neant, F.; Matuchansky, C. Review article: Bifidobacteria as probiotic agents—Physiological effects and clinical benefits. Aliment. Pharm. Ther. 2005, 22, 495–512. [Google Scholar] [CrossRef] [PubMed]
  5. Turnbaugh, P.J.; Ley, R.E.; Mahowald, M.A.; Magrini, V.; Mardis, E.R.; Gordon, J.I. An obesity-associated gut microbiome with increased capacity for energy harvest. Nature 2006, 444, 1027–1031. [Google Scholar] [CrossRef] [PubMed]
  6. LeBlanc, J.G.; Milani, C.; de Giori, G.S.; Sesma, F.; van Sinderen, D.; Ventura, M. Bacteria as vitamin suppliers to their host: A gut microbiota perspective. Curr. Opin. Biotechnol. 2013, 24, 160–168. [Google Scholar] [CrossRef] [PubMed]
  7. Kleerebezem, M.; Vaughan, E.E. Probiotic and gut Lactobacilli and Bifidobacteria: Molecular approaches to study diversity and activity. Annu. Rev. Microbiol. 2009, 63, 269–290. [Google Scholar] [CrossRef] [PubMed]
  8. Gibson, G.R.; Hutkins, R.; Sanders, M.E.; Prescott, S.L.; Reimer, R.A.; Salminen, S.J.; Scott, K.; Stanton, C.; Swanson, K.S.; Cani, P.D.; et al. The international scientific association for probiotics and prebiotics (ISAPP) consensus statement on the definition and scope of prebiotics. Nat. Rev. Gastroenterol. Hepatol. 2017, 14, 491–502. [Google Scholar] [CrossRef] [PubMed]
  9. Gibson, G.R.; Roberfroid, M.B. Dietary modulation of the human colonic microbiota—Introducing the concept of prebiotics. J. Nutr. 1995, 125, 1401–1412. [Google Scholar] [CrossRef] [PubMed]
  10. Roberfroid, M.B. Prebiotics: Preferential substrates for specific germs? Am. J. Clin. Nutr. 2001, 73, 406s–409s. [Google Scholar] [CrossRef] [PubMed]
  11. Gibson, G.R.; Beatty, E.R.; Wang, X.; Cummings, J.H. Selective stimulation of Bifidobacteria in the human colon by oligofructose and inulin. Gastroenterology 1995, 108, 975–982. [Google Scholar] [CrossRef]
  12. Mao, B.Y.; Li, D.Y.; Zhao, J.X.; Liu, X.M.; Gu, Z.N.; Chen, Y.Q.; Zhang, H.; Chen, W. In vitro fermentation of fructooligosaccharides with human gut bacteria. Food Funct. 2015, 6, 947–954. [Google Scholar] [CrossRef] [PubMed]
  13. Vigsnaes, L.K.; Holck, J.; Meyer, A.S.; Licht, T.R. In vitro fermentation of sugar beet arabino-oligosaccharides by fecal microbiota obtained from patients with ulcerative colitis to selectively stimulate the growth of Bifidobacterium spp. and Lactobacillus spp. Appl. Environ. Microbiol. 2011, 77, 8336–8344. [Google Scholar] [CrossRef] [PubMed]
  14. Junick, J.; Blaut, M. Quantification of human fecal Bifidobacterium species by use of quantitative real-time PCR analysis targeting the groEL gene. Appl. Environ. Microbiol. 2012, 78, 2613–2622. [Google Scholar] [CrossRef] [PubMed]
  15. Hu, L.J.; Lu, W.W.; Wang, L.L.; Pan, M.L.; Zhang, H.; Zhao, J.X.; Chen, W. Assessment of Bifidobacterium species using groEL Gene on the basis of Illumina MiSeq high-throughput sequencing. Genes 2017, 8, 336. [Google Scholar] [CrossRef] [PubMed]
  16. Campbell, J.M.; Fahey, G.C.; Wolf, B.W. Selected indigestible oligosaccharides affect large bowel mass, cecal and fecal short-chain fatty acids, pH and microflora in rats. J. Nutr. 1997, 127, 130–136. [Google Scholar] [CrossRef] [PubMed]
  17. Mao, B.Y.; Li, D.Y.; Zhao, J.X.; Liu, X.M.; Gu, Z.N.; Chen, Y.Q.; Zhang, H.; Chen, W. Metagenomic insights into the effects of fructo-oligosaccharides (FOS) on the composition of fecal microbiota in mice. J. Agric. Food Chem. 2015, 63, 856–863. [Google Scholar] [CrossRef] [PubMed]
  18. Mao, B.Y.; Li, D.Y.; Ai, C.Q.; Zhao, J.X.; Zhang, H.; Chen, W. Lactulose differently modulates the composition of luminal and mucosal microbiota in C57BL/6J mice. J. Agric. Food Chem. 2016, 64, 6240–6247. [Google Scholar] [CrossRef] [PubMed]
  19. Hill, J.E.; Penny, S.L.; Crowell, K.G.; Goh, S.H.; Hemmingsen, S.M. cpnDB: A chaperonin sequence database. Genome Res. 2004, 14, 1669–1675. [Google Scholar] [CrossRef] [PubMed]
  20. Wang, Q.; Garrity, G.M.; Tiedje, J.M.; Cole, J.R. Naive Bayesian classifier for rapid assignment of rRNA sequences into the new bacterial taxonomy. Appl. Environ. Microbiol. 2007, 73, 5261–5267. [Google Scholar] [CrossRef] [PubMed]
  21. Caporaso, J.G.; Kuczynski, J.; Stombaugh, J.; Bittinger, K.; Bushman, F.D.; Costello, E.K.; Fierer, N.; Pena, A.G.; Goodrich, J.K.; Gordon, J.I.; et al. QIIME allows analysis of high-throughput community sequencing data. Nat. Methods 2010, 7, 335–336. [Google Scholar] [CrossRef] [PubMed] [Green Version]
  22. Caporaso, J.G.; Bittinger, K.; Bushman, F.D.; DeSantis, T.Z.; Andersen, G.L.; Knight, R. PyNAST: A flexible tool for aligning sequences to a template alignment. Bioinformatics 2010, 26, 266–267. [Google Scholar] [CrossRef] [PubMed]
  23. Lozupone, C.; Knight, R. UniFrac: A new phylogenetic method for comparing microbial communities. Appl. Environ. Microbiol. 2005, 71, 8228–8235. [Google Scholar] [CrossRef] [PubMed]
  24. Zhao, L.; Wang, G.; Siegel, P.; He, C.; Wang, H.; Zhao, W.; Zhai, Z.; Tian, F.; Zhao, J.; Zhang, H.; et al. Quantitative genetic background of the host influences gut microbiomes in chickens. Sci. Rep. 2013, 3, 1163. [Google Scholar] [CrossRef] [PubMed]
  25. Coussement, P.A. Inulin and oligofructose: Safe intakes and legal status. J. Nutr. 1999, 129, 1412S–1417S. [Google Scholar] [CrossRef] [PubMed]
  26. Kawaguchi, M.; Tashiro, Y.; Adachi, T.; Tamura, Z. Changes in intestinal condition, fecal microflora and composition of rectal gas after administration of fructooligosaccharide and lactulose at different doses. Biosci. Microflora 1993, 12, 57–67. [Google Scholar] [CrossRef]
  27. David, L.A.; Maurice, C.F.; Carmody, R.N.; Gootenberg, D.B.; Button, J.E.; Wolfe, B.E.; Ling, A.V.; Devlin, A.S.; Varma, Y.; Fischbach, M.A.; et al. Diet rapidly and reproducibly alters the human gut microbiome. Nature 2014, 505, 559–563. [Google Scholar] [CrossRef] [PubMed] [Green Version]
  28. Shen, J.A.; Zhang, B.R.; Wei, H.; Che, C.Y.; Ding, D.Z.; Hua, X.G.; Bucheli, P.; Wang, L.H.; Li, Y.X.; Pang, X.Y.; et al. Assessment of the modulating effects of fructo-oligosaccharides on fecal microbiota using human flora-associated piglets. Arch. Microbiol. 2010, 192, 959–968. [Google Scholar] [CrossRef] [PubMed]
  29. Mikkelsen, L.L.; Jensen, B.B. Effect of fructo-oligosaccharides and transgalacto-oligosaccharides on microbial populations and microbial activity in the gastrointestinal tract of piglets post-weaning. Anim. Feed Sci. Technol. 2004, 117, 107–119. [Google Scholar] [CrossRef]
  30. Shadid, R.; Haarman, M.; Knol, J.; Theis, W.; Beermann, C.; Rjosk-Dendorfer, D.; Schendel, D.J.; Koletzko, B.V.; Krauss-Etschmann, S. Effects of galactooligosaccharide and long-chain fructooligosaccharide supplementation during pregnancy on maternal and neonatal microbiota and immunity—A randomized, double-blind, placebo-controlled study. Am. J. Clin. Nutr. 2007, 86, 1426–1437. [Google Scholar] [CrossRef] [PubMed]
  31. Duranti, S.; Milani, C.; Lugli, G.A.; Turroni, F.; Mancabelli, L.; Sanchez, B.; Ferrario, C.; Viappiani, A.; Mangifesta, M.; Mancino, W.; et al. Insights from genomes of representatives of the human gut commensal Bifidobacterium bifidum. Environ. Microbiol. 2015, 17, 2515–2531. [Google Scholar] [CrossRef] [PubMed]
  32. Hopkins, M.J.; Cummings, J.H.; Macfarlane, G.T. Inter-species differences in maximum specific growth rates and cell yields of bifidobacteria cultured on oligosaccharides and other simple carbohydrate sources. J. Appl. Microbiol. 1998, 85, 381–386. [Google Scholar] [CrossRef]
  33. Hidaka, T.; Eida, T.; Takizawa, T.; Tokunaga, T.; Tashiro, Y. Effects of fructooligosaccharides on intestinal flora and human health. Biosci. Microflora 1986, 5, 37–50. [Google Scholar] [CrossRef]
  34. Scott, K.P.; Martin, J.C.; Duncan, S.H.; Flint, H.J. Prebiotic stimulation of human colonic butyrate-producing bacteria and bifidobacteria, in vitro. FEMS Microbiol. Ecol. 2014, 87, 30–40. [Google Scholar] [CrossRef] [PubMed]
  35. Linke, C.M.; Woodiga, S.A.; Meyers, D.J.; Buckwalter, C.M.; Salhi, H.E.; King, S.J. The ABC Transporter Encoded at the Pneumococcal fructooligosaccharide utilization locus determines the ability to utilize long- and short-chain fructooligosaccharides. J. Bacteriol. 2013, 195, 1031–1041. [Google Scholar] [CrossRef] [PubMed]
  36. Eren, A.M.; Sogin, M.L.; Morrison, H.G.; Vineis, J.H.; Fisher, J.C.; Newton, R.J.; McLellan, S.L. A single genus in the gut microbiome reflects host preference and specificity. ISME J. 2015, 9, 90–100. [Google Scholar] [CrossRef] [PubMed]
  37. Biddle, A.; Stewart, L.; Blanchard, J.; Leschine, S. Untangling the genetic basis of fibrolytic specialization by Lachnospiraceae and Ruminococcaceae in diverse gut communities. Diversity 2013, 5, 627–640. [Google Scholar] [CrossRef]
  38. Flint, H.J.; Bayer, E.A.; Rincon, M.T.; Lamed, R.; White, B.A. Polysaccharide utilization by gut bacteria: Potential for new insights from genomic analysis. Nat. Rev. Microbiol. 2008, 6, 121–131. [Google Scholar] [CrossRef] [PubMed]
Figure 1. Experimental design. Thirty mice were randomly assigned to three groups, named the control, low-dose, and high-dose groups. During the adaptation period (first week), the mice were fed normal feed. During the intervention period, mice in the control group continued to receive normal feed, while mice in the low- and high-dose groups received the fructooligosaccharides (FOS) feed, containing 5% or 25% FOS (w/w), respectively. Feces were collected before and after FOS treatment on the first and fifth week.
Nutrients 10 01105 g001
Figure 2. The body weight of mice (A), the dietary intake (B), and FOS intake (C) of mice in the three groups during the intervention period.
Nutrients 10 01105 g002
Figure 3. Changes of the composition of fecal microbiota for the two FOS diets. Bacterial diversity at the phylum level (A) and genus level (C). Principal coordinate analysis (PCoA) score plots based on unweighted UniFrac metrics (B), where each point represents the composition of the fecal microbiota of one mouse. “0” stands for before FOS intervention and “1” stands for after FOS intervention.
Nutrients 10 01105 g003
Figure 4. Changes of the relative abundance of selected genera, including Bifidobacterium (A), Coprococcus (B), Enterococcus (C), and Blautia (D). Significant differences (p < 0.05) are indicated with the symbol (*).
Nutrients 10 01105 g004
Figure 5. Effects of different doses of FOS on the relative abundance of Bifidobacterium species in the Bifidobacterium genus (A) and in the fecal microbiota (B). “0” stands for before FOS intervention and “1” stands for after FOS intervention.
Nutrients 10 01105 g005
Figure 6. High performance liquid chromatography (HPLC) analysis of the supernatant for B. pseudolongum (B9) in Gut Microbiota Medium (GMM)–FOS medium. GF2, GF3, and GF4 were the main components of FOS.
Nutrients 10 01105 g006
Table 1. Serum biochemical markers in mice. Glucose (Glu), total cholesterol (TC), triglyceride (TG), low-density lipoprotein cholesterol (LDL-C), high-density lipoprotein cholesterol (HDL-C).
GroupGluHDL-CLDL-CHDL-C/LDL-CTCTG
Control4.61 ± 0.773.06 ± 0.750.38 ± 0.098.15 ± 0.883.45 ± 0.911.14 ± 0.28
Low-dose7.73 ± 2.143.28 ± 0.240.40 ± 0.048.26 ± 0.923.72 ± 0.311.03 ± 0.47
High-dose5.77 ± 1.952.47 ± 0.250.35 ± 0.137.81 ± 2.542.83 ± 0.380.70 ± 0.18
p1NSNSNSNSNSNS
1 NS represents that the difference is not significant (p > 0.05).
Table 2. Concentration of short-chain fatty acids (SCFAs) in feces of mice in different groups.
SCFAs, μmol/g 1ControlLow-DoseHigh-Dosep2
Acetic acid36.46 ± 10.8325.61 ± 15.2045.24 ± 20.02NS
Propionic acid24.37 ± 7.9017.55 ± 6.9231.25 ± 9.44NS
Butyric acid20.07 ± 7.467.43 ± 5.6713.78 ± 12.24NS
Isobutyric acid19.74 ± 6.1714.45 ± 7.0831.08 ± 15.81NS
Isovaleric acid14.53 ± 5.3610.45 ± 3.9318.58 ± 5.17NS
Valeric acid10.25 ± 3.607.17 ± 2.9016.52 ± 9.94NS
Total125.41 ± 41.23 bc80.64 ± 28.38 bc156.44 ± 51.20 a<0.05
1 SCFAs concentration is expressed as μmol/g; 2 NS represents that the difference is not significant (p > 0.05); abc are different letters that indicate significant differences between the different groups (p < 0.05).
Table 3. Shannon Index of three groups before and after intervention.
GroupControlLow-doseHigh-dose
01p01p01p
Shannon Index (SI)5.29 ± 1.495.37 ± 0.35>0.054.99 ± 0.645.60 ± 0.51<0.054.32 ± 0.685.01 ± 0.75>0.05
‘0’ stands for before fructooligosaccharides (FOS) intervention; ‘1’ stands for after FOS intervention.
Table 4. The identified strains isolated from mice feces.
No.StrainMost Positive MatchIdent (%)GenBank
1B9Bifidobacterium pseudolongum PV8-299%MG820037
2B11Bifidobacterium pseudolongum strain UMB-MBP-0199%MG820038
3B24Bifidobacterium pseudolongum strain UMB-MBP-0199%MG820039
4B29Bifidobacterium pseudolongum strain UMB-MBP-0199%MG820040
5B72Bifidobacterium pseudolongum strain UMB-MBP-0199%MG820041
6B129Bifidobacterium pseudolongum PV8-299%MG820042

