Article

Single-Dose SDA-Rich Echium Oil Increases Plasma EPA, DPAn3, and DHA Concentrations

1
Institute of Food Science and Human Nutrition, Leibniz University Hannover, 30177 Hannover, Germany
2
Chair of Food Chemistry, Faculty of Mathematics and Natural Sciences, University of Wuppertal, 42119 Wuppertal, Germany
*
Author to whom correspondence should be addressed.
Submission received: 12 September 2019 / Revised: 26 September 2019 / Accepted: 28 September 2019 / Published: 2 October 2019
(This article belongs to the Special Issue Polyunsaturated Fatty Acids Intake and Human Health)

Abstract

:
The omega-3 (n3) polyunsaturated fatty acids (PUFA) eicosapentaenoic acid (EPA) and docosahexaenoic acid (DHA) are associated with health benefits. The primary dietary source of EPA and DHA is seafood. Alpha-linoleic acid (ALA) has not been shown to be a good source for EPA and DHA; however, stearidonic acid (SDA)—which is naturally contained in echium oil (EO)—may be a more promising alternative. This study was aimed at investigating the short-term n3 PUFA metabolism after the ingestion of a single dose of EO. Healthy young male subjects (n = 12) ingested a single dose of 26 g of EO after overnight fasting. Plasma fatty acid concentrations and relative amounts were determined at baseline and 2, 4, 6, 8, 24, 48, and 72 h after the ingestion of EO. During the whole examination period, the participants received standardized nutrition. Plasma ALA and SDA concentrations increased rapidly after the single dose of EO. Additionally, EPA and DPAn3 concentrations both increased significantly by 47% after 72 h compared to baseline; DHA concentrations also significantly increased by 21% after 72 h. To conclude, EO increases plasma ALA, SDA, EPA, DPAn3, and DHA concentrations and may be an alternative source for these n3 PUFAs.

1. Introduction

Long-chain (LC) omega-3 (n3) polyunsaturated fatty acids (PUFAs), namely eicosapentaenoic acid (EPA, C20:5n3) and docosahexaenoic acid (DHA, C22:6n3), are associated with health benefits including lower risk for cardiovascular disease and mortality [1,2,3,4,5], reduction of inflammatory conditions [2,6], angiogenesis, tumor growth, metastasis [2,7], and better visual and neurological development [8]. More and more, the positive health effects of docosapentaenoic acid (DPAn3, C22:5n3) are coming into focus [9,10,11]. However, seafood intake—the main dietary source of EPA and DHA—and blood status of EPA and DHA are low in most countries worldwide [12,13]. Therefore, alternative dietary sources of LC n3 PUFAs are necessary in order to fill the existing intake gap.
The essential plant-derived n3 PUFA alpha-linolenic acid (ALA, C18:3n3) can be converted into EPA, DPAn3, and theoretically also to DHA in a multistep elongation and desaturation reaction [14]. However, studies have shown that the conversion of ALA to EPA and especially to DHA is very inefficient or non-existent in humans as reviewed in Reference [15]. Due to the concurrent high linoleic acid (LA, C18:2n6) intake—which is typical in many Western diets—even large doses of ALA result in comparatively small increases in plasma EPA and no or negative effects on DHA [16,17,18]. A 12-week linseed oil (LO) supplementation study with a comparatively high ALA dose showed that DHA concentrations in red blood cells decreased significantly [17].
Another more promising source for a higher conversion of precursor n3 PUFAs to LC n3 PUFAs might be echium oil (EO)—one of a few natural sources of stearidonic acid (SDA, C18:4n3). SDA is an intermediate in the conversion of ALA to EPA, more precisely the product of ALA desaturation by delta-6-desaturase (D6D), whose activity is regulated by the expression of the fatty acid desaturase 2 (FADS2) gene. As D6D is the rate limiting enzyme in the conversion of ALA to EPA [19,20], EPA synthesis from SDA might be more efficient than from ALA [21].
Previous studies have shown that supplementation with SDA-rich oils resulted in higher EPA levels compared to ALA-rich oils, while neither ALA- nor SDA-rich oils had an effect on DHA levels [22,23,24,25] as reviewed in Reference [26]. Short-term changes in the plasma fatty acid pattern after a single dose of EO would give a deeper insight into the PUFA metabolism. Therefore, this study aimed at investigating the short-term n3 PUFA metabolism after the ingestion of a single dose of 26 g of EO over a period of 72 h under standardized conditions/nutrition.

2. Materials and Methods

This investigator-initiated study was conducted according to the guidelines laid down in the Declaration of Helsinki, and all procedures involving human subjects were approved by the ethic committee at the medical chamber of Lower Saxony (Hannover, Germany). Written informed consent was obtained from all subjects. The study is registered in the German clinical trial register (no. DRKS00012257) and was conducted at the Institute of Food Science and Human Nutrition, Leibniz University Hannover, Germany.
Briefly, the study consisted of a screening, a 4-week run-in phase, a single-dose EO ingestion, and a 72-h lasting examination under standardized nutrition. Recruitment, screening procedure, and inclusion and exclusion criteria can be found in the SI. During the run-in phase, participants were requested to abstain from fish, seafood, and ALA-rich vegetable oils, such as LO or chia seeds to minimize nutritional effects on the plasma fatty acid pattern. The examination started with a fasting blood draw, the determination of blood pressure, body height, body weight, and heart rate, and the subjects completed a questionnaire to obtain information about changes in medication, diet, and lifestyle habits (e.g. physical activity) compared to the screening questionnaire. Subsequently, 26 g of EO (Table 1) was ingested. Possible side effects of the EO were recorded 2 h after the single dose ingestion with a questionnaire. Further blood samples were taken at 2, 4, 6, 8, 24, 48, and 72 h after the ingestion of the test oil. The standardized nutrition started with the lunch meal one day prior to the baseline blood collection and ended with the last blood draw after 72 h. The diet was poor in PUFAs and portion sizes were adjusted to energy demands (small and large portion size) of the participants. Volunteers were allowed to drink water, tea and coffee (without milk/sugar) ad libitum. Macronutrient and fatty acid composition of the standardized nutrition can be found in Table S1.
Blood samples were obtained by venipuncture of an arm vein using Multifly needles (Sarstedt, Nümbrecht, Germany) into serum and EDTA monovettes (Sarstedt). For analysis of fatty acids in plasma, EDTA blood monovettes were centrifuged for 10 minutes at 1500 × g and 4 °C and plasma was transferred into 1.5 mL plastic tubes (Sarstedt), where it was immediately frozen and stored at −80 °C until extraction and analysis. All transfer steps were carried out on ice. Serum lipid levels, liver enzymes, and small blood count at baseline were determined in the LADR laboratory (Laborärztliche Arbeitsgemeinschaft für Diagnostik und Rationalisierung e.V.), Hannover, Germany.
Fatty acid pattern of EO (n = 3) as well as plasma fatty acid concentrations were determined by means of gas chromatography (GC) with flame ionization detection (FID) as described in Reference [27] with slight modifications. In brief, lipids from blood plasma were extracted with methyl tert-butyl ether and methanol and derivatized with methanolic hydrogen chloride. The resulting fatty acid methyl esters (FAME) were quantified using FAME C25:0 as internal standard. In addition to the determined concentration, expressed as µg fatty acid per mL plasma, the relative amount (% of total fatty acids) of each fatty acid was calculated based on peak areas. EO was diluted with n-hexane and directly derivatized with methanolic hydrogen chloride. Based on the determined relative fatty acid pattern, the concentration of fatty acids in g/100 g EO was calculated assuming that the fatty acids in EO are primarily bound in triglycerides.
Fatty acid concentrations in plasma, anthropometrical measures, liver enzymes, and serum lipid levels are shown as mean ± standard deviation (SD). If the plasma concentration of a fatty acid was below the lower limit of quantification (LLOQ) in a maximum of 50% of the samples, the LLOQ (e.g., 0.5 µg/ml) was inserted to calculate mean and SD for this respective fatty acid. If the plasma concentration of a fatty acid could not be quantified in more than 50% of the samples, the LLOQ was given instead of mean ± SD, and no statistical evaluation was performed for this parameter. The distributions of the plasma fatty acid data were analyzed by the Kolmogorov–Smirnov test. Statistical differences between the time points were tested with ANOVA with repeated measurements for parametric data, followed by post-hoc t-tests for paired samples with Holm–Bonferroni-adjusted levels of significance and for non-parametric data with Friedman test followed by Dunn–Bonferroni post-hoc tests. Statistical tests were only performed for analytes that were quantified in the study population at all time points. Statistical significance was set at p ≤ 0.05 for all analyses. All statistical analyses were carried out with SPSS software (Version 24, SPSS Inc., Chicago, IL, USA).

3. Results

3.1. Study Population

Twelve male subjects were included in the study and completed the examination (no drop-outs). The participants (mean age 24.6 ± 2.43 years) were healthy and had a normal BMI (24.6 ± 2.06 kg/m²) (Table 2). All subjects were omnivores with low fish consumption (≤1 serving fish per week). Liver enzymes and serum lipid profile (Table 2) were in a normal range at baseline. EO contained 11.8 g/100 g of SDA and 30.2 g/100 g of ALA (Table 1), hence, the single dose of 26 g delivered 3.1 g of SDA and 7.9 g of ALA.
Of the 12 subjects, 6 reported side effects 2 h after the single dose ingestion of EO. The following symptoms were mentioned (multiple answers were possible): abdominal pain (1×), belching (2×), heartburn (1×), fishy taste (2×), flatulence (1×), diarrhea (2×), and nausea (1×).

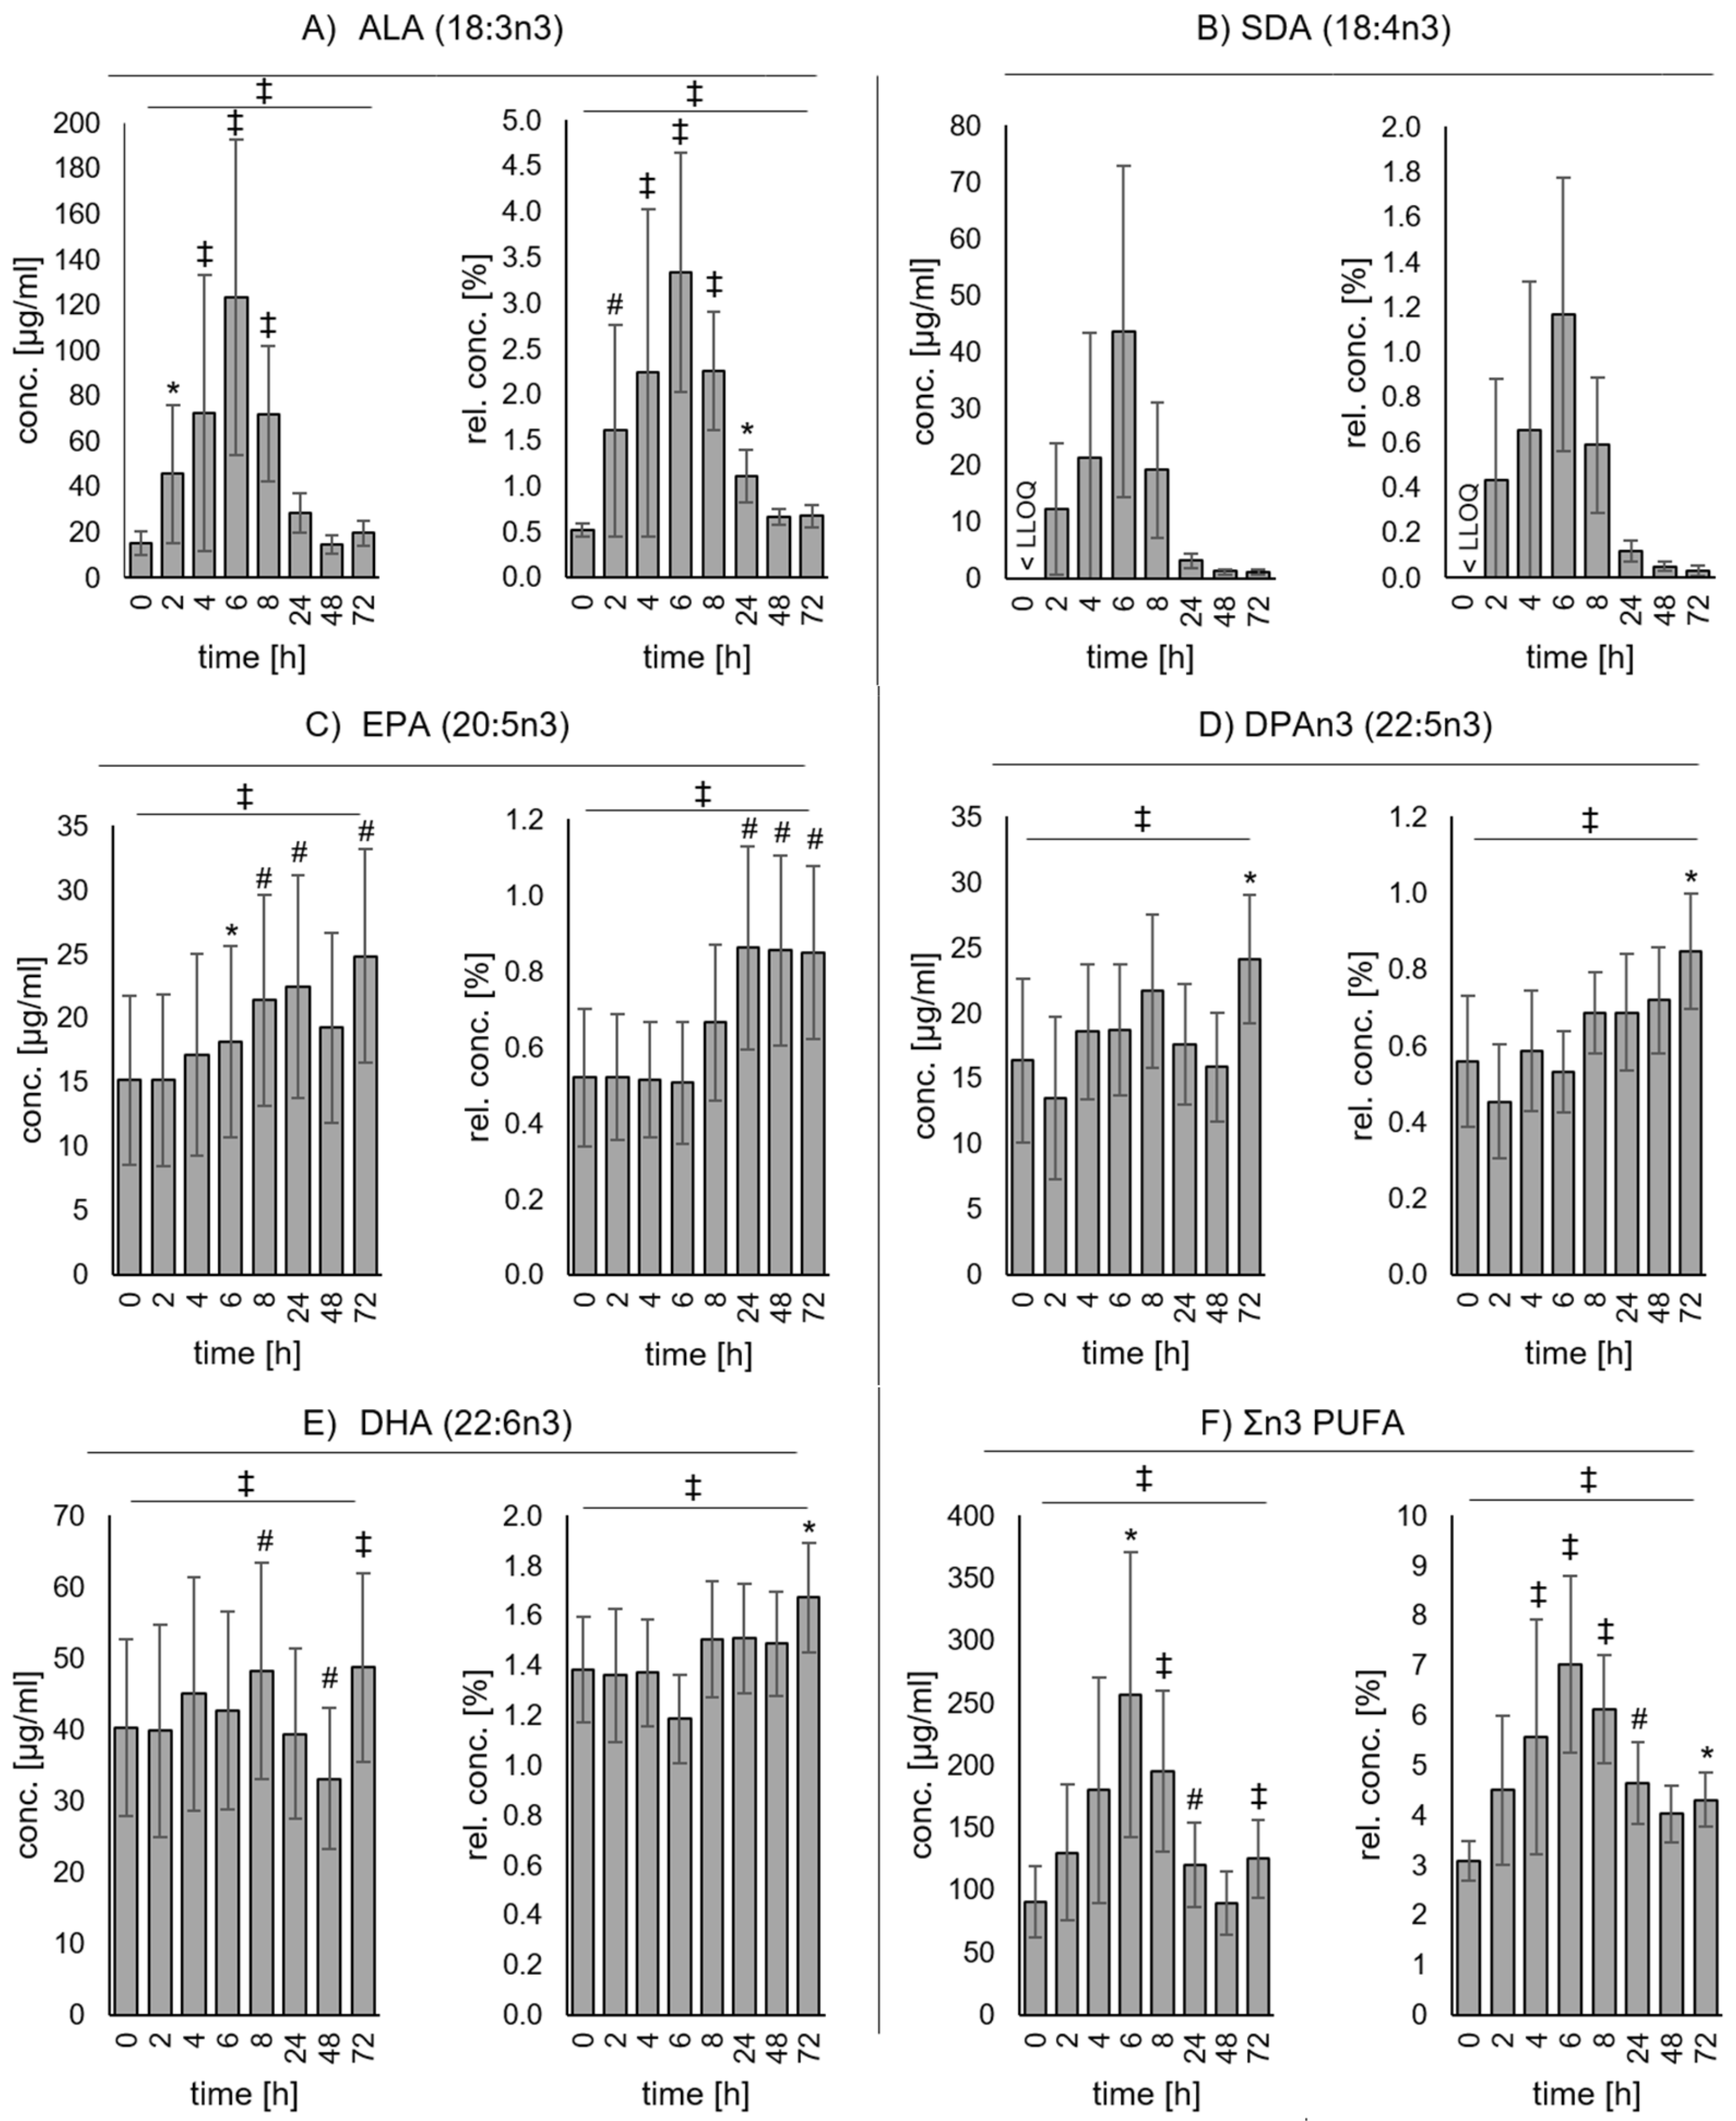
3.2. Changes of Plasma Fatty Acid Concentrations

The plasma concentrations of both n3 PUFAs ALA and SDA over time resemble a classic inverted U-shape curve with an initial rapid increase. ALA concentrations increased significantly compared to baseline (15.2 ± 4.96 µg/ml) after 2 (45.8 ± 30.5 µg/ml), 4 (72.2 ± 60.7 µg/ml), 6 (123 ± 69.4 µg/ml), and 8 h (72.1 ± 29.7 µg/ml) and decreased again to concentrations that were not significantly different compared to baseline after 24 (28.7 ± 8.77 µg/ml), 48 (14.7 ± 3.97 µg/ml), and 72 h (19.6 ± 5.70 µg/ml) (Figure 1A). At baseline, SDA plasma concentrations were below the LLOQ of 0.5 µg/ml in more than 50% of the samples. The single dose of EO led to a strong increase of SDA concentrations after 2 (12.3 ± 11.6 µg/ml), 4 (21.2 ± 22.2 µg/ml), 6 (43.6 ± 29.4 µg/ml), and 8 h (19.1 ± 12.0 µg/ml) and decreased again after 24 (3.05 ± 1.17 µg/ml), 48 (1.18 ± 0.47 µg/ml), and 72 h (1.04 ± 0.52 µg/ml) (Figure 1B). The trend of ALA and SDA was similarly pronounced with respect to the relative fatty acid pattern (Figure 1A,B). EPA concentrations increased with a time lag and were significantly different to baseline (15.2 ± 6.57 µg/ml) after 6 (18.2 ± 7.41 µg/ml), 8 (21.4 ± 8.19 µg/ml), 24 (22.5 ± 8.68 µg/ml), and 72 h (24.8 ± 8.33 µg/ml). Regarding relative amounts of EPA, a significant increase compared to baseline (0.52 ± 0.18%) could be observed after 24 (0.86 ± 0.27%), 48 (0.85 ± 0.25%), and 72 h (0.85 ± 0.23%) (Figure 1C). Plasma concentrations of DPAn3 increased slightly after the single dose of EO and even reached statistical significance compared to baseline (16.4 ± 6.27 µg/ml) after 72 (24.1 ± 4.89 µg/ml) h (Figure 1D). Additionally, DHA plasma concentrations increased slightly (Figure 1E); however, the increase was not linear. Although DHA concentrations increased significantly after 8 (48.2 ± 15.1 µg/ml) and 72 h (48.7 ± 13.3 µg/ml) compared to baseline (40.3 ± 12.4 µg/ml), they were significantly lower compared to baseline after 48 h (33.1 ± 9.84 µg/ml). Taking into account the total fatty acids in plasma, relative amounts of DPAn3 showed a slight increase at later time points, while DHA was marginally elevated only after 72 h. Especially due to the strong ALA and SDA increase, the sum of (Σ) n3 PUFA also increased significantly in response to the single dose of EO. The increase was significant compared to baseline (90.4 ± 28.7 µg/ml) after 6 (257 ± 114 µg/ml), 8 (196 ± 64.3 µg/ml), 24 (121 ± 34.0 µg/ml), and 72 h (125 ± 31.6 µg/ml) (Figure 1F). No changes were observed for C20:4n6 or Σn6 PUFA. The complete plasma fatty acid patterns of all measurement time points can be found in Table S2.

4. Discussion

The present study assessed short-term changes in plasma fatty acid concentrations after a single dose of EO. A focus was set on changes of n3 PUFA concentrations.
Plasma is among the three most commonly used blood sample types for the investigation of the PUFA status, and as plasma fatty acid concentrations are altered by prior meal consumption [28], it might be the most suitable medium for the investigation of the short-term metabolism of LC n3 PUFAs. Nonetheless, differences in the fatty acid—especially n3 PUFA—intake from the background diet of individual subjects would lead to biased results. To overcome these obstacles, the diet of the participants was standardized during the whole examination, including two meals on the day before the baseline measurement, to prevent bias. Additionally, only omnivores with low fish consumption were included to ensure a homogeneous study collective. This careful selection has led to lower standard deviations or standard errors of the mean of the baseline plasma n3 PUFA pattern compared to other studies [29,30].
Moreover, the metabolism of PUFAs has a variety of influencing factors, like age [31,32,33,34], sex [35,36,37], BMI [31,38,39], diet [31,36,40], and smoking status [33,38]. These factors lead to variability of data. Consequently, to minimize this variability, a homogenous collective of healthy, non-smoking men within a narrow range regarding age (mean age 24.6 ± 2.43 years) and BMI (24.6 ± 2.06 kg/m2) was chosen to investigate the effect of a single EO dose on n3 PUFA concentrations in plasma.
As expected, plasma concentrations of ALA and SDA increased rapidly as a consequence of EO intake. EPA, DPAn3, and DHA, the direct metabolites of ALA and SDA, also increased significantly. Although the increase of EPA was more pronounced and significant compared to baseline after 6, 8, 24, and 72 h, the DPAn3 and DHA increase was marginal and only significant after 72 h and for DHA additionally after 8 h. The effect of a single dose of EO or LO on the plasma PUFA pattern has not been investigated before. Only a few studies measured PUFA (plasma) patterns after daily supplementation of SDA-rich oils over 3 to 16 weeks (reviewed in Reference [26]). Those studies uniquely observed an increase in EPA and DPAn3, but no effect on DHA in different blood fractions was observed [22,24,41,42,43,44,45,46,47]. In a direct comparison between eight-week supplementation of EO and LO, EO was more efficient compared to LO in increasing EPA and DPAn3 [48], possibly due to the presence of SDA. This can be explained by the circumvention of the D6D, which is the rate limiting enzyme in the conversion process [49,50]. It is utilized twice in the elongation and desaturation process of n3 PUFAs: it converts ALA to SDA and, with lower affinity than the first conversion step, also 24:5n3 to 24:6n3. Through a direct intake of SDA, the first rate-limiting step is already bypassed; therefore, the increase of EPA and DPAn3 is higher.
Surprisingly, EO and LO supplementation both led to a slight DHA decrease in a previous study [48]. DHA is synthesized from DPAn3 by elongation of DPAn3 to 24:5n3, a subsequent desaturation by D6D to 24:6n3, and a final β-oxidation in the peroxisome [51]. Due to (1) the lower affinity of D6D to 24:5n3 compared to ALA and (2) the high abundance of ALA through the intake via EO, causing competitive inhibition of D6D [52], the conversion of ALA as well as SDA to DHA is (generally) estimated to be very low or nonexistent [26]. Moreover, both, a medium-term (seven days) EPA and DPAn3 supplementation (dose: 2 g for the first day and 1 g for the subsequent six days) did not lead to an increase of DHA plasma phospholipids [53]. This further underlines the low capacity of D6D for the desaturation of 24:5n3 to 24:6n3, which is necessary for the formation of DHA.
Our results show slightly increased DHA concentrations, which was significant after 8 and 72 h following single dose EO intake. However, the DHA concentrations were lower compared to baseline after 48 h. It should be noted that the relative amount of DHA seems less affected by the EO intervention; therefore, the share of DHA with respect to total fatty acids is mostly stable over the study period. Hence, no constant DHA increase could be observed. If this short-term increase has (1) any physiological significance and (2) stands in contrast to longer-term SDA supplementation studies showing no effect on DHA the effect of EO supplementation on the DHA status ought to be investigated in future trials. Moreover, it would be interesting to directly compare the plasma fatty acid patterns after the ingestion of single doses of EO and LO. The missing control group is the main limitation of this study. Further, the study is limited by a small sample size of exclusively male subjects. It is questionable whether these results can be reproduced with female subjects as sex differences in the efficiency of the conversion of ALA to DHA have been previously shown [54,55].
Half of the participants stated that they had side effects after the ingestion of the EO. However, due to the missing control group it is not clear if these side effects are possibly in part attributable to the study conditions—especially the standardized diet. Nonetheless, the high single dose of EO is apparently not well tolerated by half of the study population.

5. Conclusions

The present study showed that a single dose of EO results in a significant increase of plasma EPA, DPAn3, and DHA concentrations after 72 h beside an increase of ALA and SDA. Therefore, SDA from EO may be a more promising alternative plant source for EPA, DPAn3, and DHA compared to ALA from LO due to its effect on DHA.

Supplementary Materials

The following are available online at https://0-www-mdpi-com.brum.beds.ac.uk/2072-6643/11/10/2346/s1, Table S1: Daily energy, macronutrient and fatty acid intake of study participants during the whole period of the standardized nutrition (Day 1, 2 and 3) (A) and energy, macronutrient and fatty acid intake of meals at Day 1 of the standardized nutrition (B), Table S2: Fatty acid pattern in plasma after single-dose ingestion of echium oil.

Author Contributions

Conceptualization, T.G., J.P.S., A.H. and N.H.S.; methodology, T.G.; validation, T.G., L.K. and E.K.; formal analysis, T.G., E.K. and L.K.; investigation, T.G.; resources, T.G., L.K., E.K., J.P.S., A.H. and N.H.S.; writing—original draft preparation, T.G. and J.P.S.; writing—review and editing, T.G., J.P.S., A.H., N.H.S., L.K. and E.K.; visualization, T.G.; supervision, A.H., J.P.S. and N.H.S.; project administration, J.P.S. and N.H.S.; funding acquisition, J.P.S. and N.H.S.

Funding

This research was funded by DFG, grant number SCHU 2516, SCHE 1801.

Acknowledgments

This study was supported by grants from the German Research Foundation (Grant SCHE 1801 and SCHU 2516) to NHS and JPS. We would like to thank the participants who contributed their time to this project and Sarah Reuber, Sebastian Biernacki and Mustafa Bagci for assisting the GC analysis. The publication of this article was funded by the Open Access fund of Leibniz Universität Hannover.

Conflicts of Interest

The authors declare no conflict of interest. The funders had no role in the design of the study; in the collection, analyses, or interpretation of data; in the writing of the manuscript, or in the decision to publish the results.

Abbreviations

ALAalpha-linolenic acid (C18:3n3)
ALTAlanine Aminotransferase
ASTAspartate Aminotransferase
BMIbody mass index
DHAdocosahexaenoic acid (C22:6n3)
dias BPdiastolic blood pressure
DPAn3docosapentaenoic acid (C22:5n3)
D6Ddelta-6-desaturase
EOechium oil
EPAeicosapentaenoic acid (C20:5n3)
FADS2fatty acid desaturase 2
FAMEfatty acid methyl esters
FIDflame ionization detection
GCgas chromatography
GGTGamma-glutamyl transpeptidase
HDLhigh density lipoprotein
LAlinoleic acid (C18:2n6)
LDLlow density lipoprotein
LLOQlower limit of quantification
MUFAmonounsaturated fatty acids
n3omega-3
n6omega-6
PUFApolyunsaturated fatty acids
SDstandard deviation
SDAstearidonic acid (C18:4n3)
SFAsaturated fatty acids
sys BPsystolic blood pressure
TCtotal cholesterol
TGtriglycerides

References

  1. Calder, P.C. n-3 Fatty acids and cardiovascular disease: Evidence explained and mechanisms explored. Clin. Sci. 2004, 107, 1–11. [Google Scholar] [CrossRef] [PubMed]
  2. Calder, P.C. Very long chain omega-3 (n-3) fatty acids and human health: Omega-3 fatty acids and health. Eur. J. Lipid Sci. Technol. 2014, 116, 1280–1300. [Google Scholar] [CrossRef]
  3. Harris, W.S. The omega-3 index: From biomarker to risk marker to risk factor. Curr. Atheroscler. Rep. 2009, 11, 411–417. [Google Scholar] [CrossRef] [PubMed]
  4. Marik, P.E.; Varon, J. Omega-3 Dietary Supplements and the Risk of Cardiovascular Events: A Systematic Review. Clin. Cardiol. 2009, 32, 365–372. [Google Scholar] [CrossRef] [PubMed]
  5. Mozaffarian, D.; Wu, J.H.Y. Omega-3 Fatty Acids and Cardiovascular Disease: Effects on risk factors, molecular pathways, and clinical events. J. Am. Coll. Cardiol. 2011, 58, 2047–2067. [Google Scholar] [CrossRef]
  6. Calder, P.C. Marine omega-3 fatty acids and inflammatory processes: Effects, mechanisms and clinical relevance. Biochim. Biophys. Acta (BBA)-Mol. Cell Biol. Lipids 2015, 1851, 469–484. [Google Scholar] [CrossRef]
  7. Zhang, G.; Panigrahy, D.; Mahakian, L.M.; Yang, J.; Liu, J.-Y.; Stephen Lee, K.S.; Wettersten, H.I.; Ulu, A.; Hu, X.; Tam, S.; et al. Epoxy metabolites of docosahexaenoic acid (DHA) inhibit angiogenesis, tumor growth, and metastasis. Proc. Natl. Acad. Sci. USA 2013, 110, 6530–6535. [Google Scholar] [CrossRef] [Green Version]
  8. SanGiovanni, J.P.; Parra-Cabrera, S.; Colditz, G.A.; Berkey, C.S.; Dwyer, J.T. Meta-analysis of dietary essential fatty acids and long-chain polyunsaturated fatty acids as they relate to visual resolution acuity in healthy preterm infants. Pediatrics 2000, 105, 1292–1298. [Google Scholar] [CrossRef]
  9. Kaur, G.; Cameron-Smith, D.; Garg, M.; Sinclair, A.J. Docosapentaenoic acid (22:5n-3): A review of its biological effects. Prog. Lipid Res. 2011, 50, 28–34. [Google Scholar] [CrossRef] [Green Version]
  10. Kaur, G.; Guo, X.-F.; Sinclair, A.J. Short update on docosapentaenoic acid: A bioactive long-chain n-3 fatty acid. Curr. Opin. Clin. Nutr. Metab. Care 2016, 19, 88–91. [Google Scholar] [CrossRef]
  11. Drouin, G.; Rioux, V.; Legrand, P. The n-3 docosapentaenoic acid (DPA): A new player in the n-3 long chain polyunsaturated fatty acid family. Biochimie 2019, 159, 36–48. [Google Scholar] [CrossRef] [PubMed]
  12. Micha, R.; Khatibzadeh, S.; Shi, P.; Fahimi, S.; Lim, S.; Andrews, K.G.; Engell, R.E.; Powles, J.; Ezzati, M.; Mozaffarian, D.; et al. Global, regional, and national consumption levels of dietary fats and oils in 1990 and 2010: A systematic analysis including 266 country-specific nutrition surveys. BMJ 2014, 348, g2272. [Google Scholar] [CrossRef] [PubMed]
  13. Stark, K.D.; Van Elswyk, M.E.; Higgins, M.R.; Weatherford, C.A.; Salem, N. Global survey of the omega-3 fatty acids, docosahexaenoic acid and eicosapentaenoic acid in the blood stream of healthy adults. Prog. Lipid Res. 2016, 63, 132–152. [Google Scholar] [CrossRef] [PubMed]
  14. Lands, B. Consequences of essential fatty acids. Nutrients 2012, 4, 1338–1357. [Google Scholar] [CrossRef] [PubMed]
  15. Wood, K.E.; Mantzioris, E.; Gibson, R.A.; Ramsden, C.E.; Muhlhausler, B.S. The effect of modifying dietary LA and ALA intakes on omega-3 long chain polyunsaturated fatty acid (n-3 LCPUFA) status in human adults: A systematic review and commentary. Prostaglandins Leukot. Essent. Fatty Acids (PLEFA) 2015, 95, 47–55. [Google Scholar] [CrossRef] [PubMed] [Green Version]
  16. Arterburn, L.M.; Hall, E.B.; Oken, H. Distribution, interconversion, and dose response of n- 3 fatty acids in humans. Am. J. Clin. Nutr. 2006, 83, S1467–S1476. [Google Scholar] [CrossRef]
  17. Greupner, T.; Kutzner, L.; Nolte, F.; Strangmann, A.; Kohrs, H.; Hahn, A.; Schebb, N.H.; Schuchardt, J.P. Effects of a 12-week high-α-linolenic acid intervention on EPA and DHA concentrations in red blood cells and plasma oxylipin pattern in subjects with a low EPA and DHA status. Food Funct. 2018, 9, 1587–1600. [Google Scholar] [CrossRef]
  18. Greupner, T.; Kutzner, L.; Pagenkopf, S.; Kohrs, H.; Hahn, A.; Schebb, N.H.; Schuchardt, J.P. Effects of a low and a high dietary LA/ALA ratio on long-chain PUFA concentrations in red blood cells. Food Funct. 2018, 9, 4742–4754. [Google Scholar] [CrossRef] [Green Version]
  19. Bernert, J.T.; Sprecher, H. Studies to determine the role rates of chain elongation and desaturation play in regulating the unsaturated fatty acid composition of rat liver lipids. Biochim. Biophys. Acta (BBA)-Lipids Lipid Metab. 1975, 398, 354–363. [Google Scholar] [CrossRef]
  20. Sprecher, H.; Chen, Q.; Yin, F.Q. Regulation of the biosynthesis of 22:5n-6 and 22:6n-3: A complex intracellular process. Lipids 1999, 34, S153–S156. [Google Scholar] [CrossRef]
  21. Whelan, J.; Gouffon, J.; Zhao, Y. Effects of Dietary Stearidonic Acid on Biomarkers of Lipid Metabolism. J. Nutr. 2012, 142, 630S–634S. [Google Scholar] [CrossRef] [PubMed] [Green Version]
  22. James, M.J.; Ursin, V.M.; Cleland, L.G. Metabolism of stearidonic acid in human subjects: Comparison with the metabolism of other n-3 fatty acids. Am. J. Clin. Nutr. 2003, 77, 1140–1145. [Google Scholar] [CrossRef] [PubMed]
  23. Miles, E.A.; Banerjee, T.; Dooper, M.M.B.W.; M’Rabet, L.; Graus, Y.M.F.; Calder, P.C. The influence of different combinations of γ-linolenic acid, stearidonic acid and EPA on immune function in healthy young male subjects. Br. J. Nutr. 2004, 91, 893–903. [Google Scholar] [CrossRef] [PubMed]
  24. Lemke, S.L.; Vicini, J.L.; Su, H.; Goldstein, D.A.; Nemeth, M.A.; Krul, E.S.; Harris, W.S. Dietary intake of stearidonic acid–enriched soybean oil increases the omega-3 index: Randomized, double-blind clinical study of efficacy and safety. Am. J. Clin. Nutr. 2010, 92, 766–775. [Google Scholar] [CrossRef] [PubMed]
  25. Krul, E.S.; Lemke, S.L.; Mukherjea, R.; Taylor, M.L.; Goldstein, D.A.; Su, H.; Liu, P.; Lawless, A.; Harris, W.S.; Maki, K.C. Effects of duration of treatment and dosage of eicosapentaenoic acid and stearidonic acid on red blood cell eicosapentaenoic acid content. Prostaglandins Leukot. Essent. Fat. Acids 2012, 86, 51–59. [Google Scholar] [CrossRef] [PubMed]
  26. Baker, E.J.; Miles, E.A.; Burdge, G.C.; Yaqoob, P.; Calder, P.C. Metabolism and functional effects of plant-derived omega-3 fatty acids in humans. Prog. Lipid Res. 2016, 64, 30–56. [Google Scholar] [CrossRef] [PubMed]
  27. Ostermann, A.I.; Müller, M.; Willenberg, I.; Schebb, N.H. Determining the fatty acid composition in plasma and tissues as fatty acid methyl esters using gas chromatography–A comparison of different derivatization and extraction procedures. Prostaglandins Leukot. Essent. Fat. Acids (PLEFA) 2014, 91, 235–241. [Google Scholar] [CrossRef]
  28. Harris, W.S.; Thomas, R.M. Biological variability of blood omega-3 biomarkers. Clin. Biochem. 2010, 43, 338–340. [Google Scholar] [CrossRef]
  29. Patenaude, A.; Rodriguez-Leyva, D.; Edel, A.L.; Dibrov, E.; Dupasquier, C.M.C.; Austria, J.A.; Richard, M.N.; Chahine, M.N.; Malcolmson, L.J.; Pierce, G.N. Bioavailability of α-linolenic acid from flaxseed diets as a function of the age of the subject. Eur. J. Clin. Nutr. 2009, 63, 1123–1129. [Google Scholar] [CrossRef]
  30. Abdelmagid, S.A.; Clarke, S.E.; Nielsen, D.E.; Badawi, A.; El-Sohemy, A.; Mutch, D.M.; Ma, D.W.L. Comprehensive Profiling of Plasma Fatty Acid Concentrations in Young Healthy Canadian Adults. PLoS ONE 2015, 10, e0116195. [Google Scholar] [CrossRef]
  31. Flock, M.R.; Skulas-Ray, A.C.; Harris, W.S.; Etherton, T.D.; Fleming, J.A.; Kris-Etherton, P.M. Determinants of Erythrocyte Omega-3 Fatty Acid Content in Response to Fish Oil Supplementation: A Dose-Response Randomized Controlled Trial. J. Am. Heart Assoc. 2013, 2, e000513. [Google Scholar] [CrossRef] [PubMed]
  32. Gellert, S.; Schuchardt, J.P.; Hahn, A. Low long chain omega-3 fatty acid status in middle-aged women. Prostaglandin Leukot. Essent. Fat. Acids 2017, 117, 54–59. [Google Scholar] [CrossRef] [PubMed]
  33. Harris, W.S.; Pottala, J.V.; Lacey, S.M.; Vasan, R.S.; Larson, M.G.; Robins, S.J. Clinical correlates and heritability of erythrocyte eicosapentaenoic and docosahexaenoic acid content in the Framingham Heart Study. Atherosclerosis 2012, 225, 425–431. [Google Scholar] [CrossRef] [PubMed] [Green Version]
  34. Plourde, M.; Chouinard-Watkins, R.; Vandal, M.; Zhang, Y.; Lawrence, P.; Brenna, J.T.; Cunnane, S.C. Plasma incorporation, apparent retroconversion and β-oxidation of 13C-docosahexaenoic acid in the elderly. Nutr. Metab. 2011, 8, 5. [Google Scholar] [CrossRef] [PubMed]
  35. Bakewell, L.; Burdge, G.C.; Calder, P.C. Polyunsaturated fatty acid concentrations in young men and women consuming their habitual diets. Br. J. Nutr. 2006, 96, 93. [Google Scholar] [CrossRef] [PubMed]
  36. Crowe, F.L.; Murray Skeaff, C.; Green, T.J.; Gray, A.R. Serum n-3 long-chain PUFA differ by sex and age in a population-based survey of New Zealand adolescents and adults. Br. J. Nutr. 2008, 99, 168–174. [Google Scholar] [CrossRef] [PubMed]
  37. Metherel, A.H.; Armstrong, J.M.; Patterson, A.C.; Stark, K.D. Assessment of blood measures of n-3 polyunsaturated fatty acids with acute fish oil supplementation and washout in men and women. Prostaglandins Leukot. Essent. Fat. Acids 2009, 81, 23–29. [Google Scholar] [CrossRef] [PubMed]
  38. Langlois, K.; Ratnayake, W.M.N. Omega-3 Index of Canadian adults. Health Rep. 2015, 26, 11. [Google Scholar]
  39. Sands, S.A.; Reid, K.J.; Windsor, S.L.; Harris, W.S. The impact of age, body mass index, and fish intake on the EPA and DHA content of human erythrocytes. Lipids 2005, 40, 343. [Google Scholar] [CrossRef]
  40. Sala-Vila, A.; Harris, W.S.; Cofán, M.; Pérez-Heras, A.M.; Pintó, X.; Lamuela-Raventós, R.M.; Covas, M.-I.; Estruch, R.; Ros, E. Determinants of the omega-3 index in a Mediterranean population at increased risk for CHD. Br. J. Nutr. 2011, 106, 425–431. [Google Scholar] [CrossRef] [Green Version]
  41. Surette, M.E.; Edens, M.; Chilton, F.H.; Tramposch, K.M. Dietary Echium oil increases plasma and neutrophil long-chain (n-3) fatty acids and lowers serum triacylglycerols in hypertriglyceridemic humans. J. Nutr. 2004, 134, 1406–1411. [Google Scholar] [CrossRef] [PubMed]
  42. Harris, W.S.; Lemke, S.L.; Hansen, S.N.; Goldstein, D.A.; DiRienzo, M.A.; Su, H.; Nemeth, M.A.; Taylor, M.L.; Ahmed, G.; George, C. Stearidonic Acid-Enriched Soybean Oil Increased the Omega-3 Index, an Emerging Cardiovascular Risk Marker. Lipids 2008, 43, 805–811. [Google Scholar] [CrossRef] [PubMed]
  43. Lemke, S.L.; Maki, K.C.; Hughes, G.; Taylor, M.L.; Krul, E.S.; Goldstein, D.A.; Su, H.; Rains, T.M.; Mukherjea, R. Consumption of Stearidonic Acid−Rich Oil in Foods Increases Red Blood Cell Eicosapentaenoic Acid. J. Acad. Nutr. Diet. 2013, 113, 1044–1056. [Google Scholar] [CrossRef] [PubMed]
  44. Arm, J.P.; Boyce, J.A.; Wang, L.; Chhay, H.; Zahid, M.; Patil, V.; Govindarajulu, U.; Ivester, P.; Weaver, K.L.; Sergeant, S.; et al. Impact of botanical oils on polyunsaturated fatty acid metabolism and leukotriene generation in mild asthmatics. Lipids Health Dis. 2013, 12, 141. [Google Scholar] [CrossRef] [PubMed]
  45. Kuhnt, K.; Fuhrmann, C.; Kohler, M.; Kiehnmiddlef, M.; Jahreis, G. Dietary Echium Oil Increases Long-Chain n-3 PUFAs, Including Docosapentaenoic Acid, in Blood Fractions and Alters Biochemical Markers for Cardiovascular Disease Independently of Age, Sex, and Metabolic Syndrome. J. Nutr. 2014, 144, 447–460. [Google Scholar] [CrossRef] [PubMed]
  46. Pieters, D.J.M.; Mensink, R.P. Effects of stearidonic acid on serum triacylglycerol concentrations in overweight and obese subjects: A randomized controlled trial. Eur. J. Clin. Nutr. 2015, 69, 121–126. [Google Scholar] [CrossRef] [PubMed]
  47. Dittrich, M.; Jahreis, G.; Bothor, K.; Drechsel, C.; Kiehnmiddlef, M.; Blüher, M.; Dawczynski, C. Benefits of foods supplemented with vegetable oils rich in α-linolenic, stearidonic or docosahexaenoic acid in hypertriglyceridemic subjects: A double-blind, randomized, controlled trail. Eur. J. Nutr. 2015, 54, 881–893. [Google Scholar] [CrossRef]
  48. Kuhnt, K.; Weiß, S.; Kiehnmiddlef, M.; Jahreis, G. Consumption of echium oil increases EPA and DPA in blood fractions more efficiently compared to linseed oil in humans. Lipids Health Dis. 2016, 15, 32. [Google Scholar] [CrossRef] [Green Version]
  49. Cho, H.P.; Nakamura, M.T.; Clarke, S.D. Cloning, Expression, and Nutritional Regulation of the Mammalian Δ-6 Desaturase. J. Biol. Chem. 1999, 274, 471–477. [Google Scholar] [CrossRef]
  50. Simopoulos, A.P. Genetic variants in the metabolism of omega-6 and omega-3 fatty acids: Their role in the determination of nutritional requirements and chronic disease risk. Exp. Biol. Med. 2010, 235, 785–795. [Google Scholar] [CrossRef]
  51. Sprecher, H. Metabolism of highly unsaturated n-3 and n-6 fatty acids. Biochim. Biophys. Acta (BBA)-Mol. Cell Biol. Lipids 2000, 1486, 219–231. [Google Scholar] [CrossRef]
  52. Portolesi, R.; Powell, B.C.; Gibson, R.A. Competition between 24:5n-3 and ALA for 6 desaturase may limit the accumulation of DHA in HepG2 cell membranes. J. Lipid Res. 2007, 48, 1592–1598. [Google Scholar] [CrossRef] [PubMed]
  53. Miller, E.; Kaur, G.; Larsen, A.; Loh, S.P.; Linderborg, K.; Weisinger, H.S.; Turchini, G.M.; Cameron-Smith, D.; Sinclair, A.J. A short-term n-3 DPA supplementation study in humans. Eur. J. Nutr. 2013, 52, 895–904. [Google Scholar] [CrossRef] [PubMed]
  54. Williams, C.M.; Burdge, G. Long-chain n-3 PUFA: Plant v. marine sources. Proc. Nutr. Soc. 2006, 65, 42–50. [Google Scholar] [CrossRef] [PubMed]
  55. Childs, C.E.; Romeu-Nadal, M.; Burdge, G.C.; Calder, P.C. Gender differences in the n-3 fatty acid content of tissues. Proc. Nutr. Soc. 2008, 67, 19–27. [Google Scholar] [CrossRef]
Figure 1. Concentration of selected omega-3 polyunsaturated fatty acids in plasma after single-dose ingestion of echium oil. Concentration of (A) α-linolenic acid (ALA, 18:3n3), (B) stearidonic acid (SDA, 18:4n3), (C) eicosapentaenoic acid (EPA, 20:5n3), (D) docosapentaenoic acid (DPAn3, 22:5n3), (E) docosahexaenoic acid (DHA, 22:6n3), and (F) sum of omega-3 polyunsaturated fatty acids (Σn3 PUFA) in plasma at baseline 0, and 2, 4, 6, 8, 24, 48, 72 h after single-dose ingestion of echium oil. Levels are shown as concentrations [μg/mL] and as relative concentrations (%) of total fatty acids. All data are shown as mean ± standard deviation. Levels of significance (for normally distributed variables: one-factorial ANOVAs with repeated measurements and t-tests for paired samples with Holm–Bonferroni correction; for not normally distributed variables: Friedman test followed by Dunn–Bonferroni post-hoc test) are indicated as follows: * p ≤ 0.05, # p ≤ 0.005, ‡ p ≤ 0.001. < LLOQ, below lower level of quantification.
Nutrients 11 02346 g001
Table 1. Fatty acid pattern (concentration in g/100 g) of the echium oil used in the study1.
Fatty AcidCommon NameConcentration (g/100 g)
16:0Palmitic acid6.95
16:1n7Palmitoleic acid0.0925
18:0Stearic acid3.62
18:1n9Oleic acid15.5
18:1n7Vaccenic acid0.910
18:2n6Linoleic acid15.2
18:3n6γ-Linolenic acid10.4
18:3n3α-Linolenic acid30.2
18:4n3Stearidonic acid11.8
20:0Arachidic acid0.0980
20:1n9Gondoic acid0.592
22:0Behenic acid0.117
22:1n9Erucic acid0.129
SFA 10.8
MUFA 17.3
PUFA 67.6
Σn3 PUFA 42.0
Σn6 PUFA 25.6
1 own analysis. n3: omega-3; n6: omega-6; MUFA: monounsaturated fatty acids; PUFA: polyunsaturated fatty acids; SFA: saturated fatty acids.
Table 2. Baseline clinical, biochemical, and anthropometric parameters of study participants. Shown are mean ± SD (n = 12).
Parametermean±SD
Age (years)24.6±2.43
Weight (kg)84.5±8.79
BMI (kg/m2)24.6±2.06
Sys BP (mmHg)123±13.9
Dias BP (mmHg)74.2±5.57
AST (U/l)25.4±5.28
ALT (U/l)23.0±13.5
GGT (U/l)20.3±8.54
TC (mg/dl)166±38.4
ALT: Alanine Aminotransferase; AST: Aspartate Aminotransferase; BMI: body mass index; dias BP: diastolic blood pressure; GGT: Gamma-glutamyl transpeptidase; HDL: high density lipoprotein; LDL: low density lipoprotein; SD: standard deviation; sys BP: systolic blood pressure; TC: total cholesterol; TG: triglycerides.

