Article

DNA Methylation Signatures of Breastfeeding in Buccal Cells Collected in Mid-Childhood

by
Veronika V. Odintsova
1,2,3,*,
Fiona A. Hagenbeek
1,2,
Matthew Suderman
4,
Doretta Caramaschi
4,
Catharina E. M. van Beijsterveldt
1,
Noah A. Kallsen
5,
Erik A. Ehli
5,
Gareth E. Davies
5,
Gennady T. Sukhikh
3,
Vassilios Fanos
6,
Caroline Relton
4,
Meike Bartels
1,2,
Dorret I. Boomsma
1,2 and
Jenny van Dongen
1,2,*
1
Department of Biological Psychology, Vrije Universiteit Amsterdam, 1081 BT Amsterdam, The Netherlands
2
Amsterdam Public Health Research Institute, 1081 BT Amsterdam, The Netherlands
3
Kulakov National Medical Research Center for Obstetrics, Gynecology and Perinatology, Moscow 101000, Russia
4
MRC Integrative Epidemiology Unit, Bristol Medical School, Population Health Science, University of Bristol, Bristol BS8 1TH, UK
5
Avera Institute for Human Genetics, Sioux Falls, SD 57101, USA
6
Neonatal Intensive Care Unit, Department of Surgical Sciences, AOU and University of Cagliari, 09121 Cagliari, Italy
*
Authors to whom correspondence should be addressed.
Submission received: 15 October 2019 / Revised: 12 November 2019 / Accepted: 12 November 2019 / Published: 17 November 2019
(This article belongs to the Special Issue Breastfeeding: Short and Long-Term Benefits to Baby and Mother)

Abstract

:
Breastfeeding has long-term benefits for children that may be mediated via the epigenome. This pathway has been hypothesized, but the number of empirical studies in humans is small and mostly done by using peripheral blood as the DNA source. We performed an epigenome-wide association study (EWAS) in buccal cells collected around age nine (mean = 9.5) from 1006 twins recruited by the Netherlands Twin Register (NTR). An age-stratified analysis examined if effects attenuate with age (median split at 10 years; n<10 = 517, mean age = 7.9; n>10 = 489, mean age = 11.2). We performed replication analyses in two independent cohorts from the NTR (buccal cells) and the Avon Longitudinal Study of Parents and Children (ALSPAC) (peripheral blood), and we tested loci previously associated with breastfeeding in epigenetic studies. Genome-wide DNA methylation was assessed with the Illumina Infinium MethylationEPIC BeadChip (Illumina, San Diego, CA, USA) in the NTR and with the HumanMethylation450 Bead Chip in the ALSPAC. The duration of breastfeeding was dichotomized (‘never‘ vs. ‘ever’). In the total sample, no robustly associated epigenome-wide significant CpGs were identified (α = 6.34 × 10⁻⁸). In the sub-group of children younger than 10 years, four significant CpGs were associated with breastfeeding after adjusting for child and maternal characteristics. In children older than 10 years, methylation differences at these CpGs were smaller and non-significant. The findings did not replicate in the NTR sample (n = 98; mean age = 7.5 years), and no nearby sites were associated with breastfeeding in the ALSPAC study (n = 938; mean age = 7.4). Of the CpG sites previously reported in the literature, three were associated with breastfeeding in children younger than 10 years, thus showing that these CpGs are associated with breastfeeding in buccal and blood cells. Our study is the first to show that breastfeeding is associated with epigenetic variation in buccal cells in children. Further studies are needed to investigate if methylation differences at these loci are caused by breastfeeding or by other unmeasured confounders, as well as what mechanism drives changes in associations with age.

Graphical Abstract

1. Introduction

Early life environmental influences are associated with development and disease. One mechanism that has been hypothesized to account for the association is through the “epigenetic programming” of genes, some of which may act to confer plasticity to developmental processes [1,2]. Nutrition in early life may play a crucial role in modulating gene expression [3,4]. It has been hypothesized that nutrition-induced epigenetic variation may result in different development trajectories and may be associated with metabolic and immune development during critical periods of early life [5,6,7,8]. Epigenetic mechanisms are a key element in understanding the developmental origins of later life disease risk [9,10,11]. One of the best studied epigenetic mechanisms is DNA methylation—the modification of a cytosine base, usually at CpG dinucleotides, with a methyl group, which regulates gene expression and seems to already be sensitive to nutrition during the prenatal period [12,13,14,15,16,17].
In humans, prenatal maternal famine has been associated with long-term DNA methylation changes that are still observable in middle-aged individuals [18,19]. The early postnatal period is also believed to be a critical period at which permanent long-term changes may be induced by environmental exposures that affect the child’s susceptibility to chronic disease [20]; however, whether similar long-term changes in the human epigenome may be induced in this period is unexplored. The first nutrition period, including breastfeeding, has long-term effects on children [3]. Human breast milk has a unique composition that differs from other lactating animals and that is quite impossible to reproduce in artificial production; in fact, breast milk contains a unique mixture of microorganisms (the microbiome) [21], metabolites [22], multipotent stem cells [23], growth factors [24] and other components that render it unique and individualized for each newborn [25]. Moreover, breast milk varies its composition according to the lactation period and circadian rhythm, and it even varies from the start till the end of one feeding [26]. The benefits of breastfeeding on the health of children are widely described [27,28,29] and may involve the transmission of nutrients, hormones, and antibodies from mother to child [24,30,31]. These benefits also include the process of interaction and attachment of a child to their mother, although the effect of bonding may also be achieved through formula feeding [32,33].
Balanced newborn feeding is the basis for the adequate growth and development in childhood and beyond [25,28,34]. Breast milk is important for sensory, neurological and cognitive development [35,36,37], especially in preterm infants [38], but its effects on cognition are confounded by maternal education [39]. The association between breastfeeding duration and a lower risk of infectious diseases, obesity, cancer, coronary heart disease, some allergies, autoimmune disease, diabetes mellitus, inflammatory bowel diseases, and metabolic syndrome at later age has been widely studied [27,40,41,42,43,44,45,46,47,48,49]. Even though a protective effect of breastfeeding in hypertension, diabetes, obesity, and metabolic syndrome has not been evident in some large studies [30,50], the benefits of breastfeeding are well recognized, and the understanding of the biological mechanisms of its influence is of interest. Previous studies on the association between breastfeeding and child outcomes have used a variety of definitions of breastfeeding, including: never vs. ever breastfeeding, breastfeeding duration which has been assessed as a continuous measure in months or weeks, or as a categorical variable (e.g., long vs. short). Some studies have examined the percentage of breastfed meals, exclusive breastfeeding duration (when a child is exclusively breastfed until formula feed and/or solid foods are introduced). In a meta-analysis by Victora et al. [27], breastfeeding never vs. ever was associated with a reduction in sudden infant deaths, a reduction of acute otitis during the first few years of life, a protection against allergic rhinitis in children <5 years, a higher child Intelligence Quotient (IQ) of about three IQ points. More versus less breastfeeding has been associated with major protection against diarrhea morbidity, a reduction in severe respiratory infection, and effects on deciduous teeth. Exclusive breastfeeding has been associated with a strong protective result against infectious disease and allergic rhinitis in children <5 years. A dose–response association with duration of breastfeeding was found for a higher IQ and a decreased risk for overweight and obesity.
Epigenome-wide association studies (EWASs) can offer new insights into DNA–environment interactions in determining child development and health [51]. To our knowledge, seven association studies (two candidate gene studies, two EWASs with breastfeeding as covariate and three EWASs of breastfeeding) have been performed on breastfeeding and DNA methylation in humans to date (see Table S1). A candidate gene study of Obermann-Borst et al. found a negative association between the duration of breastfeeding (in categories) and methylation level in blood cells from 120 children (mean age 1.4 years) at seven CpG sites in the promoter of the LEP gene; a hormone that regulates energy homeostasis [52]. A suggestive positive association of the methylation level of 2201 CpGs and a negative association of the methylation level of 2075 CpGs with the duration of breastfeeding (continuous measure in weeks) were reported in blood samples from 37 infants (mean age 25.7 months) [53]. These CpGs were annotated to genes predominantly involved in the control of cell signaling systems, the development of anatomical structures and cells, and the development and function of the immune and central nervous systems [53]. The impact of breastfeeding duration (continuous measure in months) on DNA methylation patterns in 200 children (mean age 11.6 years) was suggested in a study of asthma [54]. An EWAS of Sherwood et al. on exclusive breastfeeding supported the findings of Obermann-Borst et al. at a later stage in childhood (10 years, n = 297) but not in young adulthood (18 years, n = 305) [55]. This suggests that methylation changes induced by breastfeeding may change with time and may be more evident at an early age. Similarly, it has been observed that associations between DNA methylation and maternal smoking and birthweight attenuate during childhood [56,57]. Nevertheless, a long-lasting modulating effect of breastfeeding (continuous measure in weeks) on the effects of methylation quantitative trait loci (mQTLs) for CpG sites at the 17q21 locus, where the IL4R (interleukin-4) gene is located, has been suggested at age 18 (n = 245) [58]. Not having been breastfed has been associated with an increase in methylation of the promoter of the tumor suppressor gene CDKN2A (cyclin dependent kinase inhibitor 2A) in premenopausal breast tumors of 639 women (mean age of 57.6 years) [59]. In a more recent EWAS study, breastfeeding (dichotomized as never vs. ever) was associated with changes in the TTC34 gene at age 7 (n = 640), which were still evident in adolescence (n = 709) [60]. These previous epigenetic studies of breastfeeding were often conducted with relatively small samples (average sample size = 307, range = 37–640). In all studies, DNA was extracted from peripheral blood [52,53,54,55,58], or from tumor tissues in adults [59].
We aimed to carry out an EWAS of breastfeeding in 1006 children around nine years of age recruited by the Netherlands Twin Register (NTR) based on buccal cell DNA and a replication analysis of loci previously associated with breastfeeding in aforementioned epigenetic studies. Buccal samples typically consist of a large proportion of epithelial cells, which might serve as a surrogate tissue for other ectodermal tissues, including the brain [61,62]. Buccal samples also consist of a smaller proportion of leukocytes [63]. To date, few EWASs have been performed on buccal DNA. As some studies have suggested that the effects of early life exposures, including breastfeeding [55,56,57,58], may fade away during childhood, we also performed an EWAS on younger children (age <10 years; where 10 corresponds to the median age of the sample) and compared effect sizes in this group with effect sizes in children older than 10 years. We applied a median split of the sample by age to achieve equal sample sizes in both groups. We hypothesized that if effects of breastfeeding attenuate with age, associations would be strongest in the younger age group. We performed replication in an independent buccal-cells DNA methylation dataset from the NTR (n = 98) and in a blood-DNA-methylation dataset from the Avon Longitudinal Study of Parents and Children (ALSPAC) (n = 938). We also examined the correlation between methylation levels of twins for the significant CpGs associated with breastfeeding. We hypothesized that the equal exposure to breastfeeding of co-twins should cause resemblance in their methylation profiles.

2. Materials and Methods

2.1. Overview

We carried out an EWAS in the NTR in 1006 children from 496 complete pairs and 14 twins from incomplete pairs with DNA methylation in buccal cells, testing 787,711 methylation sites (α = 0.05/787771 = 6.34 × 10⁻⁸). The EWAS analyses in different age groups were performed following the median-split of the sample by age (age <10 years: n = 517, age range = 5–9; age ≥ 10 years: n = 489, age range = 10–12). Two models were applied with different covariates (Model 1 = “basic model” and Model 2 = “adjusted model”) (see Table S2). Epigenome-wide significant results were taken forward, after checking effects of outliers, for a replication analysis in an independent sample, consisting of 98 NTR children with DNA methylation in buccal cells and in 938 ALSPAC children with DNA methylation in peripheral blood cells. Lastly, we performed a follow-up analysis of the results of previous studies (3859 CpGs) in the discovery cohort (NTR) in the total sample (n = 1006) and the younger age group (n = 517). A flowchart of the analyses is provided in Figure 1.

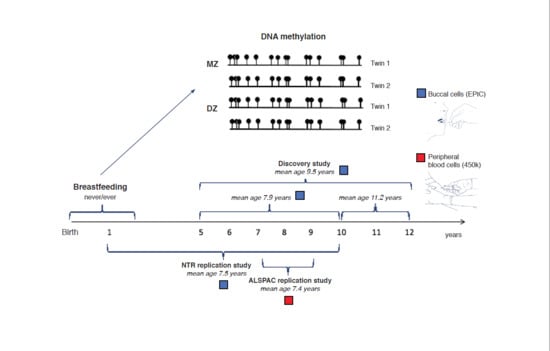
2.2. Subjects and Samples

2.2.1. Discovery Study

The subjects were enrolled in the NTR [64] a few weeks to months after birth. Informed consent was obtained from parents. Data on breastfeeding collected around the age of 2 years of the children and good quality DNA methylation data around 9 years of age (mean = 9.5, standard deviation (SD) = 1.89, range = 5–12) were available for 1006 children. The dataset included 51.6% girls and 86% monozygotic twins. This study is embedded in a larger project on childhood aggression: Aggression in Children: Unraveling gene-environment interplay to inform Treatment and InterventiON strategies (ACTION) [65,66]. From the population-based NTR, the ACTION study identified twins who at least once scored higher or lower on a sum score for aggression [67,68].

2.2.2. NTR Replication Study

An independent group of children from the NTR for whom EPIC array methylation data were previously described [63] were included as replication study. This cohort was also embedded in the ACTION project and were comprised of 98 monozygotic twins with available data on breastfeeding duration and DNA methylation from buccal swabs (mean age = 7.5 years, SD = 2.4, age range = 1–10). The NTR studies were approved by the Central Ethics Committee on Research Involving Human Subjects of the VU University Medical Centre, Amsterdam, an Institutional Review Board certified by the U.S. Office of Human Research Protections (IRB number IRB00002991 under federal-wide Assurance-FWA00017598; IRB/institute codes, NTR 03–180).

2.2.3. ALSPAC Replication Study

Data came from the ALSPAC [69,70], a population-based birth cohort. All pregnant women living in the geographical area of Avon (UK) with expected delivery date between 1 April 1991 and 31 December 1992 were invited to participate. Approximately 85% of the eligible population was enrolled, totaling 14,541 pregnant women who gave informed and written consent. The study website contains details of all the data that are available through a fully searchable data dictionary and variable search tool (http://0-www-bris-ac-uk.brum.beds.ac.uk/alspac/researchers/data-access/data-dictionary/). Ethical approval for the study was obtained from the ALSPAC Ethics and Law Committee and the Local Research Ethics Committees. Of these, 938 children had information on breastfeeding duration and DNA methylation from peripheral blood cells measured on the Infinium HumanMethylation450 BeadChip (mean age = 7.4, SD = 0.13, age range = 7.1–8.8) within the Accessible Resource for Integrated Epigenomics Studies (ARIES) project [71].

2.3. Phenotype Data

In the NTR, breastfeeding was assessed in a questionnaire sent to mothers 2 years after the twins were born. Mothers were separately asked about breastfeeding for the first and second born twin. There were six answer categories: ‘no’, ‘less than 2 weeks’, ‘2–6 weeks’, ‘6 weeks to 3 months’, ‘3–6 months’, and ‘more than 6 months’, For the main analyses, breastfeeding as exposure was recoded into 2 categories: ‘ever’ and ‘never’, No information on exclusive and mixed breastfeeding was available. The duration of breastfeeding was used in a secondary analysis based on the 6 categories from the original questionnaire coded from 0 (no) to 5 (more than 6 months). Socio-economic status (SES) was determined in two ways (depending on the version of the survey): (1) SES was obtained from a full description of the occupation of the parents and was subsequently coded according to the Standard Classification of Occupations [72]; (2) SES was obtained by the Erikson-Goldthorpe-Portocarero (EPG)-classification scheme [73], combined with information on parental education. The self-reported maternal pre-pregnancy weight just before pregnancy (in kilograms) divided by the square of height (in meters) was used to obtain the maternal pre-pregnancy body mass index (BMI) (weight/height2). Maternal smoking during pregnancy was reported by mothers for three trimesters of pregnancy and was coded as non-smoking if the mother did not smoke during the entire pregnancy and smoking if the mother smoked at least during one trimester [74]. The mode of conception was classified in three groups: naturally conceived, conceived through stimulation, and conceived via in vitro fertilization (IVF) or intracytoplasmic sperm injection (ICSI) [75]. The mode of delivery was assessed as vaginal delivery, caesarean section (planned and urgent), and vaginal delivery with urgent intervention with forceps or vacuum extraction. Apgar scores at the 1st and 5th minute were presented in 3 conventional categories 0–6 (low), 7–9 (intermediate), and 10 (high) [76]. Gestational age, birthweight, parental age at birth were categorized in groups for descriptive statistics and treated as continuous z-scores in the analyses.

ALSPAC Replication Study

Breastfeeding was assessed via a questionnaire sent to mothers when the study children were approximately 6 months old. Breastfeeding was coded as ‘ever’ or ‘never’. Information on sample characteristics and covariates was obtained by questionnaires completed by the mother during pregnancy and from medical birth records. Socio-economic status was determined by the highest level of maternal education (grouped as follows: certificate of secondary education or not, vocational, O-level, A-level, or university degree). Maternal characteristics included age at birth, pre-pregnancy height and weight, and smoking during pregnancy (any or none). Gestational characteristics included caesarean delivery, gestational age and birthweight.

2.4. DNA Sample Collection

2.4.1. NTR (Discovery and Replication Study)

DNA samples were collected from buccal swabs, as described previously [77]. In short, 16 cotton mouth swabs were individually rubbed against the inside of the cheek on 2 days (morning and evening) and placed in four separate 15 mL conical tubes containing 0.5 mL of a Sodium Chloride-Tris-Ethylenediaminetetraacetic acid (STE) buffer (100 mM sodium chloride, 10 mM Tris hydrochloride (pH 8.0), and 10 mM ethylenediaminetetraacetic acid) with proteinase K (0.1 mg/mL) and sodium dodecyl sulfate (SDS) (0.5%) per swab. Individuals were asked to refrain from eating or drinking 1 h prior to sampling. High molecular weight genomic DNA was extracted by standard DNA extraction techniques. The DNA samples were quantified using the Quant-iT PicoGreen dsDNA Assay Kit (ThermoFisher Scientific, Waltham, MA, USA).

2.4.2. ALSPAC Replication Study

The ALSPAC blood-based DNA methylation profiles were generated at age 7 as part of the ARIES [71], a subsample of approximately 1000 mother-child pairs from the ALSPAC study.

2.5. DNA-Methylation Measurements

2.5.1. NTR Discovery Study

The genome-wide DNA methylation in buccal cells [68] was assessed with the Infinium MethylationEPIC BeadChip (Illumina, San Diego, CA, USA) [78] by the Human Genotyping facility (HugeF) of ErasmusMC, the Netherlands (http://www.glimdna.org/). Five hundred nanograms of genomic DNA from buccal swabs were bisulfite treated using the ZymoResearch EZ DNA Methylation kit (Zymo Research Corp, Irvine, CA, USA). The quality control of the methylation data are described in detail elsewhere [68]. In brief, the quality control (QC) and normalization of the methylation data were performed using a pipeline developed by the Biobank-based Integrative Omics Study (BIOS) consortium [79], which includes sample quality control using the R package MethylAid [80] and probe filtering and functional normalization as implemented in the R package DNAmArray. We previously and successfully applied this pipeline in a pilot study of EPIC array data from buccal samples [63], which was used as replication sample in the current paper. MethylAid was applied with the default EPIC array-specific quality filter thresholds for EPIC arrays. The R package omicsPrint [81] was used to call genotypes based on methylation probes and to verify sample relationships based on those single nucleotide polymorphisms (SNPs) (e.g., the zygosity of twins and samples from the same individual). We checked for sample mismatches between methylation data and genotype data by computing the correlation between SNP genotypes called by omicsPrint based on methylation probes and genotypes based on genome-wide SNP arrays. DNAmArray and meffil [82] were used to identify sex mismatches (both packages identified the same mismatches).
Functional normalization was performed based on five control probe principal components (PCs). The following probe filters were applied: Probes were set to missing (NA) in a sample if they had an intensity value of exactly zero, detection p-value > 0.01, or bead count <3. Probes were excluded from all samples if they mapped to multiple locations in the genome, if they overlapped with an SNP or insertion/deletion (INDEL), or if they had a success rate <0.95 across samples. Annotations of ambiguous mapping probes (based on an overlap of at least 47 bases per probe) and probes where genetic variants (SNPs or INDELS) with a minor allele frequency >0.01 in Europeans overlap with the targeted CpG or single base extension site (SBE) were obtained from Pidsley et al. [83]. After probe filtering, the success rate of probes for each sample was checked: All samples had a success rate above 0.95 after removal of low-performing samples detected by MethylAid. Only the autosomal methylation sites were analyzed, leaving 787,711 out of 865,859 sites for analysis.

2.5.2. NTR Replication Study

Genome-wide DNA methylation in buccal cells was assessed with the Infinium MethylationEPIC BeadChip (Illumina, San Diego, CA, USA) [78] by the Avera Institute for Human Genetics. The quality control, processing and normalization of the data were performed with the same pipeline as for the NTR discovery cohort, a pipeline which has previously been described in detail [63].

2.5.3. ALSPAC Replication Study

DNA methylation wet laboratory procedures, preprocessing analyses, and quality control were performed at the University of Bristol, as previously described [71]. DNA methylation outliers were identified as those three times the inter-quartile range from the nearest of the first and third quartiles. Outliers were replaced with missing values.

2.6. Cellular Proportions

2.6.1. NTR Discovery and Replication Study

Cellular proportions were predicted with hierarchical epigenetic dissection of intra-sample-heterogeneity (HepiDISH) with the RPC method (reduced partial correlation), as described by Zheng et al. [84] and implemented in the R package HepiDISH. HepiDISH is a cell-type deconvolution algorithm that was specifically developed for estimating cellular proportions in epithelial tissues based on genome-wide methylation profiles and that makes use of reference DNA methylation data from epithelial cells, fibroblast and seven leukocyte subtypes. This was applied to the data after data QC and normalization.

2.6.2. ALSPAC Replication Study

Cell count estimates were estimated from DNA methylation profiles using a deconvolution algorithm [85] and included in statistical models to adjust for cell count heterogeneity.

2.7. Data Analyses

2.7.1. Associations between Breastfeeding and Pre- and Perinatal Factors
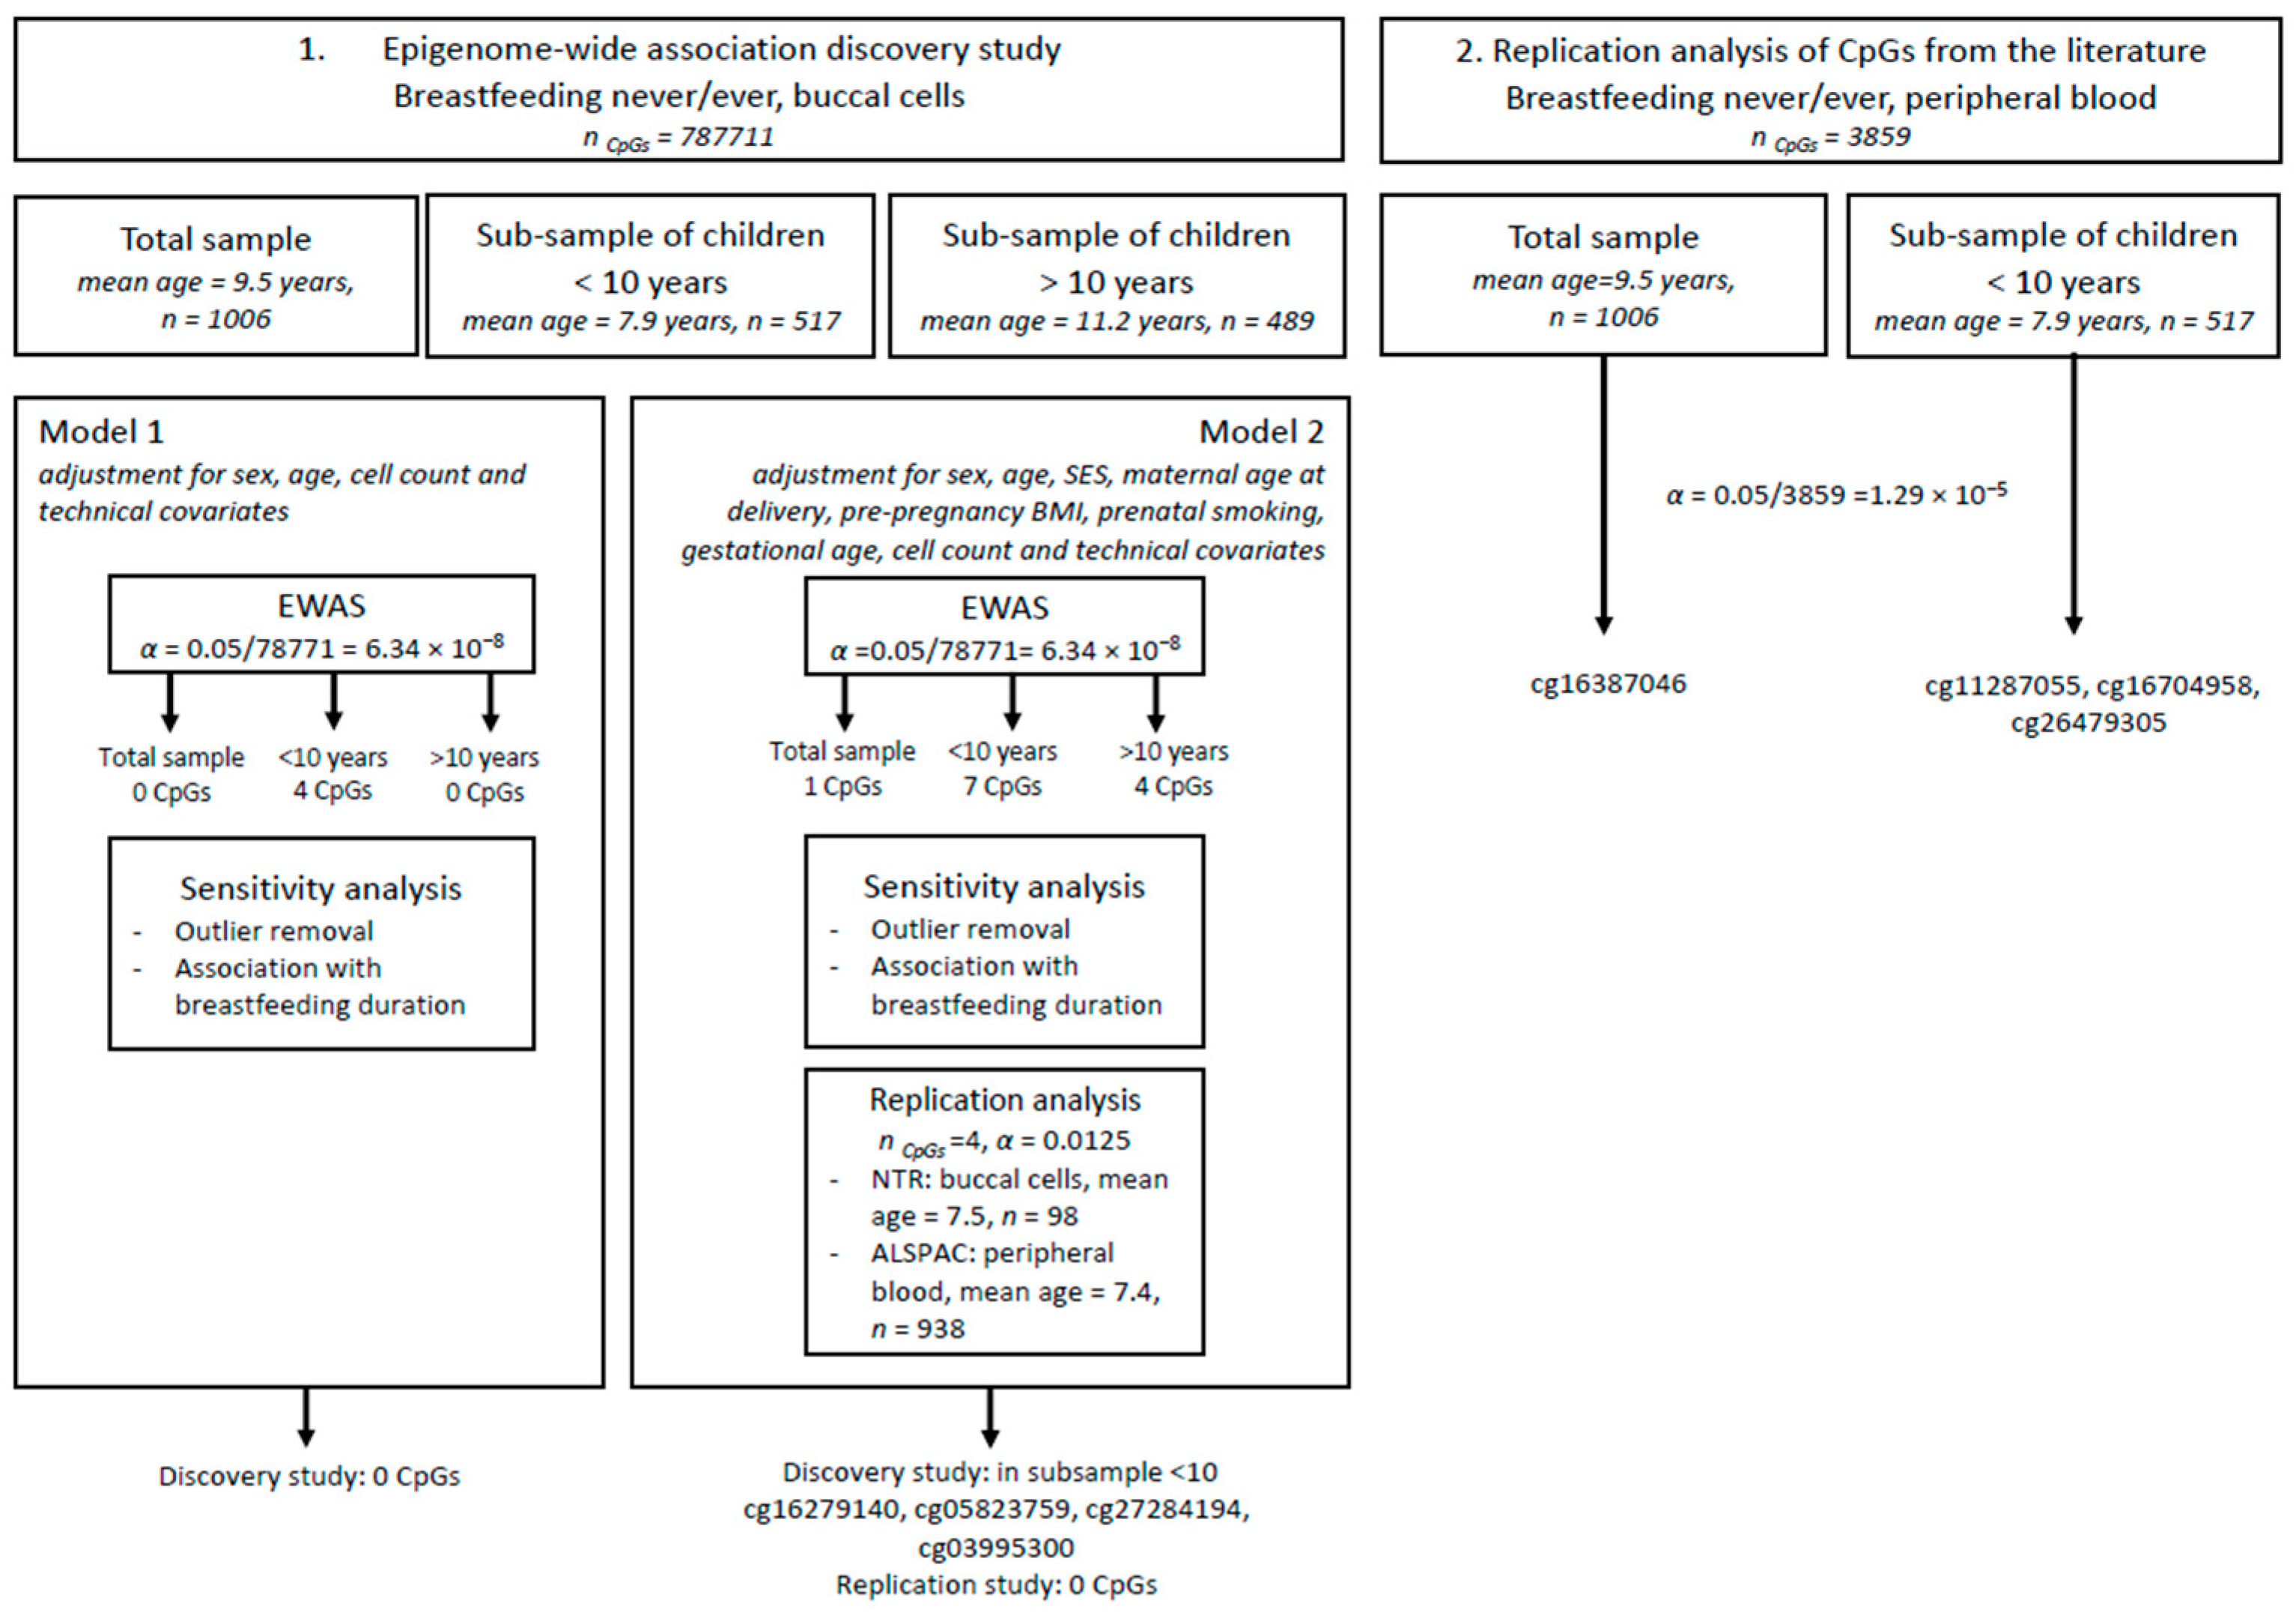
The association between covariates and breastfeeding was tested in the discovery cohort using a generalized estimating equations (GEE) model that accounted for the correlation structure within families. Six breastfeeding duration categories were included as the continuous outcome variable. The predictors consisted of variables previously described as covariates in EWASs of maternal smoking and birth weight [56,57], i.e., parental SES, maternal smoking during pregnancy (yes/no), gestational age (z-scores), maternal age at birth (z-score), maternal pre-pregnancy BMI (z-scores), cell counts of epithelial cells and natural killer (NK) cells, child’s sex, and child’s age at DNA-methylation (see Table S3). This analysis was performed in SPSS version 25.

2.7.2. EWAS

Discovery Study

The association between DNA methylation level and breastfeeding was tested using a generalized estimating equations (GEE) model that accounted for the correlation structure within families with DNA methylation β-value as the outcome variable (see Table S2). All analyses in the NTR were performed with GEE models, which were fitted with the R package ‘gee.’ The following settings were used: Gaussian link function (for continuous outcome variables), 100 iterations, and the ‘exchangeable’ option to account for the correlation structure within families. To examine and adjust (where applicable) for the inflation of test statistics, the R package bacon was used [86]. We first fitted a basic model with the following predictors: breastfeeding, sex, age at sample collection, the percentages of epithelial and natural killer cells, EPIC array row and bisulfite sample plate (using dummy coding). For the primary EWAS, the breastfeeding outcome was dichotomized (yes/no). Secondly, we fitted a model in which we adjusted for additional covariates (SES, maternal smoking, mother’s age at birth, mother’s BMI at pregnancy, and gestational age). These covariates were selected on the base of adjustments done in recent meta-analyses of maternal smoking and birthweight [56,57]. We also considered the effects of the duration of breastfeeding by evaluating the same model with the original six categories (not-breastfed; <2 weeks; 2–6 weeks; 6 weeks to 3 months; >6 months). Thirdly, we repeated the EWAS in children younger than 10 years and older than 10 years. To this end, we split up the sample into two groups (median age split) to have two equally-sized groups: children younger than 10 years and children older than 10 years. Epigenome-wide significance was assessed following Bonferroni correction for the number of methylation sites tested (α = 0.05/787,711 = 6.34 × 10⁻⁸).
We carefully checked if epigenome-wide significant associations were influenced by outliers. As a sensitivity analysis, we repeated the association analysis in the discovery sample for significant CpGs without outliers defined using the Tukey method [87], in which an outlier is any value greater than the upper quartile plus three-times the interquartile range or any value lower than the lower quartile minus three-times the interquartile ranges.

Twin Correlations

The correlation between DNA methylation levels of monozygotic (MZ) and dizygotic (DZ) twins was computed for CpGs that were significant in the discovery study and which were robust to outliers. The methylation beta-values were adjusted for the set of covariates as included in the basic EWAS model with a linear model, and residuals were saved. Next, the MZ and DZ twin correlations were computed on the residuals.

Replication

CpGs that were significant in the discovery study and which were robust to outliers were selected for replication. The basic and adjusted models were applied as in the discovery sample: in the NTR, the GEE model had the same covariates; in the ALSPAC, cell count estimates for peripheral blood were included instead of the epithelium cells count; the sex, age of the child at blood collection around age 7 and the same covariates from the adjusted Model 2 were included; no siblings were included. In the ALSPAC, DNA methylation variation due to technical artefacts or unknown confounders were handled by including 20 surrogate variables generated from the DNA methylation data using the ‘sva’ R package [88], and associations were tested with linear models implemented by the limma package [89].

2.8. Methylation Data Annotation

To examine previously reported associations for epigenome-wide significant CpGs associated with breastfeeding, we looked them up in the EWAS atlas (https://bigd.big.ac.cn/ewas/tools; accessed on 3 October 2019 [90]) and the EWAS catalog (http://www.ewascatalog.org; accessed on 3 October 2019). To analyze the possible function of CpGs, we searched for overlaps with mQTLs in a study that analyzed EPIC array data from 102 buccal samples [63] to identify the associated SNPs, and we looked up these SNPs and genes in the genome-wide association study (GWAS) catalog (https://www.ebi.ac.uk/gwas/; accessed on 4 October 2019).

2.9. Overlap with Previous Findings

The follow-up analyses were done for CpGs that were previously associated with breastfeeding in EWASs or candidate gene studies. These included all CpGs on the EPIC array that were annotated to the genes LEP (nCpGs = 23) [52,53,54,55,58], IL4R (nCpGs = 37) [58], CDKN2A (nCpGs = 32) [59], 1 CpG from the study of Hartwig et al. [60], and 4297 suggestive CpGs from the study of Naumova et al. [53]. In total, this resulted in a list of 4370 CpGs, of which 3859 CpGs were present (after QC) in our data. For these CpGs, we performed a look-up analysis in the total sample (n = 1006) and in the subsample younger than 10 years (n = 517) of the discovery NTR cohort. Significance was assessed after Bonferroni correction for the number of CpGs tested (α = 0.05/3858 = 1.29 × 10⁻⁵).

3. Results

3.1. Descriptive Statistics

Descriptive statistics are presented in Table 1. The total discovery sample consisted of 1006 children (mean age 9.5, SD = 1.89); 73.7% of the children were breastfed with different duration, and 26.3% never received breastfeeding. Most of the children were breastfed at least one month: 189 (25.5%) were breastfed for 2 weeks to 1.5 months, 181 (24.4%) were breastfed for 1.5–3 months, 148 (20%) were breastfed for 2–6 months, and 148 (20%) were breastfed more than 6 months. The subsample of children younger than 10 years old included 517 twins (mean age 7.9, SD = 1.1) (see Table S4), and the group older than 10 years included 489 twins (mean age = 11.16, SD = 0.72) (see Table S5). The majority of twin pairs was concordant for breastfeeding (99.4%). Among the discordant twin pairs were three pairs, of which one twin was not breastfed while their co-twin received breastfeeding and three pairs of which the co-twins experienced different durations of breastfeeding.
Breastfeeding duration (six categories) was significantly positively associated with socio-economic status (β = 0.353, standard error (SE) = 0.09, and p = 0.0004) and inversely associated with maternal smoking (β = −0.733, SE = 0.32, and p = 0.02) and gestational age (β = −0.194, SE = 0.09, and p = 0.03) (see Table S3). Breastfeeding was not significantly correlated with maternal pre-pregnancy BMI (β = −0.117, SE = 0.75, and p = 0.119), maternal age at delivery (β = −0.016, SE = 0.09, and p = 0.86), and the cell composition of buccal swabs (β = 1.27, SE = 1.2, and p = 0.25 for count of epithelial cells; and β = 14.78, SE = 9.8, and p = 0.13 for count of natural killer cells).

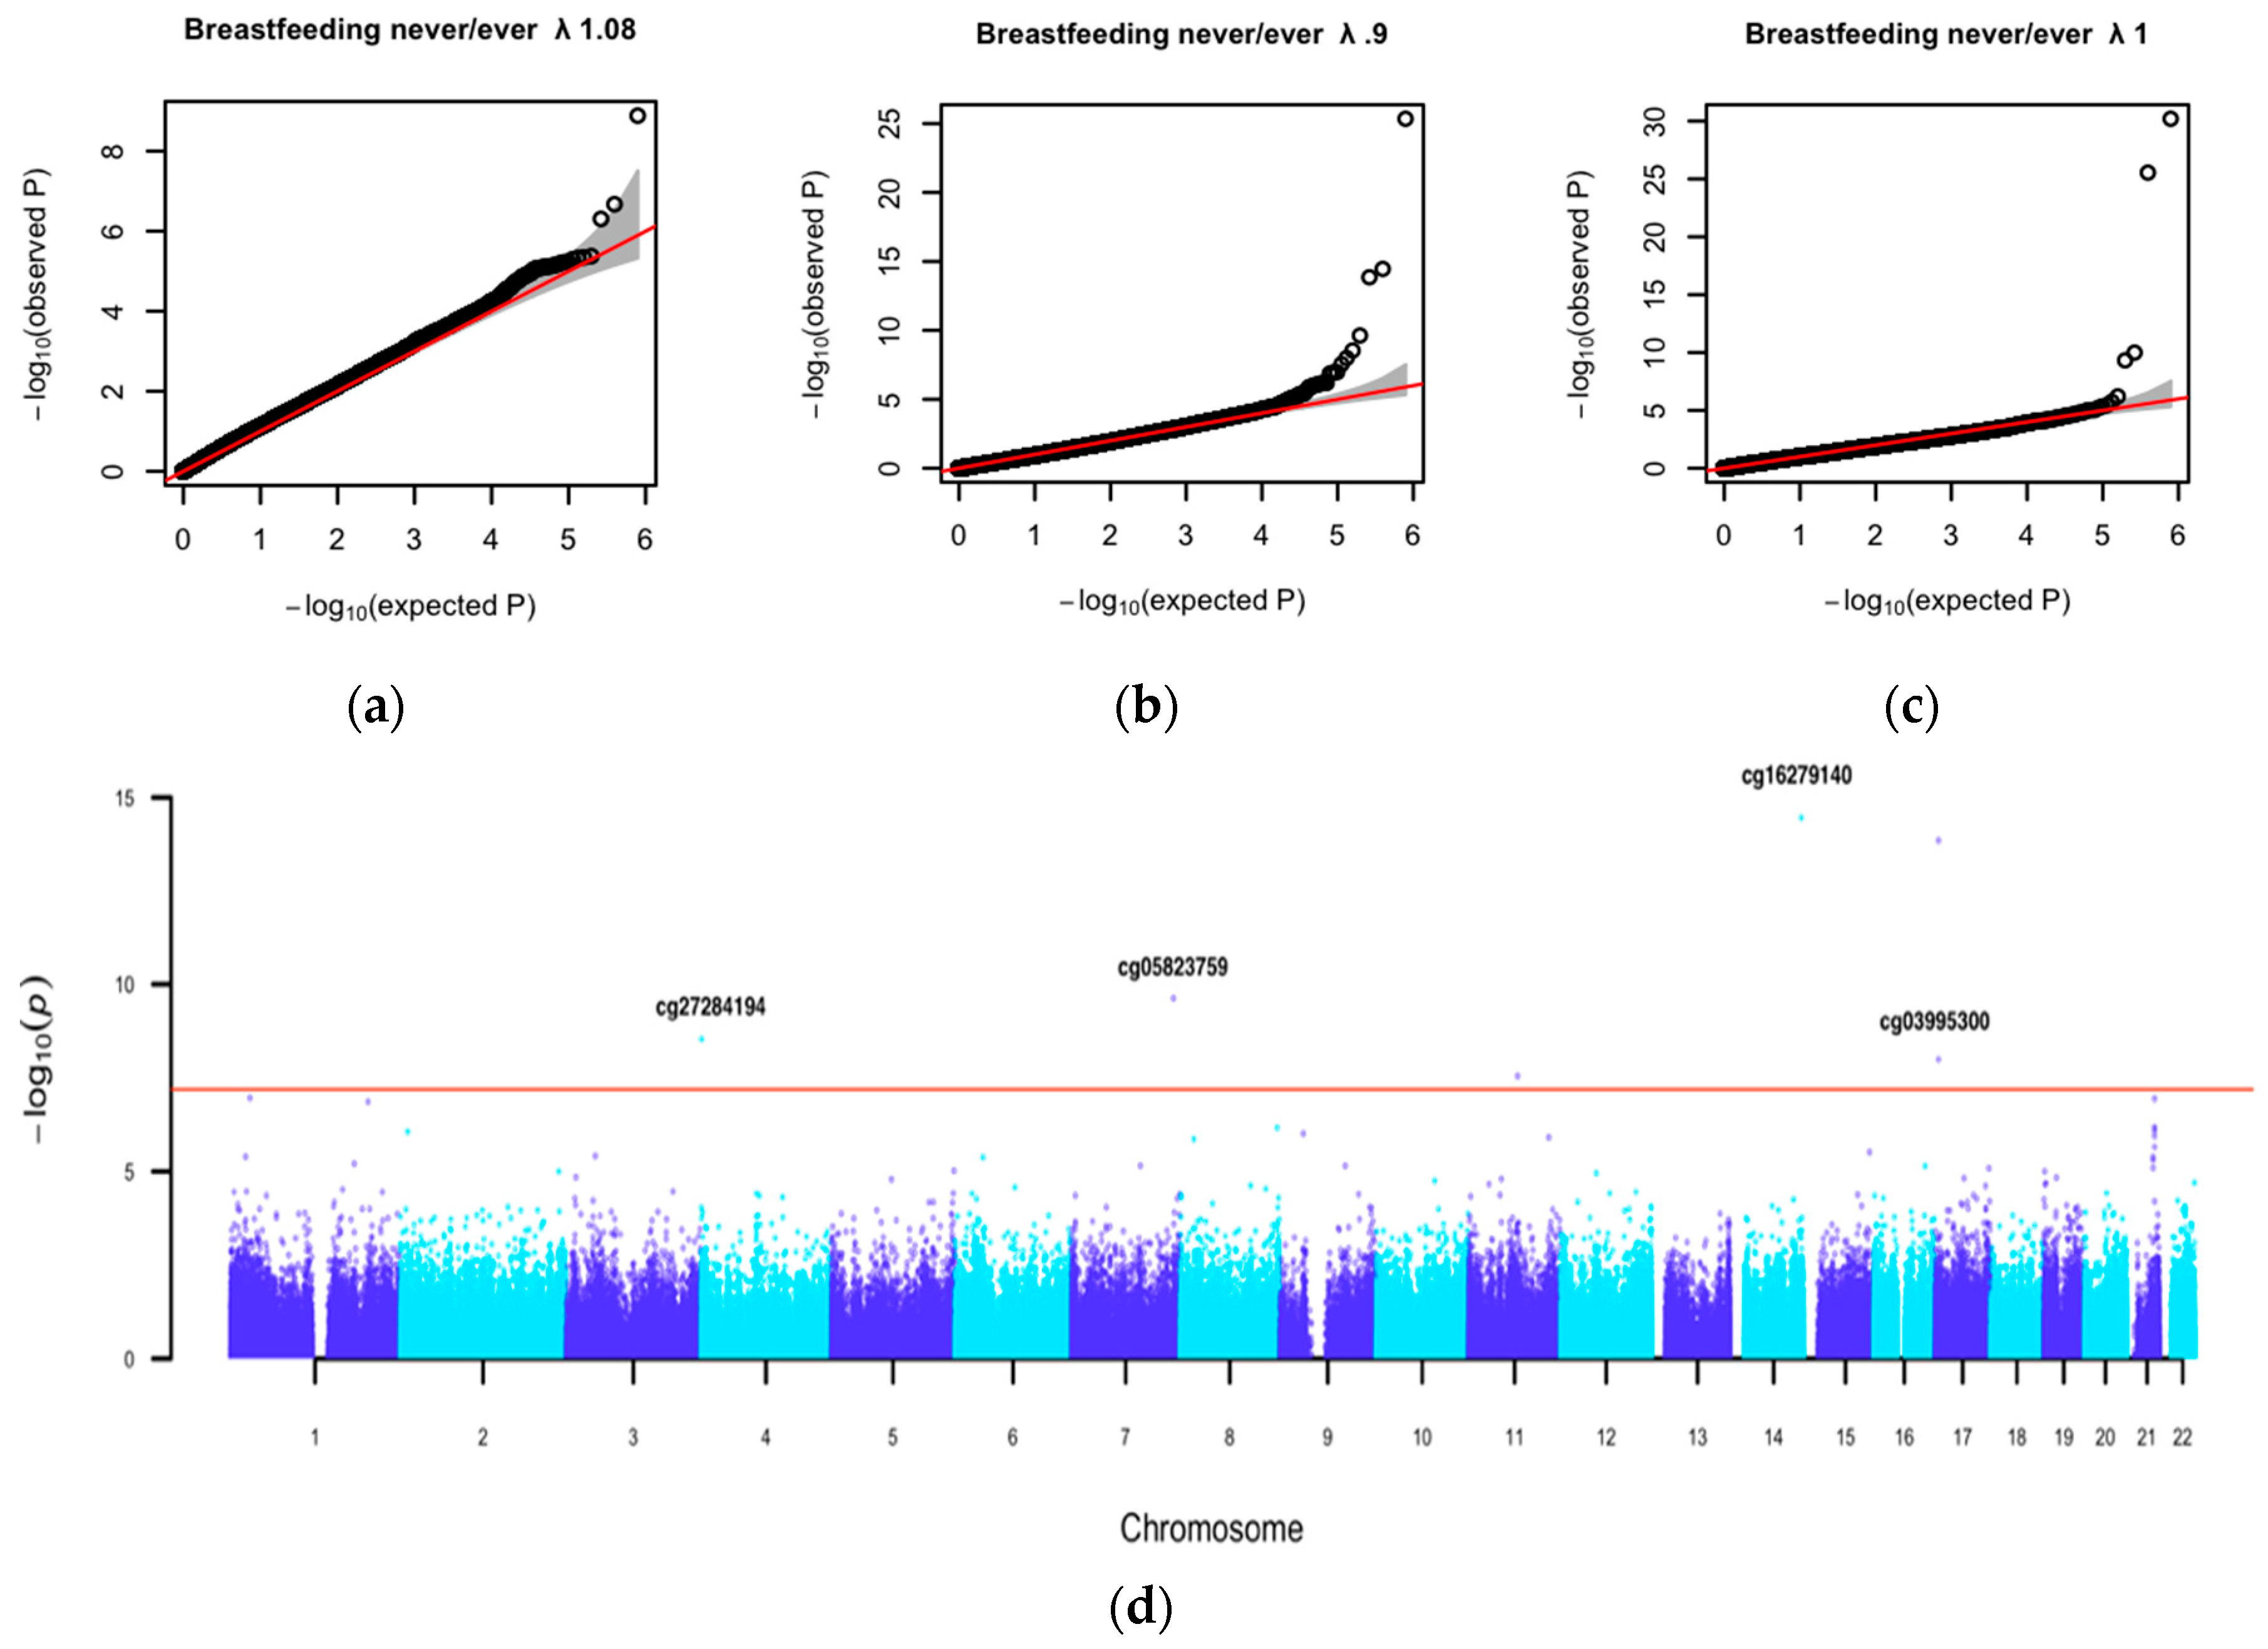
3.2. Association Analysis Findings

First, genome-wide DNA-methylation analyses were performed to test the association between breastfeeding (never/ever) and DNA-methylation level while adjusting for sex, age at DNA sample collection, estimated proportion of epithelial cells, the estimated proportion of natural killer cells, the row of the sample on the chip, and the bisulfite plate (model 1). No epigenome-wide significant sites were identified (see Table S8). Genome-wide EWAS test statistics showed no inflation (see Figure S1). DNA methylation was also not associated with the duration of breastfeeding (see Table S9).
In the EWAS in children younger than 10 years with the same basic model, we identified four epigenome-wide significant CpGs (see Table S10): cg25178826 (β = −0.026, SE = 0.003, and p = 8.04 × 10⁻¹²) is located in the 5’ untranslated region (5′UTR) region of PRLR (prolactin receptor) gene, cg12087956 (β = −0.03, SE = 0.005, and p = 1.8 × 10⁻⁸) is in the gene body of CDAN1 (codanin 1), cg24192772 (β = −0.024, SE = 0.004, and p = 2.5 × 10⁻⁸) is in the gene body of FOXK2 (forkhead box K2), and cg10142656 (β = −0.02, SE = 0.004, and p = 6.28 ×10⁻⁸) is mapped to the transcription start site (TSS1500) of TRMT10B (tRNA methyltransferase 10B). These four CpGs were not strongly associated with breastfeeding duration (see Table S11). The plots of the methylation values for these four CpGs revealed several extreme methylation values in the data (see Figure S2 and Table S10), and the association with breastfeeding disappeared after outlier removal: cg25178826 β = −0.00006, SE = 0.001, and p = 0.98; cg12087956 β = 0.00004, SE = 0.0009, and p = 0.5; cg24192772 β = 0.0009, SE = 0.001, and p = 0.15; and cg10142656 β = 0.0001, SE = 0.0008, and p = 0.13 (see Table S10).
Next, we performed EWASs of breastfeeding never/ever with adjustments for SES, maternal age at delivery, maternal pre-pregnancy BMI, maternal prenatal smoking, and gestational age (Model 2). One CpG, cg22491379, was significant in the total sample (β = −0.007, SE = 0.001, and p = 1.3 × 10⁻⁹) (see Figure 2a, Figure S3, Table 2 and Table S12), and seven CpGs were significant in the children younger than 10 years (see Table 2 and Table S14). The Manhattan plot for the EWAS in children younger than 10 years showed a peak on chromosome 21, which contains a cluster of CpGs just below the epigenome-wide significance threshold (see Figure 2d). Results from the same analysis for breastfeeding duration are shown in Tables S13 and S15.
Genome-wide EWAS test statistics from the analyses of Model 2 (in the total sample and in the children younger than 10 years) showed no inflation (see Figure 2a,b). For four out of the eight significant CpGs, the association disappeared after removal of outliers (see Figures S4 and S5). The four CpGs that were unaffected by outliers were selected for a replication analysis (see Figure S6): cg16279140 (β = −0.4, SE = 0.05, and p = 3.5 × 10⁻¹⁵), cg05823759 (β = 0.2, SE = 0.032, and p = 2.35 × 10⁻¹⁰), cg27284194(β = 0.64, SE = 0.12, and p = 2.9 × 10⁻⁹), and cg03995300 (β = 0.23, SE = 0.04, and p = 1.2 × 10⁻⁸) (see Table S14). All four CpGs were significant in children younger than 10 years.
We next examined the association with breastfeeding in children older than 10 (Model 2). In this analysis, the genome-wide test statistics showed mild inflation (lambda = 1.11). After adjusting for inflation, four CpGs remained epigenome-wide significant, but none were significant after outlier removal. The four significant CpGs in the children younger than 10 years had smaller effects, and three CpGs showed inverse directions of effect in children older than 10: cg16279140 (β = 0.04, SE = 0.02, and p = 0.04), cg05823759 (β = −0.002, SE = 0.02, and p = 0.92), cg27284194 (β = 0.18, SE = 0.06, and p = 0.002), and cg03995300 (β = −0.003, SE = 0.02, and p = 0.89) (see Table S16). The quantile-quantile plots (see Figure 2b,c) suggested a stronger association signal for breastfeeding in children younger than 10 years than in the older group. We computed the correlations between the regression coefficients (i.e., the methylation difference associated with breastfeeding) for the top 100 CpGs from each age group. These correlations were weak (r = 0.25 and p = 0.10 for the top 100 CpG from the EWAS in children <10 years and from the EWAS in children >10 years). This suggests that methylation profiles associated with breastfeeding are different in children younger than 10 years and older than 10 years.
We computed the twin correlations in the MZ and DZ pairs for the significant CpGs, as we assumed that equal exposure to breastfeeding should cause similarity in methylation level of twins. The correlations of methylation levels of all four sites were very high in MZ twins and almost twice as high as in DZ twins: cg16279140 rMZ = 0.906, rDZ = 0.505; cg05823759 rMZ = 0.953, rDZ = 0.609; cg27284194 rMZ = 0.972, rDZ = 0.462; and cg03995300 rMZ = 0.902, rDZ = 0.453. This pattern suggests that there are heritable influences on DNA methylation at these CpGs, as previously shown by other studies of DNA methylation heritability.

3.3. Replication Analysis of Our Findings in Other Samples

Both replication datasets were comparable to the discovery subsample of children younger than 10 years old (see Tables S4, S6, and S7). As expected, the singleton children (ALSPAC) had a higher gestational age (~39 weeks vs. ~35.7), a higher birthweight (~3500 g vs. ~2400 g) and a lower proportion of caesarean deliveries (~9% vs. ~36.8%). We performed a replication analysis for significant CpGs unaffected by outliers from the adjusted Model 2 of the discovery analysis with the same set of covariates (see Table 3).
In the NTR replication cohort, for one CpG, the direction of effect changed (cg03995300, ZNF232, β = −0.050, SE = 0.033, and p = 0.13), and three other CpGs had the same direction of effect but were not significant: cg16279140 (β = −0.03, SE = 0.04, and p = 0.43), cg05823759 (β = 0.03, SE = 0.033, and p = 0.32), and cg27284194 (β = 0.07, SE = 0.054, and p = 0.21) (see Table 3, Figure S7).
In the ALSPAC, the most important difference to note were the different tissues used for DNA methylation profiling (peripheral blood) and the platform (the Illumina Infinium HumanMethylation450 Beadchip [Illumina, San Diego, CA, USA]). Because of the platform difference, roughly half of the CpG sites included in the discovery DNA methylation profiles were measured in the ALSPAC. In the adjusted Model 2, two of the four most strongly associated CpG sites were not included on the ALSPAC platform (cg16279140 and cg05823759), nor were any other sites within 1000 base pairs (bp) of these sites. The other two sites, cg27284194 and cg03995300, were included, but neither association was replicated (p > 0.19 and p > 0.77, respectively) in the adjusted model (see Table 3). An overall lack of replication was confirmed by low correlations between effect estimates in the discovery and the ALSPAC. In particular, we identified the 100 most strongly associated CpG sites in the discovery that were also present in the ALSPAC DNA methylation profiles. The correlation of effect estimates for these sites between studies was low (Pearson’s r = 0.13 with p = 0.2 for the adjusted model).

3.4. Replication Analysis of Findings from Previous EWAS

Of the 3858 CpGs from previous literature, four CpGs were associated with breastfeeding in our sample (α = 1.29 × 10⁻⁵, see Table 4). One site was significant in the total sample (see Table S17): cg16387046 is located on chromosome 12 in the MUCL1 (mucin like 1) gene (β = 0.027, SE = 0.005, and p = 4.9 × 10⁻⁷). Three sites were significant in the children younger than 10 years (see Table S18): cg16704958 (β = 0.009, SE = 0.002, and p = 8.03 × 10⁻⁶) and cg11287055 (β = 0.056, SE = 0.01, and p = 4.9 × 10⁻⁶), located on chromosome 21 in the VPS26C (endosomal protein sorting factor C; previous name DSCR3) gene, and cg26479305 (β = 0.338, SE = 0.07, and p = 1.11 × 10⁻⁵), located on chromosome 12 in the ATG101 (autophagy related 101, previous name C12orf44) gene. All these CpGs were previously reported in the association study by Naumova et al. [53] that was carried out in infants around two years old (mean age 25.7 months) with DNA methylation profiling in peripheral blood with Illumina EPIC BeadChip (Illumina, San Diego, CA, USA). The direction of association was positive for all four CpGs in both studies. CpGs located in/nearby LEP [52,55], IL4R [58] and CDKN2A [59], previously discussed as candidate genes for association with breastfeeding, were not significant in our study.

3.5. Methylation Data Annotation

For the significant CpGs from discovery and follow-up studies, we looked up the associations with nearby genetic variants (mQTLs) in the results from a previously published mQTL study of buccal-derived DNA in monozygotic twins [63]. Four CpGs were associated with mQTLs (cg27284194, associated with SNPs on chromosome 4: 927973–1039876; cg16279140, associated with SNPs on chromosome 14: 103823243–104186876; cg16387046, associated with SNPs on chromosome 12: 54830518–54896008; and cg26479305, associated with SNPs on chromosome 12: 52492131). Additionally, no significant mQTLs were found for four CpGs (cg03995300, cg05823759, cg11287055, cg16704958).
Next, we compared our results against all previously associated traits in EWASs (the EWAS atlas and the EWAS catalog) and GWASs (the GWAS catalog). One CpG (cg03995300) is mapped to ZNF232 and has been previously associated with prenatal maternal smoking, sex, and ancestry [56,91,92]. The ZNF232 locus was associated with a family history of Alzheimer’s disease in a GWA meta-analysis [93]. The intergenic CpG on chromosome 4 (cg27284194) has been previously associated with infertility [94,95]. In GWASs, the region 4: 927973–1039876 (harboring mQTLs for cg27284194) has been associated with a number of traits and diseases, including bone mineral density [96,97,98,99,100] and several metabolomic characteristics such as blood protein [101,102] and triglyceride [103] levels (See Table S19). The intergenic CpG on chromosome 14 (cg16279140) did not appear in previous EWASs. In GWASs, SNPs on chromosome 14: 103823243–104186876 have been linked to amino acids levels as biomarkers of metabolic disorders [104] and other blood metabolites [105], and some disease and addictions including multisite chronic pain [106], metabolite changes in chronic kidney disease [107], bipolar disorder [108], alcohol consumption [109] and risk-taking behavior [110] (See Table S19). The intergenic CpG on chromosome 7, cg05823759, has not been previously identified in an EWAS and is not associated with mQTLs.
Four CpGs that were replicated from previous studies on breastfeeding exposure have been reported in association with other traits and diseases. The ATG10 (C12orf44) gene, where cg26479305 is located, has been related to the autophagy pathway and cellular senescence in an EWAS [111]. It is related to regulators of inflammation (circulating cytokines and growth factors) [112], hematological traits in GWASs [113], and prenatal arsenic exposure [114].
CpGs (cg11287055, cg16704958) mapped to the VPS26C (DSCR3) have not been reported in other EWASs. VPS26C is a component of the retriever complex, which plays a role in cell surface processes such as cell migration, cell adhesion, nutrient supply and cell signaling [115].

4. Discussion

We aimed to study DNA methylation in buccal cells in mid-childhood in association with breastfeeding as an exposure. Associations were tested in the total sample and in groups stratified by age. The age distribution allowed us to analyze whether effects of breastfeeding can be attenuated with age, as this has been observed for other exposures in peripheral blood, including maternal smoking [56], birthweight [57] and breastfeeding [55].
We did not find evidence for robust epigenome-wide significant associations in the total sample (1006 children, age 5–12), but we did observe associations in the younger age group (before 10 years) that did not appear in the group of children of 10–12 years old. This suggests that epigenetic alterations in certain genomic regions might be associated with nutritional differences in the early postnatal life that tend to fade across childhood. However, since the CpGs were not replicated in the small, buccal-cells replication NTR dataset and in the large blood-cells replication dataset from the ALSPAC, further studies are required to follow up on these findings. It also remains to be examined if the associations reflect a causal effect of breastfeeding on methylation and whether these methylation differences might influence developmental trajectories and later-life health of the child.
The observation that associations between breastfeeding and methylation at some CpGs are age-dependent may be explained by age-related changes in DNA methylation that have been reported in several studies [116,117], including children in the age range of our study [118,119,120,121,122]. Similarly, Sherwood et al. [55] observed that breastfeeding is associated with the DNA methylation of the LEP gene at age 10 but not at age 18. Previous studies have identified DNA methylation signatures of prenatal nutrition in peripheral tissues at various life stages, even in adulthood. DNA methylation signatures in many genomic regions have been identified in middle-aged individuals who were exposed to the 1944/45 Dutch hunger winter at the time of conception, and many of these sites have been found to be related to growth, developmental processes and metabolism [18,19]. It is unclear if the effects of early life postnatal exposures can have similar long-term effects to prenatal exposures in humans, as most studies of early life influences on the epigenome have focused on prenatal exposures or have not examined long-term effects. None of the genes reported in studies of prenatal malnutrition (SMAD7, CDH23, INSR, RFTN1, CPT1A, KLF13 [19], IGF2 [18], and LEP [123]) were present among the top CpGs associated with breastfeeding in our study. Several explanations can be proposed. First, postnatal nutrition and prenatal nutrition exposures might differently influence the DNA methylation. Second, DNA methylation signatures induced by early nutrition exposure can be different across examined tissues (buccal cells in our study versus peripheral blood in previous famine studies). Third, the prenatal famine study examined the effects of an extreme exposure during the prenatal period.
The presence of associations with breastfeeding initiation (breastfeeding never vs. ever), and the absence of findings with breastfeeding duration suggests that the association depends on the exposure to breast milk rather than its duration. This could potentially be in line with previous findings that have shown that effects of exposure on DNA methylation occur only when the individual is exposed in certain sensitive life periods [118]. Our finding of stronger epigenetic associations with breastfeeding ever vs. never than with the duration of breastfeeding is also in line with studies providing evidence that any breastfeeding has stronger biological effects than the duration of breastfeeding, e.g., the impact of first maternal milk (colostrum) on immunoglobulins and further neonatal health, especially for small for gestational age and low-birthweight infants [22,24].
We observed associations at a total of eight CpG sites: cg16279140, chromosome 14, intergenic; cg05823759, chr7, intergenic; cg27284194, chromosome 4, intergenic; cg03995300, chromosome 17, ZNF232; cg16387046, chromosome 12, MUCL1; cg11287055, chromosome 21, VPS26C (DSCR3); cg16704958, chromosome 21, VPS26C (DSCR3); and cg26479305, chromosome 12, ATG10 (C12orf44). Methylation levels at these CpGs are potentially influenced by both environmental influences, such as breastfeeding, and by genetic variation, although an alternative interpretation could be that the genomic regions of these CpGs affect breastfeeding function. Unfortunately, no GWAS on breastfeeding is available to verify this suggestion. It remains to be examined whether methylation differences induced by breastfeeding have an effect on the aforementioned traits. Interestingly, associations with breastfeeding have been previously reported in epidemiological studies for bone mineral content and bone mineral density [124] and metabolite profiles [125]; outcomes that have been associated with SNPs in the regions detected in our study as differentially methylated between breastfed and non-breastfed children. It remains to be examined whether methylation differences induced by breastfeeding have an effect on these traits.
Since the role of nutrition is systemic, it has been assumed that biomarkers must be present in different tissues. To study the epigenetic mechanisms of breastfeeding, previous studies have examined DNA from peripheral blood [52,53,54,55,58] and also from tumor tissue [59]. Buccal epithelium is of interest because it offers a non-invasive way of biosample collection for an epigenetic analysis. A number of studies have demonstrated the potential of buccal cells to study DNA methylation [126]. We previously showed that, although there is some correlation between DNA methylation in buccal and blood cells (n = 22, age = 18 years), it is low for most CpGs interrogated by the Illumina 450k array [127]. The methylation levels of two of the CpG sites that were included in the ALSPAC replication study were highly correlated in buccal and blood cells: cg27284194 (r = 0.864) and cg03995300 (r = 0.782). In spite of this, the associations with breastfeeding observed in the NTR were not replicated in the ALSPAC. We observed some overlap with the study of Naumova et al. [53] in peripheral blood that used the EPIC array, and these sites had medium correlations between DNA methylation in buccal and blood cells (cg16387046 r = 0.690, cg11287055 r = 0.413, and cg16704958 r = 0.328).
We observed that breastfeeding-associated CpGs show strong correlations in MZ twins and larger correlations in MZ twins compared to DZ twins. As the large majority of twin pairs in our study were almost always concordant for breastfeeding, it is expected that twins of both types show resemblance for DNA methylation levels at these sites. The larger correlation in MZ compared to DZ twins in our study suggests that these sites are also subject to heritable influences. In line with this observation, some of these CpGs are associated with mQTLs. It should be noted that breastfeeding and lactation itself are heritable traits. In previous twin studies, the heritability of initiation of breastfeeding ranged from 49% [128] to 70% [129]. DNA-methylation profiles may be influenced by several early life factors. In our study, almost all early environmental factors of interest were shared by twins: SES, maternal age at birth, maternal pre-pregnancy BMI, and maternal smoking during pregnancy and gestational age.
Some CpGs that did not reach epigenome-wide significance can have potential for further epigenetic studies of breastfeeding. The CpG cg22491379, located in the PTPN4 on chromosome 2, was discovered in total sample of children of 5–12 years old and, after outlier removal, had suggestive significance (p = 5.78 × 10⁻³). PTPN4 was listed in suggestive regions associated with breast morphology (breast size) [130]. Some top CpGs in the discovery study (non-adjusted model) are associated with genes that are involved in growth and metabolism. The PRLR (prolactin receptor) gene, located on chromosome 5, is involved in prolactin receptor activity and the growth hormone receptor signaling pathway. Growth hormone binds to the prolactin receptor, this being the basis of induction of lactation by growth hormone [131]. The FOXK2 gene, located on chromosome 17, is a member of forkhead box transcription factors and is involved in glucose metabolism, aerobic glycolysis and autophagy [132], thus playing a role in metabolic reprogramming towards aerobic glycolysis [133]. It is associated lean body mass [134] and has been found to be hypomethylated in CpG islands in obese patients’ adipose tissues [135]. We observed a cluster of associations on chromosome 21, each individual association just below epigenome-wide significance. The VPS26C (DSCR3) gene is located on chromosome 21 and, as mentioned earlier, contains two CpGs previously associated with breastfeeding in blood [53].
The strengths of our study include the use of the buccal epithelium methylome to investigate breastfeeding for the first time, sample size, and the availability of replication data, including data from another tissue (blood). Furthermore, our exposure, breastfeeding, was assessed very shortly after it occurred, reducing the risk of measurement error and recall bias. Both the discovery and replication samples have been thoroughly phenotyped and extensively studied. Our study also has limitations. First, the findings in the discovery study were not replicated in the cohort of children with buccal cell DNA methylation of the same age, possibly due to the small size of this cohort (98 monozygotic twins). Second, the discovery sample was included in a study of aggressive behavior, and not primarily examined for the purposes of research on breastfeeding. Third, we did not have longitudinal DNA methylation data to measure the stability of effects; however, we examined the possible attenuation of breastfeeding effects through an age-stratified analysis. Fourth, there are currently no datasets available on gene expression in buccal cells; thus, we could not examine relationships between DNA methylation and transcription. A strength of the current analysis is that it used the Illumina EPIC array, which has much greater coverage than the 450k array. Importantly, some of the top CpGs identified in the discovery EWAS were all novel EPIC probes. The replication analysis in the ALSPAC on DNA methylation data from peripheral blood, however, used the 450k array and therefore did not permit look-up of the same CpGs. The findings of this study require further replication in cohorts with buccal epithelium and other tissues to improve our understanding of breastfeeding-associated methylation changes in different tissues, and the possible utility as a biomarker of early life nutrition. Finally, a difficulty in studies of breastfeeding is that breast milk composition is unique in each mother. Lactation is influenced not only by genetic variation but also by many environmental factors such as the mother’s nutrition, lifestyle, level of stress, and attachment to the child [24,25,136,137,138,139]. Future epigenetic studies of breastfeeding could stratify the breastfeeding sample on the basis of criteria of breast milk composition. This might be more informative for predicting a child’s outcome but might also be a better indicator of a mother’s well-being. The value of our research is that it combined breastfeeding, prenatal characteristics, and methylation data. In the future, results from studies that will integrate epigenomic data with genomics, transcriptomics, and metabolomics may be used to develop prediction models of long-term outcomes in child development and health. Understanding of the mechanisms associated with breastfeeding will help to develop interventions to improve children’s health and reduce risk of chronic disease by supporting breastfeeding or optimizing infant nutrition when breastfeeding is not possible.

5. Conclusions

Our study provided a first indication that breastfeeding as an early life environmental factor may be associated with epigenetic variation in buccal cells in children. The findings point at new candidate loci influenced by breastfeeding. Future studies are needed to investigate if the DNA methylation signatures are caused by breastfeeding or by other unmeasured confounders (including a genetic predisposition to give or receive breastfeeding and other aspects of prenatal or postnatal diet), whether they are influenced by percentage of breastfed meals, exclusive breastfeeding duration, breastmilk composition, etc., and what age-related mechanisms drive changes in the association between breastfeeding and methylation.

Supplementary Materials

The following are available online at https://0-www-mdpi-com.brum.beds.ac.uk/2072-6643/11/11/2804/s1, Table S1: Overview of previous EWAS of breastfeeding in humans, Table S2: EWAS Model Equations, Table S3: Associations of covariates with breastfeeding duration (six categories), Table S4: Discovery study subsample of children <10 years population characteristics, Table S5: Discovery study subsample of children >10 years population characteristics, Table S6: NTR replication sample population characteristics, Table S7: ALSPAC replication sample population characteristics, Table S8: Association of breastfeeding “never”/”ever” with CpG sites in basic Model 1 in total sample: top 100 and genomic annotation, Table S9: Association of breastfeeding duration (six categories) with CpG sites in basic Model 1 in total sample: top 100 and genomic annotation, Table S10: Association of breastfeeding “never”/”ever” with CpG sites in basic Model 1 in sub-sample <10 years: top 100 and genomic annotation, Table S11: Association of breastfeeding duration (six categories) with CpG sites in basic Model 1 in sub-sample <10 years: top 100 and genomic annotation, Table S12: Association of breastfeeding “never”/”ever” with CpG sites in adjusted Model 2 in total sample: top 100 and genomic annotation, Table S13: Association of breastfeeding duration (six categories) with CpG sites in adjusted Model 2 in total sample: top 100 and genomic annotation, Table S14: Association of breastfeeding “never”/”ever” with CpG sites in adjusted Model 2 in sub-sample <10 years: top 100 and genomic annotation, Table S15: Association of breastfeeding duration (six categories) with CpG sites in adjusted Model 2 in sub-sample <10 years: top 100 and genomic annotation, Table S16: Association of breastfeeding “never”/”ever” with CpG sites in adjusted Model 2 in sub-sample >10 years: top 100 and genomic annotation, Table S17: Follow-up of associations of breastfeeding with CpGs from literature in discovery total sample (n = 1006), Table S18: Follow-up of associations of breastfeeding with CpGs from literature in discovery sub-sample < 10 years old (n = 517), Table S19: Association of CpGs associated with breastfeeding in discovery study with mQTLs, Figure S1: QQ plots that shows epigenome-wide association study results of breastfeeding ever/never and breastfeeding duration (six categories) in total sample (n = 1006) and in sub-sample of children < 10 years (n = 517), Figure S2: Methylation level (beta) at significant CpGs in Model 1 in sub-sample of children <10 years (n = 517), Figure S3: Manhattan plot show the epigenome-wide association study results of breastfeeding ‘never’/’ever’ in discovery sample Model 2 (n = 1006), Figure S4: Methylation level (beta) at significant CpG in Model 2 in total sample (n = 1006), Figure S5: Methylation level (beta) at significant CpGs in Model 2 in sub-sample of children <10 years (n = 517) with outliers excluded from further replication, Figure S6: Methylation level (beta) at significant CpGs in Model 2 in sub-sample of children <10 years included in replication study, Figure S7: Methylation level (beta) at significant CpGs in Model 2 in NTR replication study (n = 98).

Author Contributions

Conceptualization, D.I.B., C.R., M.S., J.v.D.; Data curation, F.A.H., C.E.M.v.B. and J.v.D.; formal analysis, V.V.O. and J.v.D.; funding acquisition, D.I.B., M.B.,V.V.O.; investigation, F.A.H., C.E.M.v.B., E.A.E., N.A.K. and G.E.D.; methodology, D.I.B., M.S., J.v.D.; resources, E.A.E., G.E.D. and J.v.D.; software, V.V.O. and J.v.D.; supervision, D.I.B., C.R., M.B. and J.v.D.; visualization, V.V.O; validation, V.V.O., J.v.D., M.S., D.C. and C.R.; writing—original draft, V.V.O., M.S. and J.v.D.; writing—review & editing, F.A.H., C.E.M.v.B., D.C., G.T.S., V.F., D.I.B. and J.v.D.

Funding

V.V.O. is supported by Amsterdam Public Health research institute, and the Russian Foundation for Basic Research (20-015-00496). The Netherlands Twin Register acknowledges funding from multiple grants from the Netherlands Organization for Scientific research (NWO), including NWO-Grant 480-15-001/674: Netherlands Twin Registry Repository; the Biobanking and Biomolecular Resources Research Infrastructure (BBMRI—NL, 184.021.007 and 184.033.111); OCW_Gravity program—NWO-024.001.003 Consortium for Individual Development) and the Avera Institute for Human Genetics, Sioux Falls, South Dakota (USA). The methylation work, J.v.D. and F.H. were supported by funding from the European Union Seventh Framework Program (FP7/2007–2013) under grant agreement no 602768 (ACTION). J.v.D. is supported by the NWO-funded X-omics project (184.034.019) and D.I.B. the KNAW Academy Professor Award (PAH/6635). The UK Medical Research Council and Wellcome (Grant ref: 102215/2/13/2) and the University of Bristol provide core support for ALSPAC. A comprehensive list of grants funding is available on the ALSPAC website (http://www.bristol.ac.uk/alspac/external/documents/grant-acknowledgements.pdf). This research was specifically funded by the BBSRC (grant numbers BBI025751/1 and BB/I025263/1). C.R. and D.C. are funded by the MRC (grant numbers MC_UU_00011/5 and MC_UU_00011/1). This publication is the work of the authors and V.V.O. and J.v.D. will serve as guarantors for the contents of this paper.

Acknowledgments

We are very thankful to all NTR families for their participation in this study, which involved biosample collection and phenotyping. We are grateful to all the families who took part in the ALSPAC study, the midwives for their help in recruiting them, and the whole ALSPAC team, which includes interviewers, computer and laboratory technicians, clerical workers, research scientists, volunteers, managers, receptionists and nurses.

Conflicts of Interest

The authors declare no conflict of interest.

Abbreviations

CpGcytosine-phosphate-guanine
EWASepigenome-wide association study
NTRNetherlands Twin Register
ALSPACAvon Longitudinal Study of Parents and Children
SESsocio-economic status
GAgestational age
BMIbody mass index
GEEgeneralized estimating equations
mQTLmethylation quantitative trait locus
SNPsingle nucleotide polymorphism
MZmonozygotic
DZdizygotic

References

  1. Godfrey, K.M.; Lillycrop, K.A.; Burdge, G.C.; Gluckman, P.D.; Hanson, M.A. Epigenetic Mechanisms and the Mismatch Concept of the Developmental Origins of Health and Disease. Pediatr. Res. 2007, 61, 5R–10R. [Google Scholar] [CrossRef]
  2. Gluckman, P.D.; Hanson, M.A.; Low, F.M. The role of developmental plasticity and epigenetics in human health. Birth Defects Res. Part C Embryo Today Rev. 2011, 93, 12–18. [Google Scholar] [CrossRef]
  3. Verduci, E.; Banderali, G.; Barberi, S.; Radaelli, G.; Lops, A.; Betti, F.; Riva, E.; Giovannini, M. Epigenetic Effects of Human Breast Milk. Nutrients 2014, 6, 1711–1724. [Google Scholar] [CrossRef]
  4. Langley-Evans, S.C. Nutrition in Early Life and the Programming of Adult Disease: A Review. J. Hum. Nutr. Diet. 2015, 28, 1–14. [Google Scholar] [CrossRef]
  5. Hochberg, Z.; Feil, R.; Constancia, M.; Fraga, M.; Junien, C.; Carel, J.-C.; Boileau, P.; Le Bouc, Y.; Deal, C.L.; Lillycrop, K.; et al. Child Health, Developmental Plasticity, and Epigenetic Programming. Endocr. Rev. 2011, 32, 159–224. [Google Scholar] [CrossRef]
  6. Raghuraman, S.; Donkin, I.; Versteyhe, S.; Barrès, R.; Simar, D. The Emerging Role of Epigenetics in Inflammation and Immunometabolism. Trends Endocrinol. Metab. 2016, 27, 782–795. [Google Scholar] [CrossRef] [PubMed]
  7. Paparo, L.; Di Costanzo, M.; Di Scala, C.; Cosenza, L.; Leone, L.; Nocerino, R.; Canani, R.B. The Influence of Early Life Nutrition on Epigenetic Regulatory Mechanisms of the Immune System. Nutrients 2014, 6, 4706–4719. [Google Scholar] [CrossRef] [PubMed]
  8. Canani, R.B.; Di Costanzo, M.; Leone, L.; Bedogni, G.; Brambilla, P.; Cianfarani, S.; Nobili, V.; Pietrobelli, A.; Agostoni, C. Epigenetic mechanisms elicited by nutrition in early life. Nutr. Res. Rev. 2011, 24, 198–205. [Google Scholar] [CrossRef] [PubMed]
  9. Wadhwa, P.D.; Buss, C.; Entringer, S.; Swanson, J.M. Developmental origins of health and disease: Brief history of the approach and current focus on epigenetic mechanisms. Semin. Reprod. Med. 2009, 27, 358–368. [Google Scholar] [CrossRef] [PubMed]
  10. Gluckman, P.D.; Hanson, M.A.; Beedle, A.S. Early Life Events and Their Consequences for Later Disease: A Life History and Evolutionary Perspective. Am. J. Hum. Biol. 2007, 19, 1–19. [Google Scholar] [CrossRef]
  11. Bateson, P.; Barker, D.; Clutton-Brock, T.; Deb, D.; D’Udine, B.; Foley, R.A.; Gluckman, P.; Godfrey, K.; Kirkwood, T.; Lahr, M.M.; et al. Developmental Plasticity and Human Health. Nature 2004, 430, 419–421. [Google Scholar] [CrossRef] [PubMed]
  12. Choi, S.-W.; Friso, S. Epigenetics: A New Bridge between Nutrition and Health. Adv. Nutr. 2010, 1, 8–16. [Google Scholar] [CrossRef] [PubMed]
  13. Peter, C.J.; Fischer, L.K.; Kundakovic, M.; Garg, P.; Jakovcevski, M.; Dincer, A.; Amaral, A.C.; Ginns, E.I.; Galdzicka, M.; Bryce, C.P.; et al. DNA Methylation Signatures of Early Childhood Malnutrition Associated With Impairments in Attention and Cognition. Boil. Psychiatry 2016, 80, 765–774. [Google Scholar] [CrossRef] [PubMed]
  14. Waterland, R.A.; Michels, K.B. Epigenetic Epidemiology of the Developmental Origins Hypothesis. Annu. Rev. Nutr. 2007, 27, 363–388. [Google Scholar] [CrossRef]
  15. Cutfield, W.S.; Hofman, P.L.; Mitchell, M.; Morison, I.M. Could Epigenetics Play a Role in the Developmental Origins of Health and Disease? Pediatr. Res. 2007, 61, 68R–75R. [Google Scholar] [CrossRef]
  16. Tammen, S.A.; Friso, S.; Choi, S.-W. Epigenetics: The Link between Nature and Nurture. Mol. Asp. Med. 2013, 34, 753–764. [Google Scholar] [CrossRef]
  17. Faa, G.; Manchia, M.; Pintus, R.; Gerosa, C.; Marcialis, M.A.; Fanos, V. Fetal programming of neuropsychiatric disorders. Birth Defects Res. Part C Embryo Today Rev. 2016, 108, 207–223. [Google Scholar] [CrossRef]
  18. Heijmans, B.T.; Tobi, E.W.; Stein, A.D.; Putter, H.; Blauw, G.J.; Susser, E.S.; Slagboom, P.E.; Lumey, L.H. Persistent epigenetic differences associated with prenatal exposure to famine in humans. Proc. Natl. Acad. Sci. USA 2008, 105, 17046–17049. [Google Scholar] [CrossRef]
  19. Tobi, E.W.; Goeman, J.J.; Monajemi, R.; Gu, H.; Putter, H.; Zhang, Y.; Slieker, R.C.; Stok, A.P.; Thijssen, P.E.; Müller, F.; et al. DNA methylation signatures link prenatal famine exposure to growth and metabolism. Nat. Commun. 2014, 5, 5592. [Google Scholar] [CrossRef]
  20. Barker, D.J. The fetal and infant origins of adult disease. BMJ 1990, 301, 1111. [Google Scholar] [CrossRef]
  21. Ruiz, L.; García-Carral, C.; Rodriguez, J.M. Unfolding the Human Milk Microbiome Landscape in the Omics Era. Front. Microbiol. 2019, 10, 1378. [Google Scholar] [CrossRef] [PubMed]
  22. Fanos, V.; Reali, A.; Marcialis, M.A.; Bardanzellu, F. What You Have to Know about Human Milk Oligosaccharides. J. Pediatr. Neonatal Individ. Med. 2018, 7, e070137. [Google Scholar]
  23. Hassiotou, F.; Beltran, A.; Chetwynd, E.; Stuebe, A.M.; Twigger, A.-J.; Metzger, P.; Trengove, N.; Lai, C.T.; Filgueira, L.; Blancafort, P.; et al. Breastmilk Is a Novel Source of Stem Cells with Multilineage Differentiation Potential. Stem Cells 2012, 30, 2164–2174. [Google Scholar] [CrossRef] [PubMed]
  24. Bardanzellu, F.; Fanos, V.; Reali, A. “Omics” in Human Colostrum and Mature Milk: Looking to Old Data with New Eyes. Nutrients 2017, 9, 843. [Google Scholar] [CrossRef] [PubMed]
  25. Dessì, A.; Briana, D.; Corbu, S.; Gavrili, S.; Marincola, F.C.; Georgantzi, S.; Pintus, R.; Fanos, V.; Malamitsi-Puchner, A. Metabolomics of Breast Milk: The Importance of Phenotypes. Metabolites 2018, 8, 79. [Google Scholar] [CrossRef]
  26. Forsum, E.; Lonnerdal, B. Variation in the contents of nutrients of breast milk during one feeding. Nutrients Rep. Int. 1979, 19, 815–820. [Google Scholar]
  27. Victora, C.G.; Bahl, R.; Barros, A.J.D.; França, G.V.A.; Horton, S.; Krasevec, J.; Murch, S.; Sankar, M.J.; Walker, N.; Rollins, N.C.; et al. Breastfeeding in the 21st Century: Epidemiology, Mechanisms, and Lifelong Effect. Lancet 2016, 387, 475–490. [Google Scholar] [CrossRef]
  28. McInerny, T.K. Breastfeeding, Early Brain Development, and Epigenetics—Getting Children off to Their Best Start. Breastfeed. Med. 2014, 9, 333–334. [Google Scholar] [CrossRef]
  29. Ip, S.; Chung, M.; Raman, G.; Chew, P.; Magula, N.; Devine, D.; Trikalinos, T.; Lau, J. Breastfeeding and maternal and infant health outcomes in developed countries. Évid. Rep. Assess. 2007, 153, 1–186. [Google Scholar]
  30. Wisnieski, L.; Kerver, J.; Holzman, C.; Todem, D.; Margerison-Zilko, C. Breastfeeding and Risk of Metabolic Syndrome in Children and Adolescents: A Systematic Review. J. Hum. Lact. 2018, 34, 515–525. [Google Scholar] [CrossRef]
  31. Chirico, G.; Marzollo, R.; Cortinovis, S.; Fonte, C.; Gasparoni, A. Antiinfective Properties of Human Milk. J. Nutr. 2008, 138, 1801S–1806S. [Google Scholar] [CrossRef] [PubMed]
  32. Martin, C.R.; Ling, P.-R.; Blackburn, G.L. Review of Infant Feeding: Key Features of Breast Milk and Infant Formula. Nutrients 2016, 8, 279. [Google Scholar] [CrossRef] [PubMed]
  33. Else-Quest, N.M.; Hyde, J.S.; Clark, R. Breastfeeding, Bonding, and the Mother-Infant Relationship. Merrill-Palmer Quarterly; Wayne State University Press: Detroit, MI, USA, 2003; pp. 495–517. [Google Scholar] [CrossRef]
  34. WHO. Protecting, Promoting, and Supporting Breastfeeding in Facilities Providing Maternity and Newborn Services: The Revised Baby-Friendly Hospital Initiative 2018; WHO: Geneva, Switzerland, 2019. [Google Scholar]
  35. Michaelsen, K.F.; Lauritzen, L.; Mortensen, E.L. Effects of Breast-Feeding on Cognitive Function. In Breast-Feeding: Early Influences on Later Health; Springer: Dordrecht, The Netherlands, 2009; Volume 639, pp. 199–215. [Google Scholar] [CrossRef]
  36. Kramer, M.S.; Aboud, F.; Mironova, E.; Vanilovich, I.; Platt, R.W.; Matush, L.; Igumnov, S.; Fombonne, E.; Bogdanovich, N.; Ducruet, T.; et al. Breastfeeding and child cognitive development: New evidence from a large randomized trial. Arch. Gen. Psychiatry 2008, 65, 578–584. [Google Scholar] [CrossRef] [PubMed]
  37. Horta, B.L.; De Mola, C.L.; Victora, C.G. Breastfeeding and intelligence: A systematic review and meta-analysis. Acta Paediatr. 2015, 104, 14–19. [Google Scholar] [CrossRef]
  38. Blesa, M.; Sullivan, G.; Anblagan, D.; Telford, E.J.; Quigley, A.J.; Sparrow, S.A.; Serag, A.; Semple, S.I.; Bastin, M.E.; Boardman, J.P. Early breast milk exposure modifies brain connectivity in preterm infants. NeuroImage 2019, 184, 431–439. [Google Scholar] [CrossRef]
  39. Bartels, M.; Van Beijsterveldt, C.E.M.; Boomsma, D.I. Breastfeeding, Maternal Education and Cognitive Function: A Prospective Study in Twins. Behav. Genet. 2009, 39, 616–622. [Google Scholar] [CrossRef] [Green Version]
  40. Harder, T.; Bergmann, R.; Kallischnigg, G.; Plagemann, A. Duration of Breastfeeding and Risk of Overweight: A Meta-Analysis. Am. J. Epidemiol. 2005, 162, 397–403. [Google Scholar] [CrossRef] [Green Version]
  41. Burke, V.; Beilin, L.J.; Simmer, K.; Oddy, W.H.; Blake, K.V.; Doherty, D.; Kendall, G.E.; Newnham, J.P.; Landau, L.I.; Stanley, F.J. Breastfeeding and Overweight: Longitudinal Analysis in an Australian Birth Cohort. J. Pediatr. 2005, 147, 56–61. [Google Scholar] [CrossRef]
  42. Gillman, M.W.; Rifas-Shiman, S.L.; Camargo, J.C.A.; Berkey, C.S.; Frazier, A.L.; Rockett, H.R.H.; Field, A.E.; Colditz, G.A. Risk of Overweight Among Adolescents Who Were Breastfed as Infants. JAMA 2001, 285, 2461. [Google Scholar] [CrossRef] [Green Version]
  43. Owen, C.G.; Whincup, P.H.; Odoki, K.; Gilg, J.A.; Cook, D.G. Infant feeding and blood cholesterol: A study in adolescents and a systematic review. Pediatrics 2002, 110, 597–608. [Google Scholar] [CrossRef]
  44. Shoji, H.; Shimizu, T. Effect of Human Breast Milk on Biological Metabolism in Infants. Pediatr. Int. 2019, 61, 6–15. [Google Scholar] [CrossRef] [PubMed] [Green Version]
  45. Klement, E.; Cohen, R.V.; Boxman, J.; Joseph, A.; Reif, S. Breastfeeding and risk of inflammatory bowel disease: A systematic review with meta-analysis. Am. J. Clin. Nutr. 2004, 80, 1342–1352. [Google Scholar] [CrossRef] [PubMed] [Green Version]
  46. Amitay, E.L.; Keinan-Boker, L. Breastfeeding and childhood leukemia incidence: A meta-analysis and systematic review. JAMA Pediatr. 2015, 169, e151025. [Google Scholar] [CrossRef] [PubMed] [Green Version]
  47. Horta, B.L.; Victora, C.G.; World Health Organization. Short-Term Effects of Breastfeeding: A Systematic Review on the Benefits of Breastfeeding on Diarrhoea and Pneumonia Mortality; World Health Organization: Geneva, Switzerland, 2013. [Google Scholar]
  48. Horta, B.L.; De Mola, C.L.; Victora, C.G. Long-term consequences of breastfeeding on cholesterol, obesity, systolic blood pressure and type 2 diabetes: A systematic review and meta-analysis. Acta Paediatr. 2015, 104, 30–37. [Google Scholar] [CrossRef]
  49. Lodge, C.; Tan, D.; Lau, M.; Dai, X.; Tham, R.; Lowe, A.; Bowatte, G.; Allen, K.; Dharmage, S.; Lodge, C. Breastfeeding and asthma and allergies: A systematic review and meta-analysis. Acta Paediatr. 2015, 104, 38–53. [Google Scholar] [CrossRef]
  50. Fall, C.H.; Borja, J.B.; Osmond, C.; Richter, L.; Bhargava, S.K.; Martorell, R.; Stein, A.D.; Barros, F.C.; Victora, C.G.; COHORTS group. Infant-Feeding Patterns and Cardiovascular Risk Factors in Young Adulthood: Data from Five Cohorts in Low- and Middle-Income Countries. Int. J. Epidemiol. 2011, 40, 47–62. [Google Scholar] [CrossRef] [Green Version]
  51. Hartwig, F.P.; Loret de Mola, C.; Davies, N.M.; Victora, C.G.; Relton, C.L. Breastfeeding Effects on DNA Methylation in the Offspring: A Systematic Literature Review. PLoS ONE 2017, 12, e0173070. [Google Scholar]
  52. Obermann-Borst, S.A.; Eilers, P.H.; Tobi, E.W.; De Jong, F.H.; Slagboom, P.E.; Heijmans, B.T.; Steegers-Theunissen, R.P.; Slagboom, P. Duration of breastfeeding and gender are associated with methylation of the LEPTIN gene in very young children. Pediatr. Res. 2013, 74, 344–349. [Google Scholar] [CrossRef] [Green Version]
  53. Naumova, O.Y.; Odintsova, V.V.; Arincina, I.A.; Rychkov, S.Y.; Muhamedrahimov, R.J.; Shneider, Y.V.; Grosheva, A.N.; Zhukova, O.V.; Grigorenko, E.L. A Study of the Association between Breastfeeding and DNA Methylation in Peripheral Blood Cells of Infants. Russ. J. Genet. 2019, 55, 749–755. [Google Scholar] [CrossRef]
  54. Rossnerova, A.; Tulupova, E.; Tabashidze, N.; Schmuczerova, J.; Dostal, M.; Jr, P.R.; Gmuender, H.; Sram, R.J. Factors affecting the 27K DNA methylation pattern in asthmatic and healthy children from locations with various environments. Mutat. Res. Mol. Mech. Mutagen. 2013, 741, 18–26. [Google Scholar] [CrossRef]
  55. Sherwood, W.B.; Bion, V.; Lockett, G.A.; Ziyab, A.H.; Soto-Ramírez, N.; Mukherjee, N.; Kurukulaaratchy, R.J.; Ewart, S.; Zhang, H.; Arshad, S.H.; et al. Duration of breastfeeding is associated with leptin (LEP) DNA methylation profiles and BMI in 10-year-old children. Clin. Epigenet. 2019, 11, 128. [Google Scholar] [CrossRef] [PubMed]
  56. Joubert, B.R.; Felix, J.F.; Yousefi, P.; Bakulski, K.M.; Just, A.C.; Breton, C.; Reese, S.E.; Markunas, C.A.; Richmond, R.C.; Xu, C.-J.; et al. DNA Methylation in Newborns and Maternal Smoking in Pregnancy: Genome-wide Consortium Meta-analysis. Am. J. Hum. Genet. 2016, 98, 680–696. [Google Scholar] [CrossRef] [PubMed] [Green Version]
  57. Küpers, L.K.; Monnereau, C.; Sharp, G.C.; Yousefi, P.; Salas, L.A.; Ghantous, A.; Page, C.M.; Reese, S.E.; Wilcox, A.J.; Czamara, D.; et al. Meta-analysis of epigenome-wide association studies in neonates reveals widespread differential DNA methylation associated with birthweight. Nat. Commun. 2019, 10, 1893. [Google Scholar] [CrossRef] [PubMed] [Green Version]
  58. Soto-Ramírez, N.; Arshad, S.H.; Holloway, J.W.; Zhang, H.; Schauberger, E.; Ewart, S.; Patil, V.; Karmaus, W. The interaction of genetic variants and DNA methylation of the interleukin-4 receptor gene increase the risk of asthma at age 18 years. Clin. Epigenet. 2013, 5, 1. [Google Scholar] [CrossRef] [Green Version]
  59. Tao, M.-H.; Marian, C.; Shields, P.G.; Potischman, N.; Nie, J.; Krishnan, S.S.; Berry, D.L.; Kallakury, B.V.; Ambrosone, C.; Edge, S.B.; et al. Exposures in early life: Associations with DNA promoter methylation in breast tumors. J. Dev. Orig. Health Dis. 2013, 4, 182–190. [Google Scholar] [CrossRef] [Green Version]
  60. Hartwig, F.P.; Smith, G.D.; Simpkin, A.J.; Victora, C.G.; Relton, C.L.; Caramaschi, D. Association between Breastfeeding and DNA Methylation over the Life Course: Findings from the Avon Longitudinal Study of Parents and Children (ALSPAC). bioRxiv 2019, 800722. [Google Scholar] [CrossRef] [Green Version]
  61. Smith, A.K.; Kilaru, V.; Klengel, T.; Mercer, K.B.; Bradley, B.; Conneely, K.N.; Ressler, K.J.; Binder, E.B. DNA Extracted from Saliva for Methylation Studies of Psychiatric Traits: Evidence Tissue Specificity and Relatedness to Brain. Am. J. Med. Genet. Part B Neuropsychiatr. Genet. 2015, 168, 36–44. [Google Scholar] [CrossRef] [Green Version]
  62. Papavassiliou, P.; York, T.P.; Gursoy, N.; Hill, G.; Nicely, L.V.; Sundaram, U.; McClain, A.; Aggen, S.H.; Eaves, L.; Riley, B.; et al. The phenotype of persons having mosaicism for trisomy 21/Down syndrome reflects the percentage of trisomic cells present in different tissues. Am. J. Med. Genet. Part A 2009, 149, 573–583. [Google Scholar] [CrossRef] [Green Version]
  63. Van Dongen, J.; Ehli, E.A.; Jansen, R.; Van Beijsterveldt, C.E.M.; Willemsen, G.; Hottenga, J.J.; Kallsen, N.A.; Peyton, S.A.; Breeze, C.E.; Kluft, C.; et al. Genome-wide analysis of DNA methylation in buccal cells: A study of monozygotic twins and mQTLs. Epigenet. Chromatin 2018, 11, 54. [Google Scholar] [CrossRef]
  64. Van Beijsterveldt, C.E.M.; Groen-Blokhuis, M.; Hottenga, J.J.; Franić, S.; Hudziak, J.J.; Lamb, D.; Huppertz, C.; de Zeeuw, E.; Nivard, M.; Schutte, N.; et al. The Young Netherlands Twin Register (YNTR): Longitudinal Twin and Family Studies in Over 70,000 Children. Twin Res. Hum. Genet. 2013, 16, 252–267. [Google Scholar] [CrossRef] [Green Version]
  65. Boomsma, D.I.; Fanos Cagliari, V.; Mussap Genoa, M.; Del Vecchio Bari, A.; Sun Shanghai, B.; Faa Cagliari, G.; Giordano Philadelphia, A. Aggression in Children: Unravelling the Interplay of Genes and Environment through (Epi)Genetics and Metabolomics. J. Pediatr. Neonatal Individ. Med. 2015, 4. [Google Scholar] [CrossRef]
  66. Bartels, M.; Hendriks, A.; Mauri, M.; Krapohl, E.; Whipp, A.; Bolhuis, K.; Conde, L.C.; Luningham, J.; Ip, H.F.; Hagenbeek, F.; et al. Childhood aggression and the co-occurrence of behavioural and emotional problems: Results across ages 3-16 years from multiple raters in six cohorts in the EU-ACTION project. Eur. Child Adolesc. Psychiatry 2018, 27, 1105–1121. [Google Scholar] [CrossRef] [PubMed] [Green Version]
  67. Hagenbeek, F.A.; Roetman, P.J.; Pool, R.; Kluft, C.; Harms, A.C.; van Dongen, J.; Colins, O.F.; Talens, S.; Van Beijsterveldt, C.E.M.; de Zeeuw, E.L.; et al. Urinary Amine and Organic Acid Metabolites Evaluated as Markers for Childhood Aggression: The ACTION Biomarker Study. Frontiers in Psychiatry 2019, submitted. [Google Scholar]
  68. Van Dongen, J. Epigenome-Wide Association Study Meta-Analysis of Aggressive Behavior. In Proceedings of the ECS Workshop on Aggression, Nijmegen, The Netherlands, 31 October 2016. [Google Scholar]
  69. Boyd, A.; Golding, J.; Macleod, J.; Lawlor, D.A.; Fraser, A.; Henderson, J.; Molloy, L.; Ness, A.; Ring, S.; Davey Smith, G. Cohort Profile: The ‘Children of the 90s’—The Index Offspring of the Avon Longitudinal Study of Parents and Children. Int. J. Epidemiol. 2013, 42, 111–127. [Google Scholar] [CrossRef] [Green Version]
  70. Fraser, A.; Macdonald-Wallis, C.; Tilling, K.; Boyd, A.; Golding, J.; Davey Smith, G.; Henderson, J.; Macleod, J.; Molloy, L.; Ness, A.; et al. Cohort Profile: The Avon Longitudinal Study of Parents and Children: ALSPAC Mothers Cohort. Int. J. Epidemiol. 2013, 42, 97–110. [Google Scholar] [CrossRef] [Green Version]
  71. Relton, C.L.; Gaunt, T.; McArdle, W.; Ho, K.; Duggirala, A.; Shihab, H.; Woodward, G.; Lyttleton, O.; Evans, D.M.; Reik, W.; et al. Data Resource Profile: Accessible Resource for Integrated Epigenomic Studies (ARIES). Int. J. Epidemiol. 2015, 44, 1181–1190. [Google Scholar] [CrossRef] [Green Version]
  72. CBS. Standard Classification of Occupations; Central Bureau of Statistics: Heerlen/Voorburg, The Netherlands, 2001.
  73. Erikson, R.; Goldthorpe, J.H.; Portocarero, L. Intergenerational class mobility and the convergence thesis: England, France and Sweden. Br. J. Sociol. 2010, 61, 185–219. [Google Scholar] [CrossRef]
  74. Dolan, C.V.; Geels, L.; Vink, J.M.; van Beijsterveldt, C.E.M.; Neale, M.C.; Bartels, M.; Boomsma, D.I. Testing Causal Effects of Maternal Smoking during Pregnancy on Offspring’s Externalizing and Internalizing Behavior. Behav. Genet. 2016, 46, 378–388. [Google Scholar] [CrossRef] [Green Version]
  75. Van Beijsterveldt, C.E.M.T.; Hoekstra, C.; Schats, R.; Montgomery, G.W.; Willemsen, G.; Boomsma, D.I. Mode of Conception of Twin Pregnancies: Willingness to Reply to Survey Items and Comparison of Survey Data to Hospital Records. Twin Res. Hum. Genet. 2008, 11, 349–351. [Google Scholar] [CrossRef]
  76. Odintsova, V.V.; Dolan, C.V.; Van Beijsterveldt, C.E.M.; De Zeeuw, E.L.; Van Dongen, J.; Boomsma, D.I. Pre- and Perinatal Characteristics Associated with Apgar Scores in a Review and in a New Study of Dutch Twins. Twin Res. Hum. Genet. 2019, 22, 164–176. [Google Scholar] [CrossRef] [Green Version]
  77. Meulenbelt, I.; Droog, S.; Trommelen, G.J.; Boomsma, D.I.; Slagboom, P.E. High-yield noninvasive human genomic DNA isolation method for genetic studies in geographically dispersed families and populations. Am. J. Hum. Genet. 1995, 57, 1252–1254. [Google Scholar] [PubMed]
  78. Moran, S.; Arribas, C.; Esteller, M. Validation of a DNA methylation microarray for 850,000 CpG sites of the human genome enriched in enhancer sequences. Epigenomics 2016, 8, 389–399. [Google Scholar] [CrossRef] [PubMed] [Green Version]
  79. Sinke, L.; van Iterson, M.; Cats, D.; Slieker, R.; Heijmans, B. DNAmArray: Streamlined Workflow for the Quality Control, Normalization, and Analysis of Illumina Methylation Array Data. Zenodo 2019. [Google Scholar] [CrossRef]
  80. Van Iterson, M.; Tobi, E.W.; Slieker, R.C.; Hollander, W.D.; Luijk, R.; Slagboom, P.; Heijmans, B.T. MethylAid: Visual and interactive quality control of large Illumina 450k datasets. Bioinformatics 2014, 30, 3435–3437. [Google Scholar] [CrossRef]
  81. Van Iterson, M.; Cats, D.; Hop, P.; Heijmans, B.T.; BIOS Consortium. omicsPrint: Detection of data linkage errors in multiple omics studies. Bioinformatics 2018, 34, 2142–2143. [Google Scholar] [CrossRef] [Green Version]
  82. Min, J.L.; Hemani, G.; Smith, G.D.; Relton, C.; Suderman, M. Meffil: Efficient normalization and analysis of very large DNA methylation datasets. Bioinformatics 2018, 34, 3983–3989. [Google Scholar] [CrossRef] [Green Version]
  83. Pidsley, R.; Zotenko, E.; Peters, T.J.; Lawrence, M.G.; Risbridger, G.P.; Molloy, P.; Van Djik, S.; Muhlhausler, B.; Stirzaker, C.; Clark, S.J. Critical evaluation of the Illumina MethylationEPIC BeadChip microarray for whole-genome DNA methylation profiling. Genome Boil. 2016, 17, 208. [Google Scholar] [CrossRef] [Green Version]
  84. Zheng, S.C.; Webster, A.P.; Dong, D.; Feber, A.; Graham, D.G.; Sullivan, R.; Jevons, S.; Lovat, L.B.; Beck, S.; Widschwendter, M.; et al. A novel cell-type deconvolution algorithm reveals substantial contamination by immune cells in saliva, buccal and cervix. Epigenomics 2018, 10, 925–940. [Google Scholar] [CrossRef]
  85. Houseman, E.A.; Accomando, W.P.; Koestler, D.C.; Christensen, B.C.; Marsit, C.J.; Nelson, H.H.; Wiencke, J.K.; Kelsey, K.T. DNA methylation arrays as surrogate measures of cell mixture distribution. BMC Bioinform. 2012, 13, 86. [Google Scholar] [CrossRef] [Green Version]
  86. Van Iterson, M.; Van Zwet, E.W.; BIOS Consortium; Heijmans, B.T. Controlling bias and inflation in epigenome- and transcriptome-wide association studies using the empirical null distribution. Genome Boil. 2017, 18, 19. [Google Scholar] [CrossRef] [Green Version]
  87. Tukey, J.W. Exploratory Data Analysis. Biom. J. 1981, 23, 413–414. [Google Scholar]
  88. Leek, J.T.; Storey, J.D. Capturing Heterogeneity in Gene Expression Studies by Surrogate Variable Analysis. PLoS Genet. 2007, 3, e161. [Google Scholar] [CrossRef] [PubMed] [Green Version]
  89. Ritchie, M.E.; Phipson, B.; Wu, D.; Hu, Y.; Law, C.W.; Shi, W.; Smyth, G.K. limma powers differential expression analyses for RNA-sequencing and microarray studies. Nucleic Acids Res. 2015, 43, e47. [Google Scholar] [CrossRef] [PubMed]
  90. Li, M.; Zou, D.; Li, Z.; Gao, R.; Sang, J.; Zhang, Y.; Li, R.; Xia, L.; Zhang, T.; Niu, G.; et al. EWAS Atlas: A Curated Knowledgebase of Epigenome-Wide Association Studies. Nucleic Acids Res. 2019, 47, D983–D988. [Google Scholar] [CrossRef]
  91. Yousefi, P.; Huen, K.; Davé, V.; Barcellos, L.; Eskenazi, B.; Holland, N. Sex differences in DNA methylation assessed by 450 K BeadChip in newborns. BMC Genom. 2015, 16, 911. [Google Scholar] [CrossRef] [Green Version]
  92. Husquin, L.T.; Rotival, M.; Fagny, M.; Quach, H.; Zidane, N.; McEwen, L.M.; MacIsaac, J.L.; Kobor, M.S.; Aschard, H.; Patin, E.; et al. Exploring the genetic basis of human population differences in DNA methylation and their causal impact on immune gene regulation. Genome Boil. 2018, 19, 222. [Google Scholar] [CrossRef] [Green Version]
  93. Marioni, R.E.; Harris, S.E.; Zhang, Q.; McRae, A.F.; Hagenaars, S.P.; Hill, W.D.; Davies, G.; Ritchie, C.W.; Gale, C.R.; Starr, J.M.; et al. GWAS on family history of Alzheimer’s disease. Transl. Psychiatry 2018, 8, 99. [Google Scholar] [CrossRef] [Green Version]
  94. Xue, J.; Gharaibeh, R.Z.; Pietryk, E.W.; Brouwer, C.; Tarantino, L.M.; Valdar, W.; Ideraabdullah, F.Y. Impact of vitamin D depletion during development on mouse sperm DNA methylation. Epigenetics 2018, 13, 959–974. [Google Scholar] [CrossRef] [Green Version]
  95. Sujit, K.M.; Sarkar, S.; Singh, V.; Pandey, R.; Agrawal, N.K.; Trivedi, S.; Singh, K.; Gupta, G.; Rajender, S. Genome-wide differential methylation analyses identifies methylation signatures of male infertility. Hum. Reprod. 2018, 33, 2256–2267. [Google Scholar] [CrossRef]
  96. Kim, S.K. Identification of 613 new loci associated with heel bone mineral density and a polygenic risk score for bone mineral density, osteoporosis and fracture. PLoS ONE 2018, 13, e0200785. [Google Scholar] [CrossRef] [Green Version]
  97. Morris, J.A.; Kemp, J.P.; Youlten, S.E.; Laurent, L.; Logan, J.G.; Chai, R.C.; Vulpescu, N.A.; Forgetta, V.; Kleinman, A.; Mohanty, S.T.; et al. An Atlas of Genetic Influences on Osteoporosis in Humans and Mice. Nat. Genet. 2019, 51, 258–266. [Google Scholar] [CrossRef] [PubMed]
  98. Kemp, J.P.; Morris, J.A.; Medina-Gomez, C.; Forgetta, V.; Warrington, N.M.; Youlten, S.E.; Zheng, J.; Gregson, C.L.; Grundberg, E.; Trajanoska, K.; et al. Identification of 153 new loci associated with heel bone mineral density and functional involvement of GPC6 in osteoporosis. Nat. Genet. 2017, 49, 1468–1475. [Google Scholar] [CrossRef] [PubMed] [Green Version]
  99. Estrada, K.; Styrkarsdottir, U.; Evangelou, E.; Hsu, Y.-H.; Duncan, E.L.; Ntzani, E.E.; Oei, L.; Albagha, O.M.E.; Amin, N.; Kemp, J.P.; et al. Genome-wide meta-analysis identifies 56 bone mineral density loci and reveals 14 loci associated with risk of fracture. Nat. Genet. 2012, 44, 491–501. [Google Scholar] [CrossRef] [PubMed] [Green Version]
  100. Medina-Gómez, C.; Kemp, J.P.; Trajanoska, K.; Luan, J.; Chesi, A.; Ahluwalia, T.S.; Mook-Kanamori, D.O.; Ham, A.; Hartwig, F.P.; Evans, D.S.; et al. Life-Course Genome-wide Association Study Meta-analysis of Total Body BMD and Assessment of Age-Specific Effects. Am. J. Hum. Genet. 2018, 102, 88–102. [Google Scholar] [CrossRef] [PubMed]
  101. Emilsson, V.; Ilkov, M.; Lamb, J.R.; Finkel, N.; Gudmundsson, E.F.; Pitts, R.; Hoover, H.; Gudmundsdottir, V.; Horman, S.R.; Aspelund, T.; et al. Co-regulatory networks of human serum proteins link genetics to disease. Science 2018, 361, 769–773. [Google Scholar] [CrossRef] [PubMed] [Green Version]
  102. Sun, B.B.; Maranville, J.C.; Peters, J.E.; Stacey, D.; Staley, J.R.; Blackshaw, J.; Burgess, S.; Jiang, T.; Paige, E.; Surendran, P.; et al. Genomic atlas of the human plasma proteome. Nature 2018, 558, 73–79. [Google Scholar] [CrossRef] [PubMed]
  103. De Vries, P.S.; Brown, M.R.; Bentley, A.R.; Sung, Y.J.; Winkler, T.W.; Ntalla, I.; Schwander, K.; Kraja, A.T.; Guo, X.; Franceschini, N.; et al. Multiancestry Genome-Wide Association Study of Lipid Levels Incorporating Gene-Alcohol Interactions. Am. J. Epidemiol. 2019, 188, 1033–1054. [Google Scholar] [CrossRef] [Green Version]
  104. Imaizumi, A.; Adachi, Y.; Kawaguchi, T.; Higasa, K.; Tabara, Y.; Sonomura, K.; Sato, T.-A.; Takahashi, M.; Mizukoshi, T.; Yoshida, H.-O.; et al. Genetic basis for plasma amino acid concentrations based on absolute quantification: A genome-wide association study in the Japanese population. Eur. J. Hum. Genet. 2019, 27, 621–630. [Google Scholar] [CrossRef]
  105. Shin, S.-Y.; The Multiple Tissue Human Expression Resource (MuTHER) Consortium; Fauman, E.B.; Petersen, A.-K.; Krumsiek, J.; Santos, R.; Huang, J.; Arnold, M.; Erte, I.; Forgetta, V.; et al. An atlas of genetic influences on human blood metabolites. Nat. Genet. 2014, 46, 543–550. [Google Scholar] [CrossRef] [Green Version]
  106. Johnston, K.J.A.; Adams, M.J.; Nicholl, B.I.; Ward, J.; Strawbridge, R.J.; Ferguson, A.; McIntosh, A.M.; Bailey, M.E.S.; Smith, D.J. Genome-wide association study of multisite chronic pain in UK Biobank. PLoS Genet. 2019, 15, e1008164. [Google Scholar] [CrossRef] [Green Version]
  107. Li, Y.; Sekula, P.; Wuttke, M.; Wahrheit, J.; Hausknecht, B.; Schultheiss, U.T.; Gronwald, W.; Schlosser, P.; Tucci, S.; Ekici, A.B.; et al. Genome-Wide Association Studies of Metabolites in Patients with CKD Identify Multiple Loci and Illuminate Tubular Transport Mechanisms. J. Am. Soc. Nephrol. 2018, 29, 1513–1524. [Google Scholar] [CrossRef] [PubMed]
  108. Wellcome Trust Case Control Consortium. Genome-Wide Association Study of 14,000 Cases of Seven Common Diseases and 3000 Shared Controls. Nature 2007, 447, 661–678. [Google Scholar] [CrossRef] [PubMed] [Green Version]
  109. Liu, M.; Jiang, Y.; Wedow, R.; Li, Y.; Brazel, D.M.; Chen, F.; Datta, G.; Davila-Velderrain, J.; McGuire, D.; Tian, C.; et al. Association studies of up to 1.2 million individuals yield new insights into the genetic etiology of tobacco and alcohol use. Nat. Genet. 2019, 51, 237–244. [Google Scholar] [CrossRef] [PubMed]
  110. Linnér, R.K.; Biroli, P.; Kong, E.; Meddens, S.F.W.; Wedow, R.; Fontana, M.A.; Lebreton, M.; Tino, S.P.; Abdellaoui, A.; Hammerschlag, A.R.; et al. Genome-wide association analyses of risk tolerance and risky behaviors in over 1 million individuals identify hundreds of loci and shared genetic influences. Nat. Genet. 2019, 51, 245–257. [Google Scholar] [CrossRef]
  111. Hosokawa, N.; Sasaki, T.; Iemura, S.; Natsume, T.; Hara, T.; Mizushima, N. Atg101, a Novel Mammalian Autophagy Protein Interacting with Atg13. Autophagy 2009, 5, 973–979. [Google Scholar] [CrossRef] [Green Version]
  112. Ahola-Olli, A.V.; Würtz, P.; Havulinna, A.S.; Aalto, K.; Pitkänen, N.; Lehtimäki, T.; Kähönen, M.; Lyytikäinen, L.-P.; Raitoharju, E.; Seppälä, I.; et al. Genome-Wide Association Study Identifies 27 Loci Influencing Concentrations of Circulating Cytokines and Growth Factors. Am. J. Hum. Genet. 2017, 100, 40–50. [Google Scholar] [CrossRef] [Green Version]
  113. Astle, W.J.; Elding, H.; Jiang, T.; Allen, D.; Ruklisa, D.; Mann, A.L.; Mead, D.; Bouman, H.; Riveros-McKay, F.; Kostadima, M.A.; et al. The Allelic Landscape of Human Blood Cell Trait Variation and Links to Common Complex Disease. Cell 2016, 167, 1415–1429. [Google Scholar] [CrossRef] [Green Version]
  114. Rojas, D.; Rager, J.E.; Smeester, L.; Bailey, K.A.; Drobná, Z.; Rubio-Andrade, M.; Stýblo, M.; García-Vargas, G.; Fry, R.C. Prenatal Arsenic Exposure and the Epigenome: Identifying Sites of 5-Methylcytosine Alterations That Predict Functional Changes in Gene Expression in Newborn Cord Blood and Subsequent Birth Outcomes. Toxicol. Sci. 2015, 143, 97–106. [Google Scholar] [CrossRef]
  115. McNally, K.E.; Faulkner, R.; Steinberg, F.; Gallon, M.; Ghai, R.; Pim, D.; Langton, P.; Pearson, N.; Danson, C.M.; Nägele, H.; et al. Retriever is a multiprotein complex for retromer-independent endosomal cargo recycling. Nature 2017, 19, 1214–1225. [Google Scholar] [CrossRef]
  116. Johansson, Å.; Enroth, S.; Gyllensten, U. Continuous Aging of the Human DNA Methylome Throughout the Human Lifespan. PLoS ONE 2013, 8, e67378. [Google Scholar] [CrossRef] [Green Version]
  117. Gervin, K.; Andreassen, B.K.; Hjorthaug, H.S.; Carlsen, K.C.L.; Carlsen, K.-H.; Undlien, D.E.; Lyle, R.; Munthe-Kaas, M.C. Intra-individual changes in DNA methylation not mediated by cell-type composition are correlated with aging during childhood. Clin. Epigenet. 2016, 8, 110. [Google Scholar] [CrossRef] [PubMed] [Green Version]
  118. Dunn, E.C.; Soare, T.W.; Simpkin, A.J.; Suderman, M.J.; Zhu, Y.; Klengel, T.; Smith, A.D.A.C.; Ressler, K.; Relton, C.L. Sensitive Periods for the Effect of Childhood Adversity on DNA Methylation: Results from a Prospective, Longitudinal Study. bioRxiv 2018. [Google Scholar] [CrossRef] [PubMed] [Green Version]
  119. Simpkin, A.J.; Suderman, M.; Gaunt, T.R.; Lyttleton, O.; McArdle, W.L.; Ring, S.M.; Tilling, K.; Smith, G.D.; Relton, C.L. Longitudinal analysis of DNA methylation associated with birth weight and gestational age. Hum. Mol. Genet. 2015, 24, 3752–3763. [Google Scholar] [CrossRef] [PubMed] [Green Version]
  120. Agha, G.; Hajj, H.; Rifas-Shiman, S.L.; Just, A.C.; Hivert, M.-F.; Burris, H.H.; Lin, X.; Litonjua, A.A.; Oken, E.; DeMeo, D.L.; et al. Birth weight-for-gestational age is associated with DNA methylation at birth and in childhood. Clin. Epigenet. 2016, 8, 118. [Google Scholar] [CrossRef] [PubMed] [Green Version]
  121. Alfano, R.; Guida, F.; Galobardes, B.; Chadeau-Hyam, M.; Delpierre, C.; Ghantous, A.; Henderson, J.; Herceg, Z.; Jain, P.; Nawrot, T.S.; et al. Socioeconomic position during pregnancy and DNA methylation signatures at three stages across early life: Epigenome-wide association studies in the ALSPAC birth cohort. Int. J. Epidemiol. 2019, 48, 30–44. [Google Scholar] [CrossRef] [PubMed]
  122. Richmond, R.C.; Simpkin, A.J.; Woodward, G.; Gaunt, T.R.; Lyttleton, O.; McArdle, W.L.; Ring, S.M.; Smith, A.D.A.C.; Timpson, N.J.; Tilling, K.; et al. Prenatal Exposure to Maternal Smoking and Offspring DNA Methylation across the Lifecourse: Findings from the Avon Longitudinal Study of Parents and Children (ALSPAC). Hum. Mol. Genet. 2015, 24, 2201–2217. [Google Scholar] [CrossRef] [Green Version]
  123. Tobi, E.W.; Lumey, L.H.; Talens, R.P.; Kremer, D.; Putter, H.; Stein, A.D.; Slagboom, P.E.; Heijmans, B.T. DNA methylation differences after exposure to prenatal famine are common and timing- and sex-specific. Hum. Mol. Genet. 2009, 18, 4046–4053. [Google Scholar] [CrossRef]
  124. Muniz, L.C.; Menezes, A.M.B.; Buffarini, R.; Wehrmeister, F.C.; Assunção, M.C.F. Effect of Breastfeeding on Bone Mass from Childhood to Adulthood: A Systematic Review of the Literature. Int. Breastfeed. J. 2015, 10, 31. [Google Scholar] [CrossRef] [Green Version]
  125. Dessì, A.; Murgia, A.; Agostino, R.; Pattumelli, M.G.; Schirru, A.; Scano, P.; Fanos, V.; Caboni, P. Exploring the Role of Different Neonatal Nutrition Regimens during the First Week of Life by Urinary GC-MS Metabolomics. Int. J. Mol. Sci. 2016, 17, 265. [Google Scholar] [CrossRef] [Green Version]
  126. San-Cristobal, R.; Navas-Carretero, S.; Milagro, F.I.; Riezu-Boj, J.I.; Guruceaga, E.; Celis-Morales, C.; Livingstone, K.M.; Brennan, L.; Lovegrove, J.A.; Daniel, H.; et al. Gene methylation parallelisms between peripheral blood cells and oral mucosa samples in relation to overweight. J. Physiol. Biochem. 2016, 73, 465–474. [Google Scholar] [CrossRef] [Green Version]
  127. Van Dongen, J.; Nivard, M.G.; Willemsen, G.; Hottenga, J.-J.; Helmer, Q.; Dolan, C.V.; Ehli, E.A.; Davies, G.E.; Van Iterson, M.; Breeze, C.E.; et al. Genetic and environmental influences interact with age and sex in shaping the human methylome. Nat. Commun. 2016, 7, 11115. [Google Scholar] [CrossRef] [PubMed] [Green Version]
  128. Colodro-Conde, L.; Sánchez-Romera, J.F.; Ordoñana, J.R. Heritability of Initiation and Duration of Breastfeeding Behavior. Twin Res. Hum. Genet. 2013, 16, 575–580. [Google Scholar] [CrossRef] [PubMed]
  129. Merjonen, P.; Dolan, C.V.; Bartels, M.; Boomsma, D.I. Does Breastfeeding Behavior Run in Families? Evidence from Twins, Their Sisters and Their Mothers in the Netherlands. Twin Res. Hum. Genet. 2015, 18, 179–187. [Google Scholar] [CrossRef] [PubMed] [Green Version]
  130. Eriksson, N.; Benton, G.M.; Do, C.B.; Kiefer, A.K.; Mountain, J.L.; Hinds, D.A.; Francke, U.; Tung, J.Y. Genetic variants associated with breast size also influence breast cancer risk. BMC Med. Genet. 2012, 13, 53. [Google Scholar] [CrossRef] [PubMed] [Green Version]
  131. Cunningham, B.; Bass, S.; Fuh, G.; Wells, J. Zinc mediation of the binding of human growth hormone to the human prolactin receptor. Science 1990, 250, 1709–1712. [Google Scholar] [CrossRef]
  132. Sukonina, V.; Ma, H.; Zhang, W.; Bartesaghi, S.; Subhash, S.; Heglind, M.; Foyn, H.; Betz, M.J.; Nilsson, D.; Lidell, M.E.; et al. FOXK1 and FOXK2 regulate aerobic glycolysis. Nature 2019, 566, 279–283. [Google Scholar] [CrossRef]
  133. Hannenhalli, S.; Kaestner, K.H. The evolution of Fox genes and their role in development and disease. Nat. Rev. Genet. 2009, 10, 233–240. [Google Scholar] [CrossRef] [Green Version]
  134. Tachmazidou, I.; Süveges, D.; Min, J.L.; Ritchie, G.R.; Steinberg, J.; Walter, K.; Iotchkova, V.; Schwartzentruber, J.; Huang, J.; Memari, Y.; et al. Whole-Genome Sequencing Coupled to Imputation Discovers Genetic Signals for Anthropometric Traits. Am. J. Hum. Genet. 2017, 100, 865–884. [Google Scholar] [CrossRef] [Green Version]
  135. Crujeiras, A.B.; Pissios, P.; Moreno-Navarrete, J.M.; Díaz-Lagares, A.; Sandoval, J.; Gómez, A.; Ricart, W.; Esteller, M.; Casanueva, F.F.; Fernandez-Real, J.M. An Epigenetic Signature in Adipose Tissue Is Linked to Nicotinamide N-Methyltransferase Gene Expression. Mol. Nutr. Food Res. 2018, 62, 1700933. [Google Scholar] [CrossRef]
  136. Bardanzellu, F.; Fanos, V.; Strigini, F.A.L.; Artini, P.G.; Peroni, D.G. Human Breast Milk: Exploring the Linking Ring Among Emerging Components. Front. Pediatr. 2018, 6, 215. [Google Scholar] [CrossRef] [Green Version]
  137. Lehmann, G.M.; LaKind, J.S.; Davis, M.H.; Hines, E.P.; Marchitti, S.A.; Alcala, C.; Lorber, M. Environmental Chemicals in Breast Milk and Formula: Exposure and Risk Assessment Implications. Environ. Health Perspect. 2018, 126, 096001. [Google Scholar] [CrossRef] [PubMed]
  138. Gómez-Gallego, C.; Morales, J.M.; Monleón, D.; Du Toit, E.; Kumar, H.; Linderborg, K.M.; Zhang, Y.; Yang, B.; Isolauri, E.; Salminen, S.; et al. Human Breast Milk NMR Metabolomic Profile across Specific Geographical Locations and Its Association with the Milk Microbiota. Nutrients 2018, 10, 1355. [Google Scholar] [CrossRef] [PubMed] [Green Version]
  139. Hermansson, H.; Kumar, H.; Collado, M.C.; Salminen, S.; Isolauri, E.; Rautava, S. Breast Milk Microbiota Is Shaped by Mode of Delivery and Intrapartum Antibiotic Exposure. Front. Nutr. 2019, 6, 4. [Google Scholar] [CrossRef] [PubMed] [Green Version]
Figure 1. Flowchart of analyses.
Nutrients 11 02804 g001
Figure 2. Quantile-Quantile (QQ) plots: (a) in the total sample; (b) in the subsample of children younger than 10 years old; and (c) in the subsample of children older than 10 years old. (d) Manhattan plot shows the epigenome-wide association study results of breastfeeding ‘never’/‘ever’ in children younger than 10 years old. Covariates included sex, age, socio-economic status (SES), maternal age at delivery, maternal pre-pregnancy BMI, maternal prenatal smoking, gestational age, EPIC array row and bisulfite sample plate, and cell composition. In the Manhattan plot, the red line represents the Bonferroni threshold (6.34 × 10⁻⁸). Given CpG names indicate significant loci after removal of outliers.
Nutrients 11 02804 g002
Table 1. Early life characteristics and breastfeeding in the Netherlands Twin Register (NTR) discovery sample (n = 1006).
Breastfeeding Never (n = 265)Breastfeeding Ever (n = 741)Total
n%n%n%
Sex
male13852.1%34947.1%48748.4%
female12747.9%39252.9%51951.6%
Zygosity
Monozygotic (MZ)22685.3%61382.7%83983.4%
Dizygotic (DZ)3914.7%12817.3%16716.6%
Chorionicity
MCMA43.5%217.3%256.2%
MCDA6153.0%14450.3%20551.1%
DCDA5043.5%12142.3%17142.6%
Gestational Age (Weeks)
Mean (SD)36.2(22.2)35.8(25.9)35.9(25.1)
≤ 32124.8%618.4%737.5%
33–3612851.4%35949.4%48749.9%
≥ 3710943.8%30642.1%41542.6%
Mother’s Age at Birth (Years)
Mean (SD)31.9(4.5)31.2(4.2)31.4(4.3)
19–297629.0%28839.0%36436.4%
30–3917566.8%43558.9%61061.0%
>40114.2%152.0%262.6%
Mother’s BMI Before Pregnancy
Mean (SD)24.3(4.0)24.2(4.11)24.2(4.1)
<2514961.3%47066.1%61964.9%
25–297028.8%16923.8%23925.1%
30–39249.9%659.1%899.3%
>4000.0%71.0%70.7%
Father’s Age at Birth (Years)
Mean (SD)33.2(4.4)33.9(5.4)33.7(5.2)
20–295322.0%14620.3%19920.8%
30–3916367.6%48267.1%64567.3%
>402510.4%9012.5%11512.0%
Mode of Conception
naturally22792.7%62386.5%85088.1%
stimulated41.6%263.6%303.1%
IVF/ICSI145.7%719.9%858.8%
Maternal Smoking
no smoking20586.1%63192.9%83691.2%
smoking3313.9%487.1%818.8%
Parental SES
low skill level00.0%81.2%80.9%
lower secondary educational level3011.9%416.1%717.6%
upper secondary education level9939.3%20330.0%30232.5%
higher vocational level8935.3%23434.6%32334.8%
scientific level3413.5%19128.2%22524.2%
Mode of Delivery
vaginal14156.6%41657.1%55757.0%
caesarean planned4317.3%9713.3%14014.3%
urgent intervention (forceps, vacuum extraction)208.0%7510.3%959.7%
urgent caesarean section4518.1%14019.2%18518.9%
Birth Weight
Mean (SD)2435.7(444.8)2394.6(558)2405(531.7)
<150083.2%527.1%606.2%
1500–250012349.8%33846.4%46147.3%
>250011647.0%33846.4%45446.6%
Apgar Score at 1st Minute
0–61712.3%4812.8%6512.7%
7–910374.6%29077.5%39376.8%
101813.0%369.6%5410.5%
Apgar Score at 5th Minute
0–610.8%143.9%153.1%
7–94131.1%13036.3%17134.9%
109068.2%21459.8%30462.0%
Breastfeeding Duration
no265100.0%0 26526.3%
less than 2 weeks 7510.1%757.5%
2–6 weeks 18925.5%18918.8%
6 weeks to 3 months 18124.4%18118.0%
3–6 months 14820.0%14814.7%
more than 6 months 14820.0%14814.7%
Descriptive statistics of children included in the study. MCMA = monochorionic monoamniotic; MCDA = monochorionic diamniotic; DCDA = dichorionic diamniotic; SD = standard deviation; BMI = body mass index; IVF = in vitro fertilization; ICSI = intracytoplasmic sperm injection; and SES = socio-economic status.
Table 2. Summary of epigenome-wide significant CpGs from the discovery epigenome-wide association study (EWAS) of DNA signatures of breastfeeding.
cgIDChromosomePositionGeneGene RegionDiscovery StudyDiscovery Study Without Outliers
EstimateSEp-ValueEstimateSEp-Value
Basic Model (1). Sub-Sample < 10 years (n = 517)
cg25178826chr535165447PRLR5’UTR−0.0260.0048.04 × 10–12−6.04 × 10–50.0010.98
cg12087956chr1543022167CDAN1Body−0.0310.0051.18 × 10–84.92 × 10–50.0010.50
cg24192772chr1780536920FOXK2Body−0.0240.0042.52 × 10–89.17 × 10–40.0010.15
cg10142656chr937753047TRMT10BTSS1500−0.0190.0046.28 × 10–89.98 × 10–50.00070.14
Adjusted Model (2). Discovery Sample (n = 1006)
cg22491379chr2120553625PTPN45’UTR−0.0070.0011.30 × 10–9−0.0050.0015.78 × 103
Adjusted Model (2). Sub-Sample < 10 Years (n = 517)
cg03463465chr6164143581 0.3600.0344.51 × 10–26−0.0030.0010.01
cg07670516chr175019840ZNF2325’UTR0.2490.0321.40 × 10–140.0060.0140.65
cg20820810chr1171850130FOLR3Body−0.3000.0542.82 × 10–8−0.0010.0010.21
cg16279140chr14103981749 −0.4110.0523.50 × 10–15no outliers
cg05823759chr7149646627 0.2050.0322.35 × 10–10no outliers
cg27284194chr41044797 0.6380.1072.90 × 10–9no outliers
cg03995300chr175019989ZNF2325’UTR0.2290.0401.02 × 10–8no outliers
α = 0.05/787,711 = 6.34 × 10⁻⁸. Basic Model 1 included breastfeeding coded as ‘never’ and ‘ever’ with adjustments for sex, age at DNA methylation, the count of epithelial cells, the count of natural killer cells, EPIC array row and bisulfite sample plate. Adjusted Model (2) included in additional to basic model covariates: SES, maternal smoking during pregnancy, maternal age at birth, maternal pre-pregnancy BMI, and gestational age. In bold: CpGs selected for replication.
Table 3. Summary of association between breastfeeding and significant in the discovery study CpGs in replication.
cgIDDirection of Effect in Discovery Study <10 YearsNTR Replication Study (n = 98)ALSPAC Replication Study (n = 938)
EstimateSEP-Value aEstimateSEP-Value
cg16279140−0.03260.04120.43NANANA
cg05823759+0.03290.03320.32NANANA
cg27284194+0.06680.05420.210.00470.0160.77
cg03995300+−0.05020.03340.130.01400.0110.19
Adjusted Model 2 was used. a α = 0.05/4 = 0.01. NA = not available on the 450k platform.
Table 4. Replication of CpGs from previous literature.
cgIDChromosomePositionGeneGene RegionESTIMATESEP-Value
Total Sample (n = 1006)
cg16387046chr1255248207MUCL1TSS2000.0270.0054.93 × 10–7
Sub-Sample <10 (n = 517)
cg11287055chr2138630234VPS26C (DSCR3)Body0.0560.0124.93 × 10–6
cg16704958chr2138630728VPS26C (DSCR3)Body0.0090.0028.03 × 10–6
cg26479305chr1252470979ATG10 (C12orf44)3’UTR0.3380.0771.11 × 10–5
α = 0.05/3859 = 1.29 × 10⁻⁵. The table shows all CpGs that were previously reported to be associated with breastfeeding and that were significantly replicated by our study.

