A Comparison of Changes in the Fatty Acid Profile of Human Milk of Spanish Lactating Women during the First Month of Lactation Using Gas Chromatography-Mass Spectrometry. A Comparison with Infant Formulas

Abstract
:1. Introduction
2. Materials and Methods
2.1. Chemicals and Reagents
2.2. Subject
2.3. Milk Samples
2.4. Total Lipid Content and Fat Extraction
2.5. Preparation of Methyl Esters for Gas Chromatographic Analysis
2.6. Chromatographic and Mass Operating Conditions
2.7. Analytical Validation
2.8. Statistical Analyses
3. Results
3.1. Analytical Validation
3.2. Fatty Acid Profile
3.2.1. Saturated Fatty Acids (SFAs)
3.2.2. Monounsaturated Fatty Acids (MUFAs)
3.2.3. Polyunsaturated Fatty Acids (PUFAs)
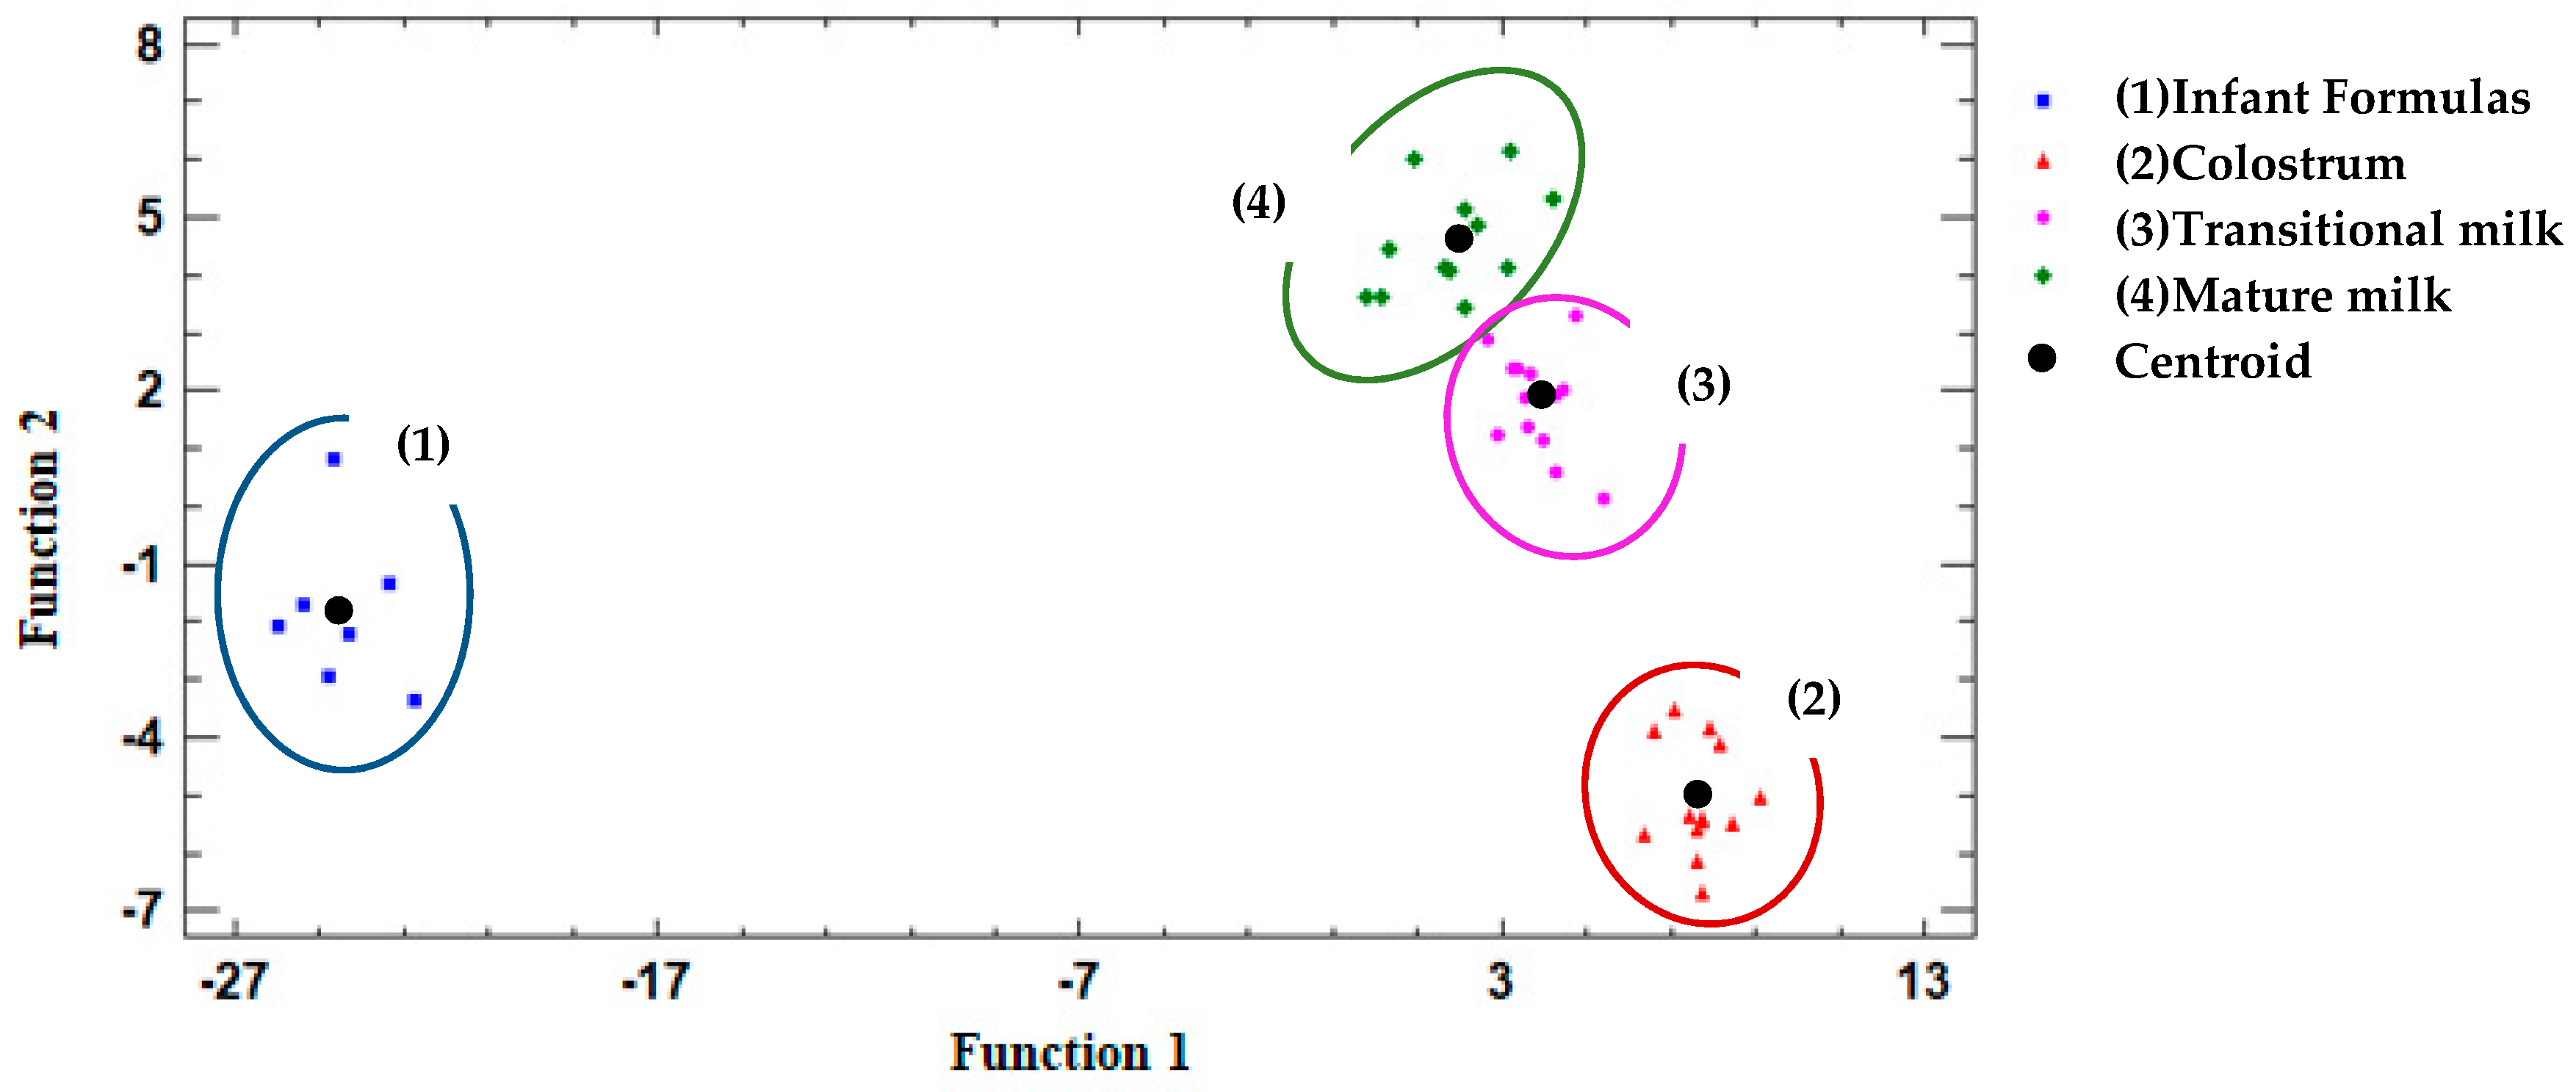
3.3. Discriminant Analysis
4. Discussion
4.1. Saturated Fatty Acids (SFAs)
4.2. Monounsaturated Fatty Acids (MUFAs)
4.3. Polyunsaturated Fatty Acids (PUFAs)
4.4. Discriminant Analysis
4.5. Limitations and Strenghts
5. Conclusions
Supplementary Materials
Author Contributions
Funding
Acknowledgments
Conflicts of Interest
References
- Organización Mundial de la Salud (OMS). Lactancia Materna Exclusiva; WHO: Geneva, Switzerland, 2019. [Google Scholar]
- Binns, C.; Lee, M.; Low, W.Y. The Long-Term Public Health Benefits of Breastfeeding. Asia Pac. J. Public Health 2016, 28, 7–14. [Google Scholar] [CrossRef] [PubMed] [Green Version]
- Organización Mundial de la Salud (OMS). Organización Panamericana de la Salud (OPS) La Alimentación del Lactante y del Niño Pequeño; OMS: Geneva, Switzerland, 2009; Volume 1, ISBN 9789275330944. [Google Scholar]
- Comité de Lactancia Materna de la Asociación Española de Pediatría (AEPED). LACTANCIA MATERNA EN CIFRAS: TASAS DE INICIO Y DURACIÓN DE LA LACTANCIA EN ESPAÑA Y EN OTROS PAÍSES; AEPED: Madrid, Spain, 2016. [Google Scholar]
- Lopes, T.I.B.; Cañedo, M.C.; Oliveira, F.M.P.; Alcantara, G.B. Toward Precision Nutrition: Commercial Infant Formulas and Human Milk Compared for Stereospecific Distribution of Fatty Acids Using Metabolomics. OMICS J. Integr. Biol. 2018, 22, 484–492. [Google Scholar] [CrossRef] [PubMed]
- Mazzocchi, A.; D’Oria, V.; Cosmi, V.; Bettocchi, S.; Milani, G.; Silano, M.; Agostoni, C.; Mazzocchi, A.; D’Oria, V.; De Cosmi, V.; et al. The Role of Lipids in Human Milk and Infant Formulae. Nutrients 2018, 10, 567. [Google Scholar] [CrossRef] [PubMed] [Green Version]
- Delplanque, B.; Gibson, R.; Koletzko, B.; Lapillonne, A.; Strandvik, B. Lipid Quality in Infant Nutrition. J. Pediatr. Gastroenterol. Nutr. 2015, 61, 8. [Google Scholar] [CrossRef] [PubMed] [Green Version]
- Long, A.C.; Kaiser, J.L.; Katz, G.E. Lipids in infant formulas: Current and future innovations. Lipid Technol. 2013, 25, 127–129. [Google Scholar] [CrossRef]
- Sioen, I.; van Lieshout, L.; Eilander, A.; Fleith, M.; Lohner, S.; Szommer, A.; Petisca, C.; Eussen, S.; Forsyth, S.; Calder, P.C.; et al. Systematic Review on N-3 and N-6 Polyunsaturated Fatty Acid Intake in European Countries in Light of the Current Recommendations—Focus on Specific Population Groups. Ann. Nutr. Metab. 2017, 70, 39–50. [Google Scholar] [CrossRef] [PubMed]
- López-López, A.; López-Sabater, M.; Campoy-Folgoso, C.; Rivero-Urgell, M.; Castellote-Bargalló, A. Fatty acid and sn-2 fatty acid composition in human milk from Granada (Spain) and in infant formulas. Eur. J. Clin. Nutr. 2002, 56, 1242–1254. [Google Scholar] [CrossRef] [Green Version]
- Van Elten, T.M.; Van Rossem, L.; Wijga, A.H.; Brunekreef, B.; de Jongste, J.C.; Koppelman, G.H.; Smit, H.A. Breast milk fatty acid composition has a long-term effect on the risk of asthma, eczema, and sensitization. Allergy 2015, 70, 1468–1476. [Google Scholar] [CrossRef]
- Hurtado, J.A.; Iznaola, C.; Peña, M.; Ruíz, J.; Peña-Quintana, L.; Kajarabille, N.; Rodriguez-Santana, Y.; Sanjurjo, P.; Aldámiz-Echevarría, L.; Ochoa, J.; et al. Effects of Maternal Ω-3 Supplementation on Fatty Acids and on Visual and Cognitive Development. J. Pediatr. Gastroenterol. Nutr. 2015, 61, 472–480. [Google Scholar] [CrossRef]
- Barreiro, R.; Regal, P.; López-Racamonde, O.; Cepeda, A.; Fente, C.A. Comparison of the fatty acid profile of Spanish infant formulas and Galician women breast milk. J. Physiol. Biochem. 2018, 74, 127–138. [Google Scholar] [CrossRef]
- Juber, B.A.; Jackson, K.H.; Johnson, K.B.; Harris, W.S.; Baack, M.L. Breast milk DHA levels may increase after informing women: A community-based cohort study from South Dakota USA. Int. Breastfeed. J. 2016, 12, 7. [Google Scholar] [CrossRef] [PubMed] [Green Version]
- De Souza Santos da Costa, R.; da Silva Santos, F.; de Barros Mucci, D.; de Souza, T.V.; de Carvalho Sardinha, F.L.; Moutinho de Miranda Chaves, C.R.; das Graças Tavares do Carmo, M. trans Fatty Acids in Colostrum, Mature Milk and Diet of Lactating Adolescents. Lipids 2016, 51, 1363–1373. [Google Scholar] [CrossRef] [PubMed]
- Marangoni, F.; Agostoni, C.; Lammard, A.M.; Giovannini, M.; Galli, C.; Riva, E. Polyunsaturated fatty acid concentrations in human hindmilk are stable throughout 12-months of lactation and provide a sustained intake to the infant during exclusive breastfeeding: An Italian study. Br. J. Nutr. 2000, 84, 103–109. [Google Scholar] [PubMed]
- EU. Commission Directive 2006/141/EC of 22 December 2006 on Infant Formulae and Follow-on Formulae and Amending Directive 1999/21/EC, 30. 12. 2006; EU: Brussels, Belgium, 2006; pp. 1–33. [Google Scholar]
- Lien, E.L.; Richard, C.; Hoffman, D.R. DHA and ARA addition to infant formula: Current status and future research directions. Prostaglandins Leukot. Essent. Fat. Acids 2018, 128, 26–40. [Google Scholar] [CrossRef] [PubMed]
- Ministerio de Sanidad, Servicios Sociales e Igualdad. Guía de Práctica Clínica sobre lactancia materna 2017, 321. Available online: https://www.aeped.es/sites/default/files/guia_de_lactancia_materna.pdf (accessed on 19 June 2019).
- Hara, A.; Radin, N. Lipid Extraction of Tissues. Evaluation 1978, 426, 420–426. [Google Scholar]
- Christie, W.W. A simple procedure for rapid transmethylation of glycerolipids and cholesteryl esters. J. Lipid Res. 1982, 23, 1072–1075. [Google Scholar]
- He, Y.-B.; Ren, H.-W.; Cao, Y.-T.; Li, H.-J.; Zhang, Z.; Liu, N. Comparing the composition and trend of fatty acid in human milk with bovine milk and infant formula in northeast region of China. CyTA J. Food 2016, 14, 632–638. [Google Scholar] [CrossRef] [Green Version]
- Zou, L.; Pande, G.; Akoh, C.C. Infant Formula Fat Analogs and Human Milk Fat: New Focus on Infant Developmental Needs. Annu. Rev. Food Sci. Technol. 2016, 7, 139–165. [Google Scholar] [CrossRef]
- Gardner, A.S.; Rahman, I.A.; Lai, C.T.; Hepworth, A.; Trengove, N.; Hartmann, P.E.; Geddes, D.T. Changes in Fatty Acid Composition of Human Milk in Response to Cold-Like Symptoms in the Lactating Mother and Infant. Nutrients 2017, 9, 1034. [Google Scholar] [CrossRef]
- Innis, S.M. Palmitic Acid in Early Human Development. Crit. Rev. Food Sci. Nutr. 2016, 56, 1952–1959. [Google Scholar] [CrossRef]
- Garcia, C.; Innis, S. Structure of the human milk fat globule. Lipid Technol. 2013, 25, 223–226. [Google Scholar] [CrossRef]
- Chen, Y.; Zhang, X.; Li, D.; Yi, H.; Xu, T.; Li, S.; Zhang, L. Fatty acid and triacylglycerol comparison of infant formulas on the Chinese market. Int. Dairy J. 2019, 95, 35–43. [Google Scholar] [CrossRef]
- Di, D.; In, R.; Agrarie, S.E.T. Milk and dairy products: Evaluation of bioactive components. 2014. Available online: https://pdfs.semanticscholar.org/7145/03282aa7dffe66a3c8d0c224daf32d865d4a.pdf (accessed on 19 June 2019).
- Koletzko, B.; Baker, S.; Cleghorn, G.; Neto, U.F.; Gopalan, S.; Hernell, O.; Hock, Q.S.; Jirapinyo, P.; Lonnerdal, B.; Pencharz, P.; et al. Global Standard for the Composition of Infant Formula: Recommendations of an ESPGHAN Coordinated International Expert Group. J. Pediatric Gastroenterol. Nutr. 2005, 41, 584–599. Available online: https://pdfs.semanticscholar.org/b165/c33c861705c790a4e9620e7d99334e96cd3b.pdf (accessed on 24 July 2019). [CrossRef] [PubMed] [Green Version]
- Barreiro, R.; Díaz-Bao, M.; Cepeda, A.; Regal, P.; Fente, C.A. Fatty acid composition of breast milk in Galicia (NW Spain): A cross-country comparison. Prostaglandins Leukot. Essent. Fat. Acids 2018, 135, 102–114. [Google Scholar] [CrossRef]
- Krešić, G.; Dujmović, M.; Mandić, M.L.; Delaš, I. Relationship between Mediterranean diet and breast milk fatty acid profile: A study in breastfeeding women in Croatia. Dairy Sci. Technol. 2013, 93, 287–301. [Google Scholar] [CrossRef] [Green Version]
- Ministerio de Agricultura, P.y.A. Informe del Consumo Alimentario en España 2017. Gob. España 2018, 242. [Google Scholar]
- Martysiak-Żurowska, D.; Kiełbratowska, B.; Szlagatys-Sidorkiewicz, A. The content of conjugated linoleic acid and vaccenic acid in the breast milk of women from Gdansk and the surrounding district, as well as in, infant formulas and follow-up formulas. nutritional recommendation for nursing women. Dev. Period Med. 2018, 22, 128–134. [Google Scholar]
- Mosley, E.E.; McGuire, M.K.; Williams, J.E.; McGuire, M.A. Cis-9, Trans-11 Conjugated Linoleic Acid Is Synthesized from Vaccenic Acid in Lactating Women. J. Nutr. 2006, 136, 2297–2301. [Google Scholar] [CrossRef] [Green Version]
- Turpeinen, A.M.; Mutanen, M.; Aro, A.; Salminen, I.; Basu, S.; Palmquist, D.L.; Griinari, J.M. Bioconversion of vaccenic acid to conjugated linoleic acid in humans. Am. J. Clin. Nutr. 2002, 76, 504–510. [Google Scholar] [CrossRef] [Green Version]
- Rist, L.; Mueller, A.; Barthel, C.; Snijders, B.; Jansen, M.; Simões-Wüst, A.P.; Huber, M.; Kummeling, I.; von Mandach, U.; Steinhart, H.; et al. Influence of organic diet on the amount of conjugated linoleic acids in breast milk of lactating women in the Netherlands. Br. J. Nutr. 2007, 97, 735–743. [Google Scholar] [CrossRef] [Green Version]
- Daud, A.Z.; Mohd-Esa, N.; Azlan, A.; Chan, Y.M. The trans fatty acid content in human milk and its association with maternal diet among lactating mothers in Malaysia. Asia Pac. J. Clin. Nutr. 2013, 22, 431–442. [Google Scholar] [PubMed]
- Ribeiro, M.; Balcao, V.; Guimaraes, H.; Rocha, G.; Moutinho, C.; Matos, C.; Almeida, C.; Casal, S.; Guerra, A. Fatty Acid Profile of Human Milk of Portuguese Lactating Women: Prospective Study from the 1st to the 16th Week of Lactation. Ann. Nutr. Metab. 2008, 53, 50–56. [Google Scholar] [CrossRef] [PubMed]
- Sala-Vila, A.; Castellote, A.I.; Rodriguez-Palmero, M.; Campoy, C.; López-Sabater, M.C. Lipid composition in human breast milk from Granada (Spain): Changes during lactation. Nutrition 2005, 21, 467–473. [Google Scholar] [CrossRef] [PubMed]
- Importancia del Ácido Gamma-Linolénico en la Salud y en la Nutrición. Available online: https://w3.ual.es/~jlguil/gamma.htm (accessed on 15 October 2019).
- Fu, Y.; Liu, X.; Zhou, B.; Jiang, A.C.; Chai, L. An updated review of worldwide levels of docosahexaenoic and arachidonic acid in human breast milk by region. Public Health Nutr. 2016, 19, 2675–2687. [Google Scholar] [CrossRef] [PubMed] [Green Version]
- Brenna, J.T.; Varamini, B.; Jensen, R.G.; Diersen-Schade, D.A.; Boettcher, J.A.; Arterburn, L.M. Docosahexaenoic and arachidonic acid concentrations in human breast milk worldwide. Am. J. Clin. Nutr. 2007, 85, 1457–1464. [Google Scholar] [CrossRef] [PubMed] [Green Version]
- FAO. Standard for infant formula and formulas for special medical purposes intended for infants. Codex Aliment. 2016, 72–1981, 1–21. [Google Scholar]
- Rueda, A.; Seiquer, I.; Olalla, M.; Giménez, R.; Lara, L.; Cabrera-Vique, C. Characterization of fatty acid profile of argan oil and other edible vegetable oils by gas chromatography and discriminant analysis. J. Chem. 2014, 2014. [Google Scholar] [CrossRef]


| Mean | SD | Minimum | Maximum | |
|---|---|---|---|---|
| Age (years) | 32 | 4.7 | 26 | 40 |
| Height (cm) | 163.6 | 7.00 | 150.0 | 172.0 |
| Weight (kg) | 69.6 | 13.50 | 47.4 | 90.8 |
| BMI (kg/cm2) | 26.2 | 5.33 | 18.4 | 33.4 |
| Birth weight (kg) | 2.9 | 0.79 | 1.2 | 3.8 |
| Parity | 1.6 | 0.92 | 1 | 3 |
| Fatty Acids | Linear Range (ppm) | tr ± SD | Linear Equation | R | R2 | LOD (ppm) | LOQ (ppm) |
|---|---|---|---|---|---|---|---|
| Caprylic acid (C8:0) | 250–1000 | 2.647 ± 0.006 | y = 271.7940x + 813.2345 | 0.9999 | 0.9997 | 0.3362 | 1.1208 |
| Capric acid (C10:0) | 250–1000 | 4.597 ± 0.006 | y = 362.0136x - 8269.8440 | 0.9999 | 0.9997 | 0.3223 | 1.0743 |
| Undecanoic acid (C11:0) | 250–1000 | 6.000 ± 0.000 | y = 183.0014x - 4785.7425 | 0.9999 | 0.9998 | 0.4375 | 1.4583 |
| Lauric acid (C12:0) | 250–1000 | 7.623 ± 0.006 | y = 403.2163x - 11475.9145 | 0.9998 | 0.9996 | 0.2929 | 0.9765 |
| Tridecanoic acid (C13:0) | 250–1000 | 9.400 ± 0.010 | y = 197.6763x - 6117.3745 | 0.9999 | 0.9999 | 0.5236 | 1.7452 |
| Myristic acid (C14:0) | 250–1000 | 11.247 ± 0.006 | y = 414,5987x - 8987,9605 | 0.9994 | 0.9988 | 0.1620 | 0.5400 |
| Myristoleic acid (C14:1) | 250–1000 | 12.167 ± 0.006 | y = 217,1785x - 9140,8480 | 0.9993 | 0.9987 | 0.1514 | 0.5046 |
| Pentadecanoic acid (C15:0) | 250–1000 | 13.117 ± 0.012 | y = 211,0244x - 6724,5895 | 0.9996 | 0.9993 | 0.2058 | 0.6862 |
| Cis-10-pentadecenoic acid (C15:1) | 250–1000 | 14.010 ± 0.010 | y =221,6763 x - 9651,3250 | 0.9999 | 0.9998 | 0.2058 | 0.6862 |
| Palmitic acid (C16:0) | 250–1000 | 14.980 ± 0.010 | y = 663,2947x - 24193,3435 | 0.9999 | 0.9998 | 0.3793 | 1.2642 |
| Palmitoleic acid (C16:1 n-9 Z) | 250–1000 | 15.587 ± 0.006 | y = 227,0054x - 8233,3830 | 0.9996 | 0.9991 | 0.1901 | 0.6337 |
| Margaric acid (C17:0) | 250–1000 | 16.793 ± 0.006 | y = 147,9136x - 5182,7135 | 1.0000 | 1.0000 | 0.9664 | 3.2212 |
| Cis-10-heptadecenoic acid (C17:1) | 250–1000 | 17.357 ± 0.006 | y = 229,9246x - 10188,1020 | 0.9999 | 0.9998 | 0.4456 | 1.4855 |
| Stearic acid (C18:0) | 250–1000 | 18.577 ± 0.006 | y = 464,1352x - 13723,7815 | 0.9997 | 0.9995 | 0.2437 | 0.8123 |
| Elaidic acid (C18:1 n-9 E) | 250–1000 | 18.817 ± 0.006 | y = 158.1385x - 2278.2970 | 1.0000 | 0.9999 | 0.6563 | 2.1877 |
| Oleic acid (C18:1 n-9 Z) | 250–1000 | 18.953 ± 0.006 | y = 425.2101x - 7612.0155 | 0.9997 | 0.9993 | 0.2137 | 0.7122 |
| Linolelaidic acid (C18:2 n-6 E) | 250–1000 | 19.553 ± 0.006 | y = 230.1367x - 15194.7850 | 0.9997 | 0.9994 | 0.2214 | 0.7380 |
| Linoleic acid (C18:2 n-6 Z) | 250–1000 | 19.920 ± 0.000 | y = 223.0317x - 11160.5665 | 1.0000 | 0.9999 | 0.6918 | 2.3060 |
| γ-linolenic acid (C18:3 n-6, GLA) | 250–1000 | 20.580 ± 0.000 | y = 212.2357x - 12443.1135 | 1.0000 | 0.9999 | 0.7184 | 2.3946 |
| α-linolenic acid (C18:3 n-3, ALA) | 250–1000 | 21.160 ± 0.000 | y = 202.2944x - 9492.2895 | 1.0000 | 1.0000 | 1.8403 | 6.1344 |
| Arachidic acid (C20:0) | 250–1000 | 21.973 ± 0.015 | y = 494.0689x - 16256.6330 | 0.9991 | 0.9983 | 0.1345 | 0.4482 |
| Cis-11-eicosenoic acid (C20:1) | 250–1000 | 22.263 ± 0.006 | y = 241.1562x - 12764.6795 | 1.0000 | 1.0000 | 0.8160 | 2.7199 |
| Cis-11,14-eicosadienoic acid (C20:2) | 250–1000 | 23.130 ± 0.010 | y = 211.9830x - 9814.0900 | 0.9998 | 0.9996 | 0.2733 | 0.9110 |
| Heneicosanoic acid (C21:0) | 250–1000 | 23.590 ± 0.010 | y = 150.6156x - 2443.3555 | 1.0000 | 1.0000 | 1.6576 | 5.5254 |
| Cis-8,11,14-eicosatrienoic acid (C20:3 n-6, DGLA) | 250–1000 | 23.687 ± 0.006 | y = 197.8801x - 7653.1285 | 0.9998 | 0.9996 | 0.2765 | 0.9218 |
| Arachidonic acid (C20:4 n-6, AA) | 250–1000 | 24.103 ± 0.006 | y = 194.4791x - 7437.3125 | 0.9998 | 0.9995 | 0.2568 | 0.8560 |
| Cis-11,14,17-eicosatrienoic acid (C20:3) | 250–1000 | 24.253 ± 0.006 | y = 141.3401x - 3637.9235 | 0.9992 | 0.9984 | 0.1398 | 0.4659 |
| Behenic acid (C22:0) | 250–1000 | 25.180 ± 0.010 | y = 408.6182x - 10400.1250 | 1.0000 | 0.9999 | 0.7288 | 2.4292 |
| Erucic acid (C22:1 n-9) | 250–1000 | 25.313 ± 0.006 | y = 221.7645x - 17072.2935 | 1.0000 | 0.9999 | 0.7788 | 2.5959 |
| 5,8,11,14,17-eicosapentadienoic acid (C20:5 n-3, EPA) | 250–1000 | 25.407 ± 0.006 | y = 199.8515x - 10168.5900 | 0.9997 | 0.9994 | 0.2339 | 0.7797 |
| Cis-13,16-docosadienoic acid (C22:2) | 250–1000 | 26.173 ± 0.006 | y = 213.4314x - 12761.5080 | 1.0000 | 0.9999 | 0.6514 | 2.1713 |
| Tricosanoic acid (C23:0) | 250–1000 | 26.710 ± 0.010 | y = 228.7863x - 7187.5190 | 0.9997 | 0.9994 | 0.2318 | 0.7728 |
| Lignoceric acid (C24:0) | 250–1000 | 28.213 ± 0.006 | y = 443.1121x - 25091.8985 | 0.9999 | 0.9999 | 0.5220 | 1.7401 |
| Nervonic acid (C24:1) | 250–1000 | 28.373 ± 0.006 | y = 228.3534x - 11611.2500 | 1.0000 | 1.0000 | 1.0994 | 3.6648 |
| Cis-4,7,10,13,16,19-docosahexadienoic acid (C22:6 n-3, DHA) | 250–1000 | 28.630 ± 0.000 | y = 215.8342x - 19113.3950 | 1.0000 | 0.9999 | 0.5976 | 1.9921 |
| Fatty Acids (FAs) | Colostrum | Transitional Milk | Mature Milk | Infant Formula |
|---|---|---|---|---|
| Caprylic acid (C8:0) | 0.72 ± 0.634 | 0.51 ± 0.130 | 0.64 ± 0.197 | 0.77 ± 0.271 |
| Capric acid (C10:0) | 0.18 a,b,d ± 0.160 | 1.06 ± 0.268 | 1.06 ± 0.173 | 1.04 ± 0.424 |
| Lauric acid (C12:0) | 1.43 a,b,d ± 0.768 | 4.65 e ± 1.578 | 3.82 f ± 1.158 | 7.45 ± 2.378 |
| Tridecanoic acid (C13:0) | 0.00 | 0.01 ± 0.020 | 0.00 | 0.01 ± 0.010 |
| Myristic acid (C14:0) | 3.79 ± 1.165 | 4.56 ± 1.420 | 3.68 ± 1.326 | 3.43 ± 1.517 |
| Pentadecanoic acid (C15:0) | 0.15 ± 0.140 | 0.22 ± 0.009 | 0.18 ± 0.093 | 0.15 ± 0.282 |
| Palmitic acid (C16:0) | 23.75 a,b ± 2.032 | 20.76 c ± 2.031 | 18.13 f ± 2.332 | 23.09 ± 2.669 |
| Margaric acid (C17:0) | 0.09 ± 0.133 | 0.07 ± 0.104 | 0.08 ± 0.109 | 0.05 ± 0.109 |
| Stearic acid (C18:0) | 6.23 d ± 1.192 | 5.54 e ± 0.906 | 5.46 f ± 0.781 | 3.81 ± 0.516 |
| Arachidic acid (C20:0) | 0.04 d ± 0.096 | 0.02 e ± 0.074 | 0.03 f ± 0.075 | 0.33 ± 0.110 |
| Lignoceric acid (C24:0) | 0.04 ± 0.144 | 0.00 | 0.00 | 0.00 |
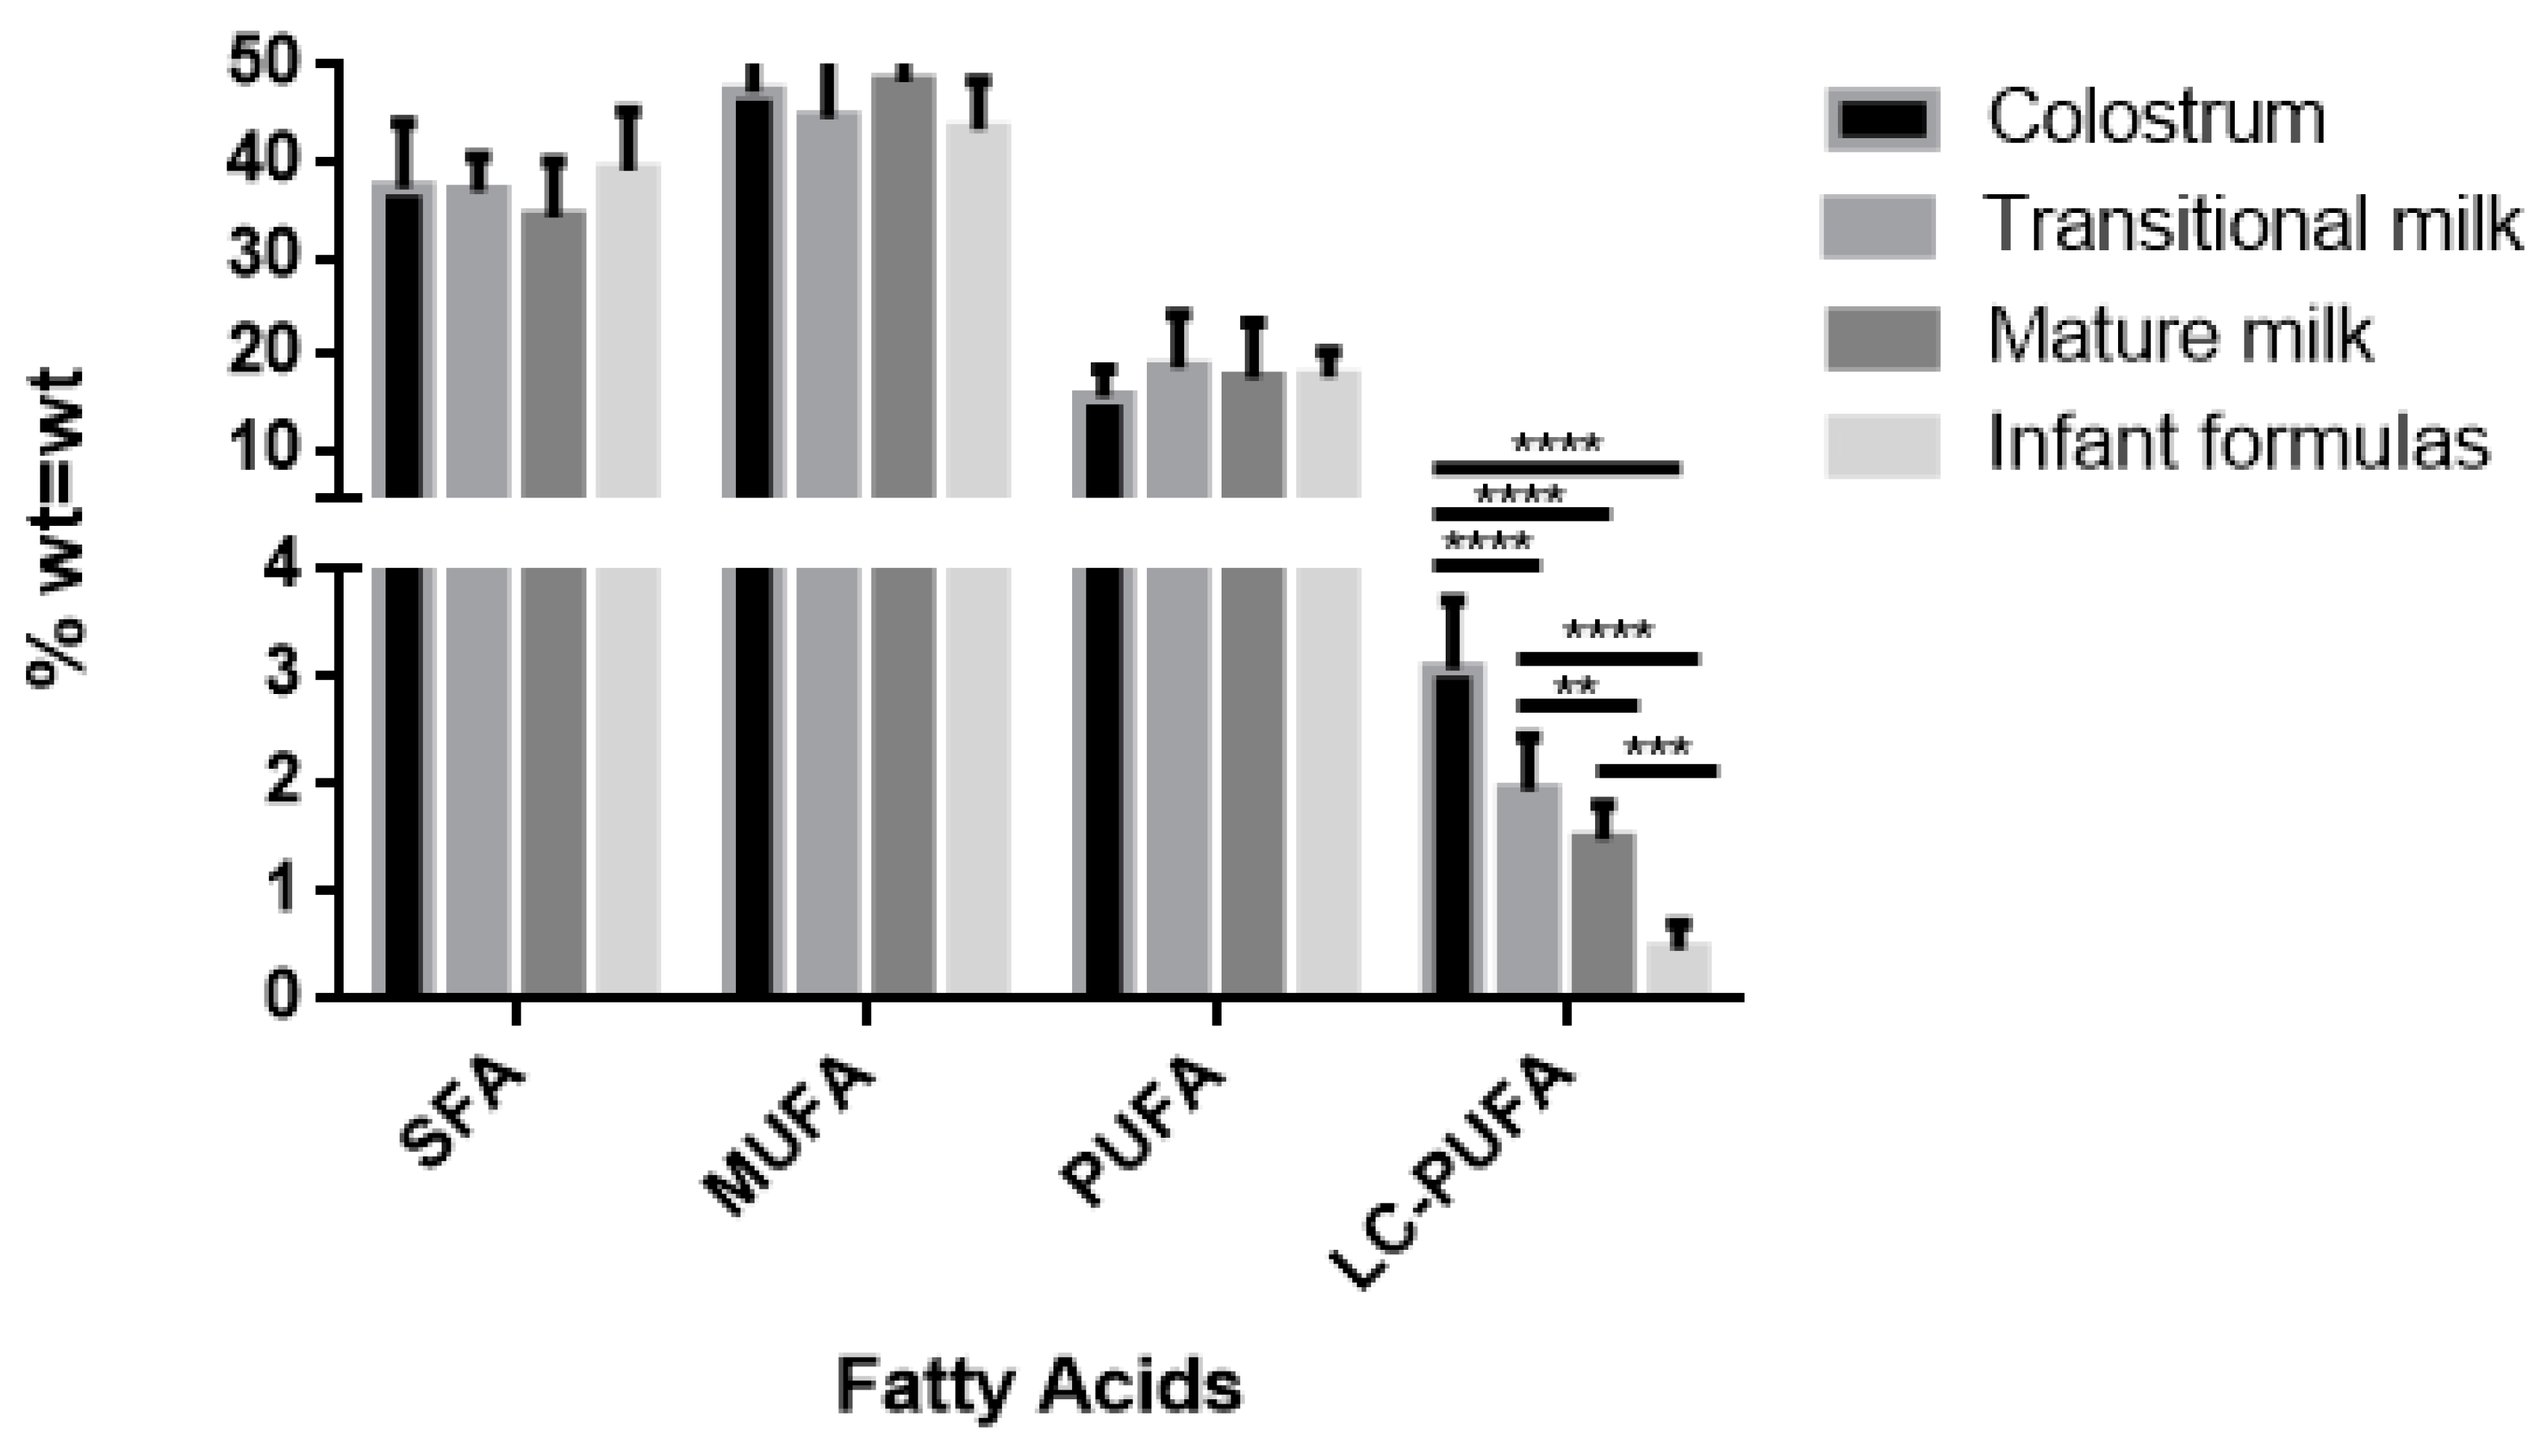
| SFA | 36.05 ± 5.266 | 37.49 ± 3.153 | 33.19 ± 4.899 | 37.31 ± 4.522 |
| SC-SFA (C8-C10) | 0.97 a,b,d ± 0.622 | 1.51 ± 0.346 | 1.70 ± 0.266 | 2.01 ± 0.465 |
| MC-SFA (C12-C16) | 27.71 d ± 3.305 | 30.38 c ± 2.856 | 26.05 f ± 4.370 | 33.76 ± 4.219 |
| LC-SFA (> C17) | 6.41 b,d ± 1.153 | 5.35 ± 0.901 | 5.55 f ± 0.735 | 4.15 ± 0.451 |
| Fatty Acids (FAs) | Colostrum | Transitional Milk | Mature Milk | Infant Formula |
|---|---|---|---|---|
| Myristoleic acid (C14:1) | 0.02 a ± 0.064 | 0.08 ± 0.085 | 0.06 ± 0.0796 | 0.18 ± 0.328 |
| Cis-10-pentadecenoic acid (C15:1) | 0.00 | 0.00 | 0.00 | 0.01 ± 0.034 |
| Palmitoleic acid (C16:1 n-9 Z) | 1.52 d ± 0.320 | 1.23 e ± 0.667 | 1.45 f ± 0.416 | 0.37 ± 0.159 |
| Vaccenic acid (C18:1 n-7 E) | 1.42 a,b,d ± 0.148 | 1.12 e ± 0.161 | 1.11 f ± 0.099 | 0.47 ± 0.103 |
| Oleic acid (C18:1 n-9 Z) | 42.11 ± 5.228 | 39.81 ± 4.608 | 43.88 ± 7.041 | 43.54 ± 3.428 |
| Gadoleic acid (C20:1 n-9) | 0.97 a,b,d ± 0.253 | 0.52 e ± 0.173 | 0.38 ± 0.097 | 0.36 ± 0.046 |
| Erucic acid (C22:1 n-9) | 0.00 | 0.03 ± 0.066 | 0.01 ± 0.035 | 0.00 |
| MUFA | 45.99 ± 5.750 | 43.34 ± 4.754 | 46.99 ± 6.796 | 44.86 ± 3.689 |
| Fatty Acids (FAs) | Colostrum | Transitional Milk | Mature Milk | Infant Formula |
|---|---|---|---|---|
| Cis-9,12-hexadecadienoic (C16:2 n-4) | 0.00 | 0.00 | 0.01 ± 0.032 | 0.00 |
| Linolelaidic acid (C18:2 n-6 E) | 0.01 ± 0.047 | 0.00 | 0.00 | 0.03 ± 0.072 |
| Linoleic acid (C18:2 n-6 Z (LA)) | 12.32 ± 2.643 | 16.10 ± 5.325 | 15.38 ± 5.754 | 15.31 ± 2.667 |
| γ-linolenic acid (C18:3 n-6 (GLA)) | 0.00 a,b | 0.04 e ± 0.064 | 0.07 f ± 0.087 | 0.00 |
| α-linolenic acid (C18:3 n-3 (ALA)) | 0.33 d ± 0.103 | 0.48 e ± 0.149 | 0.45 f ± 0.121 | 1.64 ± 0.247 |
| Cis 11,14-eicosadienoic acid (C20:2) | 0.98 a,b,d ± 0.282 | 0.64 e ± 0.332 | 0.40 f ± 0.084 | 0.00 |
| Dihono-γ-linolenic acid (C20:3 n-6 (DGLA)) | 0.74 a,b,d ± 0.274 | 0.49 e ± 0.139 | 0.34 f ± 0.098 | 0.00 |
| Arachidonic acid (C20:4 n-6 (AA)) | 0.72 a,b,d ± 0.321 | 0.46 ± 0.114 | 0.36 ± 0.073 | 0.31 ± 0.078 |
| Cis 13,16-docosadienoic acid (C22:2) | 0.03 ± 0.084 | 0.00 | 0.00 | 0.00 |
| Cis 4,7,10,13,16,19-docosahexadienoic acid (C22:6 n-3 (DHA)) | 0.47 ± 0.240 | 0.36 ± 0.140 | 0.33 ± 0.240 | 0.22 ± 0.099 |
| PUFA | 15.94 ± 2.504 | 17.80 ± 5.038 | 17.48 ± 5.828 | 17.55 ± 2.667 |
| UFA | 62.68 ± 6.83 | 63.07 ± 3.62 | 65.78 ± 5.88 | 60.94 ± 6.22 |
| SFA/UFA | 0.62 ± 0,20 | 0.59 ± 0,09 | 0.53 ± 0,14 | 0.64 ± 0.17 |
| n-3 PUFA | 0.77 d ± 0.308 | 0.84 e ± 0.165 | 0.79 f ± 0.350 | 1.81 ± 0.232 |
| n-6 PUFA | 14.11 a ± 2.333 | 16.38 ± 4.979 | 16.14 ± 5.907 | 14.83 ± 1.756 |
| LC-PUFA (C20-C24) | 3.06 a,b,d ± 0.641 | 1.85 c,e ± 0.381 | 1.43 f ± 0.260 | 0.54 ± 0.158 |
| LA/ALA | 38.15 d ± 17.980 | 32.03 e ± 10.030 | 31.30 f ± 15.370 | 9.53 ± 0.667 |
| AA/DHA | 1.74 ± 0.812 | 1.54 ± 0.683 | 1.43 ± 1.016 | 1.33 ± 0.361 |
| Discriminant Functions | Eigenvalue | Relative Percentage (%) | Canonical Correlation | Lambda De Wilks | Chi-Squared | p-Value |
|---|---|---|---|---|---|---|
| 1 | 126.3990 | 87.58 | 0.9961 | 0.0002 | 210.5987 | 0.0000 * |
| 2 | 15.9167 | 11.03 | 0.9610 | 0.0197 | 94.2629 | 0.0282 * |
| 3 | 2.0021 | 1.39 | 0.8166 | 0.3331 | 26.3837 | 0.8214 |
© 2019 by the authors. Licensee MDPI, Basel, Switzerland. This article is an open access article distributed under the terms and conditions of the Creative Commons Attribution (CC BY) license (http://creativecommons.org/licenses/by/4.0/).
Share and Cite
Sánchez-Hernández, S.; Esteban-Muñoz, A.; Giménez-Martínez, R.; Aguilar-Cordero, M.J.; Miralles-Buraglia, B.; Olalla-Herrera, M. A Comparison of Changes in the Fatty Acid Profile of Human Milk of Spanish Lactating Women during the First Month of Lactation Using Gas Chromatography-Mass Spectrometry. A Comparison with Infant Formulas. Nutrients 2019, 11, 3055. https://0-doi-org.brum.beds.ac.uk/10.3390/nu11123055
Sánchez-Hernández S, Esteban-Muñoz A, Giménez-Martínez R, Aguilar-Cordero MJ, Miralles-Buraglia B, Olalla-Herrera M. A Comparison of Changes in the Fatty Acid Profile of Human Milk of Spanish Lactating Women during the First Month of Lactation Using Gas Chromatography-Mass Spectrometry. A Comparison with Infant Formulas. Nutrients. 2019; 11(12):3055. https://0-doi-org.brum.beds.ac.uk/10.3390/nu11123055
Chicago/Turabian StyleSánchez-Hernández, Silvia, Adelaida Esteban-Muñoz, Rafael Giménez-Martínez, María José Aguilar-Cordero, Beatriz Miralles-Buraglia, and Manuel Olalla-Herrera. 2019. "A Comparison of Changes in the Fatty Acid Profile of Human Milk of Spanish Lactating Women during the First Month of Lactation Using Gas Chromatography-Mass Spectrometry. A Comparison with Infant Formulas" Nutrients 11, no. 12: 3055. https://0-doi-org.brum.beds.ac.uk/10.3390/nu11123055