Article

Modelling the Association between Core and Discretionary Energy Intake in Adults with and without Obesity

1
The Boden Institute of Obesity, Nutrition, Exercise & Eating Disorders, Charles Perkins Centre, University of Sydney, Sydney, NSW 2006, Australia
2
Sydney Health Economics, Sydney Local Health District, Sydney, NSW 2050, Australia
3
Division of Psychological & Social Medicine, Institute of Health Sciences, University of Leeds, Leeds LS2 9NL, UK
4
Nuffield Department of Primary Care Health Sciences, University of Oxford, Oxfordshire OX2 6GG, UK
*
Author to whom correspondence should be addressed.
Submission received: 19 February 2019 / Revised: 14 March 2019 / Accepted: 20 March 2019 / Published: 22 March 2019

Abstract

:
Background: Many dietary recommendations for weight control rely on the assumption that greater core food intake will displace intake of energy-dense discretionary foods and beverages. However, there is little evidence to support these assumptions. This study examined the naturalistic relationship between daily core and discretionary energy intake, and with discretionary food and discretionary beverage intake, separately. The impact of weight status on these associations was also examined. Method: One hundred participants completed a four-day (non-consecutive) estimated food diary. Discretionary foods and beverages were identified by reference to the Australian Dietary Guidelines. Non-discretionary items were considered core items. Simultaneous-equation random effects models using disaggregated dietary data controlling for sociodemographic variables were used to determine the association between various dietary components. Result: Core energy intake correlated negatively with discretionary energy intake (cross-equation correlation, ρ = −0.49 (95% CI: −0.57, −0.39)). Its correlation with discretionary foods (−0.47 (−0.56, −0.37)) was stronger than that with discretionary beverages (−0.19 (−0.30, −0.07)) The correlation between core energy intake and discretionary energy intake was significantly stronger in participants who did not have obesity (−0.67 (−0.71, −0.50)) than those with obesity (−0.32 (−0.46, −0.17)) (p = 0.0002). Conclusions: Core and discretionary energy intake share an inverse and potentially bidirectional, relationship that appears to be stronger with discretionary foods than discretionary beverages. These relationships were significantly weaker in participants with obesity which may indicate less precise dietary compensation in these individuals. While strategies that promote greater intake of core foods may assist with weight maintenance in individuals of healthy weight, its impact in individuals with obesity may be limited. These strategies should be accompanied by direct messages to reduce commensurately the intake of discretionary items, with special attention paid to discretionary beverage consumption.

1. Background

Energy-dense, nutrient-poor discretionary foods and beverages are a major component of Westernised food landscapes. Among the most popular items are cakes, confectionery, cereal/nut/fruit/seed bars, crisps, biscuits, alcoholic beverages and sugar sweetened beverages (SSBs) [1,2]. Within the context of a nutritious diet and adequate levels of physical activity, a small amount of discretionary energy can add variety and enjoyment to eating [3]. However, discretionary items are relatively cheap, promoted aggressively and available readily, and, as such, are consumed rarely within recommended levels. Due to their high sugar and/or fat content, discretionary items are inherently energy-dense, making them an important contributor to inadvertent overeating or “passive overconsumption” [4]. Around 35% of total energy intake (TEI) of adults in Australia [5] and the US [6,7] comes from discretionary items—US guidelines recommend a limit of 13% [8]. Excessive discretionary energy intake (DEI) has several implications. Perhaps of most concern is the positive association with TEI, subsequent weight gain, and risk of obesity. Nationally representative data for American adults have been used to demonstrate that those with the highest DEI have significantly greater TEI than those with lower DEI [9]. Substantive epidemiological research shows a positive association between DEI and BMI [2,10], and, accordingly, the World Health Organisation highlights the importance of reducing DEI to quell rates of obesity [11].
Rather than emphasising explicitly the restriction of DEI for weight control, clinical practice guidelines [12] and public health messages [13] tend to promote greater intake of non-discretionary core foods. Core foods include cereals and grains, lean meat and plant-based proteins, low fat dairy products, fruits and vegetables. These foods have relatively low energy-density, are satiating [14,15], and fruit and vegetable intake in particular has been shown to be associated negatively with DEI [2,10]. However, findings of RCTs promoting greater fruit and vegetable intake for weight loss do not support its efficacy in adults [16,17,18] or children [19] with overweight or obesity, a finding confirmed in a recent systematic review and meta-analysis [20]. Therefore, to improve the effectiveness of dietary recommendations for weight management, an examination of the underlying assumptions, and a clearer understanding of the relationship between DEI and intake of core foods is needed.
Importantly, these recommendations are predicated on the assumption that core and discretionary intakes share an inverse relationship, connoting dietary compensation, i.e., eating more core foods will be accompanied by a compensatory reduction in discretionary intake, thereby maintaining TEI and promoting weight stability and potentially weight loss [21,22]. However, empirical evidence to support this assumption is sparse and limited in its examination of dietary composition. Field studies in adults conducted over several days observe compensation in overall energy intake [23,24], yet dietary composition is not assessed. Houchins and colleagues [25] observed that, when provided with fruits and vegetables surplus to their habitual diet, participants of healthy weight compensated for this additional energy and their weight remained stable. However, participants with obesity exhibited weaker dietary compensation, which precipitated as significant weight gain over eight weeks. Interestingly, in one field study, the authors observed that TEI was greater on days that participants consumed SSBs, indicative of poorer dietary compensation induced by beverage consumption [23]. This is concordant with growing evidence purporting weaker satiety and appetitive responses following consumption of SSBs and other nutritive beverages compared to nutritionally-matched solid foods [25,26,27,28]. As such, energy obtained from discretionary beverages may be a significant driver of total energy intake, as suggested by findings of several studies showing a stronger relationship between discretionary beverages and BMI, than with discretionary foods [10,29]. Therefore, examining separately the relationships of discretionary foods and discretionary beverages with core energy intake (CEI) across BMI categories is warranted.
To develop a more accurate understanding of the relationship between core and discretionary intake with real-life applicability, several factors need to be considered. First, the relationship between core and discretionary intake may be bidirectional. In previous work examining the association of fruit and vegetable intake and DEI [2,10], DEI is modelled as the dependent variable and fruit and vegetable intake is included as an explanatory variable. This specification implies a unidirectional association, i.e., fruit and vegetable intake affects DEI. However, it is plausible that this relationship also occurs in the opposite direction, i.e., DEI may also affect fruit and vegetable intake [9]. Second, several sociodemographic factors have been associated consistently with both core [2,30] and discretionary intake [2,9,10]. Therefore, analyses that account for these sociodemographic factors (such as age, sex, socioeconomic status, education) in both dietary components are needed. Third, while fruit and vegetable intake and weight control has been studied widely, to the best of the authors’ knowledge, research examining overall core food intake is virtually absent despite evidence showing that foods such as nuts [31,32], legumes [10], wholegrains [33] and low-fat dairy products [2] are also associated with weight control. Studying total CEI may reflect a more flexible and real-world approach than studying fruit and vegetable intake exclusively, especially given that several barriers may prevent the adoption of their increased consumption, e.g., taste aversion [34,35,36] and perceived greater cost [37].
To address existing knowledge gaps, the primary aim of the current study was to determine the intraindividual associations between daily CEI and DEI, and to determine those between CEI and daily discretionary foods and discretionary beverage, separately. The secondary aim was to determine the impact of weight status on the relationship between these dietary variables. We hypothesised that CEI would correlate negatively with DEI and that this correlation would be stronger with discretionary foods than discretionary beverages. It was also hypothesised that these correlations would be weaker in participants with obesity. Simultaneous-equation models were used to control for multiple variables and to account for the potential bidirectionality of the associations between dietary components.

2. Methods

2.1. Study Participants

One hundred adults were recruited, 50 of healthy weight (BMI 18.5–24.9 kg/m2) and 50 with obesity (BMI ≥ 30.0 kg/m2). Participants were recruited through a post on the University of Sydney research volunteer website, flyers posted around the University campus and advertisements emailed to registrants of the Boden Institute clinical trials database. The advertisements invited individuals to participate in a study investigating a broad range of eating behaviours and their relationship to weight control. The advertisement did not state explicitly the authors’ intention to examine discretionary intake to reduce the risk of social desirability bias and subsequent underreporting. Participants provided informed written consent prior to study enrolment. To be eligible to participate, participants needed to be aged ≥18 years and able to complete the study materials adequately. Participants were excluded from the study if they: were currently enrolled in a weight management program, were on a restrictive diet, had gained or lost 5% of their body weight in the previous three months, were shift workers, were currently pregnant or breast feeding, had an eating disorder, had previous bariatric surgery, or were currently/previously enrolled in a nutrition degree.

2.2. Anthropometry

Height was measured to the nearest centimetre using a wall mounted stadiometer. Weight was measured to the nearest 0.1 kg using calibrated, digital scales. BMI was calculated in kg/m2. Measures were collected with participants in light clothing and shoes removed. Waist circumference was measured at the mid-point between the highest point of the iliac crest and lowest part of the costal margin in the midaxillary line. Measurements were record to the nearest 0.5 cm.

2.3. Background Questionnaires

Participants completed a questionnaire at Visit 1 that collected demographic information including age, sex, education level, health status and postcode. The latter was used to determine participants’ socioeconomic indexes for areas (SIEFA) decile, which provided a broad measure of socio-economic status [38].

2.4. Dietary Intake

Participants completed a non-consecutive, four-day estimated food diary comprising three weekdays and one weekend day. At Visit 1, the study dietitian educated participants on how to record intake as accurately as possible and encouraged participants to maintain their usual diet during the recoding period. Participants recorded the time of consumption, the food/beverage description (type, varietal specifications, e.g., low-fat, product name, and cooking method) and estimated portion-size using weights, volumes, dimensions (height × width × depth) and household measures. At Visit 2, the study dietitian assessed the food diary for completeness and prompted participants for clarification or additional information where required.

2.5. Nutrient Analysis and Coding

Dietary data were analysed using Xyris Foodworks Nutrition Analysis software (version 9, High Gate Hill, Australia) [39]. TEI was extracted from analyses and all energy-yielding foods and beverages were categorised as either DEI or CEI. Food and beverages that contributed to DEI were identified by the study dietitian with reference to the Australian Dietary Guidelines [3] and methods used in previous studies [40,41]. CEI were foods and beverages that did not meet criteria for discretionary items and comprised several food groups including low-fat dairy products and alternatives, legumes, fruits, vegetables, lean meat, grains and cereals. All items that contributed to DEI were categorised as either foods or beverages. Semi-solid discretionary items such as high fat yoghurts and soups were classified as foods given that these items have been shown to elicit high satiety [42] and are usually eaten as foods with cutlery as opposed to consumed as a drink. For the purposes of this research, full fat milk added to cereal was not considered a discretionary beverage. Drinks with dissolved nutrients, e.g., sugar added to teas and coffees, cordials and flavouring powders, were considered discretionary in line with the Beverage Guidance Panel recommendations [43].

2.6. Validity of Dietary Intake

Reported energy intake was assessed for validity using the Goldberg method [44], which involves calculating the ratio between reported TEI and BMR based on the Harris Benedict equation [45]. A ratio of less than 0.9 indicates that reported TEI is not consistent with energy intake required for a normal (non-bedbound) lifestyle. Participants whose reported energy intake yielded TEI:BMR <0.9 were considered under reporters and their data excluded from analyses.

2.7. Study Procedures

Anthropometric measurements were collected, baseline questionnaires were administered, and a four-day estimate food diary was dispensed at Visit 1. The study materials were returned to the researcher approximately ten days later at Visit 2. Participants received a $30 voucher recompense. The study was approved by the Sydney Local Health District Human Research Ethics Committee (Protocol Number X17-0228).

2.8. Statistical Analysis

Dietary data were disaggregated to assess the individual-level, daily relationship of dietary components. Multi-equation multi-level models were used to estimate the relationship between dietary components. Specifically, TEI (kJ), DEI (kJ), CEI (kJ), %TEI from DEI, %TEI from CEI, discretionary beverages (kJ) and discretionary foods (kJ) were modelled using simultaneous-equation random effects models, with random effects specified at the individual level [46]. All the specifications controlled for sex, age (<35 years, 35–64 years, or ≥65 years), education (completed post high school education or not), obesity status, day of the week energy intake was reported (weekend or weekday) and socioeconomic status (SEIFA top quintile (highest level of socioeconomic status)) or below). Estimated results from the simultaneous-equation random effects models are presented as the observation-level cross-equation correlation, ρ (95% Confidence Intervals (CI)). All tests of significance of the explanatory variables were conducted at the significance level of 0.05. Analyses were performed using Stata software version 14.0 [47].
A visual representation of the relationships between various dietary components and the modelling strategies that were studied is presented in Figure 1. Four multi-equation models were estimated: equations of TEI and proportion of TEI from DEI (%DEI/TEI) (Model 1), equations of TEI and proportion of TEI from CEI (%CEI/TEI) (Model 2), equations of DEI and CEI (Model 3), and equations of discretionary foods, discretionary beverages, and CEI (Model 4).

3. Results

The reported TEI of seven participants yielded a Goldberg ratio of <0.9. These participants were excluded and the data for 93 participants formed the analysis sample. Most participants were female (79), their mean age was 45.7 years (SD = 21.0), and 47 had obesity. Participants provided a total of 368 daily food diary entries. The sample mean TEI was 8477 kJ/day (SD = 1893). Discretionary intake was 39.8% (SD = 16.8) of TEI, of which a mean of 12.0% (SD = 13.9) was from beverages.

3.1. Relationship between Sociodemographic Variables and DEI and CEI

The estimates from simultaneous-equation random effects model of CEI and DEI with the sociodemographic factors included as covariates are shown in Table 1. In the combined sample, participants aged 35–64 years (−1246 kJ (−2355, −136)) or ≥65 years (−2281 kJ (−3494, −1068)) consumed less DEI than those aged <35 years, holding all other variables constant. Participants with obesity consumed more DEI (1313 kJ (253, 2373)) and TEI recorded on a weekend day was greater than TEI recorded on a weekday (650 kJ (118, 1182)). Males consumed more CEI than females (2313 kJ (1430, 3196)), and those in the top SEIFA quintile (representing greater socioeconomic advantage) consumed less CEI (−855 kJ (−1561, −149)).

3.2. Relationship between TEI, DEI, and CEI by Obesity Status

The estimated cross-equation correlations between the various dietary components adjusting for sociodemographic factors are shown in Table 2 and are presented diagrammatically in Figure 2a–c. TEI correlated positively with %DEI/TEI (0.32 (0.17, 0.46)) (Model 1) and negatively with %CEI/TEI (−32 (−45, −18)) (Model 2). DEI was negatively correlated with CEI (−0.49 (−0.57, −0.39)). CEI correlated more strongly with discretionary foods (−0.47 (−0.56, −0.37)) than with discretionary beverages (−0.19 (−0.30, −0.07)) (Model 4).
The correlation between DEI and CEI was significantly stronger in participants of healthy weight (−0.62 (−0.71, −0.50)) than those with obesity (−0.32 (−0.46, −0.17)) (p = 0.0002). While discretionary beverage intake in both groups was correlated negatively with CEI, this was only statistically significant in participants of healthy weight (−0.29 (−0.43, −0.13)).

4. Discussion

This study examined and modelled the intraindividual relationship between daily CEI and DEI in adults, which, to the best of the authors’ knowledge, has not been undertaken previously in this literature. CEI and DEI were correlated negatively, although this was weaker for energy intake from discretionary beverages. The modest inverse association of CEI with DEI was weaker in participants with obesity. These associations appeared additive, such that, for participants with obesity, energy intake from discretionary beverages did not offset CEI.
That daily DEI and CEI correlated negatively confirms previous assumptions that these two variables are discrete dietary components that share an inverse relationship in the absence of dietary intervention. A change in the intake of one variable corresponded to a change in the other in the opposite direction. The precise reasons for this observation cannot be determined with certainty, although likely involve homeostatic mechanisms that seek to maintain TEI. While previous naturalistic studies conducted over several days have reported energy compensation [48], research investigating specific food types is lacking. Given the current findings, hypothetically, energy intake from discretionary items may be off-set by a compensatory reduction in energy from core foods so that TEI remains relatively stable, mitigating the increased risk of weight gain. This may explain why some individuals who consume a relatively high proportion of discretionary energy are able to maintain a healthy weight. Dietary compensation has physiological origins involving neuroendocrinological mechanisms that enhance satiety and attenuate further eating in order to maintain energy homeostasis. However, cognitive behavioural influences may also be involved. For instance, Lenne and colleagues observed that over one third of adults surveyed reported pre-emptively adjusting eating behaviour prior to dietary transgressions at a state fair, such as eating less or choosing more healthy foods, referred to as pre-compensation [49].
The strength of this relationship was significantly weaker in participants who had obesity. To give real-life context, intake of one dietary component may not be accompanied by a reduction in the other of the same magnitude in these individuals. This suggests that increased intake of core foods may not displace DEI in these individuals due to less stringent and less precise dietary compensation. This is concordant with previous observations whereby additional energy commensurate to the provision of fruits and vegetables was compensated for by participants of healthy weight, but not by those with obesity [25]. Similarly, an empirical feeding study in adolescents found that TEI was significantly greater on fast-food days compared to non-fast-food days in adolescents with overweight. This was not observed in healthy weight counterparts [50], indicating a compensatory reduction in subsequent energy intake in these participants.
Separating DEI into foods and beverages enabled a more detailed examination of the relationship between DEI and CEI. CEI was correlated more strongly with discretionary foods than with discretionary beverages. In theory, intake of a discretionary beverage may not be accompanied by a reduction in CEI of the same magnitude as that induced by discretionary food. This finding is consistent with a growing body of literature reporting weaker appetitive responses and poorer dietary compensation associated with consumption of beverages compared to solid food, regardless of macronutrient composition [25,26,28,51]. While there is still conjecture surrounding the exact mechanisms that drive this observation, several theories have garnered supportive evidence. Beverages have faster gastric transit times [52,53], demand less oral processing [54,55], reduce ghrelin suppression [27,56] and evoke lower cognitive perception of expected satiety [27,29]. Each of these factors contributes ostensibly to lower post-ingestive satiety or the perception thereof, compared to solid foods.
Several physiological, psychological and behavioural factors may contribute to the slight “decoupling” of CEI and DEI in participants with obesity. Extensive research shows that satiety responsiveness in individuals with obesity is weaker than in those of a healthy weight [57,58,59]. Moreover, problematic eating behaviours and psychological traits such as disinhibited eating [60], food-related cue reactivity [61], reward from eating [62] and counterregulatory eating following breach of dietary restraint [63] are purportedly heightened and more prevalent in individuals with obesity. In addition, poor energy compensation associated with beverage consumption may be more pronounced in participants with obesity; however, current evidence remains inconclusive [26,28]. Together, these factors may work to decouple DEI from CEI, resulting in dysregulated energy compensation in these individuals. It is also possible that other sociodemographic factors that were unaccounted for in the current study contributed to this difference, e.g., nutrition knowledge, income.
These findings have practical implications for developing dietary recommendations for weight management at a clinical and public health level. First, they challenge popular advice that prioritises greater core food intake in order to displace DEI for weight loss. The negative correlation between DEI and CEI was relatively weak in participants who had obesity. Increasing intake of core foods without a substantial, commensurate reduction in other dietary components may lead to increased body weight if continued. Strategies that encourage increased core intake combined with specific recommendations to restrict DEI [15] and education on behavioural energy compensation may be more effective for weight loss. Second, the consumption of discretionary beverages warrants special attention given its relatively weak and negative correlation with CEI. While moderation of SSB consumption has been adopted into wider public discourse and policy, this has not been extended to other energy-yielding beverages. This message may be especially pertinent for individuals with obesity who appear to consume a greater proportion of DEI from beverages [10].
The empirical methodology used in this study has several strengths. Collecting participants’ dietary intake using four-day estimated food diaries provided rich, quantitative data without compromising its integrity due to respondent fatigue as with seven-day diaries [64]. Investigating total CEI rather than fruit and vegetable intake exclusively provided more real-world applicability, especially given that several barriers may prevent the adoption of greater vegetable intake [35,36,37]. Analysing these data in a disaggregated form, such that each day was a separate observation, facilitated the investigation of over 360 unique observations. This enabled the analysis of the daily, individual-level relationship of dietary components, which, to the best of the authors’ knowledge, has not been done previously. The use of simultaneous-equation models accommodated for the putative bidirectional relationship between dietary components and controlled contemporaneously for sociodemographic factors associated with both DEI and CEI. This statistical approach provided a more real-world and accurate estimate of their relationship beyond single equation regressions.
The findings presented in this study are limited by a few factors. The direction of the relationships between dietary variables cannot be determined within the scope of the study’s design. In addition, most participants were female, limiting the generalisability of findings to the wider population. Further, it is possible that the current observations may be explained by other factors that were not accounted for in the current study. For instance, addictive behaviours, such as smoking, may drive the intake of discretionary foods [65] but was not included as a covariate in analyses. Future research would benefit from accounting for factors such as nutrition education, income and addictive behaviours to reduce the impact of potential confounders. In addition, previous work has shown that corrective dietary responses may occur three to four days following deviations from average energy intake [24]. Accounting for this lag time in future work may provide a better understanding of the temporal relationship between DEI and CEI.

5. Conclusions

In summary, DEI and CEI appear to share a natural, inverse, and potentially bidirectional relationship that may be indicative of dietary compensation. The correlation of CEI with discretionary beverages was weaker than its correlation with discretionary foods, suggesting that dietary compensation is less complete on days that beverages are consumed. In general, the relationships between these dietary components were weaker in participants with obesity, which may connote weaker dietary adjustment in these individuals. Our findings suggest that promotion of core food consumption may assist with weight maintenance in participants of healthy weight, but its impact in individuals with obesity may be limited. Increased core food consumption is unlikely to have meaningful effect as a weight loss strategy if it is the only strategy implemented and should be accompanied by direct messages to reduce commensurately the intake of discretionary items, with special attention paid to discretionary beverage consumption.

Author Contributions

M.F. conceptualised the study, collected the data, formed data analysis design, interpreted the data, wrote the initial draft manuscript and had responsibility for the final manuscript. A.L. and M.C. assisted with specifying and estimating the econometric models, assisted with data interpretation and critically reviewed and revised the manuscript. A.J.H., M.R.S., C.D.M. and I.D.C. critically reviewed and revised the manuscript.

Funding

This research received no external funding.

Conflicts of Interest

The authors declare no competing financial interests.

Abbreviations

CEIcore energy intake
DEIdiscretionary energy intake
SEIFA socioeconomic indexes for areas
SSBsugar-sweetened beverage
TEItotal energy intake

References

  1. Australian Bureau of Statistics. Australian Health Survey: Nutrition First Results—Foods and Nutrients, 2011−12 2015. Available online: http://www.abs.gov.au/ausstats/[email protected]/Lookup/by%20Subject/4364.0.55.007~2011-12~Main%20Features~Discretionary%20foods~700 (accessed on 17 September 2018).
  2. Cohen, D.A.; Sturm, R.; Scott, M.; Farley, T.A.; Bluthenthal, R. Not Enough Fruit and Vegetables or Too Many Cookies, Candies, Salty Snacks, and Soft Drinks? Public Health Rep. 2010, 125, 88–95. [Google Scholar] [CrossRef] [PubMed]
  3. National Health and Medical Research Council. Australian Dietary Guidelines Canberra: Australian Government Department of Health. 2013. Available online: https://www.nhmrc.gov.au/_files_nhmrc/publications/attachments/n55_australian_dietary_guidelines_130530.pdf (accessed on 17 September 2018).
  4. Blundell, J.E.; Macdiarmid, J.I. Passive overconsumption. Fat intake and short-term energy balance. Ann. N. Y. Acad. Sci. 1997, 827, 392–407. [Google Scholar] [CrossRef] [PubMed]
  5. Australian Bureau of Statistics. National Health Survey: First Results, 2014–2015 Canberra, Australia: The Australian Government. 2015. Available online: http://www.abs.gov.au/ausstats/[email protected]/Lookup/by%20Subject/4364.0.55.001~2014-15~Main%20Features~Overweight%20and%20obesity~22 (accessed on 2 December 2018).
  6. Tak, N.I.; Velde, S.J.; Singh, A.S.; Brug, J. The effects of a fruit and vegetable promotion intervention on unhealthy snacks during mid-morning school breaks: Results of the Dutch Schoolgruiten Project. J. Hum. Nutr. Diet. 2010, 23, 609–615. [Google Scholar] [CrossRef] [PubMed]
  7. Øverby, N.C.; Klepp, K.-I.; Bere, E. Introduction of a school fruit program is associated with reduced frequency of consumption of unhealthy snacks. Am. J. Clin. Nutr. 2012, 96, 1100–1103. [Google Scholar] [CrossRef] [PubMed] [Green Version]
  8. Department of Health and Human Services. Nutrition and Your Health: Dietary Guidelines for Americans. Part D: Discretionary Calories. 2005. Available online: https://health.gov/dietaryguidelines/dga2005/report/HTML/D3_DiscCalories.htm (accessed on 2 December 2018).
  9. Kant, A.K. Consumption of energy-dense, nutrient-poor foods by adult Americans: Nutritional and health implications. The third National Health and Nutrition Examination Survey, 1988–1994. Am. J. Clin. Nutr. 2000, 72, 929–936. [Google Scholar] [CrossRef] [PubMed]
  10. Sui, Z.X.; Wong, W.K.; Louie, J.C.Y.; Rangan, A. Discretionary food and beverage consumption and its association with demographic characteristics, weight status, and fruit and vegetable intakes in Australian adults. Public Health Nutr. 2017, 20, 274–281. [Google Scholar] [CrossRef]
  11. World Health Organization. The Challenge of Obesity in the WHO European Region and the Strategies for Response; World Health Organisation: Copenhagen, Denmark, 2007. [Google Scholar]
  12. National Health and Medical Research Council. Clinical Practice Guidelines for the Management of Overweight and Obesity in Adults, Adolescents and Children in Australia; Department on Health and Ageing: Canberra, Australia, 2013.
  13. Capacci, S.; Mazzocchi, M.; Shankar, B.; Brambila Macias, J.; Verbeke, W.; Pérez-Cueto, F.J.; Kozioł-Kozakowska, A.; Piórecka, B.; Niedzwiedzka, B.; D’addesa, D.; et al. Policies to promote healthy eating in Europe: A structured review of policies and their effectiveness. Nutr. Rev. 2012, 70, 188–200. [Google Scholar] [CrossRef]
  14. Bell, E.A.; Rolls, B.J. Energy density of foods affects energy intake across multiple levels of fat content in lean and obese women. Am. J. Clin. Nutr. 2001, 73, 1010–1018. [Google Scholar] [CrossRef] [Green Version]
  15. Rolls, B.J.; Ello-Martin, J.A.; Tohill, B.C. What Can Intervention Studies Tell Us about the Relationship between Fruit and Vegetable Consumption and Weight Management? Blackwell Publishing Ltd.: Oxford, UK, 2004; pp. 1–17. [Google Scholar]
  16. Tanumihardjo, S.A.; Valentine, A.R.; Zhang, Z.; Whigham, L.D.; Lai, H.J.; Atkinson, R.L. Strategies to Increase Vegetable or Reduce Energy and Fat Intake Induce Weight Loss in Adults. Exp. Biol. Med. 2009, 234, 542–552. [Google Scholar] [CrossRef] [PubMed]
  17. Tapsell, L.C.; Batterham, M.J.; Thorne, R.L.; O’shea, J.E.; Grafenauer, S.J.; Probst, Y.C. Weight loss effects from vegetable intake: A 12-month randomised controlled trial. Eur. J. Clin. Nutr. 2014, 68, 778. [Google Scholar] [CrossRef]
  18. Lapointe, A.; Weisnagel, S.J.; Provencher, V.; Begin, C.; Dufour-Bouchard, A.A.; Trudeau, C.; Lemieux, S. Using restrictive messages to limit high-fat foods or nonrestrictive messages to increase fruit and vegetable intake: What works better for postmenopausal women? Eur. J. Clin. Nutr. 2010, 64, 194–202. [Google Scholar] [CrossRef]
  19. Looney, S.M.; Raynor, H.A. Are changes in consumption of “Healthy” foods related to changes in consumption of “Unhealthy” foods during pediatric obesity treatment? Int. J. Environ. Res. Public Health 2012, 9, 1368–1378. [Google Scholar] [CrossRef] [PubMed]
  20. Kaiser, K.A.; Brown, A.W.; Bohan Brown, M.M.; Shikany, J.M.; Mattes, R.D.; Allison, D.B. Increased fruit and vegetable intake has no discernible effect on weight loss: A systematic review and meta-analysis. Am. J. Clin. Nutr. 2014, 100, 567–576. [Google Scholar] [CrossRef] [PubMed]
  21. Huda, M.S.B.; Wilding, J.P.H.; Pinkney, J.H. Gut peptides and the regulation of appetite. Obes. Rev. 2006, 7, 163–182. [Google Scholar] [CrossRef] [PubMed]
  22. Yao, M.; Roberts, S.B. Dietary energy density and weight regulation. Nutr. Rev. 2001, 59, 247–258. [Google Scholar] [CrossRef] [PubMed]
  23. McKiernan, F.; Hollis, J.H.; Mattes, R.D. Short-term dietary compensation in free-living adults. Physiol. Behav. 2008, 93, 975–983. [Google Scholar] [CrossRef] [PubMed]
  24. Bray, G.A.; Flatt, J.-P.; Volaufova, J.; DeLany, J.P.; Champagne, C.M. Corrective responses in human food intake identified from an analysis of 7-d food-intake records. Am. J. Clin. Nutr. 2008, 88, 1504–1510. [Google Scholar] [CrossRef] [PubMed]
  25. Houchins, J.A.; Tan, S.Y.; Campbell, W.W.; Mattes, R.D. Effects of fruit and vegetable, consumed in solid vs beverage forms, on acute and chronic appetitive responses in lean and obese adults. Int. J. Obes. 2013, 37, 1109–1115. [Google Scholar] [CrossRef]
  26. Mourao, D.M.; Bressan, J.; Campbell, W.W.; Mattes, R.D. Effects of food form on appetite and energy intake in lean and obese young adults. Int. J. Obes. 2007, 31, 1688–1695. [Google Scholar] [CrossRef] [Green Version]
  27. Cassady, B.A.; Considine, R.V.; Mattes, R.D. Beverage consumption, appetite, and energy intake: What did you expect? Am. J. Clin. Nutr. 2012, 95, 587–593. [Google Scholar] [CrossRef] [PubMed]
  28. Mattes, R.; Campbell, W. Effects of food form and timing of ingestion on appetite and energy intake in lean young adults and in young adults with obesity. J. Am. Diet. Assoc. 2009, 109, 430–437. [Google Scholar] [CrossRef] [PubMed]
  29. DiMeglio, D.P.; Mattes, R.D. Liquid versus solid carbohydrate: Effects on food intake and body weight. Int. J. Obes. 2000, 24, 794–800. [Google Scholar] [CrossRef]
  30. Peltzer, K.; Pengpid, S. Correlates of healthy fruit and vegetable diet in students in low, middle and high income countries. Int. J. Public Health 2015, 60, 79–90. [Google Scholar] [CrossRef]
  31. Tan, S.Y.; Dhillon, J.; Mattes, R.D. A review of the effects of nuts on appetite, food intake, metabolism, and body weight. Am. J. Clin. Nutr. 2014, 100, 412S–422S. [Google Scholar] [CrossRef] [PubMed]
  32. Barbour, J.A.; Stojanovski, E.; Moran, L.J.; Howe, P.R.C.; Coates, A.M. The Addition of Peanuts to Habitual Diets is Associated with Lower Consumption of Savory Non-Core Snacks by Men and Sweet Non-Core Snacks by Women. Nutr. Res. 2017, 41, 65–72. [Google Scholar] [CrossRef] [PubMed]
  33. Jonnalagadda, S.S.; Harnack, L.; Hai Liu, R.; McKeown, N.; Seal, C.; Liu, S.; Fahey, G.C. Putting the Whole Grain Puzzle Together: Health Benefits Associated with Whole Grains—Summary of American Society for Nutrition 2010 Satellite Symposium. J. Nutr. 2011, 141, 1011S–1122S. [Google Scholar] [CrossRef]
  34. Neumark-Sztainer, D.; Wall, M.; Perry, C.; Story, M. Correlates of fruit and vegetable intake among adolescents: Findings from Project EAT. Prev. Med. 2003, 37, 198–208. [Google Scholar] [CrossRef]
  35. Krebs-Smith, S.M.; Heimendinger, J.; Patterson, B.H.; Subar, A.F.; Kessler, R.; Pivonka, E. Psychosocial Factors Associated with Fruit and Vegetable Consumption. Am. J. Health Promot. 1995, 10, 98–104. [Google Scholar] [CrossRef] [PubMed]
  36. Guillaumie, L.; Godin, G.; Vézina-Im, L.-A. Psychosocial determinants of fruit and vegetable intake in adult population: A systematic review. Int. J. Behav. Nutr. Phys. Act. 2010, 7, 12. [Google Scholar] [CrossRef]
  37. John, J.H.; Ziebland, S. Reported barriers to eating more fruit and vegetables before and after participation in a randomized controlled trial: A qualitative study. Health Educ. Res. 2004, 19, 165–174. [Google Scholar] [CrossRef] [PubMed]
  38. Australian Bureau of Statistics. Socio-Economic Index for Australia 2011; Census of Population and Housing; The Government of Australia: Canberra, Australia, 2013.
  39. FoodWorks 9. Professional Edition 9.0.3973 ed.; Xyris: High Gate Hill, Australia, 2017. [Google Scholar]
  40. Kelly, B.; Halford, J.C.; Boyland, E.J.; Chapman, K.; Bautista-Castaño, I.; Berg, C.; Caroli, M.; Cook, B.; Coutinho, J.G.; Effertz, T.; et al. Television food advertising to children: A global perspective. Am. J. Public Health 2010, 100, 1730–1736. [Google Scholar] [CrossRef] [PubMed]
  41. Sainsbury, E.; Colagiuri, S.; Magnusson, R. An audit of food and beverage advertising on the Sydney metropolitan train network: Regulation and policy implications. Bmc Public Health 2017, 17, 490. [Google Scholar] [CrossRef] [PubMed]
  42. Flood, J.E.; Rolls, B.J. Soup preloads in a variety of forms reduce meal energy intake. Appetite 2007, 49, 626–634. [Google Scholar] [CrossRef] [Green Version]
  43. Popkin, B.M.; Armstrong, L.E.; Bray, G.M.; Caballero, B.; Frei, B.; Willett, W.C. A new proposed guidance system for beverage consumption in the United States. Am. J. Clin. Nutr. 2006, 83, 529–542. [Google Scholar] [CrossRef] [PubMed] [Green Version]
  44. Goldberg, G.R.; Black, A.E.; Jebb, S.A.; Cole, T.J.; Murgatroyd, P.R.; Coward, W.A.; Prentice, A.M. Critical evaluation of energy-intake data using fundamental principles of energy physiology—Derivation of cutoff limits to identify under-recording. Eur. J. Clin. Nutr. 1991, 45, 569–581. [Google Scholar]
  45. Harris, J.A.; Benedict, F.G. A Biometric Study of Human Basal Metabolism. Proc. Natl. Acad. Sci. USA 1918, 4, 370–373. [Google Scholar] [CrossRef] [PubMed]
  46. Greene, W.H. Econometric Analysis; Pearson Education: Delhi, Indian, 2003. [Google Scholar]
  47. StataCorp. Stata Statistical Software: Release 14; StataCorp LP: College Station, TX, USA, 2015. [Google Scholar]
  48. Almiron-Roig, E.; Palla, L.; Guest, K.; Ricchiuti, C.; Vint, N.; Jebb, S.A.; Drewnowski, A. Factors that determine energy compensation: A systematic review of preload studies. Nutr. Rev. 2013, 71, 458–473. [Google Scholar] [CrossRef] [PubMed]
  49. Lenne, R.L.; Panos, M.E.; Auster-Gussman, L.; Scherschel, H.; Zhou, L.; Mann, T. Behavioral compensation before and after eating at the Minnesota State Fair. Appetite 2017, 118, 113–119. [Google Scholar] [CrossRef]
  50. Ebbeling, C.B.; Sinclair, K.B.; Pereira, M.A.; Garcia-Lago, E.; Feldman, H.A.; Ludwig, D.S. Compensation for energy intake from fast food among overweight and lean adolescents. JAMA 2004, 291, 2828–2833. [Google Scholar] [CrossRef]
  51. Wiessing, K.R.; Xin, L.; Budgett, S.C.; Poppitt, S.D. No evidence of enhanced satiety following whey protein- or sucrose-enriched water beverages: A dose response trial in overweight women. Eur. J. Clin. Nutr. 2015, 69, 1238. [Google Scholar] [CrossRef]
  52. Glasbrenner, B.; Pieramico, O.; Brecht-Krau, D.; Baur, M.; Malfertheiner, P. Gastric emptying of solids and liquids in obesity. Clin. Investig. 1993, 71, 542–546. [Google Scholar] [CrossRef] [PubMed]
  53. Hoad, C.L.; Rayment, P.; Spiller, R.C.; Marciani, L.; Alonso, B.D.; Traynor, C.; Mela, D.J.; Peters, H.P.; Gowland, P.A. In vivo imaging of intragastric gelation and its effect on satiety in humans. J. Nutr. 2004, 134, 2293–2300. [Google Scholar] [CrossRef] [PubMed]
  54. Lavin, J.H.; French, S.J.; Ruxton, C.H.S.; Read, N.W. An investigation of the role of oro-sensory stimulation in sugar satiety. Int. J. Obes. 2002, 26, 384–388. [Google Scholar] [CrossRef] [PubMed]
  55. French, S.J.; Cecil, J.E. Oral, gastric and intestinal influences on human feeding. Physiol. Behav. 2001, 74, 729–734. [Google Scholar] [CrossRef]
  56. Leidy, H.J.; Apolzan, J.W.; Mattes, R.D.; Campbell, W.W. Food form and portion size affect postprandial appetite sensations and hormonal responses in healthy, nonobese, older adults. Obesity 2010, 18, 293–299. [Google Scholar] [CrossRef] [PubMed]
  57. Blundell, J.E.; Gillett, A. Control of food intake in the obese. Obes. Res. 2001, 9, 263S–270S. [Google Scholar] [CrossRef]
  58. Speechly, D.P.; Buffenstein, R. Appetite dysfunction in obese males: Evidence for role of hyperinsulinaemia in passive overconsumption with a high fat diet. Eur. J. Clin. Nutr. 2000, 54, 225. [Google Scholar] [CrossRef]
  59. Dalton, M.; Hollingworth, S.; Blundell, J.; Finlayson, G. Weak satiety responsiveness is a reliable trait associated with hedonic risk factors for overeating among women. Nutrients 2015, 7, 7421–7436. [Google Scholar] [CrossRef]
  60. Hays, N.P.; Bathalon, G.P.; McCrory, M.A.; Roubenoff, R.; Lipman, R.; Roberts, S.B. Eating behavior correlates of adult weight gain and obesity in healthy women aged 55–65 y. Am. J. Clin. Nutr. 2002, 75, 476–483. [Google Scholar] [CrossRef]
  61. Hendrikse, J.J.; Cachia, R.L.; Kothe, E.J.; McPhie, S.; Skouteris, H.; Hayden, M.J. Attentional biases for food cues in overweight and individuals with obesity: A systematic review of the literature. Obes. Rev. 2015, 16, 424–432. [Google Scholar] [CrossRef]
  62. Stice, E.; Spoor, S.; Ng, J.; Zald, D.H. Relation of obesity to consummatory and anticipatory food reward. Physiol. Behav. 2009, 97, 551–560. [Google Scholar] [CrossRef] [PubMed]
  63. Van Strien, T.; Herman, C.P.; Verheijden, M.W. Dietary restraint and body mass change. A 3-year follow up study in a representative Dutch sample. Appetite 2014, 76, 44–49. [Google Scholar] [CrossRef] [PubMed]
  64. Gersovitz, M.; Madden, J.P.; Smiciklas-Wright, H. Validity of the 24-hr. dietary recall and seven-day record for group comparisons. J. Am. Diet. Assoc. 1978, 73, 48–55. [Google Scholar] [PubMed]
  65. Chao, A.M.; White, M.A.; Grilo, C.M.; Sinha, R. Examining the effects of cigarette smoking on food cravings and intake, depressive symptoms, and stress. Eat. Behav. 2017, 24, 61–65. [Google Scholar] [CrossRef] [PubMed]
Figure 1. The relationship between various dietary components assessed in the current study using simultaneous-equation random effects models. TEI, total energy intake; DEI, discretionary energy intake; CEI, core energy intake.
Nutrients 11 00683 g001
Figure 2. Diagrammatic representations of the correlations among TEI, CEI, DEI, discretionary foods and beverages in: (a) the combined participant sample; (b) participants without obesity; and (c) participants with obesity. Results are presented as cross-equation correlation ρ (95% CI). Models were adjusted for sex (male or female), age (<35 years, 35–64 years, or ≥65 years), education (completed post high school education or not), BMI category (has or does not have obesity), day of the week dietary intake was reported (weekend or weekday) and socioeconomic status (SEIFA top quintile or below). Correlations written in bold face are significant at the 5% level. TEI, total energy intake; DEI, discretionary energy intake; CEI, core energy intake.
Nutrients 11 00683 g002
Table 1. CEI and DEI and associations with sociodemographic variables.
Explanatory VariablesAll Participants (n = 93)
DEICEI
Male21 (−893, 935)2313 (1430, 3196)
35–64 years−1246 (−2355, −136)929 (−144, 2002)
≥65 years−2281 (−3494, −1068)519 (−654, 1691)
Completed or undertaking post-high school education−342 (−1022, 339)457 (−200, 1115)
Obesity1313 (253, 2373)−471 (−1496, 555)
Weekend650 (118, 1182)−161 (−577, 255)
Top SEIFA quintile153 (−577, 883)−855 (−1561, −149)
Results are from estimated simultaneous equation models with random effects. Results are presented as β coefficient (95% CI), where β represents the difference in energy intake (kJ) compared to the reference group who are female, aged below 35 years, have not completed/currently undertaking post-high school education, are of healthy weight, reporting dietary intake on weekdays and living in a relatively disadvantaged area with SEIFA below top quintile. Coefficients written in bold face are significant at the 5% level. DEI, discretionary energy intake; CEI, core energy intake.
Table 2. Correlations between dietary components in the total sample and by obesity status.
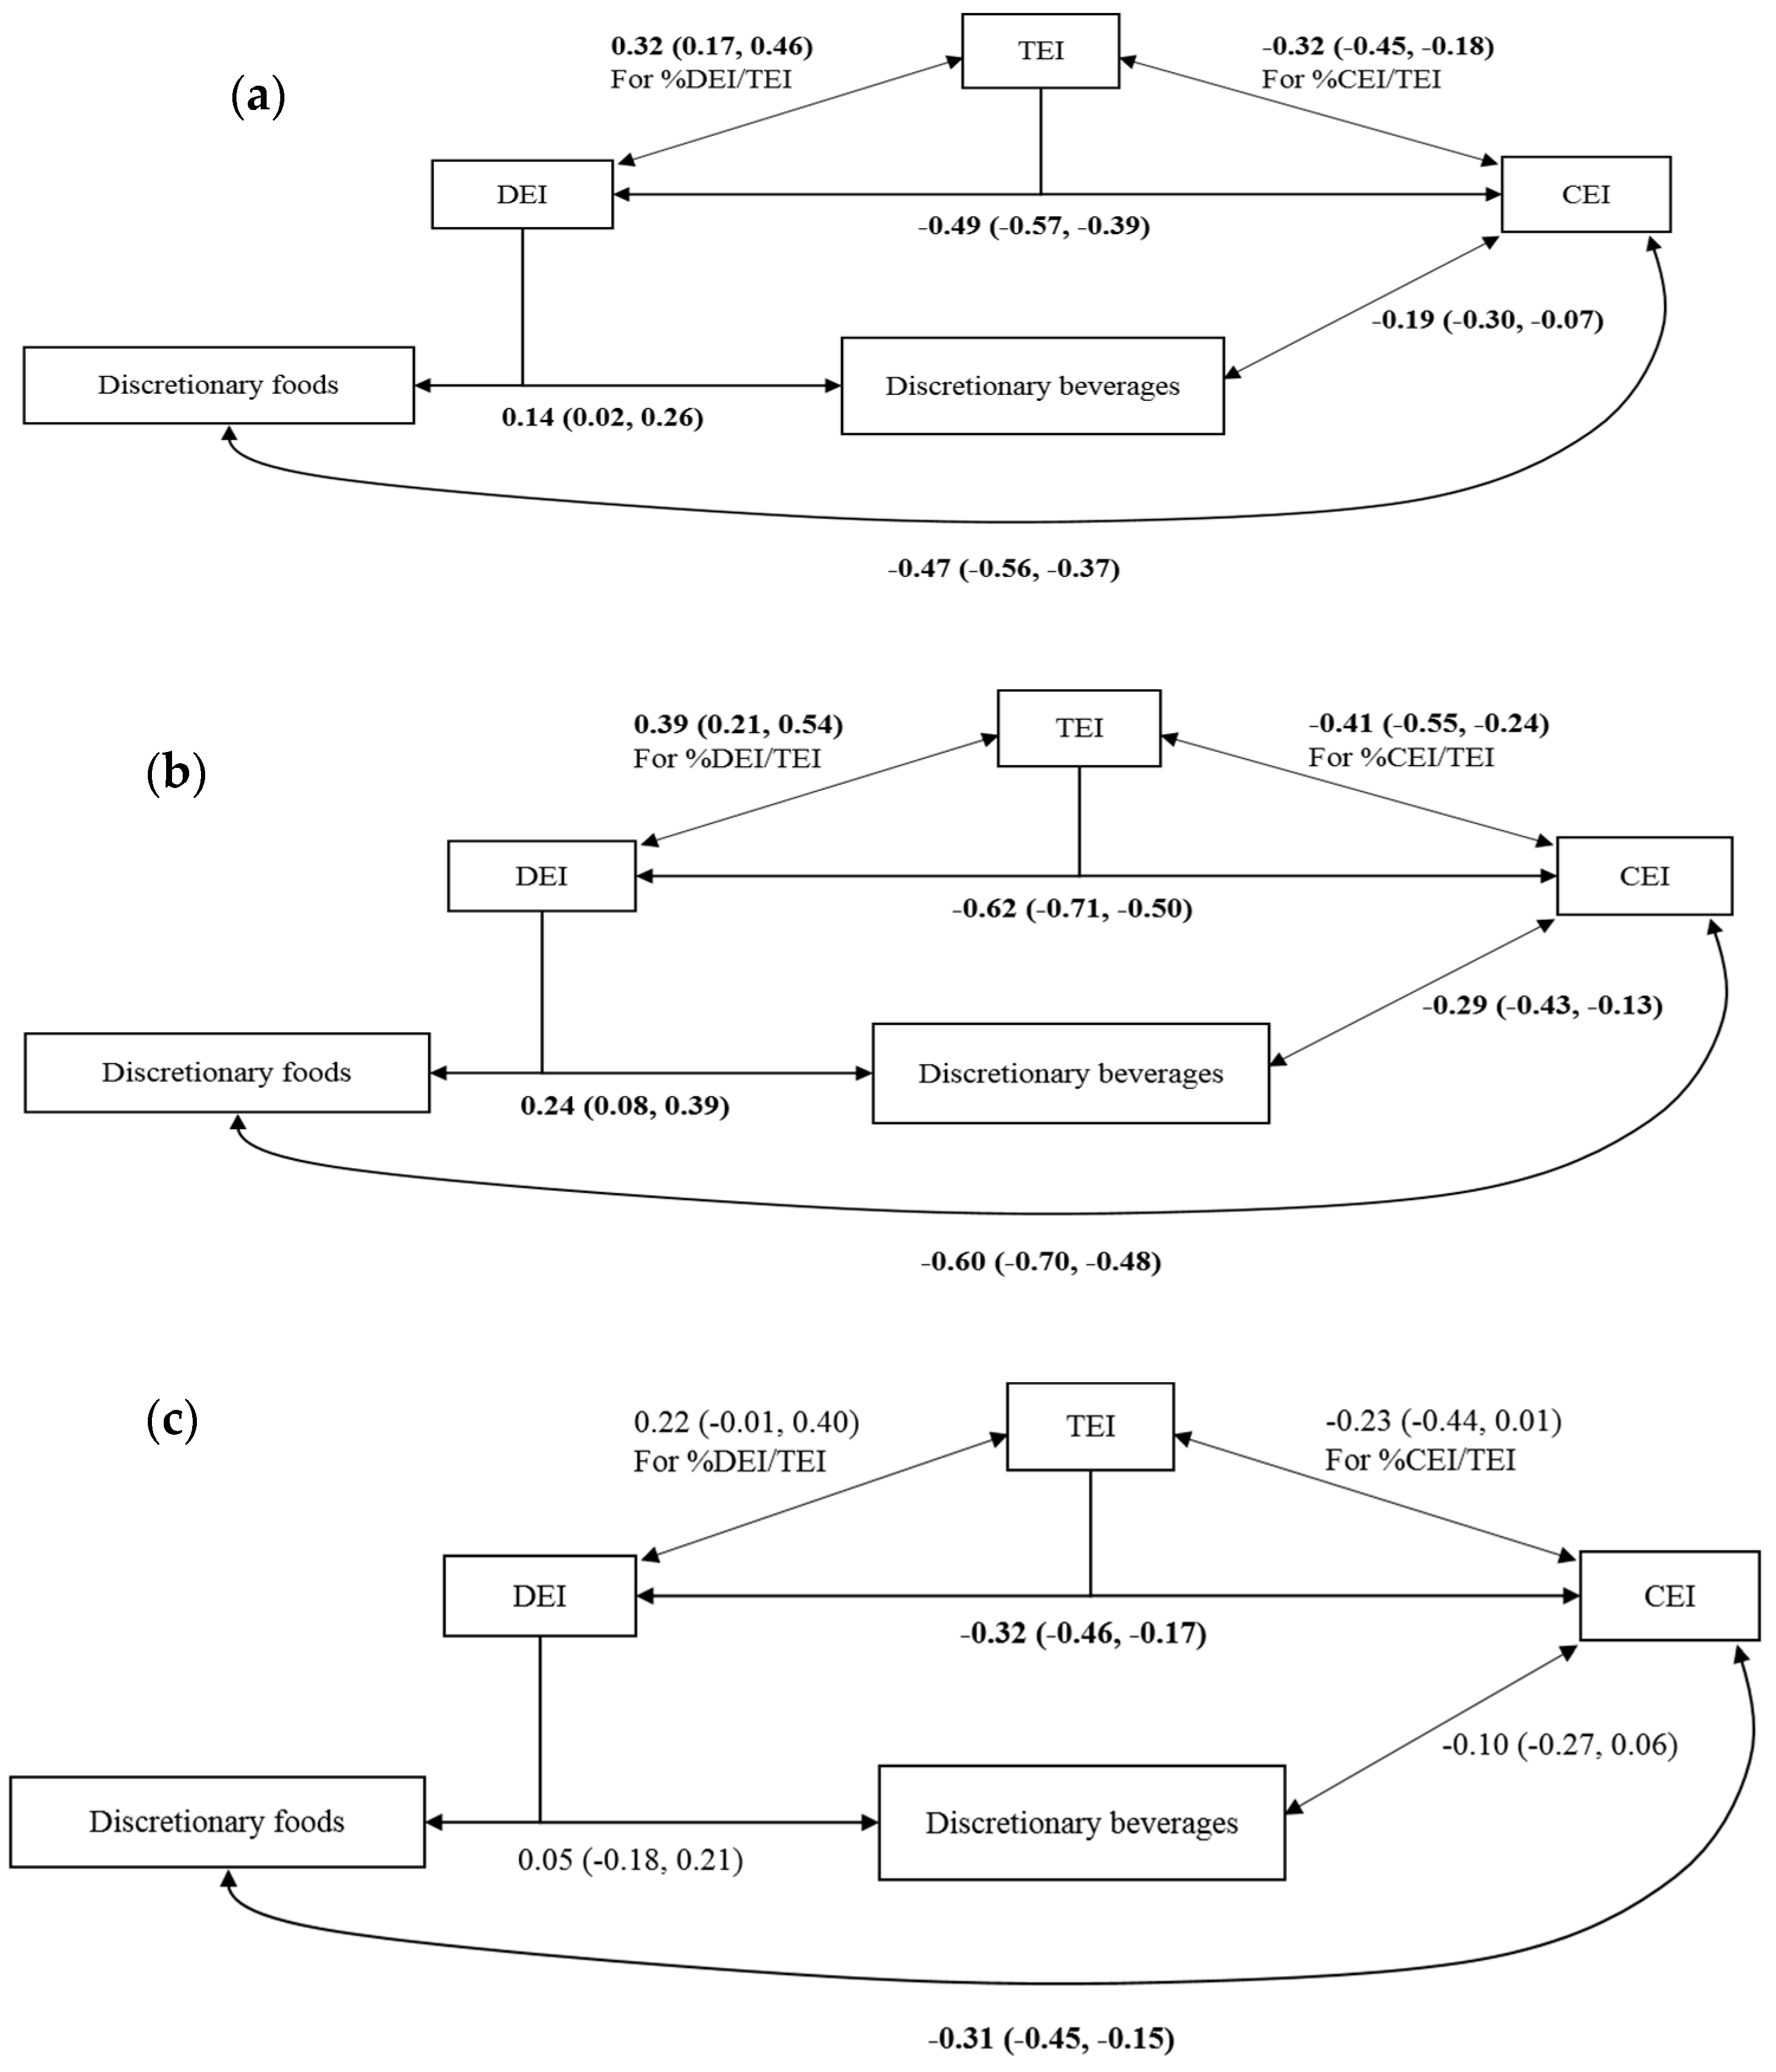
Variables Included in Simultaneous EquationsAll Participants Healthy Weight Participants Participants with Obesity
Model 1
TEI and %DEI/TEI0.32 (0.17, 0.46)0.39 (0.21, 0.54)0.22 (−0.01, 0.40)
Model 2
TEI and %CEI/TEI−0.32 (−0.45, −0.18)−0.41 (−0.55, −0.24)−0.23 (−0.44, 0.00)
Model 3
DEI and CEI−0.49 (−0.57, −0.39)−0.67 (−0.71, −0.50)−0.32 (−0.46, −0.17)
Model 4
Discretionary food and discretionary beverages0.14 (0.02, 0.26)0.24 (0.08, 0.39)0.05 (−0.18, 0.21)
Discretionary food and CEI−0.47 (−0.56, −0.37)−0.60 (−0.70, −0.48)−0.31 (−0.45, −0.15)
Discretionary beverages and CEI−0.19 (−0.30, −0.07)−0.29 (−0.43, −0.13)−0.10 (−0.27, 0.06)
Observations 364183185
Simultaneous equation random effects models were used to determine the correlations between different dietary variables. Results are presented as cross-equation correlations, ρ (95% CI). Models were adjusted for sex, age (<35 years, 35–64 years, or ≥65 years), education (completed or undertaking post-high school education or not), weight status (for analyses in all participants), day of the week dietary intake was reported (weekend or weekday), and socioeconomic status (SEIFA top quintile or below). Correlations written in bold face are significant at the 5% level. TEI, total energy intake; DEI, discretionary energy intake; CEI, core energy intake.

