Local In Vivo Measures of Muscle Lipid and Oxygen Consumption Change in Response to Combined Vitamin D Repletion and Aerobic Training in Older Adults

 ,
,
Abstract
:1. Introduction
2. Materials and Methods
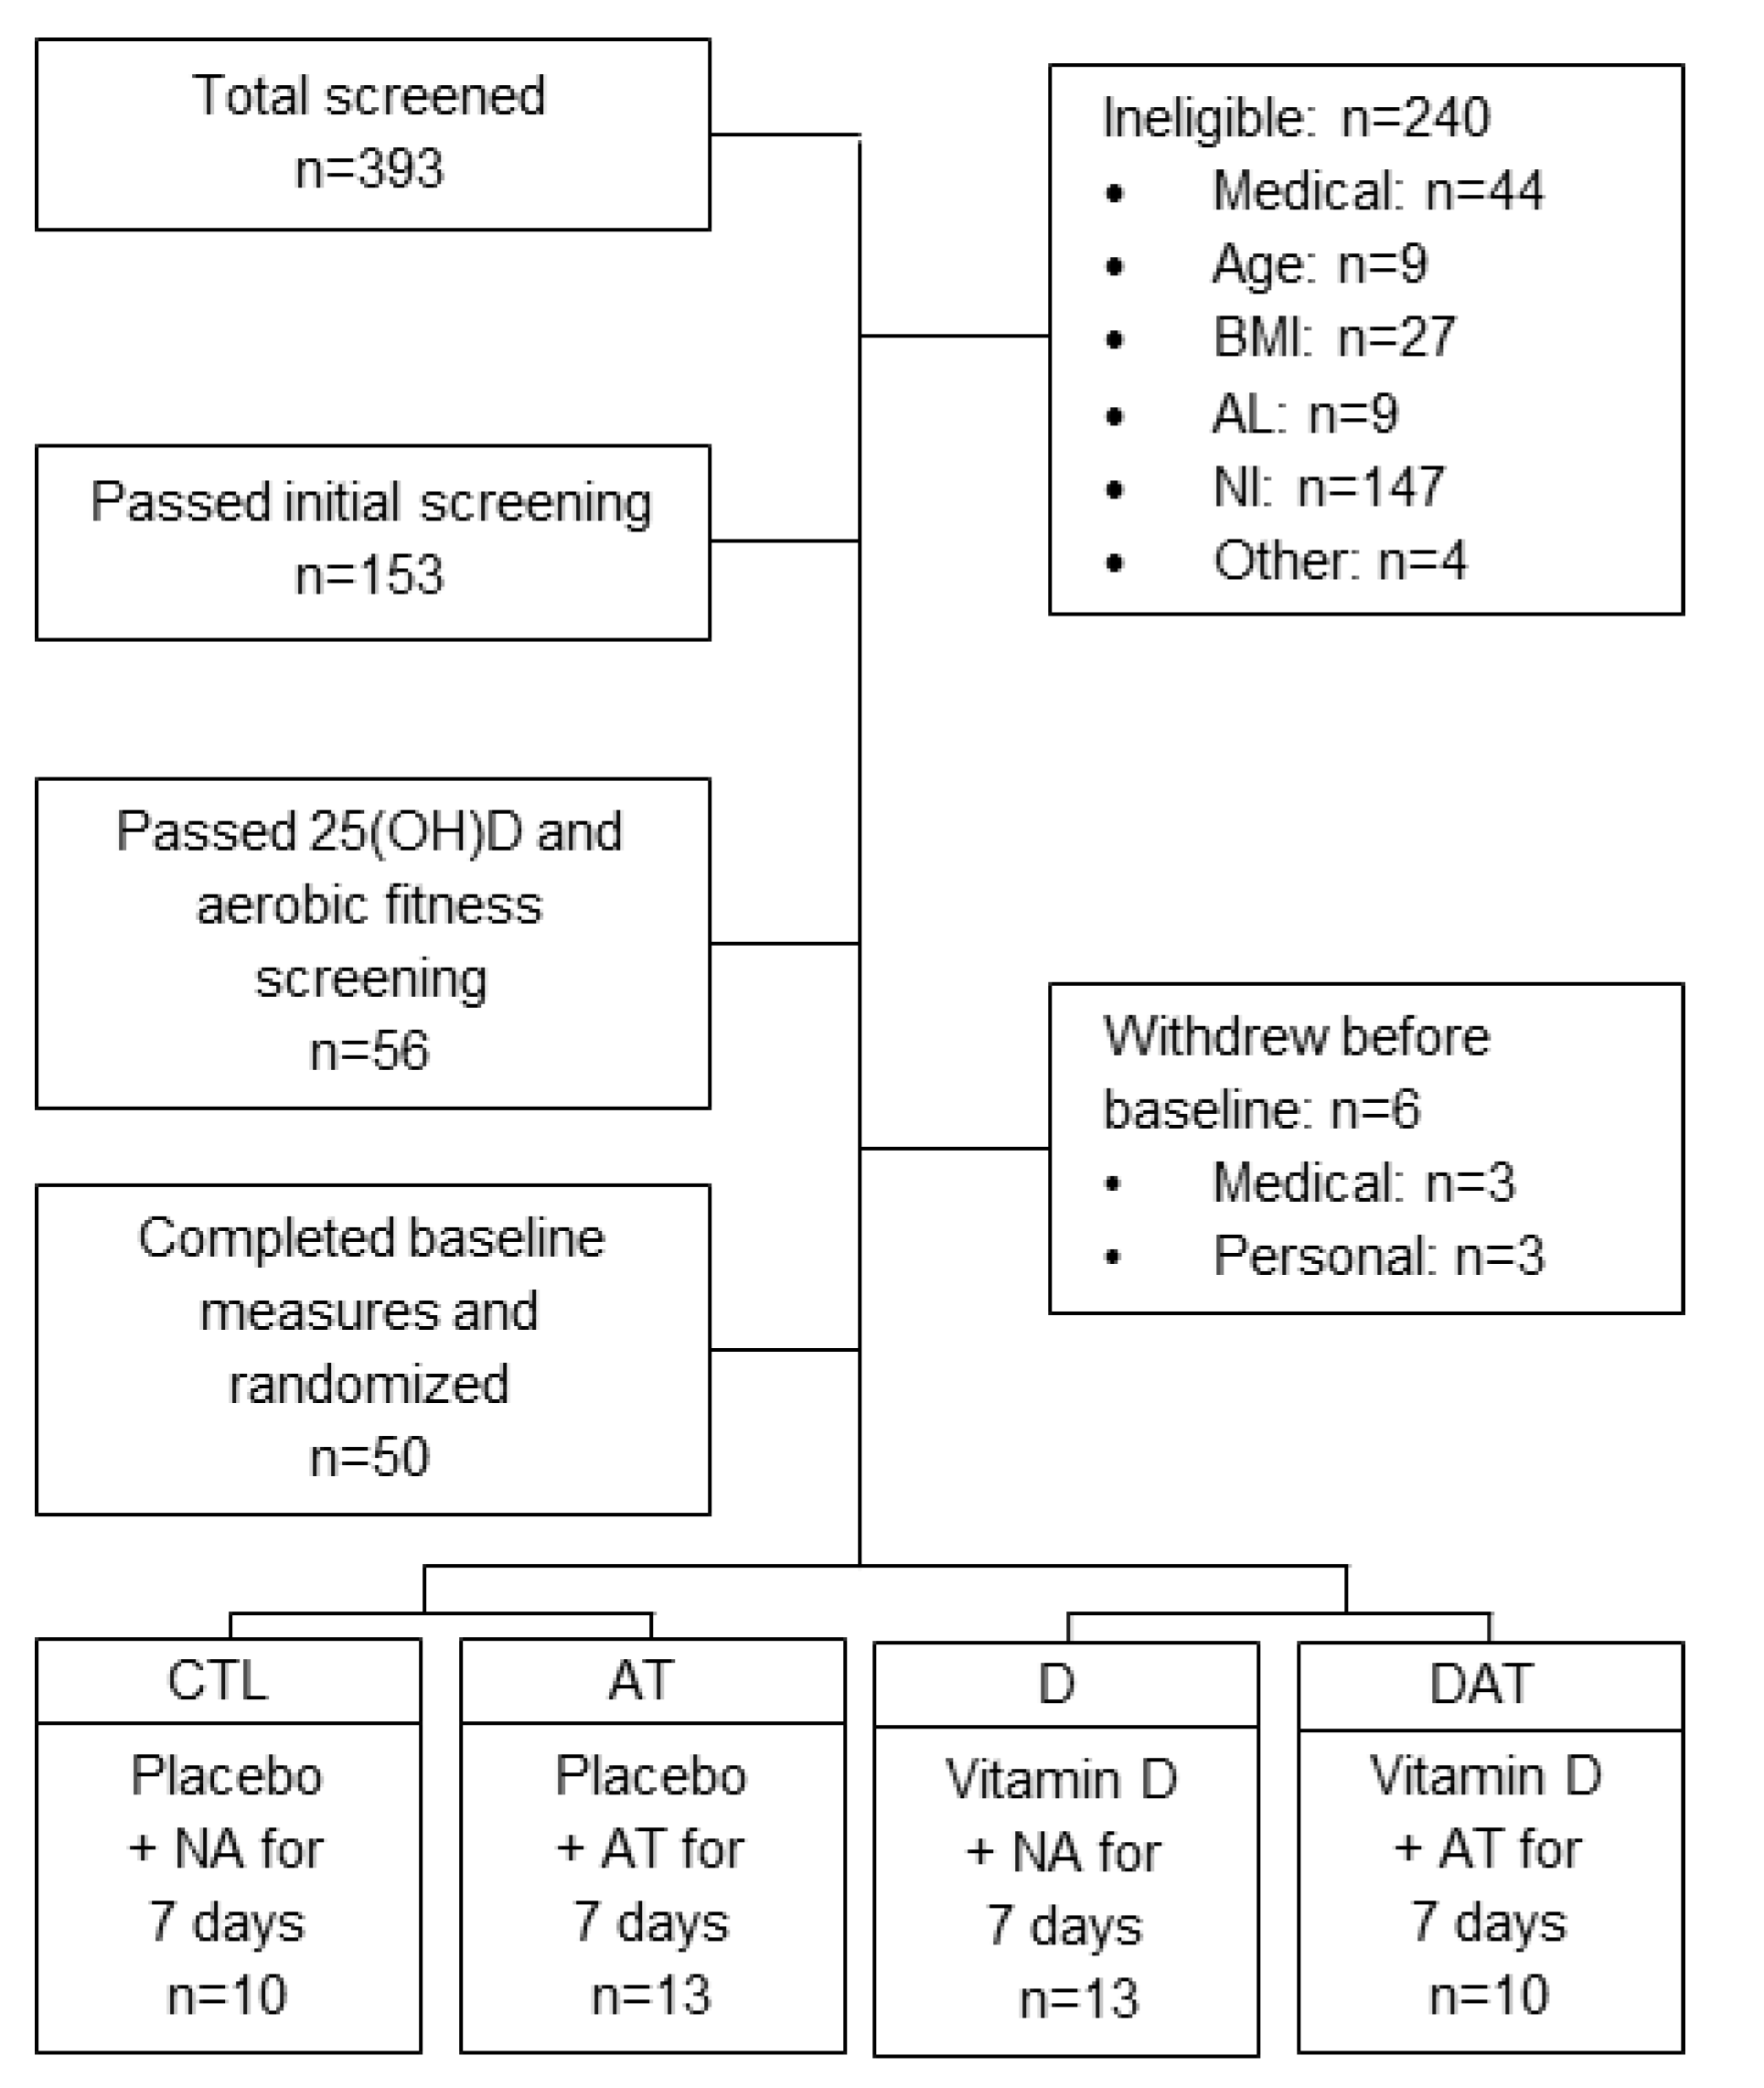
2.1. Study Design
2.2. General Clinical Procedures
2.3. Vitamin D and Placebo Supplementation Protocol
2.4. Aerobic Training Protocol
2.5. Muscle Lipid Assessment
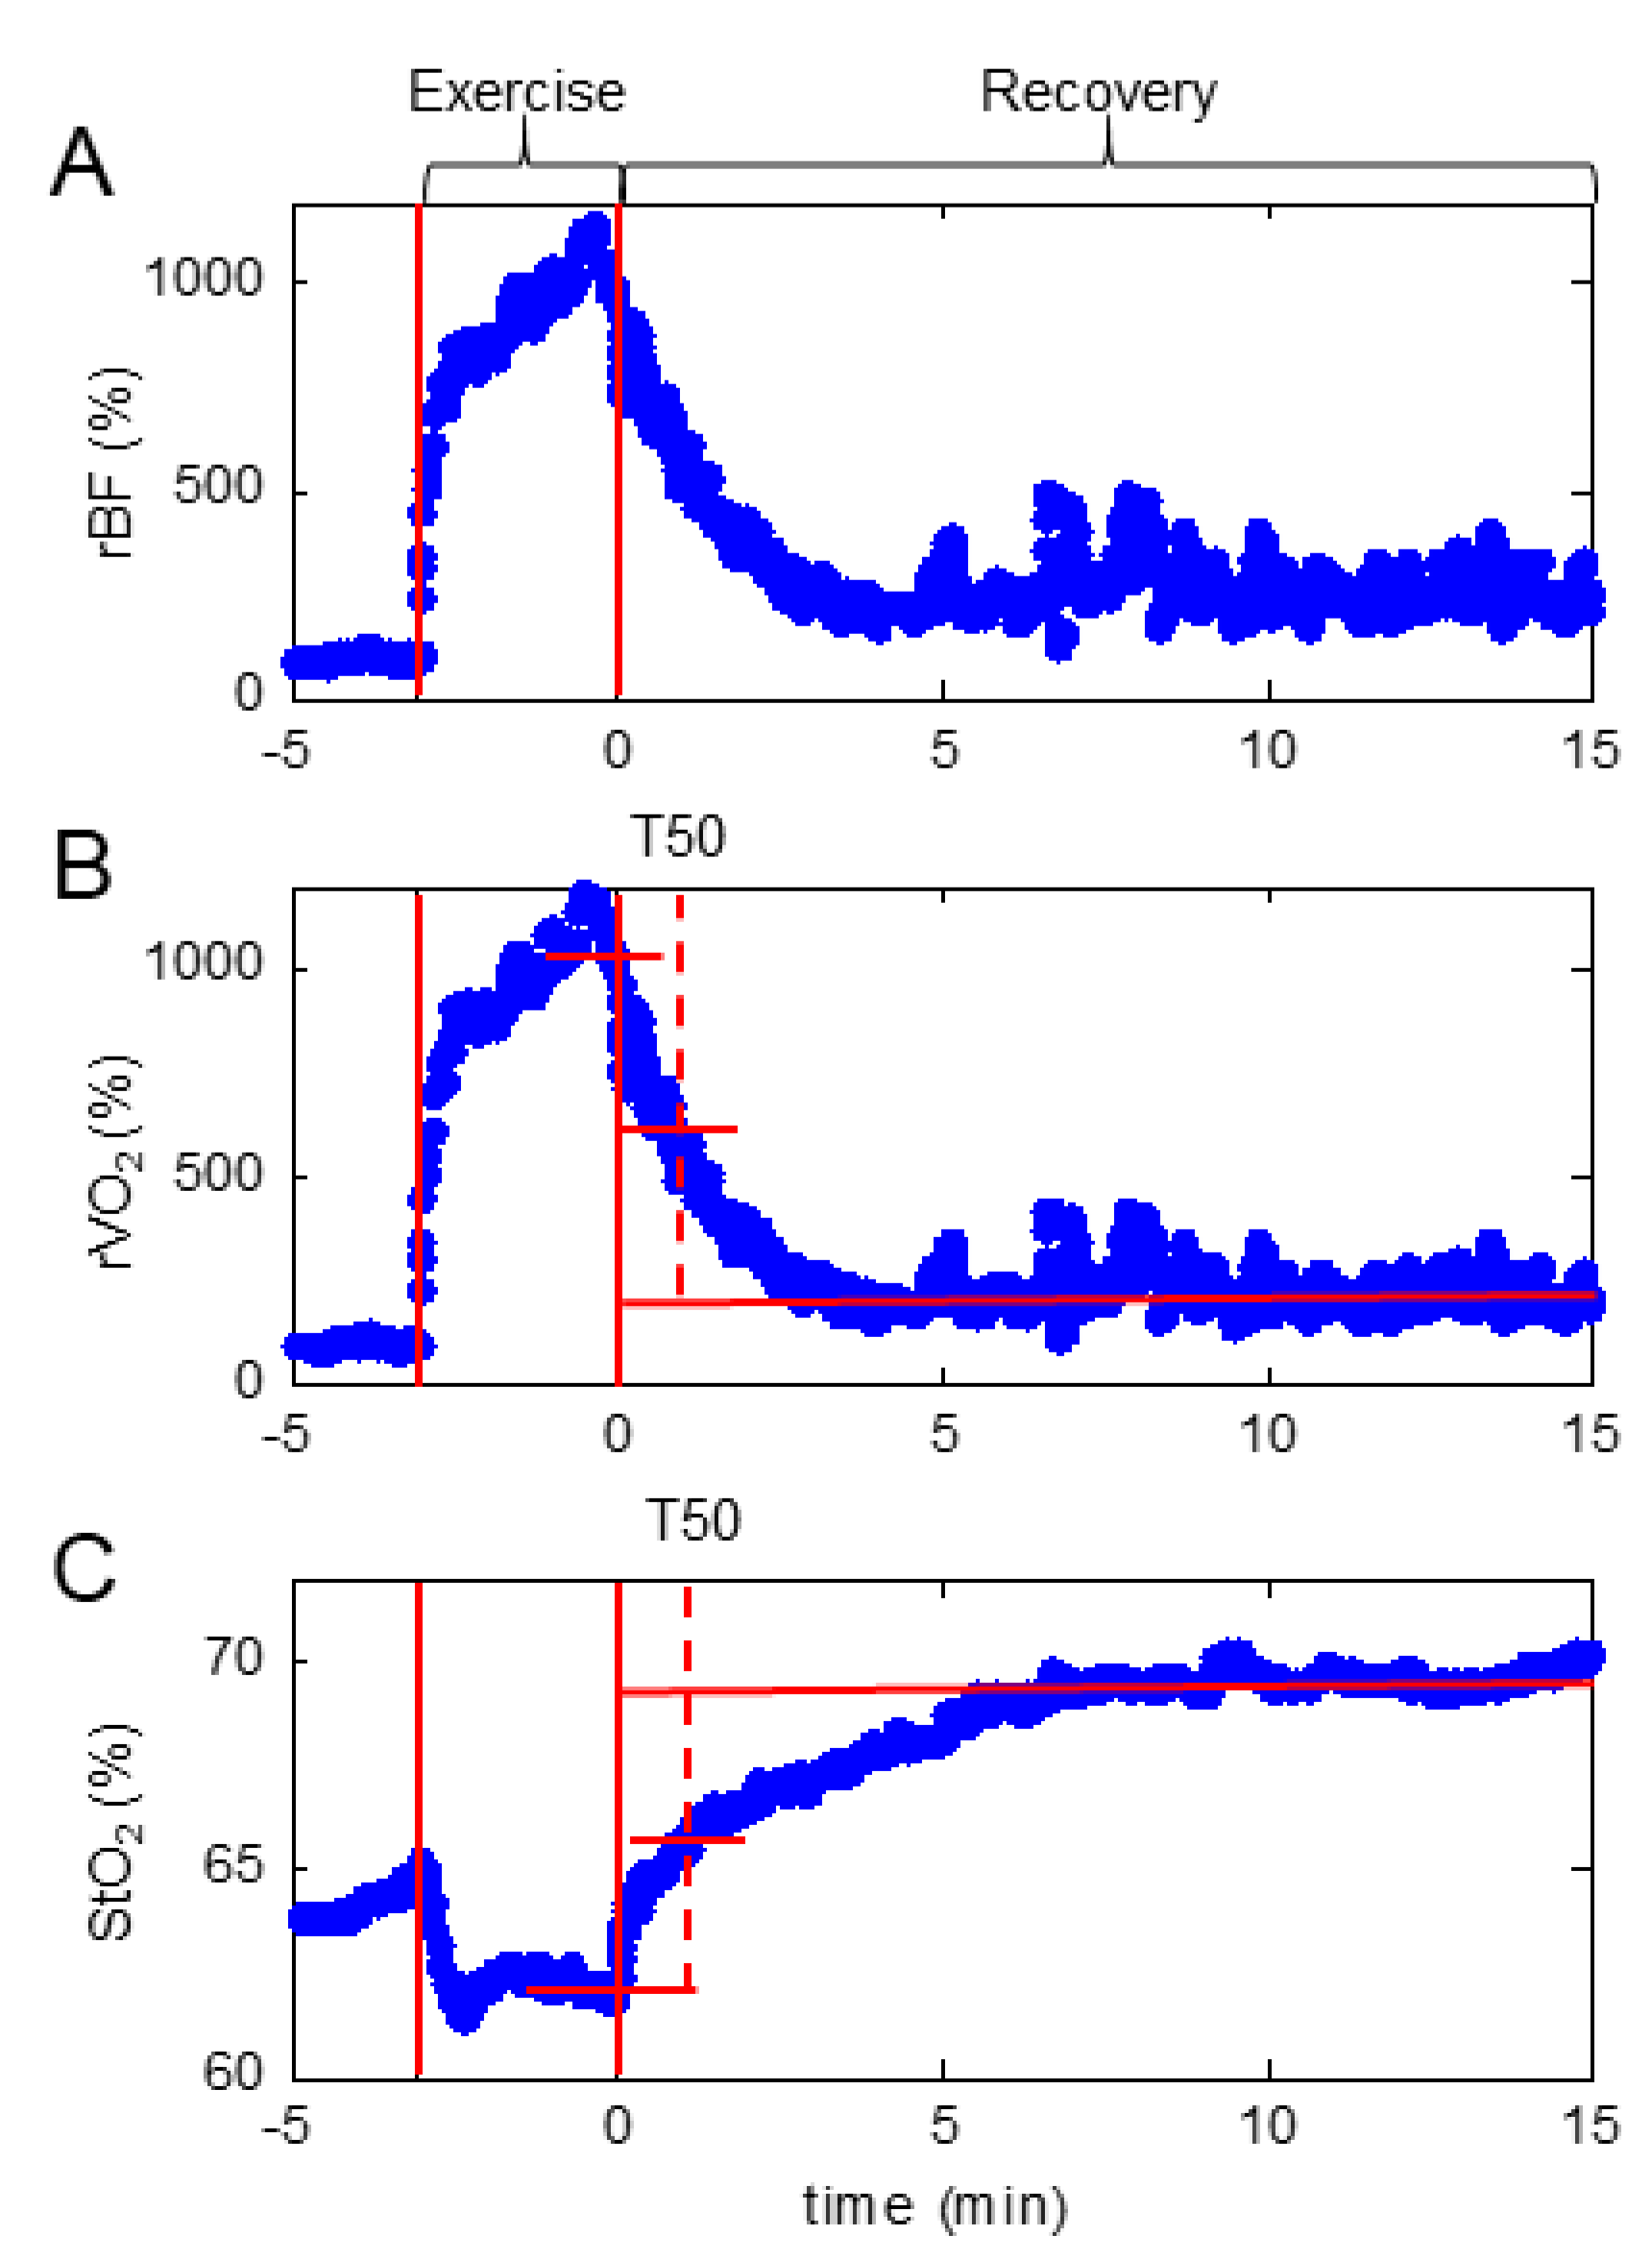
2.6. Fatigue Gastrocnemius Plantar Flexion Protocol Coupled with Hybrid Diffuse Optical Spectroscopy (NIRS/DCS)
2.7. Statistical Methods
3. Results
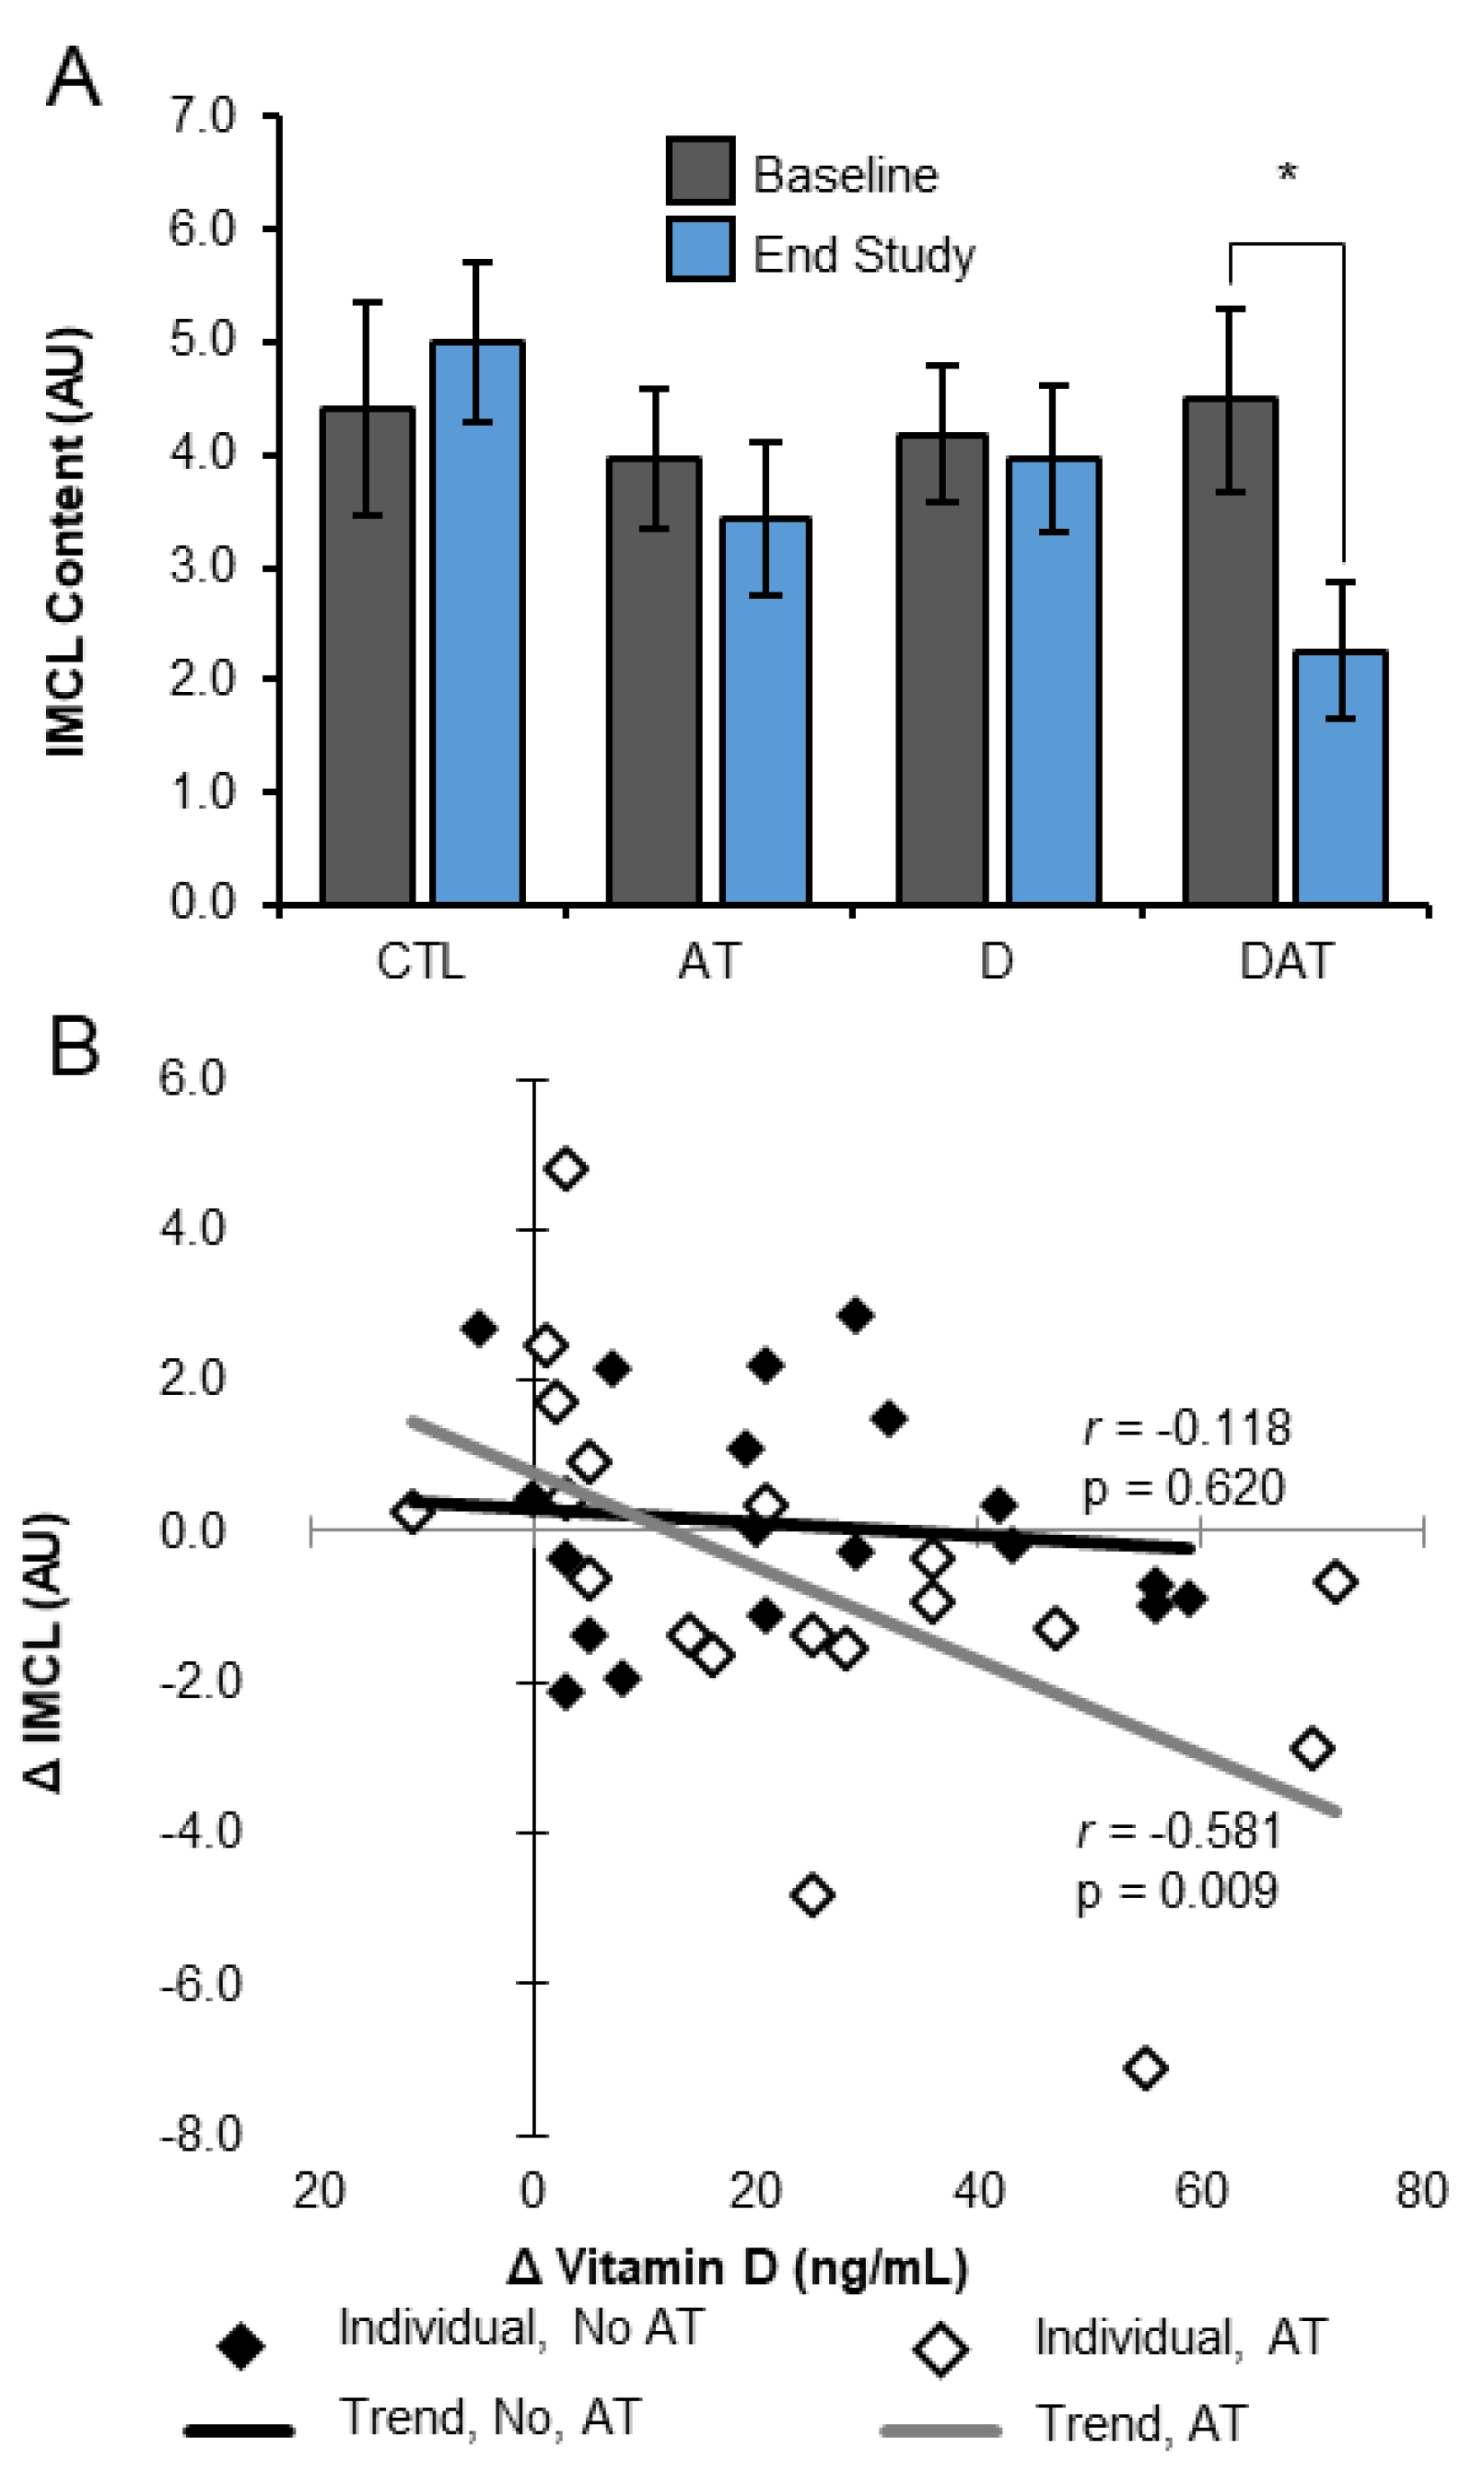
3.1. Muscle Lipid
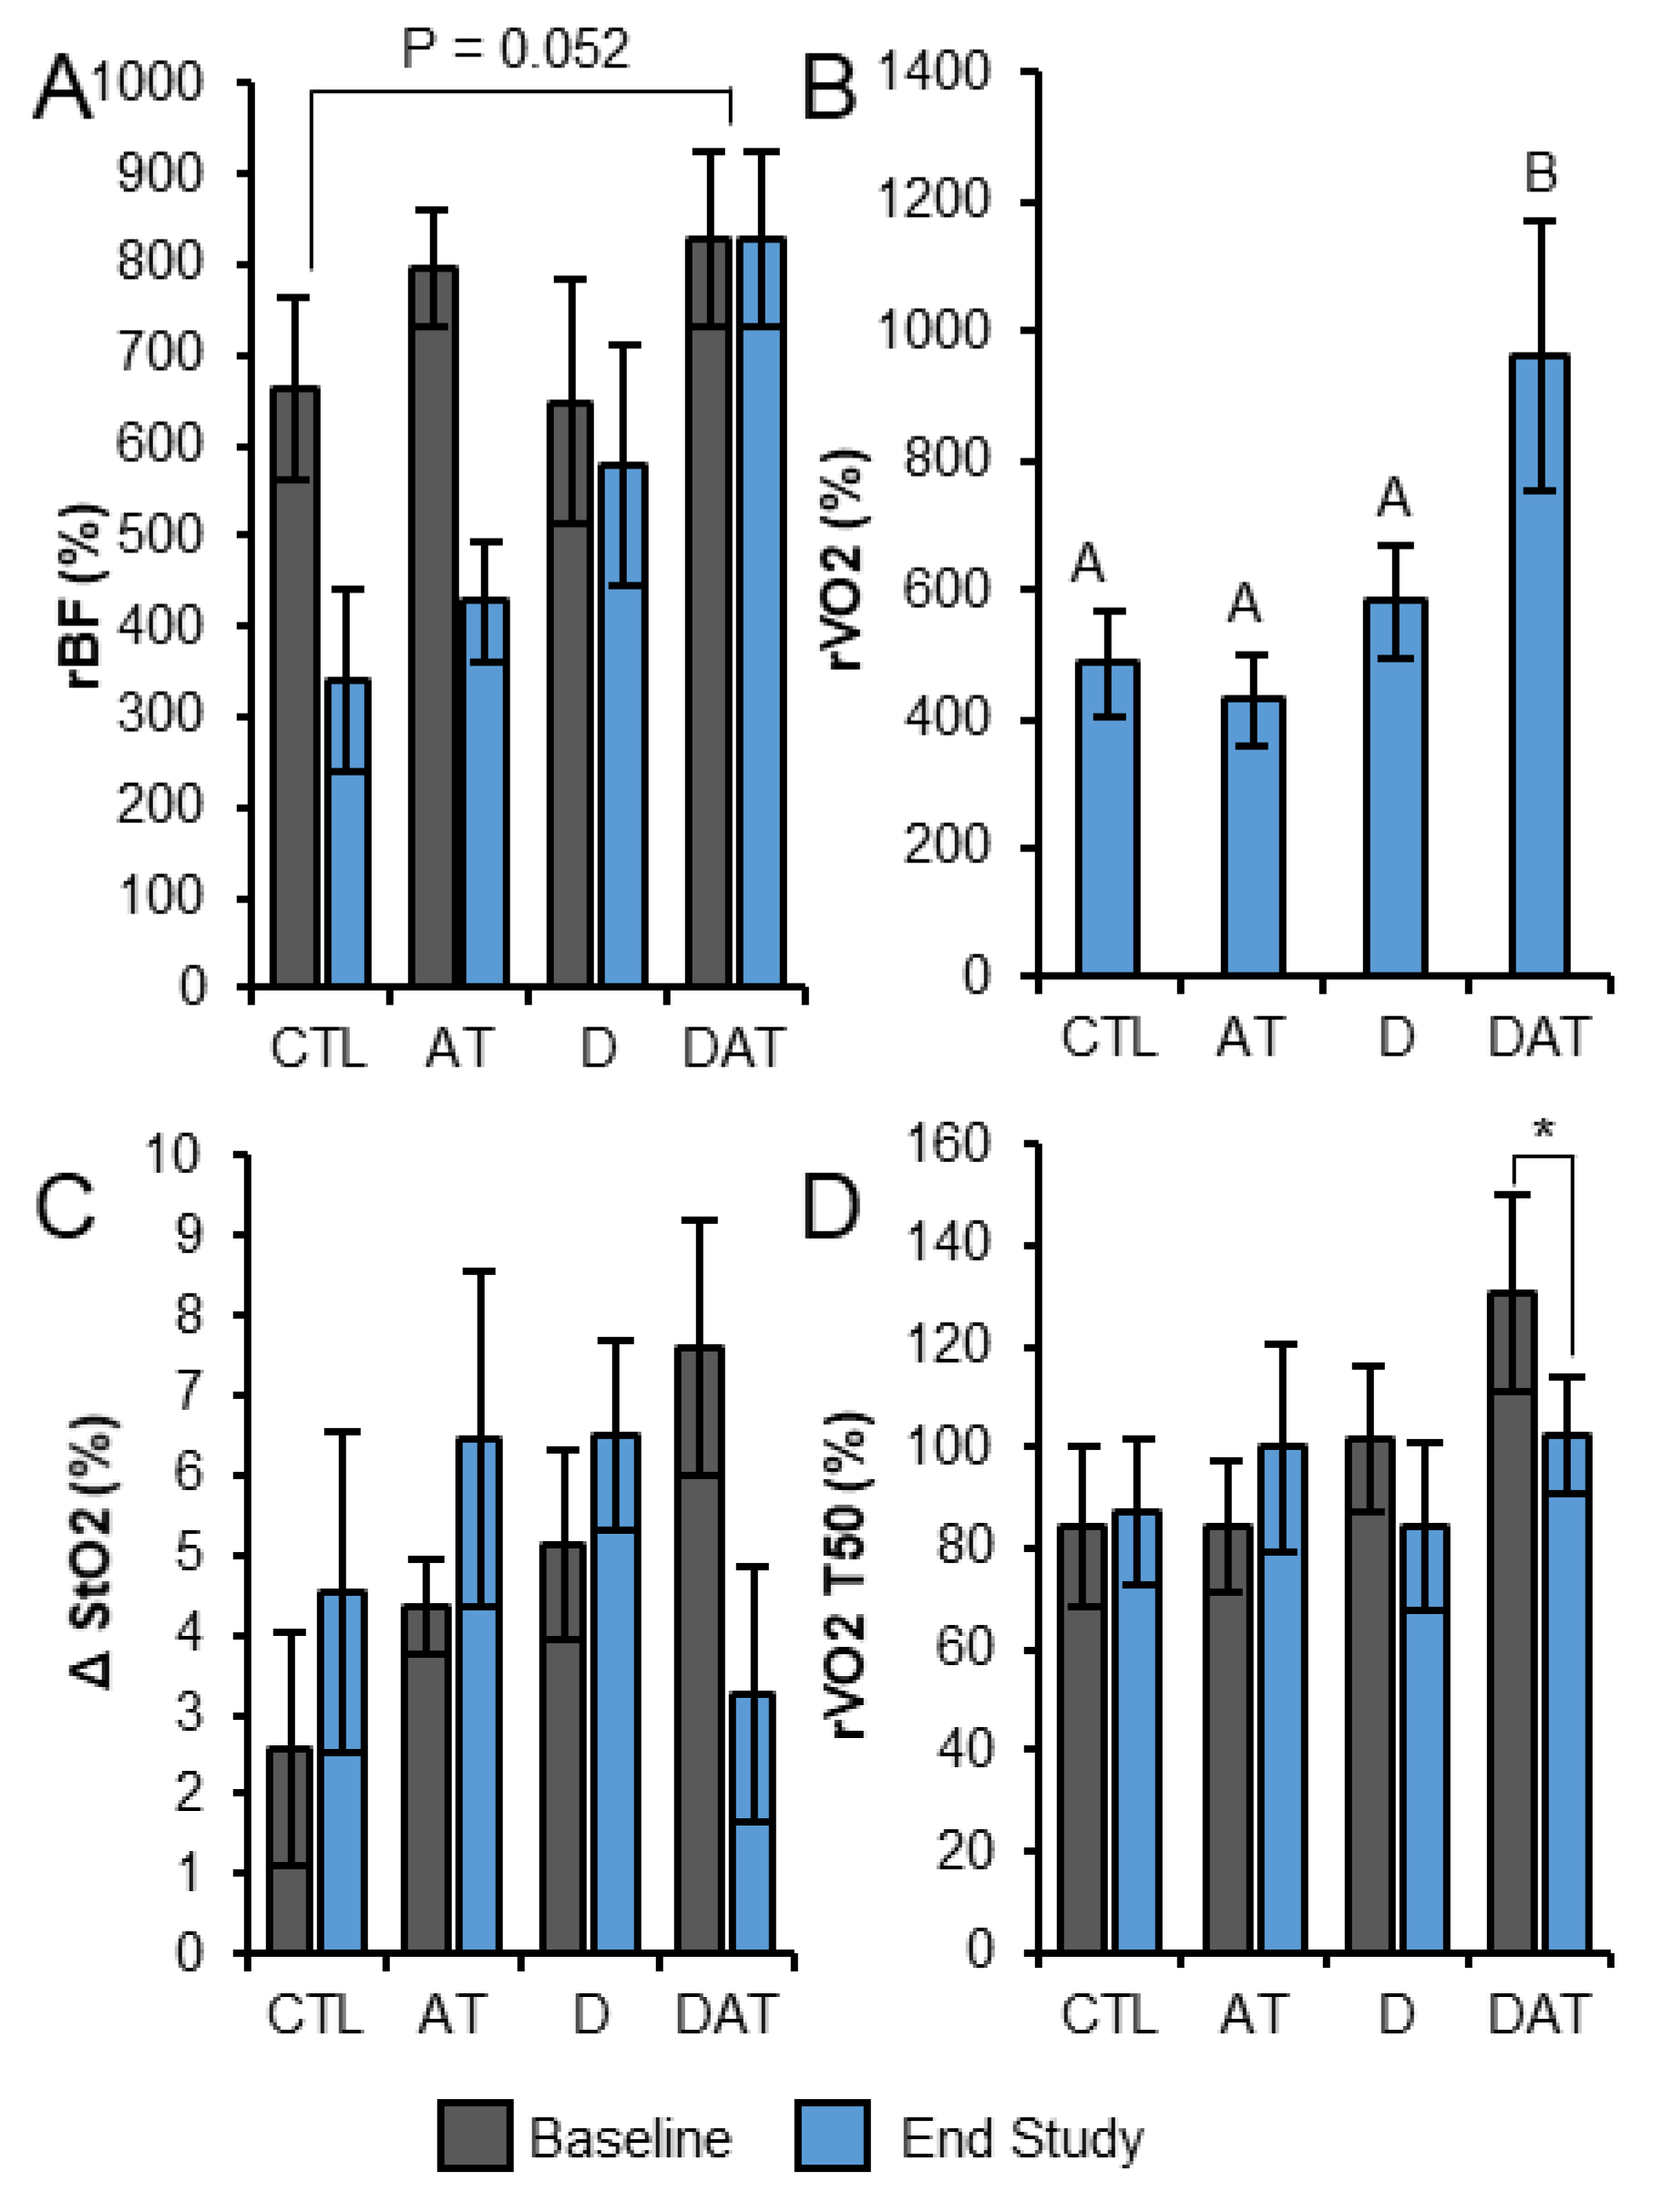
3.2. Fatigue Test with Local Muscle Tissue BF, StO2 and VO2
3.3. Other Outcomes
4. Discussion
5. Conclusions
Author Contributions
Funding
Acknowledgments
Conflicts of Interest
Appendix A


| Measurement | Time Point | CTL | AT | D | DAT |
|---|---|---|---|---|---|
| 25(OH)D, ng/mL | Baseline | 24.8 ± 2.1 | 25.2 ± 1.4 | 26.6 ± 1.2 | 27.1 ± 1.6 |
| Midpoint | 29.5 ± 3.2 A | 31.2 ± 2.7 *A | 54.1 ± 3.0 *B | 62.0 ± 4.5 *B | |
| End Study | 31.0 ± 3.3 *A | 32.6 ± 3.1 *A | 63.7 ± 5.0 *B | 72.1 ± 5.2 *B | |
| VDBP, µg/ mL | Baseline | 110 ± 5 | 115 ± 3 | 111 ± 4 | 115 ± 5 |
| Midpoint | 109 ± 6 | 109 ± 7 | 109 ± 5 | 104 ± 10 | |
| End Study | 115 ± 6 | 110 ± 4 | 110 ± 4 | 108 ± 7 | |
| Ionized Ca, mg/dL | Baseline | 5.01 ± 0.05 | 5.09 ± 0.03 | 5.09 ± 0.03 | 5.04 ± 0.05 |
| Midpoint | 5.00 ± 0.03 | 5.12 ± 0.06 | 5.09 ± 0.04 | 4.97 ± 0.06 | |
| End Study | 4.98 ± 0.02 | 5.04 ± 0.04 | 5.09 ± 0.04 | 5.06 ± 0.07 | |
| Intact PTH, pg/ mL | Baseline | 36.8 ± 3.6 A | 32.4 ± 2.6 A | 53.1 ± 5.5 B | 47.6 ± 5.0 B |
| Midpoint | 43.1 ± 5.6 | 39.7 ± 3.8 * | 39.9 ± 4.0 * | 47.0 ± 6.3 * | |
| End Study | 43.9 ± 6.9 | 37.8 ± 3.4 * | 41.7 ± 3.5 * | 41.5 ± 5.3 * | |
| Insulin, µIU/mL | Baseline | 15.3 ± 3.6 | 8.0 ± 1.1 | 9.22 ± 1.0 | 18.5 ± 6.3 |
| Midpoint | 21.5 ± 9.7 | 12.2 ± 2.5 | 17.9 ± 3.6 | 26.9 ± 14.8 | |
| End Study | 10.7 ± 2.9 | 8.35 ± 1.2 | 11.1 ± 1.3 | 12.6 ± 3.0 | |
| Glucose, mg/dL | Baseline | 99.0 ± 4.3 | 91.7 ± 4.2 | 97.2 ± 2.2 | 96.3 ± 1.5 |
| Midpoint | -- | -- | -- | -- | |
| End Study | 97.6 ± 4.0 | 94.1 ± 2.1 | 98.2 ± 2.2 | 96.7 ± 2.8 | |
| HOMA-IR | Baseline | 3.93 ± 1.04 | 1.78 ± 0.23 | 2.23 ± 0.25 | 4.34 ± 1.43 |
| Midpoint | -- | -- | -- | -- | |
| End Study | 2.68 ± 1.02 | 1.95 ± 0.28 | 2.69 ± 0.32 | 3.02 ± 0.71 |
References
- Toffanello, E.D.; Perissinotto, E.; Sergi, G.; Zambon, S.; Musacchio, E.; Maggi, S.; Coin, A.; Sartori, L.; Corti, M.C.; Baggio, G.; et al. Vitamin D and physical performance in elderly subjects: The Pro.V.A study. PLoS ONE 2012, 7, e34950. [Google Scholar] [CrossRef]
- Verlaan, S.; Maier, A.B.; Bauer, J.M.; Bautmans, I.; Brandt, K.; Donini, L.M.; Maggio, M.; McMurdo, M.E.; Mets, T.; Seal, C.; et al. Sufficient levels of 25-hydroxyvitamin D and protein intake required to increase muscle mass in sarcopenic older adults—The Provide study. Clin. Nutr. 2017, 37, 551–557. [Google Scholar] [CrossRef]
- Houston, D.K.; Tooze, J.A.; Neiberg, R.H.; Hausman, D.B.; Johnson, M.A.; Cauley, J.A.; Bauer, D.C.; Cawthon, P.M.; Shea, M.K.; Schwartz, G.G.; et al. 25-hydroxyvitamin D status and change in physical performance and strength in older adults: The health, aging, and body composition study. Am. J. Epidemiol. 2012, 176, 1025–1034. [Google Scholar] [CrossRef] [PubMed]
- Sohl, E.; van Schoor, N.M.; de Jongh, R.T.; Visser, M.; Deeg, D.J.; Lips, P. Vitamin D status is associated with functional limitations and functional decline in older individuals. J. Clin. Endocrinol. Metab. 2013, 98, E1483–E1490. [Google Scholar] [CrossRef] [PubMed]
- Jefferson, G.E.; Schnell, D.M.; Thomas, D.T.; Bollinger, L.M. Calcitriol concomitantly enhances insulin sensitivity and alters myocellular lipid partitioning in high fat-treated skeletal muscle cells. J. Physiol. Biochem. 2017, 73, 613–621. [Google Scholar] [CrossRef] [PubMed] [Green Version]
- Sinha, A.; Hollingsworth, K.G.; Ball, S.; Cheetham, T. Improving the vitamin D status of vitamin D deficient adults is associated with improved mitochondrial oxidative function in skeletal muscle. J. Clin. Endocrinol. Metab. 2013, 98, E509–E513. [Google Scholar] [CrossRef] [PubMed]
- Ryan, Z.C.; Craig, T.A.; Folmes, C.D.; Wang, X.; Lanza, I.R.; Schaible, N.S.; Salisbury, J.L.; Nair, K.S.; Terzic, A.; Sieck, G.C.; et al. 1alpha,25-Dihydroxyvitamin D3 regulates mitochondrial oxygen consumption and dynamics in human skeletal muscle cells. J. Biol. Chem. 2016, 291, 1514–1528. [Google Scholar] [CrossRef] [PubMed]
- Dutta, D.; Maisnam, I.; Shrivastava, A.; Sinha, A.; Ghosh, S.; Mukhopadhyay, P.; Mukhopadhyay, S.; Chowdhury, S. Serum vitamin-D predicts insulin resistance in individuals with prediabetes. Indian J. Med. Res. 2013, 138, 853–860. [Google Scholar]
- Grant, W.B.; Garland, C.F.; Holick, M.F. Comparisons of estimated economic burdens due to insufficient solar ultraviolet irradiance and vitamin D and excess solar UV irradiance for the United States. Photochem. Photobiol. 2005, 81, 1276–1286. [Google Scholar] [CrossRef] [PubMed]
- Bischoff-Ferrari, H.A.; Dawson-Hughes, B.; Orav, E.J.; Staehelin, H.B.; Meyer, O.W.; Theiler, R.; Dick, W.; Willett, W.C.; Egli, A. Monthly High-dose vitamin d treatment for the prevention of functional decline: A randomized clinical trial. JAMA Intern. Med. 2016, 176, 175–183. [Google Scholar] [CrossRef]
- Levis, S.; Gomez-Marin, O. Vitamin D and Physical function in sedentary older men. J. Am. Geriatr. Soc. 2017, 65, 323–331. [Google Scholar] [CrossRef] [PubMed]
- Domingues-Faria, C.; Boirie, Y.; Walrand, S. Vitamin D and muscle trophicity. Curr. Opin. Clin. Nutr. Metab. Care 2017, 20, 169–174. [Google Scholar] [CrossRef]
- Tagliafico, A.S.; Ameri, P.; Bovio, M.; Puntoni, M.; Capaccio, E.; Murialdo, G.; Martinoli, C. Relationship between fatty degeneration of thigh muscles and vitamin D status in the elderly: a preliminary MRI study. AJR Am. J. Roentgenol. 2010, 194, 728–734. [Google Scholar] [CrossRef] [PubMed]
- Sato, Y.; Iwamoto, J.; Kanoko, T.; Satoh, K. Low-dose vitamin D prevents muscular atrophy and reduces falls and hip fractures in women after stroke: A randomized controlled trial. Cerebrovasc. Dis. 2005, 20, 187–192, Retracted in Cerebrovasc. Dis. 2017, 44, 240. [Google Scholar] [CrossRef] [PubMed]
- Chanet, A.; Salles, J.; Guillet, C.; Giraudet, C.; Berry, A.; Patrac, V.; Domingues-Faria, C.; Tagliaferri, C.; Bouton, K.; Bertrand-Michel, J.; et al. Vitamin D supplementation restores the blunted muscle protein synthesis response in deficient old rats through an impact on ectopic fat deposition. J. Nutr. Biochem. 2017, 46, 30–38. [Google Scholar] [CrossRef] [PubMed]
- Liu, E.; Meigs, J.B.; Pittas, A.G.; McKeown, N.M.; Economos, C.D.; Booth, S.L.; Jacques, P.F. Plasma 25-hydroxyvitamin d is associated with markers of the insulin resistant phenotype in nondiabetic adults. J. Nutr. 2009, 139, 329–334. [Google Scholar] [CrossRef] [PubMed]
- Di Rosa, M.; Malaguarnera, M.; Nicoletti, F.; Malaguarnera, L. Vitamin D3: A helpful immuno-modulator. Immunology 2011, 134, 123–139. [Google Scholar] [CrossRef] [PubMed]
- Gilsanz, V.; Kremer, A.; Mo, A.O.; Wren, T.A.; Kremer, R. Vitamin D status and its relation to muscle mass and muscle fat in young women. J. Clin. Endocrinol. Metab. 2010, 95, 1595–1601. [Google Scholar] [CrossRef] [PubMed]
- Beaudart, C.; Buckinx, F.; Rabenda, V.; Gillain, S.; Cavalier, E.; Slomian, J.; Petermans, J.; Reginster, J.Y.; Bruyere, O. The effects of vitamin D on skeletal muscle strength, muscle mass, and muscle power: A systematic review and meta-analysis of randomized controlled trials. J. Clin. Endocrinol. Metab. 2014, 99, 4336–4345. [Google Scholar] [CrossRef]
- Makanae, Y.; Ogasawara, R.; Sato, K.; Takamura, Y.; Matsutani, K.; Kido, K.; Shiozawa, N.; Nakazato, K.; Fujita, S. Acute bout of resistance exercise increases vitamin D receptor protein expression in rat skeletal muscle. Exp. Physiol. 2015, 100, 1168–1176. [Google Scholar] [CrossRef] [PubMed] [Green Version]
- Yin, Y.; Yu, Z.; Xia, M.; Luo, X.; Lu, X.; Ling, W. Vitamin D attenuates high fat diet-induced hepatic steatosis in rats by modulating lipid metabolism. Eur. J. Clin. Investig. 2012, 42, 1189–1196. [Google Scholar] [CrossRef] [PubMed]
- Srikuea, R.; Zhang, X.; Park-Sarge, O.K.; Esser, K.A. VDR and CYP27B1 are expressed in C2C12 cells and regenerating skeletal muscle: Potential role in suppression of myoblast proliferation. Am. J. Physiol. Cell Physiol. 2012, 303, C396–C405. [Google Scholar] [CrossRef] [PubMed]
- Marcotorchino, J.; Tourniaire, F.; Astier, J.; Karkeni, E.; Canault, M.; Amiot, M.J.; Bendahan, D.; Bernard, M.; Martin, J.C.; Giannesini, B.; et al. Vitamin D protects against diet-induced obesity by enhancing fatty acid oxidation. J. Nutr. Biochem. 2014, 25, 1077–1083. [Google Scholar] [CrossRef] [PubMed]
- Agergaard, J.; Trostrup, J.; Uth, J.; Iversen, J.V.; Boesen, A.; Andersen, J.L.; Schjerling, P.; Langberg, H. Does vitamin-D intake during resistance training improve the skeletal muscle hypertrophic and strength response in young and elderly men?—A randomized controlled trial. Nutr. Metab. 2015, 12, 32. [Google Scholar] [CrossRef] [PubMed]
- Volpi, E.; Nazemi, R.; Fujita, S. Muscle tissue changes with aging. Curr. Opin. Clin. Nutr. Metab. Care 2004, 7, 405–410. [Google Scholar] [CrossRef] [Green Version]
- Kim, J.E.; Dunville, K.; Li, J.; Cheng, J.X.; Conley, T.B.; Couture, C.S.; Campbell, W.W. Intermuscular adipose tissue content and intramyocellular lipid fatty acid saturation are associated with glucose homeostasis in middle-aged and older adults. Endocrinol. Metab. 2017, 32, 257–264. [Google Scholar] [CrossRef] [PubMed]
- Redzic, M.; Powell, D.K.; Thomas, D.T. Vitamin D status is related to intramyocellular lipid in older adults. Endocrine 2014, 47, 854–861. [Google Scholar] [CrossRef] [Green Version]
- Sakurai, Y.; Tamura, Y.; Takeno, K.; Kumashiro, N.; Sato, F.; Kakehi, S.; Ikeda, S.; Ogura, Y.; Saga, N.; Naito, H.; et al. Determinants of intramyocellular lipid accumulation after dietary fat loading in non-obese men. J. Diabetes Investig. 2011, 2, 310–317. [Google Scholar] [CrossRef]
- Shaw, C.S.; Clark, J.; Wagenmakers, A.J. The effect of exercise and nutrition on intramuscular fat metabolism and insulin sensitivity. Annu. Rev. Nutr. 2010, 30, 13–34. [Google Scholar] [CrossRef]
- Takiishi, T.; Gysemans, C.; Bouillon, R.; Mathieu, C. Vitamin D and diabetes. Endocrinol. Metab. Clin. N. Am. 2010, 39, 419–446. [Google Scholar] [CrossRef]
- Cree, M.G.; Newcomer, B.R.; Katsanos, C.S.; Sheffield-Moore, M.; Chinkes, D.; Aarsland, A.; Urban, R.; Wolfe, R.R. Intramuscular and liver triglycerides are increased in the elderly. J. Clin. Endocrinol. Metab. 2004, 89, 3864–3871. [Google Scholar] [CrossRef]
- Dube, J.J.; Amati, F.; Stefanovic-Racic, M.; Toledo, F.G.; Sauers, S.E.; Goodpaster, B.H. Exercise-induced alterations in intramyocellular lipids and insulin resistance: The athlete’s paradox revisited. Am. J. Physiol. Endocrinol. Metab. 2008, 294, E882–E888. [Google Scholar] [CrossRef]
- Pruchnic, R.; Katsiaras, A.; He, J.; Kelley, D.E.; Winters, C.; Goodpaster, B.H. Exercise training increases intramyocellular lipid and oxidative capacity in older adults. Am. J. Physiol. Endocrinol. Metab. 2004, 287, E857–E862. [Google Scholar] [CrossRef] [PubMed] [Green Version]
- Haus, J.M.; Solomon, T.P.; Lu, L.; Jesberger, J.A.; Barkoukis, H.; Flask, C.A.; Kirwan, J.P. Intramyocellular lipid content and insulin sensitivity are increased following a short-term low-glycemic index diet and exercise intervention. Am. J. Physiol. Endocrinol. Metab. 2011, 301, E511–E516. [Google Scholar] [CrossRef] [PubMed] [Green Version]
- Metcalf, B.S.; Curnow, J.S.; Evans, C.; Voss, L.D.; Wilkin, T.J. Technical reliability of the CSA activity monitor: The Earlybird study. Med. Sci. Sports Exerc. 2002, 34, 1533–1537. [Google Scholar] [CrossRef] [PubMed]
- Warren, W.T.; Robert, W. Fully proportional actigraphy: A new instrument. Behav. Res. Meth. Instrum. Comput. 1996, 28, 392–403. [Google Scholar] [Green Version]
- American College of Sports Medicine; Riebe, D.; Ehrman, J.K.; Liguori, G.; Magal, M. ACSM’s Guidelines for Exercise Testing and Prescription, 10th ed.; Wolters, K., Ed.; Lippincott Williams & Wilkins: Pennsylvania, PA, USA, 2018; p. 472. [Google Scholar]
- Holick, M.F.; Binkley, N.C.; Bischoff-Ferrari, H.A.; Gordon, C.M.; Hanley, D.A.; Heaney, R.P.; Murad, M.H.; Weaver, C.M.; Endocrine, S. Evaluation, treatment, and prevention of vitamin D deficiency: An endocrine society clinical practice guideline. J. Clin. Endocrinol. Metab. 2011, 96, 1911–1930. [Google Scholar] [CrossRef]
- Hollis, B.W. Circulating 25-hydroxyvitamin D levels indicative of vitamin D sufficiency: implications for establishing a new effective dietary intake recommendation for vitamin D. J. Nutr. 2005, 135, 317–322. [Google Scholar] [CrossRef]
- Gurley, K.; Shang, Y.; Yu, G. Noninvasive optical quantification of absolute blood flow, blood oxygenation, and oxygen consumption rate in exercising skeletal muscle. J. Biomed. Opt. 2012, 17, 075010. [Google Scholar] [CrossRef]
- Henry, B.; Zhao, M.; Shang, Y.; Uhl, T.; Thomas, D.T.; Xenos, E.S.; Saha, S.P.; Yu, G. Hybrid diffuse optical techniques for continuous hemodynamic measurement in gastrocnemius during plantar flexion exercise. J. Biomed. Opt. 2015, 20, 125006. [Google Scholar] [CrossRef] [Green Version]
- Shang, Y.; Symons, T.B.; Durduran, T.; Yodh, A.G.; Yu, G. Effects of muscle fiber motion on diffuse correlation spectroscopy blood flow measurements during exercise. Biomed. Opt. Express 2010, 1, 500–511. [Google Scholar] [CrossRef] [PubMed] [Green Version]
- Schnell, D.M.; Walton, R.G.; Vekaria, H.J.; Sullivan, P.G.; Bollinger, L.M.; Peterson, C.A.; Thomas, D.T. Vitamin D produces a perilipin 2-dependent increase in mitochondrial function in C2C12 myotubes. J. Nutr. Biochem. 2019, 65, 83–92. [Google Scholar] [CrossRef] [PubMed]
- Funai, K.; Semenkovich, C.F. Skeletal muscle lipid flux: Running water carries no poison. Am. J. Physiol. Endocrinol. Metab. 2011, 301, E245–E251. [Google Scholar] [CrossRef] [PubMed]
- Bosma, M.; Hesselink, M.K.C.; Sparks, L.M.; Timmers, S.; Ferraz, M.J.; Mattijssen, F.; van Beurden, D.; Schaart, G.; de Baets, M.H.; Verheyen, F.K.; et al. Perilipin 2 improves insulin sensitivity in skeletal muscle despite elevated intramuscular lipid levels. Diabetes 2012, 61, 2679–2690. [Google Scholar] [CrossRef]
- Shepherd, S.O.; Cocks, M.; Tipton, K.D.; Ranasinghe, A.M.; Barker, T.A.; Burniston, J.G.; Wagenmakers, A.J.; Shaw, C.S. Preferential utilization of perilipin 2-associated intramuscular triglycerides during 1 h of moderate-intensity endurance-type exercise. Exp. Physiol. 2012, 97, 970–980. [Google Scholar] [CrossRef] [Green Version]
- Lefebvre, P.; Chinetti, G.; Fruchart, J.C.; Staels, B. Sorting out the roles of PPAR alpha in energy metabolism and vascular homeostasis. J. Clin. Investig. 2006, 116, 571–580. [Google Scholar] [CrossRef]
- Koundourakis, N.E.; Androulakis, N.E.; Malliaraki, N.; Margioris, A.N. Vitamin D and exercise performance in professional soccer players. PLoS ONE 2014, 9, e101659. [Google Scholar] [CrossRef]
- Jablonski, K.L.; Chonchol, M.; Pierce, G.L.; Walker, A.E.; Seals, D.R. 25-Hydroxyvitamin D deficiency is associated with inflammation-linked vascular endothelial dysfunction in middle-aged and older adults. Hypertension 2011, 57, 63–69. [Google Scholar] [CrossRef]
- Andrukhova, O.; Slavic, S.; Zeitz, U.; Riesen, S.C.; Heppelmann, M.S.; Ambrisko, T.D.; Markovic, M.; Kuebler, W.M.; Erben, R.G. Vitamin D is a regulator of endothelial nitric oxide synthase and arterial stiffness in mice. Mol. Endocrinol. 2014, 28, 53–64. [Google Scholar] [CrossRef]
- Parker, B.; Capizzi, J.; Augeri, A.; Grimaldi, A.; Proctor, D.; Thompson, P. Sex-specific effect of aging on submaximal leg exercise hemodynamics in middle-aged and older adults. Eur. J. Appl. Physiol. 2011, 111, 1369–1379. [Google Scholar] [CrossRef]
- Shang, Y.; Gurley, K.; Symons, B.; Long, D.; Srikuea, R.; Crofford, L.J.; Peterson, C.A.; Yu, G. Noninvasive optical characterization of muscle blood flow, oxygenation, and metabolism in women with fibromyalgia. Arthritis Res. Ther. 2012, 14, R236. [Google Scholar] [CrossRef] [PubMed]
- Baty, F.; Ritz, C.; Jensen, S.M.; Kern, L.; Tamm, M.; Brutsche, M.H. Multimodel inference applied to oxygen recovery kinetics after 6-min walk tests in patients with chronic obstructive pulmonary disease. PLoS ONE 2017, 12, e0187548. [Google Scholar] [CrossRef]
- McMahon, S.; Wenger, H.A. The relationship between aerobic fitness and both power output and subsequent recovery during maximal intermittent exercise. J. Sci. Med. Sport 1998, 1, 219–227. [Google Scholar] [CrossRef]
- Zacharewicz, E.; Hesselink, M.K.C.; Schrauwen, P. Exercise counteracts lipotoxicity by improving lipid turnover and lipid droplet quality. J. Intern. Med. 2018. [Google Scholar] [CrossRef] [PubMed]
- Phielix, E.; Meex, R.; Moonen-Kornips, E.; Hesselink, M.K.; Schrauwen, P. Exercise training increases mitochondrial content and ex vivo mitochondrial function similarly in patients with type 2 diabetes and in control individuals. Diabetologia 2010, 53, 1714–1721. [Google Scholar] [CrossRef] [Green Version]
- Menshikova, E.V.; Ritov, V.B.; Fairfull, L.; Ferrell, R.E.; Kelley, D.E.; Goodpaster, B.H. Effects of exercise on mitochondrial content and function in aging human skeletal muscle. J. Gerontol. A Biol. Sci. Med. Sci. 2006, 61, 534–540. [Google Scholar] [CrossRef]
- Yousefzadeh, P.; Shapses, S.A.; Wang, X. Vitamin D Binding protein impact on 25-hydroxyvitamin D levels under different physiologic and pathologic conditions. Int. J. Endocrinol. 2014, 2014, 981581. [Google Scholar] [CrossRef]
- Powe, C.E.; Evans, M.K.; Wenger, J.; Zonderman, A.B.; Berg, A.H.; Nalls, M.; Tamez, H.; Zhang, D.; Bhan, I.; Karumanchi, S.A.; et al. Vitamin D-binding protein and vitamin D status of black Americans and white Americans. N. Engl. J. Med. 2013, 369, 1991–2000. [Google Scholar] [CrossRef]
- Hoofnagle, A.N.; Eckfeldt, J.H.; Lutsey, P.L. Vitamin D-binding protein concentrations quantified by mass spectrometry. N. Engl. J. Med. 2015, 373, 1480–1482. [Google Scholar] [CrossRef]


| Category | Measurement | CTL | AT | D | DAT |
|---|---|---|---|---|---|
| Demographics | N (Male/Female) | 10 (3/7) | 13 (7/6) | 13 (6/7) | 10 (5/5) |
| Age, years | 67.5 ± 2.1 | 68.6 ± 1.3 | 65.9 ± 1.6 | 67.9 ± 1.9 | |
| White | 9 | 13 | 12 | 9 | |
| Asian | 1 | 0 | 1 | 0 | |
| African American | 0 | 0 | 0 | 1 | |
| Anthropometric Measurements | Height, cm | 167 ± 3.0 | 170 ± 2.0 | 168 ± 3.0 | 169 ± 3.0 |
| Weight, kg | 75.1 ± 3.8 | 72.2 ± 3.4 | 76.1 ± 4.1 | 74.6 ± 5.0 | |
| BMI, kg/m | 27.0 ± 1.2 | 24.7 ± 0.8 | 26.6 ± 0.9 | 26.2 ± 1.5 | |
| Serum Measurements | 25(OH)D, ng/mL | 24.8 ± 2.1 | 25.2 ± 1.4 | 26.6 ± 1.2 | 27.1 ± 1.6 |
| VDBP, µg/mL | 110 ± 5 | 114 ± 3 | 111 ± 4 | 115 ± 5 | |
| iPTH, pg/mL | 36.8 ± 3.6 AB | 32.4 ± 2.6 B | 53.1 ± 5.5 C | 47.6 ± 5.0 BC | |
| Physiological Measurements | VO2max, mL/(kg min) | 25.8 ± 1.8 | 28.0 ± 2.9 | 28.4 ± 2.1 | 27.0 ± 2.8 |
| Light PA, min/d | 878 ± 67 | 839 ± 53 | 956 ± 68 | 806 ± 32 | |
| Moderate PA, min/d | 63.2 ± 11.7 | 52.0 ± 5.9 | 59.4 ± 7.7 | 69.6 ± 11.1 | |
| Vigorous PA, min/d | 0.28 ± 0.14 | 0.21 ± 0.11 | 0.69 ± 0.69 | 1.15 ± 0.82 | |
| MVC, N m | 128 ± 7.6 | 139 ± 10.9 | 149 ± 8.5 | 140 ± 10.7 | |
| Energy Intake, kcal/d | 1741 ± 156 | 2045 ± 325 | 1457 ± 119 | 1789 ± 241 |
| Value | Time point | CTL | AT | D | DAT |
|---|---|---|---|---|---|
| IMCL | Baseline | 4.84 ± 0.94 | 3.93 ± 0.67 | 3.93 ± 0.61 | 4.27 ± 0.93 |
| Endpoint | 5.01 ± 0.72 | 4.10 ± 0.92 | 3.95 ± 0.65 | 2.26 ± 0.61 | |
| Change | 0.16 ± 0.54 | 0.17 ± 0.68 | 0.02 ± 0.47 | −2.02 ± 0.78 * | |
| EMCL | Baseline | 27.3 ± 2.4 | 26.0 ± 1.1 | 28.0 ± 1.8 | 25.8 ± 1.4 |
| Endpoint | 25.5 ± 2.0 | 25.7 ± 1.4 | 28.0 ± 1.5 | 25.2 ± 1.8 | |
| Change | −1.7 ± 1.4 | −0.3 ± 1.0 | −0.4 ± 1.0 | −0.6 ± 0.7 | |
| IMCL:EMCL | Baseline | 0.162 ± 0.034 | 0.156 ± 0.025 | 0.150 ± 0.022 | 0.183 ± 0.039 |
| Endpoint | 0.218 ± 0.041 | 0.164 ± 0.040 | 0.141 ± 0.022 | 0.138 ± 0.048 | |
| Change | 0.056 ± 0.045 | 0.008 ± 0.028 | −0.001 ± 0.018 | −0.041 ± 0.040 |
© 2019 by the authors. Licensee MDPI, Basel, Switzerland. This article is an open access article distributed under the terms and conditions of the Creative Commons Attribution (CC BY) license (http://creativecommons.org/licenses/by/4.0/).
Share and Cite
Thomas, D.T.; Schnell, D.M.; Redzic, M.; Zhao, M.; Abraha, H.; Jones, D.; Brim, H.; Yu, G. Local In Vivo Measures of Muscle Lipid and Oxygen Consumption Change in Response to Combined Vitamin D Repletion and Aerobic Training in Older Adults. Nutrients 2019, 11, 930. https://0-doi-org.brum.beds.ac.uk/10.3390/nu11040930
Thomas DT, Schnell DM, Redzic M, Zhao M, Abraha H, Jones D, Brim H, Yu G. Local In Vivo Measures of Muscle Lipid and Oxygen Consumption Change in Response to Combined Vitamin D Repletion and Aerobic Training in Older Adults. Nutrients. 2019; 11(4):930. https://0-doi-org.brum.beds.ac.uk/10.3390/nu11040930
Chicago/Turabian StyleThomas, D. Travis, David M. Schnell, Maja Redzic, Mingjun Zhao, Hideat Abraha, Danielle Jones, Howard Brim, and Guoqiang Yu. 2019. "Local In Vivo Measures of Muscle Lipid and Oxygen Consumption Change in Response to Combined Vitamin D Repletion and Aerobic Training in Older Adults" Nutrients 11, no. 4: 930. https://0-doi-org.brum.beds.ac.uk/10.3390/nu11040930