Relation between Dietary Habits, Physical Activity, and Anthropometric and Vascular Parameters in Children Attending the Primary School in the Verona South District

 , and
, and
Abstract
:1. Introduction
2. Materials and Methods
2.1. Study Design
2.2. Food Frequency Questionnaire (FFQ)
2.3. Physical Activity
2.4. Statistics
3. Results
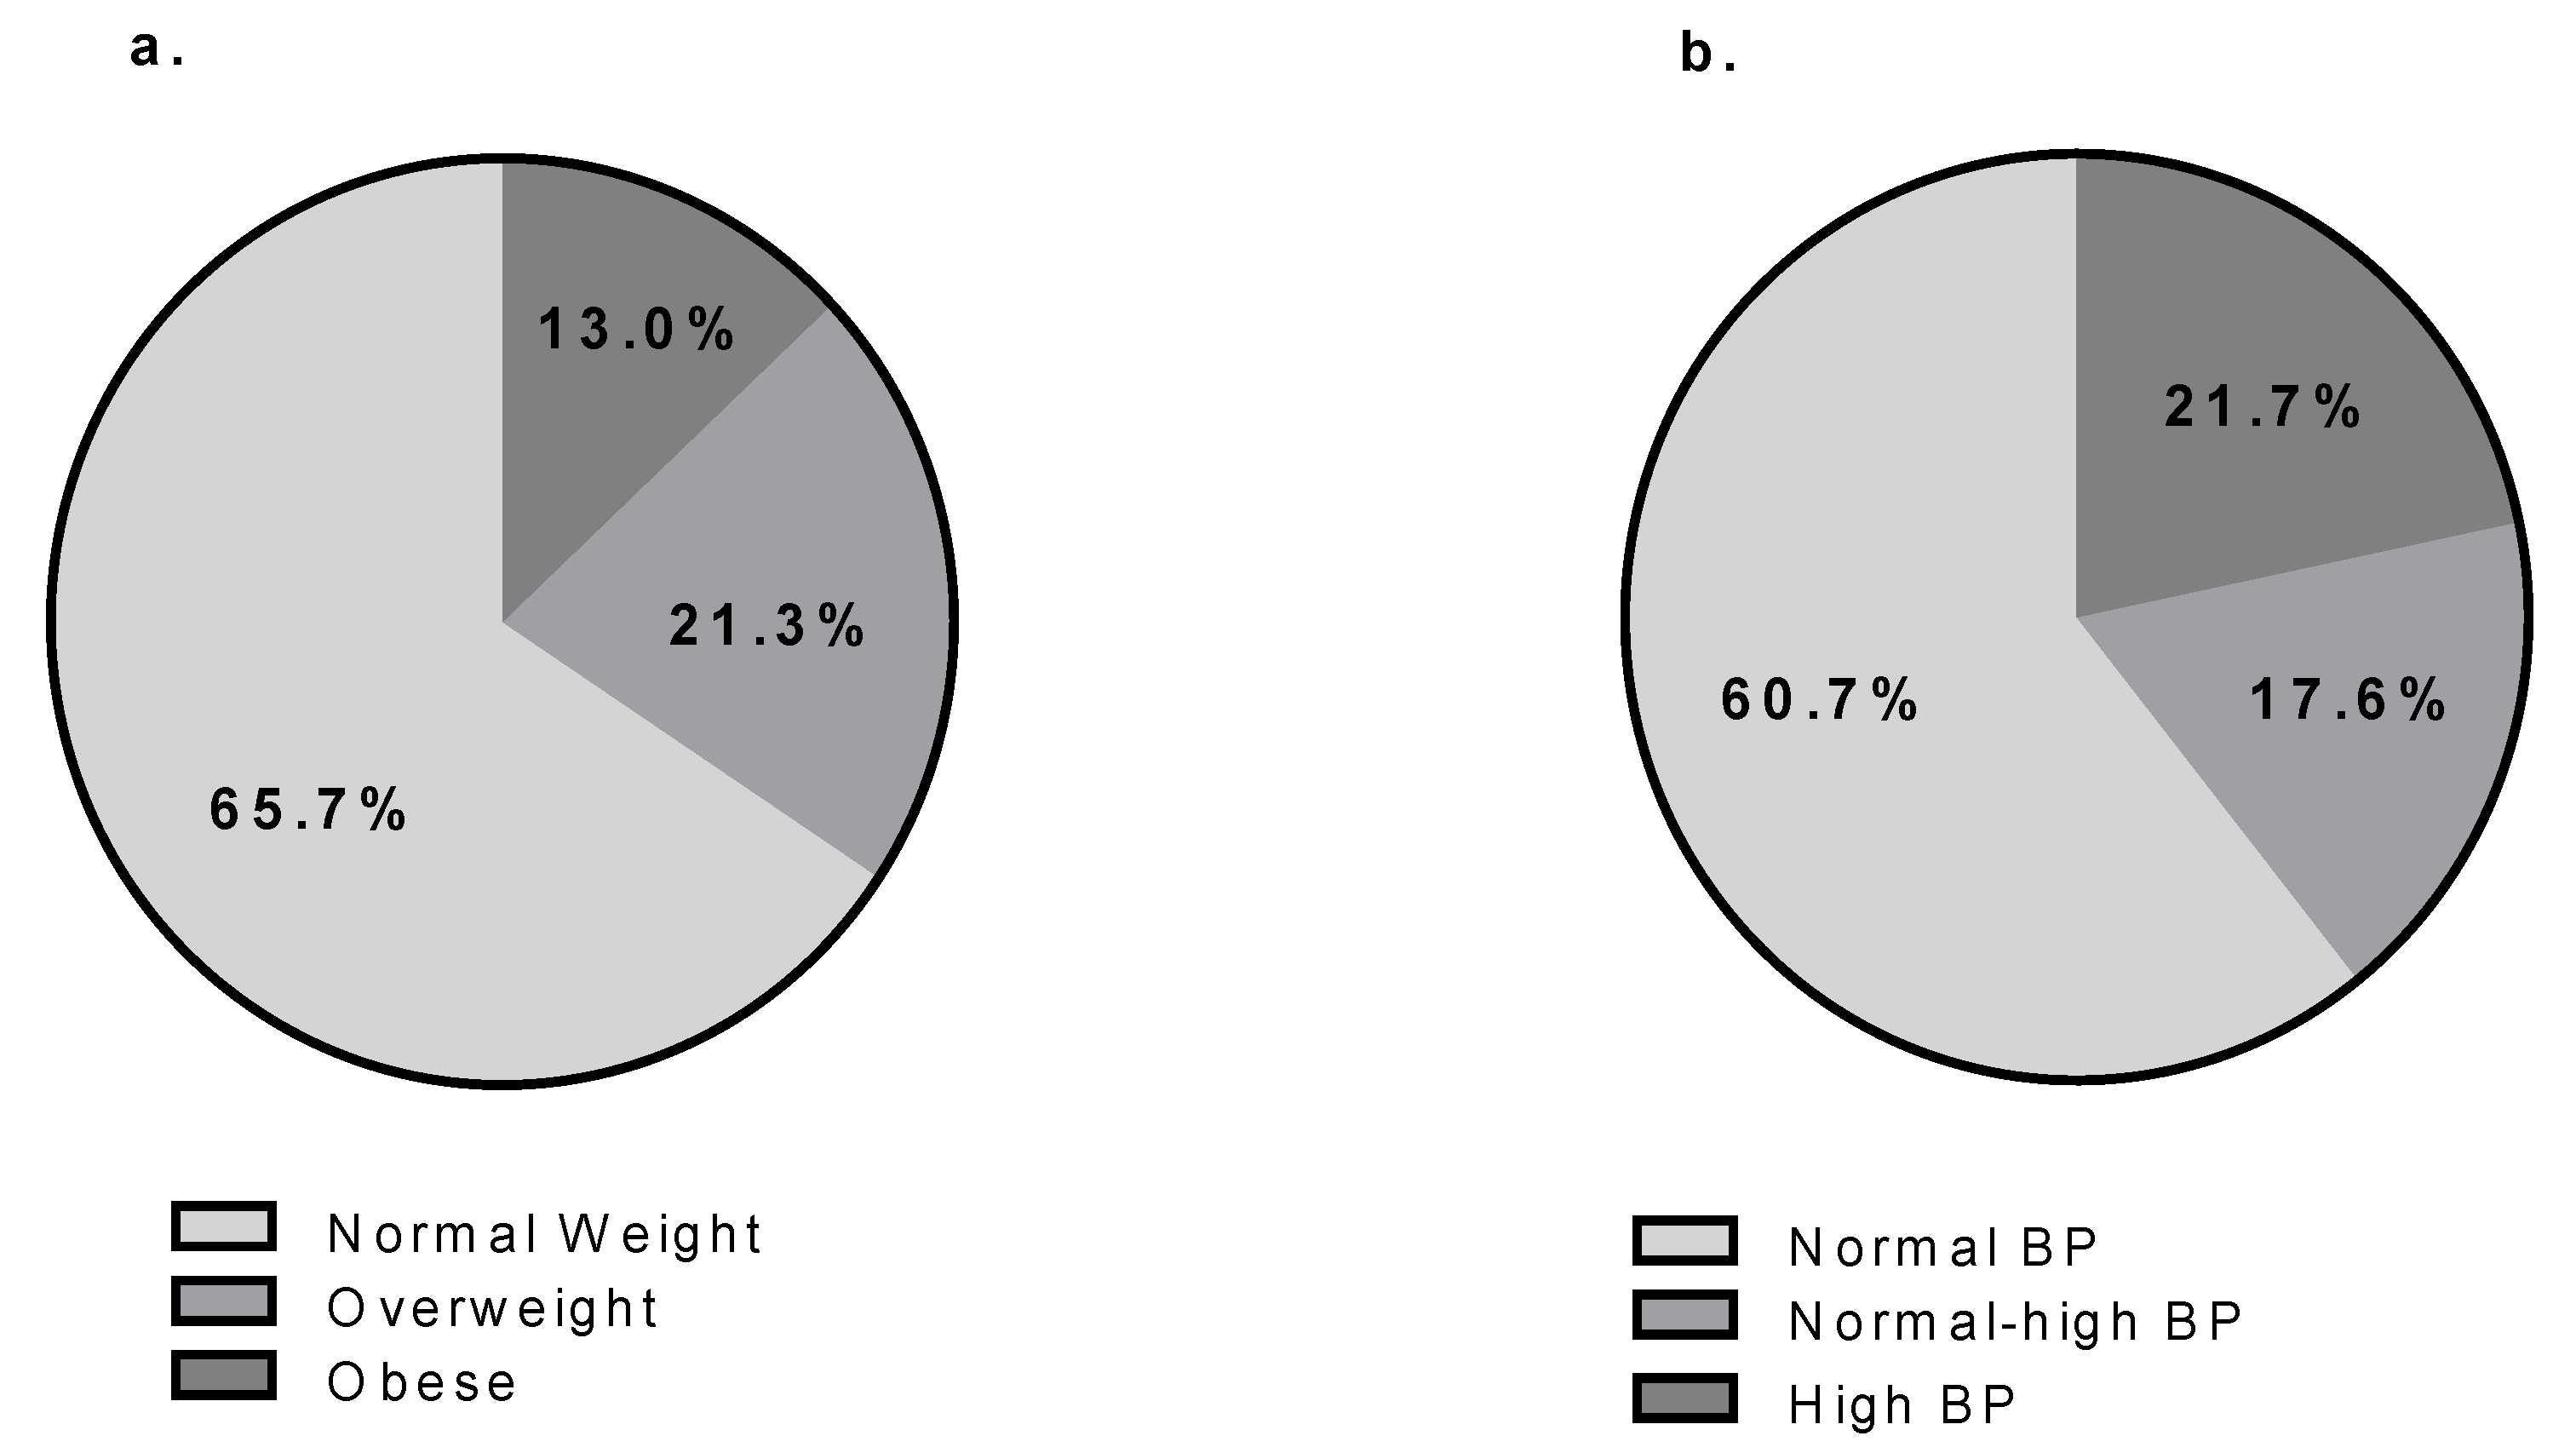
3.1. Characteristics of the Population
3.2. FFQ
3.2.1. Single FFQ Category
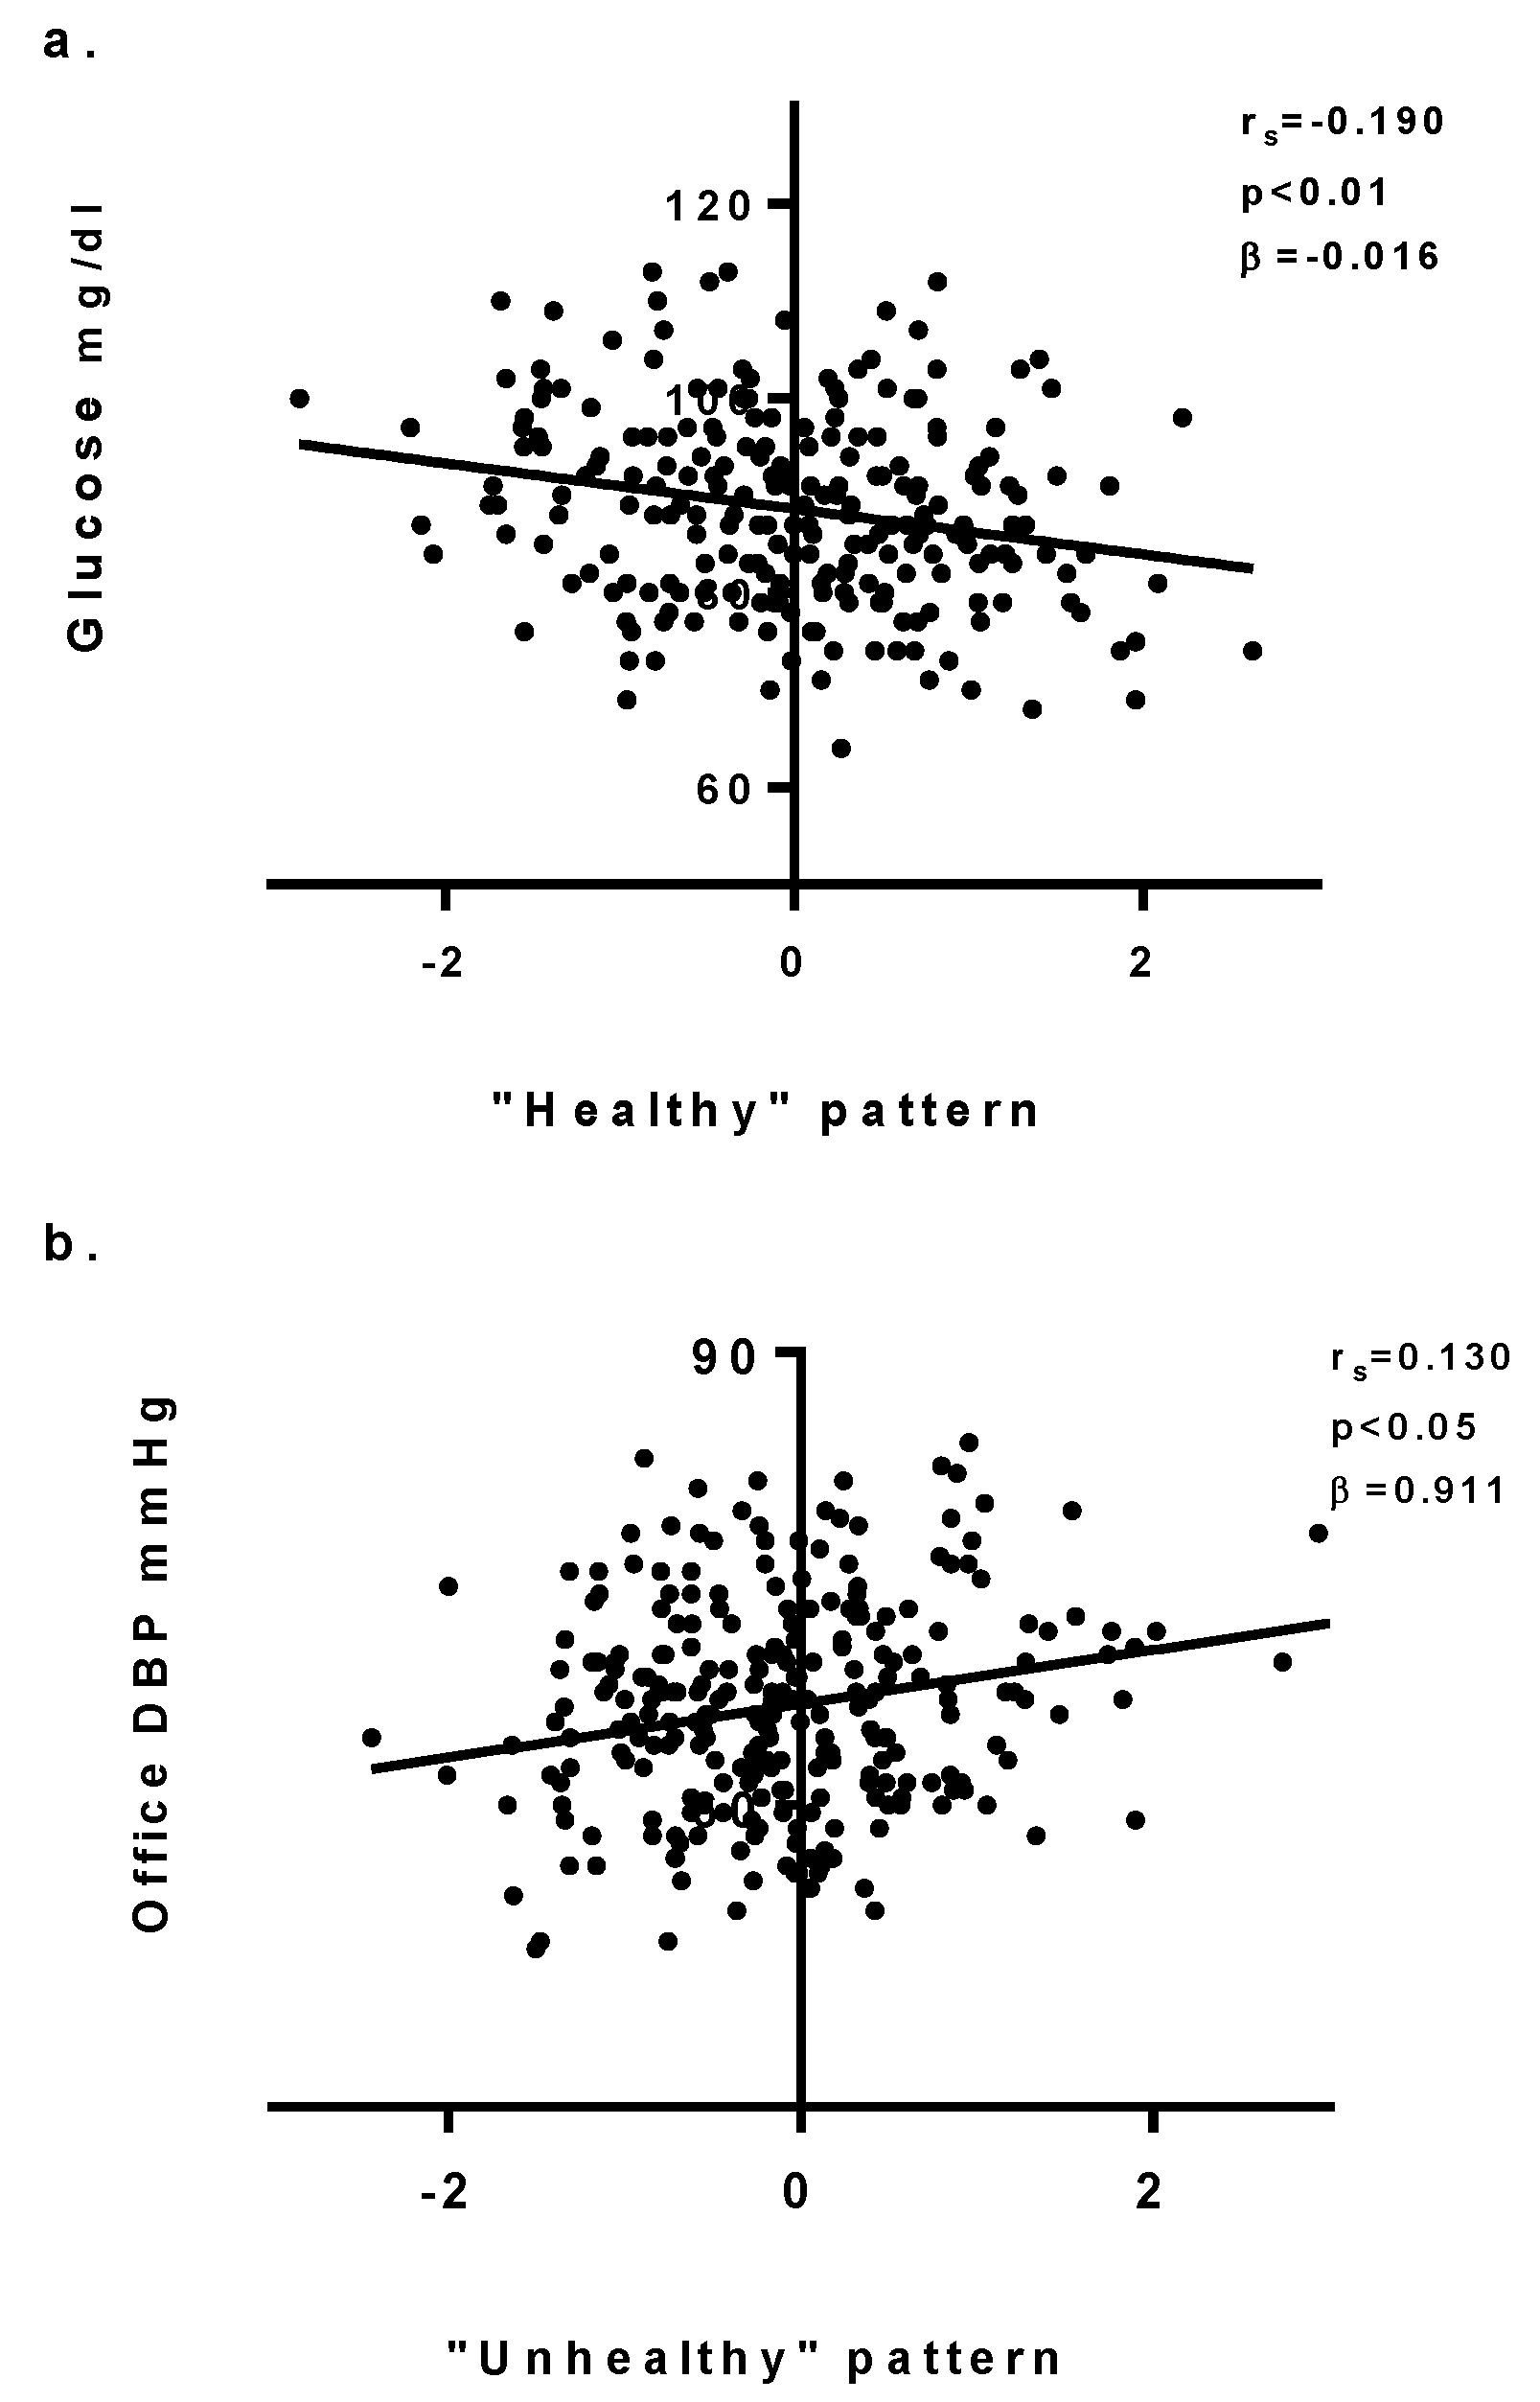
3.2.2. Dietary Pattern
3.3. Physical Activity
3.4. Multivariate Models
4. Discussion
5. Conclusions
Supplementary Materials
Author Contributions
Funding
Conflicts of Interest
References
- Funtikova, A.N.; Navarro, E.; Bawaked, R.A.; Fíto, M.; Schröder, H. Impact of diet on cardiometabolic health in children and adolescents. Nutr. J. 2015, 14, 118. [Google Scholar] [CrossRef] [Green Version]
- Rodrigues, A.N.; Abreu, G.R.; Resende, R.S.; Goncalves, W.L.; Gouvea, S.A. Cardiovascular risk factor investigation: A pediatric issue. Int. J. Gen. Med. 2013, 6, 57–66. [Google Scholar] [CrossRef] [PubMed]
- Hong, Y.M. Atherosclerotic cardiovascular disease beginning in childhood. Korean Circ. J. 2010, 40, 1–9. [Google Scholar] [CrossRef]
- Childhood overweight and obesity. Available online: http://www.who.int/dietphysicalactivity/childhood/en/ (accessed on 8 October 2018).
- WHO. Diet, Nutrition and the Prevention of Chronic Diseases; WHO: Geneva, Switzerland, 2003; Volume 916. [Google Scholar]
- Cardiovascular risk factors. Available online: https://www.world-heart-federation.org/resources/risk-factors/ (accessed on 8 October 2018).
- World Health Organization. Commission on Ending Childhood Obesity; Report of the Commission on Ending Childhood Obesity; WHO: Geneva, Switzerland, 2016; ISBN 9789241510066. [Google Scholar]
- Ambrosini, G.L. Childhood dietary patterns and later obesity: A review of the evidence. Proc. Nutr. Soc. 2014, 73, 137–146. [Google Scholar] [CrossRef]
- Estruch, R.; Martínez-González, M.A.; Corella, D.; Salas-Salvadó, J.; Ruiz-Gutiérrez, V.; Covas, M.I.; Fiol, M.; Gómez-Gracia, E.; López-Sabater, M.C.; Vinyoles, E.; et al. Effects of a Mediterranean-style diet on cardiovascular risk factors: A randomized trial. Ann. Intern. Med. 2006, 145, 1–11. [Google Scholar] [CrossRef] [PubMed]
- Carvalho, K.; Ronca, D.; Michels, N.; Huybrechts, I.; Cuenca-Garcia, M.; Marcos, A.; Molnár, D.; Dallongeville, J.; Manios, Y.; Schaan, B.; et al. Does the Mediterranean Diet Protect against Stress-Induced Inflammatory Activation in European Adolescents? The HELENA Study. Nutrients 2018, 10, 1770. [Google Scholar] [CrossRef]
- WHO. Information Sheet: Global Recommendations on Physical Activity for Health 5–17 Years Old; WHO: Geneva, Switzerland, 2015. [Google Scholar]
- Physical activity and young people. Available online: http://www.who.int/dietphysicalactivity/factsheet_young_people/en/ (accessed on 8 October 2018).
- Cole, T.J.; Bellizzi, M.C.; Flegal, K.M.; Dietz, W.H. Establishing a standard definition for child overweight and obesity worldwide: International survey. BMJ 2000, 320, 1240–1243. [Google Scholar] [CrossRef]
- Valerio, G.; Maffeis, C.; Saggese, G.; Ambruzzi, M.A.; Balsamo, A.; Bellone, S.; Bergamini, M.; Bernasconi, S.; Bona, G.; Calcaterra, V.; et al. Diagnosis, treatment and prevention of pediatric obesity: Consensus position statement of the Italian Society for Pediatric Endocrinology and Diabetology and the Italian Society of Pediatrics. Ital. J. Pediatr. 2018, 44, 88. [Google Scholar] [CrossRef] [PubMed]
- Morandi, A.; Miraglia del Giudice, E.; Martino, F.; Martino, E.; Bozzola, M.; Maffeis, C. Anthropometric Indices Are Not Satisfactory Predictors of Metabolic Comorbidities in Obese Children and Adolescents. J. Pediatr. 2014, 165, 1178.e2–1183.e2. [Google Scholar] [CrossRef]
- Sharma, A.K.; Metzger, D.L.; Daymont, C.; Hadjiyannakis, S.; Rodd, C.J. LMS tables for waist-circumference and waist-height ratio Z-scores in children aged 5–19 y in NHANES III: Association with cardio-metabolic risks. Pediatr. Res. 2015, 78, 723–729. [Google Scholar] [CrossRef] [PubMed]
- Stergiou, G.S.; Yiannes, N.G.; Rarra, V.C. Validation of the Omron 705 IT oscillometric device for home blood pressure measurement in children and adolescents: The Arsakion School Study. Blood Press. Monit. 2006, 11, 229–234. [Google Scholar] [CrossRef]
- National High Blood Pressure Education Program Working Group on High Blood Pressure in Children and Adolescents. The fourth report on the diagnosis, evaluation, and treatment of high blood pressure in children and adolescents. Pediatrics 2004, 114, 555–576. [Google Scholar] [CrossRef]
- Lurbe, E.; Agabiti-Rosei, E.; Cruickshank, J.K.; Dominiczak, A.; Erdine, S.; Hirth, A.; Invitti, C.; Litwin, M.; Mancia, G.; Pall, D.; et al. 2016 European Society of Hypertension guidelines for the management of high blood pressure in children and adolescents. J. Hypertens. 2016, 34, 1887–1920. [Google Scholar] [CrossRef] [Green Version]
- Stabouli, S.; Printza, N.; Zervas, C.; Dotis, J.; Chrysaidou, K.; Maliahova, O.; Antza, C.; Papachristou, F.; Kotsis, V. Comparison of the SphygmoCor XCEL device with applanation tonometry for pulse wave velocity and central blood pressure assessment in youth. J. Hypertens. 2018, 37, 30–36. [Google Scholar] [CrossRef] [PubMed]
- Elmenhorst, J.; Hulpke-Wette, M.; Barta, C.; Dalla Pozza, R.; Springer, S.; Oberhoffer, R. Percentiles for central blood pressure and pulse wave velocity in children and adolescents recorded with an oscillometric device. Atherosclerosis 2015, 238, 9–16. [Google Scholar] [CrossRef]
- Reusz, G.S.; Cseprekal, O.; Temmar, M.; Kis, É.; Cherif, A.B.; Thaleb, A.; Fekete, A.; Szabó, A.J.; Benetos, A.; Salvi, P. Reference Values of Pulse Wave Velocity in Healthy Children and Teenagers. Hypertension 2010, 56, 217–224. [Google Scholar] [CrossRef] [PubMed] [Green Version]
- Rapi, S.; Bazzini, C.; Tozzetti, C.; Sbolci, V.; Modesti, P.A. Point-of-care testing of cholesterol and triglycerides for epidemiologic studies: Evaluation of the multicare-in system. Transl. Res. 2009, 153, 71–76. [Google Scholar] [CrossRef]
- Lockyer, M.G.; Fu, K.; Edwards, R.M.; Collymore, L.; Thomas, J.; Hill, T.; Devaraj, S. Evaluation of the Nova StatStrip glucometer in a pediatric hospital setting. Clin. Biochem. 2014, 47, 840–843. [Google Scholar] [CrossRef]
- Rockett, H.R.H.; Breitenbach, M.; Frazier, A.L.; Witschi, J.; Wolf, A.M.; Field, A.E.; Colditz, G.A. Validation of a Youth/Adolescent Food Frequency Questionnaire. Prev. Med. 1997, 26, 808–816. [Google Scholar] [CrossRef]
- Manios, Y.; Androutsos, O.; Moschonis, G.; Birbilis, M.; Maragkopoulou, K.; Giannopoulou, A.; Argyri, E.; Kourlaba, G. Criterion validity of the Physical Activity Questionnaire for Schoolchildren (PAQ-S) in assessing physical activity levels: The Healthy Growth Study. J. Sports Med. Phys. Fitness 2013, 53, 502–508. [Google Scholar]
- Kowalski, K.C.; Crocker, P.R.E.; Faulkner, R.A. Validation of the Physical Activity Questionnaire for Older Children. Pediatr. Exerc. Sci. 1997, 9, 174–186. [Google Scholar] [CrossRef] [Green Version]
- Hu, F.B. Dietary pattern analysis: A new direction in nutritional epidemiology. Curr. Opin. Lipidol. 2002, 13, 3–9. [Google Scholar] [CrossRef]
- Tucker, K.L. Dietary patterns, approaches, and multicultural perspective. Appl. Physiol. Nutr. Metab. 2010, 35, 211–218. [Google Scholar] [CrossRef]
- Moeller, S.M.; Reedy, J.; Millen, A.E.; Dixon, L.B.; Newby, P.K.; Tucker, K.L.; Krebs-Smith, S.M.; Guenther, P.M. Dietary Patterns: Challenges and Opportunities in Dietary Patterns Research. J. Am. Diet. Assoc. 2007, 107, 1233–1239. [Google Scholar] [CrossRef] [PubMed]
- Esmaillzadeh, A.; Kimiagar, M.; Mehrabi, Y.; Azadbakht, L.; Hu, F.B.; Willett, W.C. Dietary patterns, insulin resistance, and prevalence of the metabolic syndrome in women. Am. J. Clin. Nutr. 2007, 85, 910–918. [Google Scholar] [CrossRef] [Green Version]
- IPAQ Research Committee. Guidelines for data Processing and Analysis of the International Physical Activity Questionnaire (IPAQ)—Short and Long Form Scoring. Available online: https://sites.google.com/site/theipaq/ (accessed on 14 November 2018).
- Ainsworth, B.E.; Haskell, W.L.; Herrmann, S.D.; Meckes, N.; Bassett, D.R., Jr.; Tudor-Locke, C.; Greer, J.L.; Vezina, J.; Whitt-Glover, M.C.; Leon, A.S.; et al. 2011 Compendium of Physical Activities: A second update of codes and MET values. Med. Sci. Sports Exerc. 2011, 43, 1575–1581. [Google Scholar] [CrossRef] [PubMed]
- Cura, A.; Nardone, D.P.; Spinelli, A.; Buoncristiano, M.; Lauria, L.; Pierannunzio, D.; Galeone, D. IL Sistema di sorveglianza OKkio alla SALUTE: Risultati 2016; Istituto Superiore di Sanità: Roma, Italy, 2016. [Google Scholar]
- Saladini, F.; Palatini, P. Isolated Systolic Hypertension in Young Individuals: Pathophysiological Mechanisms, Prognostic Significance, and Clinical Implications. High Blood Press. Cardiovasc. Prev. 2017, 24, 133–139. [Google Scholar] [CrossRef] [PubMed]
- Dionne, J.M. Updated Guideline May Improve the Recognition and Diagnosis of Hypertension in Children and Adolescents; Review of the 2017 AAP Blood Pressure Clinical Practice Guideline. Curr. Hypertens. Rep. 2017, 19, 84. [Google Scholar] [CrossRef] [PubMed]
- Menghetti, E.; Strisciuglio, P.; Spagnolo, A.; Carletti, M.; Paciotti, G.; Muzzi, G.; Beltemacchi, M.; Concolino, D.; Strambi, M.; Rosano, A. Hypertension and obesity in Italian school children: The role of diet, lifestyle and family history. Nutr. Metab. Cardiovasc. Dis. 2015, 25, 602–607. [Google Scholar] [CrossRef] [PubMed]
- Orlando, A.; Cazzaniga, E.; Giussani, M.; Palestini, P.; Genovesi, S. Hypertension in Children: Role of Obesity, Simple Carbohydrates, and Uric Acid. Front. Public Health 2018, 6, 129. [Google Scholar] [CrossRef]
- Prasad, M.; Takkinen, H.-M.; Uusitalo, L.; Tapanainen, H.; Ovaskainen, M.-L.; Alfthan, G.; Erlund, I.; Ahonen, S.; Åkerlund, M.; Toppari, J.; et al. Carotenoid Intake and Serum Concentration in Young Finnish Children and Their Relation with Fruit and Vegetable Consumption. Nutrients 2018, 10, 1533. [Google Scholar] [CrossRef]
- Wall, C.; Stewart, A.; Hancox, R.; Murphy, R.; Braithwaite, I.; Beasley, R.; Mitchell, E.; Group, T.I.P.T.S.; Wall, C.R.; Stewart, A.W.; et al. Association between Frequency of Consumption of Fruit, Vegetables, Nuts and Pulses and BMI: Analyses of the International Study of Asthma and Allergies in Childhood (ISAAC). Nutrients 2018, 10, 316. [Google Scholar] [CrossRef] [PubMed]
- Braithwaite, I.; Stewart, A.W.; Hancox, R.J.; Beasley, R.; Murphy, R.; Mitchell, E.A.; ISAAC Phase Three Study Group. Fast-food consumption and body mass index in children and adolescents: An international cross-sectional study. BMJ Open 2014, 4, e005813. [Google Scholar] [CrossRef] [PubMed]
- Hughes, A.R.; Henderson, A.; Ortiz-Rodriguez, V.; Artinou, M.L.; Reilly, J.J. Habitual physical activity and sedentary behaviour in a clinical sample of obese children. Int. J. Obes. 2006, 30, 1494–1500. [Google Scholar] [CrossRef] [PubMed] [Green Version]
- Thompson, A.M.; Thompson, A.M.; Campagna, P.D.; Durant, M.; Murphy, R.J.L.; Rehman, L.A.; Wadsworth, L.A. Are overweight students in Grades 3, 7, and 11 less physically active than their healthy weight counterparts? Int. J. Pediatr. Obes. 2009, 4, 28–35. [Google Scholar] [CrossRef]
- Schwarzfischer, P.; Weber, M.; Gruszfeld, D.; Socha, P.; Luque, V.; Escribano, J.; Xhonneux, A.; Verduci, E.; Mariani, B.; Koletzko, B.; et al. BMI and recommended levels of physical activity in school children. BMC Public Health 2017, 17, 595. [Google Scholar] [CrossRef]
- Janssen, I.; LeBlanc, A.G. Systematic review of the health benefits of physical activity and fitness in school-aged children and youth. Int. J. Behav. Nutr. Phys. Act. 2010, 7, 40. [Google Scholar] [CrossRef]
- Aatola, H.; Koivistoinen, T.; Hutri-Kähönen, N.; Juonala, M.; Mikkilä, V.; Lehtimäki, T.; Viikari, J.S.A.; Raitakari, O.T.; Kähönen, M. Lifetime Fruit and Vegetable Consumption and Arterial Pulse Wave Velocity in Adulthood. Circulation 2010, 122, 2521–2528. [Google Scholar] [CrossRef] [PubMed]
- Rodríguez-Martin, C.; Alonso-Domínguez, R.; Patino-Alonso, M.C.; Gómez-Marcos, M.A.; Maderuelo-Fernández, J.A.; Martin-Cantera, C.; García-Ortiz, L.; Recio-Rodríguez, J.I. The EVIDENT diet quality index is associated with cardiovascular risk and arterial stiffness in adults. BMC Public Health 2017, 17, 305. [Google Scholar] [CrossRef]
- Lydakis, C.; Stefanaki, E.; Stefanaki, S.; Thalassinos, E.; Kavousanaki, M.; Lydaki, D. Correlation of blood pressure, obesity, and adherence to the Mediterranean diet with indices of arterial stiffness in children. Eur. J. Pediatr. 2012, 171, 1373–1382. [Google Scholar] [CrossRef]
- Freeman, A.M.; Morris, P.B.; Barnard, N.; Esselstyn, C.B.; Ros, E.; Agatston, A.; Devries, S.; O’Keefe, J.; Miller, M.; Ornish, D.; et al. Trending Cardiovascular Nutrition Controversies. J. Am. Coll. Cardiol. 2017, 69, 1172–1187. [Google Scholar] [CrossRef] [PubMed]
- Wang, P.-Y.; Fang, J.-C.; Gao, Z.-H.; Zhang, C.; Xie, S.-Y. Higher intake of fruits, vegetables or their fiber reduces the risk of type 2 diabetes: A meta-analysis. J. Diabetes Investig. 2016, 7, 56–69. [Google Scholar] [CrossRef] [PubMed]
- de Souza, R.G.M.; Schincaglia, R.M.; Pimentel, G.D.; Mota, J.F.; de Souza, R.G.M.; Schincaglia, R.M.; Pimentel, G.D.; Mota, J.F. Nuts and Human Health Outcomes: A Systematic Review. Nutrients 2017, 9, 1311. [Google Scholar] [CrossRef]
- Freeman, A.M.; Morris, P.B.; Aspry, K.; Gordon, N.F.; Barnard, N.D.; Esselstyn, C.B.; Ros, E.; Devries, S.; O’Keefe, J.; Miller, M.; et al. A Clinician’s Guide for Trending Cardiovascular Nutrition Controversies: Part II. J. Am. Coll. Cardiol. 2018, 72, 553–568. [Google Scholar] [CrossRef]
- Bonafini, S.; Tagetti, A.; Gaudino, R.; Cavarzere, P.; Montagnana, M.; Danese, E.; Benati, M.; Ramaroli, D.A.; Raimondi, S.; Giontella, A.; et al. Individual fatty acids in erythrocyte membranes are associated with several features of the metabolic syndrome in obese children. Eur. J. Nutr. 2018. [Google Scholar] [CrossRef]
- Freisling, H.; Noh, H.; Slimani, N.; Chajès, V.; May, A.M.; Peeters, P.H.; Weiderpass, E.; Cross, A.J.; Skeie, G.; Jenab, M.; et al. Nut intake and 5-year changes in body weight and obesity risk in adults: Results from the EPIC-PANACEA study. Eur. J. Nutr. 2018, 57, 2399–2408. [Google Scholar] [CrossRef]
- Henriksson, P.; Cuenca-García, M.; Labayen, I.; Esteban-Cornejo, I.; Henriksson, H.; Kersting, M.; Vanhelst, J.; Widhalm, K.; Gottrand, F.; Moreno, L.A.; et al. Diet quality and attention capacity in European adolescents: The Healthy Lifestyle in Europe by Nutrition in Adolescence (HELENA) study. Br. J. Nutr. 2017, 117, 1587–1595. [Google Scholar] [CrossRef]
- Hinnig, P.; Monteiro, J.; de Assis, M.; Levy, R.; Peres, M.; Perazi, F.; Porporatti, A.; Canto, G. Dietary Patterns of Children and Adolescents from High, Medium and Low Human Development Countries and Associated Socioeconomic Factors: A Systematic Review. Nutrients 2018, 10, 436. [Google Scholar] [CrossRef]
- Boucher, J.L. Mediterranean Eating Pattern. Diabetes Spectr. 2017, 30, 72–76. [Google Scholar] [CrossRef]
- Salas-Salvadó, J.; Becerra-Tomás, N.; García-Gavilán, J.F.; Bulló, M.; Barrubés, L. Mediterranean Diet and Cardiovascular Disease Prevention: What Do We Know? Prog. Cardiovasc. Dis. 2018, 61, 62–67. [Google Scholar] [CrossRef]
- Bonafini, S.; Antoniazzi, F.; Maffeis, C.; Minuz, P.; Fava, C. Beneficial effects of ω-3 PUFA in children on cardiovascular risk factors during childhood and adolescence. Prostaglandins Other Lipid Mediat. 2015, 120, 72–79. [Google Scholar] [CrossRef] [PubMed]
- Malakou, E.; Linardakis, M.; Armstrong, M.; Zannidi, D.; Foster, C.; Johnson, L.; Papadaki, A. The Combined Effect of Promoting the Mediterranean Diet and Physical Activity on Metabolic Risk Factors in Adults: A Systematic Review and Meta-Analysis of Randomised Controlled Trials. Nutrients 2018, 10, 1577. [Google Scholar] [CrossRef]
- Lind, L.; Carlsson, A.C.; Siegbahn, A.; Sundström, J.; Ärnlöv, J. Impact of physical activity on cardiovascular status in obesity. Eur. J. Clin. Investig. 2017, 47, 167–175. [Google Scholar] [CrossRef]
- Zimmer, P.; Bloch, W. Physical exercise and epigenetic adaptations of the cardiovascular system. Herz 2015, 40, 353–360. [Google Scholar] [CrossRef]
- Gerage, A.M.; Benedetti, T.R.B.; Farah, B.Q.; da S. Santana, F.; Ohara, D.; Andersen, L.B.; Ritti-Dias, R.M. Sedentary Behavior and Light Physical Activity Are Associated with Brachial and Central Blood Pressure in Hypertensive Patients. PLoS ONE 2015, 10, e0146078. [Google Scholar] [CrossRef] [PubMed]
- Müller, J.; Meyer, J.; Elmenhorst, J.; Oberhoffer, R. Body Weight and Not Exercise Capacity Determines Central Systolic Blood Pressure, a Surrogate for Arterial Stiffness, in Children and Adolescents. J. Clin. Hypertens. 2016, 18, 762–765. [Google Scholar] [CrossRef]
- Raitakari, O.T.; Porkka, K.V.; Taimela, S.; Telama, R.; Räsänen, L.; Viikari, J.S. Effects of persistent physical activity and inactivity on coronary risk factors in children and young adults. The Cardiovascular Risk in Young Finns Study. Am. J. Epidemiol. 1994, 140, 195–205. [Google Scholar] [CrossRef] [PubMed]
- Sirard, J.R.; Pate, R.R. Physical Activity Assessment in Children and Adolescents. Sports Med. 2001, 31, 439–454. [Google Scholar] [CrossRef]
- Ruiz, J.R.; Castro-Pinero, J.; Artero, E.G.; Ortega, F.B.; Sjostrom, M.; Suni, J.; Castillo, M.J. Predictive validity of health-related fitness in youth: A systematic review. Br. J. Sports Med. 2009, 43, 909–923. [Google Scholar] [CrossRef]
- Galan-Lopez, P.; Ries, F.; Gisladottir, T.; Domínguez, R.; Sánchez-Oliver, A.; Galan-Lopez, P.; Ries, F.; Gisladottir, T.; Domínguez, R.; Sánchez-Oliver, A.J. Healthy Lifestyle: Relationship between Mediterranean Diet, Body Composition and Physical Fitness in 13 to 16-Years Old Icelandic Students. Int. J. Environ. Res. Public Health 2018, 15, 2632. [Google Scholar] [CrossRef]


| Characteristics | Male (n = 150) | Female (n = 150) | p-Value |
|---|---|---|---|
| mean ± SD | mean ± SD | ||
| Age; ys | 8.7 ± 0.8 | 8.6 ± 0.7 | n.s. |
| Caucasian ethnicity; n (%) | 102 (68.0) | 94 (62.7) | n.s. |
| Other ethnicities; n (%) | 48 (32.0) | 56 (37.3) | |
| BMI; kg/m2 | 18.1 ± 3.2 | 18.2 ± 3.6 | n.s |
| BMI; percentile for age | 63.9 ± 30.1 | 61.6 ± 31.6 | n.s. |
| Normal weight; n (%) | 95.0 (63.3) | 102.0 (68.0) | |
| Overweight; n (%) | 35.0 (20.3) | 29.0 (19.3) | n.s. |
| Obese; n (%) | 20.0 (13.4) | 19.0 (12.7) | |
| Waist-height ratio | 0.46 ± 0.8 | 0.46 ± 0.8 | n.s. |
| Waist-height ratio; percentile | 44.4 ± 31.7 | 48.0 ± 31.3 | n.s. |
| Brachial SBP; mmHg | 110.5 ± 9.5 | 110.2 ± 10.3 | n.s. |
| Brachial DBP; mmHg | 66.3 ± 7.4 | 67.2 ± 8.1 | n.s. |
| Brachial SBP; percentile | 75.9 ± 20.5 | 75.9 ± 20.5 | n.s. |
| Brachial DBP; percentile | 70.2 ± 19.2 | 71.6 ± 20.5 | n.s. |
| Normal BP; n (%) | 95 (63.3) | 87 (58) | n.s. |
| High BP; n (%) | 55 (36.7) | 63 (42) | |
| Pulse Wave Velocity; m/s | 4.6 ± 1.0 | 4.6 ± 0.8 | n.s. |
| Pulse Wave Velocity; percentile for height | 61.6 ± 40.2 | 58.4 ± 38.5 | n.s. |
| cSBP; mmHg | 100.2 ± 9.3 | 101.5 ± 10.7 | n.s. |
| cSBP <90° percentile for height; n (%) | 76.4 ± 27.2 | 78.1 ± 28.5 | n.s. |
| cSBP >90° percentile for height; n (%) | 68 (46.3) | 78 (53.4) | n.s. |
| Capillary Triglycerides; mg/dl | 178.4 ± 84.0 | 165.7 ± 62.4 | p < 0.001 |
| Capillary Cholesterol; mg/dl | 241.5 ± 36.4 | 221.2 ± 38.5 | n.s. |
| Capillary Glucose; mg/dl | 92.3 ± 8.8 | 86.0 ± 10.4 | p < 0.001 |
| Energy intake kcal/die | 2933.2 ± 932.0 | 3031.6 ± 1138.0 | n.s. |
| PAQ-C Score | 1.9 ± 0.4 | 1.8 ± 0.5 | p < 0.05 |
| Moderate-vigorous activity (MET-min/wk) | 3825.2 ± 4230.7 | 2721.1 ± 3578.2 | p < 0.05 |
| Characteristics | Fast Food | Cereals and Tubers | Vegetables | Fruit | Eggs | Meat | Dairy Product | Sweets | Legumes | Fish | Nuts | EVO oil | Animal-Derived Fat | Seed Oil |
|---|---|---|---|---|---|---|---|---|---|---|---|---|---|---|
| BMI, kg/m2 | 0.129* | −0.080 | −0.093 | 0.067 | −0.028 | 0.042 | 0.102 | −0.052 | −0.020 | −0.040 | −0.049 | 0.076 | 0.057 | 0.07 |
| Z-score BMI | 0.141* | −0.081 | −0.090 | 0.044 | −0.040 | 0.044 | 0.091 | −0.039 | −0.021 | −0.030 | −0.064 | 0.092 | 0.064 | 0.093 |
| Waist-height ratio | 0.062 | −0.048 | −0.105 | 0.025 | −0.093 | 0.051 | 0.37 | −0.045 | −0.062 | −0.085 | −0.027 | 0.060 | 0.006 | 0.046 |
| Z-score waist-height ratio | 0.074 | −0.036 | −0.095 | 0.018 | −0.106 | 0.044 | 0.031 | −0.039 | −0.083 | −0.088 | −0.041 | 0.057 | 0.007 | 0.034 |
| Brachial SBP, mmHg | 0.013 | 0.043 | −0.052 | 0.106 | −0.003 | 0.042 | 0.091 | 0.026 | 0.010 | 0.084 | 0.066 | −0.091 | 0.064 | 0.117* |
| Z-score Brachial SBP | −0.005 | 0.069 | −0.051 | 0.087 | −0.042 | 0.034 | 0.063 | 0.020 | 0.000 | 0.078 | 0.069 | −0.260 | 0.025 | 0.076 |
| Brachial DBP, mmHg | 0.124* | 0.025 | −0.101 | 0.006 | 0.019 | 0.128* | 0.027 | 0.048 | −0.020 | 0.017 | −0.057 | −0.006 | 0.008 | 0.09 |
| Z-score Brachial DBP | 0.118* | 0.023 | −0.107 | −0.029 | −0.010 | 0.121* | 0.009 | 0.061 | −0.033 | 0.006 | −0.057 | −0.064 | 0.008 | 0.079 |
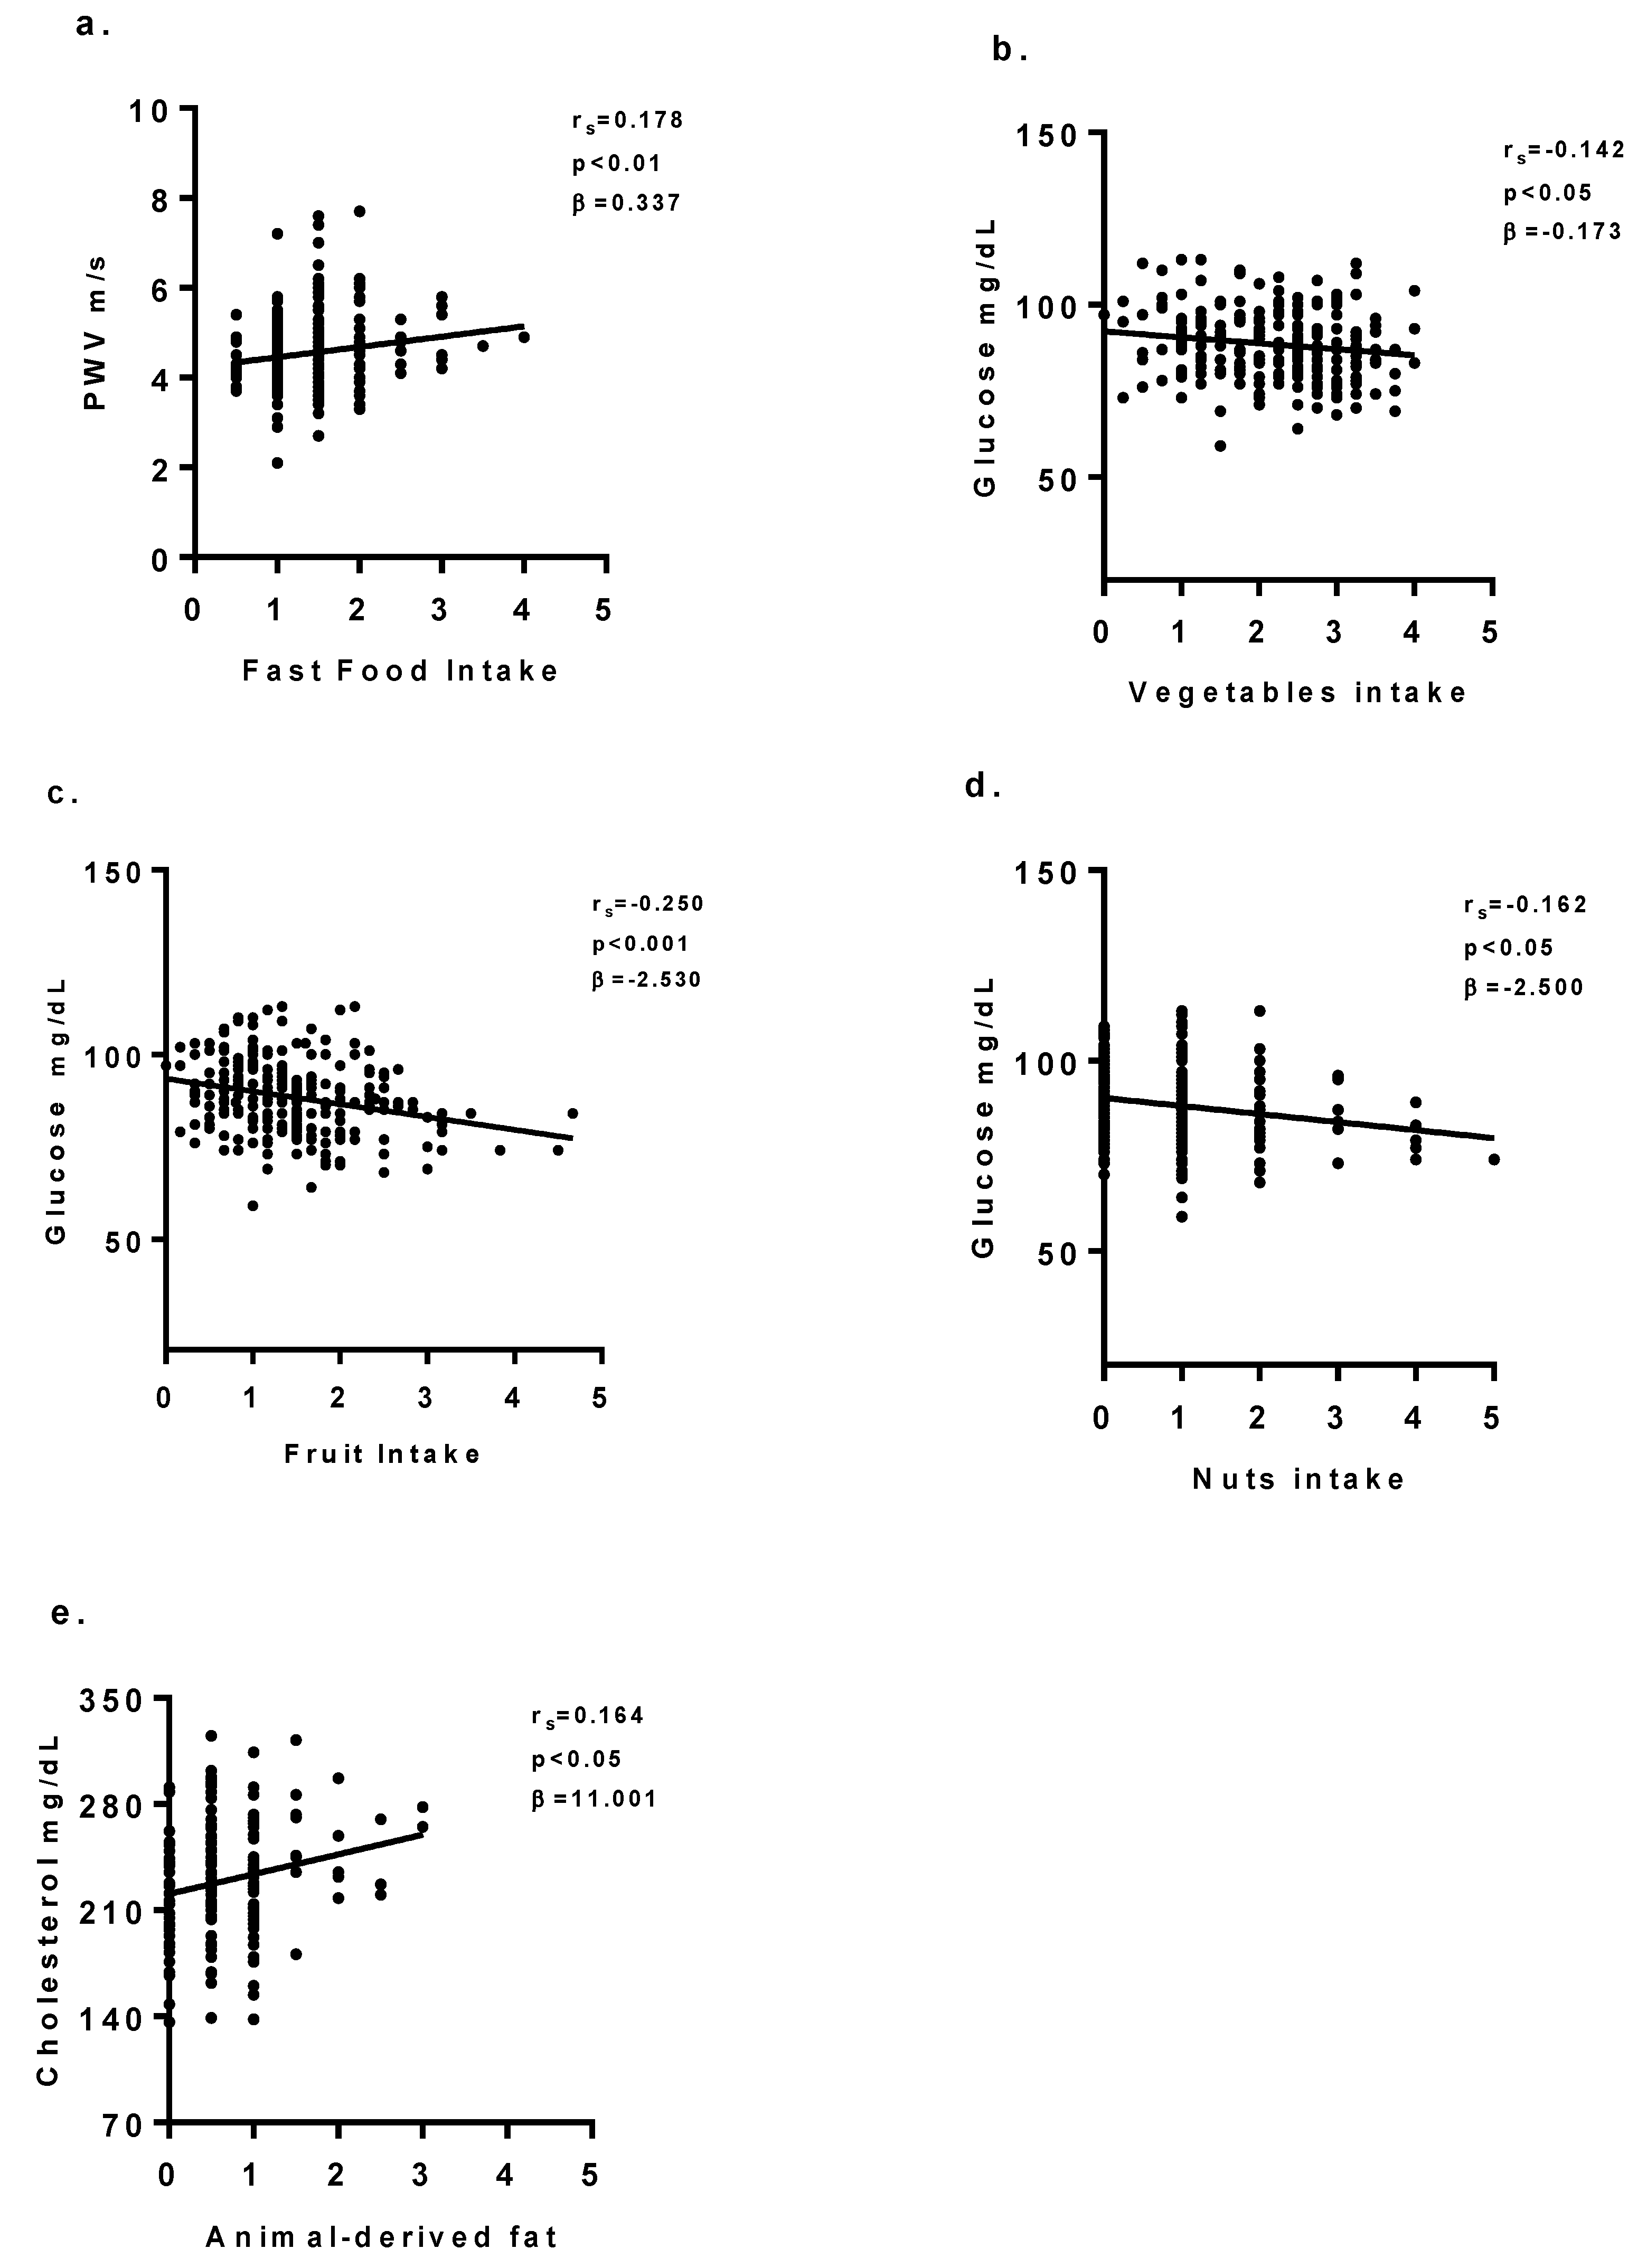
| PWV, m/s | 0.178** | 0.017 | −0.021 | 0.154** | 0.035 | 0.110 | −0.030 | −0.022 | 0.037 | 0.013 | 0.040 | −.056 | 0.048 | 0.111 |
| Z-score PWV | 0.158** | 0.002 | −0.003 | 0.130* | 0.009 | 0.126* | −0.052 | −0.020 | 0.023 | 0.022 | 0.036 | −0.075 | 0.011 | 0.090 |
| cSBP, mmHg | 0.140* | 0.021 | 0.011 | 0.102 | −0.013 | 0.073 | 0.004 | 0.047 | 0.039 | 0.076 | 0.043 | −0.075 | −0.038 | 0.07 |
| Z-score cSBP | 0.123* | 0.026 | 0.009 | 0.082 | −0.056 | 0.051 | −0.021 | 0.032 | 0.026 | 0.053 | 0.050 | −0.070 | −0.028 | 0.07 |
| C-Triglycerides mg/dl | 0.145* | −0.013 | −0.062 | −0.029 | −0.072 | −0.038 | −0.024 | −0.083 | −0.077 | −0.120 | 0.019 | −0.039 | 0.023 | −0.390 |
| C-Cholesterol mg/dl | 0.087 | −0.062 | 0.029 | −0.092 | −0.029 | −0.077 | −0.129 | −0.066 | −0.011 | 0.074 | 0.096 | −0.036 | 0.164* | −0.015 |
| C-Glucose mg/dl | −0.018 | −0.088 | −0.142* | −0.250** | −0.035 | −0.066 | −0.080 | −0.088 | −0.100 | −0.110 | −0.16* | −0.024 | 0.071 | −0.056 |
© 2019 by the authors. Licensee MDPI, Basel, Switzerland. This article is an open access article distributed under the terms and conditions of the Creative Commons Attribution (CC BY) license (http://creativecommons.org/licenses/by/4.0/).
Share and Cite
Giontella, A.; Bonafini, S.; Tagetti, A.; Bresadola, I.; Minuz, P.; Gaudino, R.; Cavarzere, P.; Ramaroli, D.A.; Marcon, D.; Branz, L.; et al. Relation between Dietary Habits, Physical Activity, and Anthropometric and Vascular Parameters in Children Attending the Primary School in the Verona South District. Nutrients 2019, 11, 1070. https://0-doi-org.brum.beds.ac.uk/10.3390/nu11051070
Giontella A, Bonafini S, Tagetti A, Bresadola I, Minuz P, Gaudino R, Cavarzere P, Ramaroli DA, Marcon D, Branz L, et al. Relation between Dietary Habits, Physical Activity, and Anthropometric and Vascular Parameters in Children Attending the Primary School in the Verona South District. Nutrients. 2019; 11(5):1070. https://0-doi-org.brum.beds.ac.uk/10.3390/nu11051070
Chicago/Turabian StyleGiontella, Alice, Sara Bonafini, Angela Tagetti, Irene Bresadola, Pietro Minuz, Rossella Gaudino, Paolo Cavarzere, Diego Alberto Ramaroli, Denise Marcon, Lorella Branz, and et al. 2019. "Relation between Dietary Habits, Physical Activity, and Anthropometric and Vascular Parameters in Children Attending the Primary School in the Verona South District" Nutrients 11, no. 5: 1070. https://0-doi-org.brum.beds.ac.uk/10.3390/nu11051070