Food Composition Impacts the Accuracy of Wearable Devices When Estimating Energy Intake from Energy-Dense Food


Abstract
:1. Introduction
2. Materials and Methods
2.1. Participants
2.2. Study Device
2.3. Study Procedures
2.4. Power Analysis
2.5. Statistical Analysis
3. Results
4. Discussion
5. Conclusions
Author Contributions
Funding
Conflicts of Interest
References
- Ezzati, M.; Riboli, E. Behavioral and dietary risk factors for noncommunicable diseases. N. Engl. J. Med. 2013, 369, 954–964. [Google Scholar] [CrossRef] [PubMed]
- Who, J.; Consultation, F.E. Diet, Nutrition and the Prevention of Chronic Diseases; World Health Organ Tech. Rep Ser; World Health Organization: Geneva, Switzerland, 2003; Volume 916. [Google Scholar]
- Hébert, J.R.; Hurley, T.G.; Steck, S.E.; Miller, D.R.; Tabung, F.K.; Peterson, K.E.; Kushi, L.H.; Frongillo, E.A. Considering the value of dietary assessment data in informing nutrition-related health policy. Adv. Nutr. Int. Rev. J. 2014, 5, 447–455. [Google Scholar] [CrossRef] [PubMed]
- Thompson, F.E.; Subar, A.F.; Loria, C.M.; Reedy, J.L.; Baranowski, T. Need for technological innovation in dietary assessment. J. Am. Diet. Assoc. 2010, 110, 48–51. [Google Scholar] [CrossRef]
- Vu, T.; Lin, F.; Alshurafa, N.; Xu, W. Wearable Food Intake Monitoring Technologies: A Comprehensive Review. Computers 2017, 6, 4. [Google Scholar] [CrossRef]
- Fontana, J.M.; Higgins, J.A.; Schuckers, S.C.; Bellisle, F.; Pan, Z.; Melanson, E.L.; Neuman, M.R.; Sazonov, E. Energy intake estimation from counts of chews and swallows. Appetite 2015, 85, 14–21. [Google Scholar] [CrossRef]
- Bi, Y.; Lv, M.; Song, C.; Xu, W.; Guan, N.; Yi, W. Autodietary: A wearable acoustic sensor system for food intake recognition in daily life. IEEE Sens. J. 2016, 16, 806–816. [Google Scholar] [CrossRef]
- Kalantarian, H.; Alshurafa, N.; Le, T.; Sarrafzadeh, M. Monitoring eating habits using a piezoelectric sensor-based necklace. Comput. Biol. Med. 2015, 58, 46–55. [Google Scholar] [CrossRef]
- Jia, W.; Chen, H.-C.; Yue, Y.; Li, Z.; Fernstrom, J.; Bai, Y.; Li, C.; Sun, M. Accuracy of food portion size estimation from digital pictures acquired by a chest-worn camera. Public Health Nutr. 2014, 17, 1671–1681. [Google Scholar] [CrossRef]
- Martin, C.K.; Nicklas, T.; Gunturk, B.; Correa, J.B.; Allen, H.R.; Champagne, C. Measuring food intake with digital photography. J. Hum. Nutr. Diet. 2014, 27, 72–81. [Google Scholar] [CrossRef] [PubMed]
- Martin, C.K.; Newton, R.L.; Anton, S.D.; Allen, H.R.; Alfonso, A.; Han, H.; Stewart, T.; Sothern, M.; Williamson, D.A. Measurement of children’s food intake with digital photography and the effects of second servings upon food intake. Eat. Behav. 2007, 8, 148–156. [Google Scholar] [CrossRef]
- Martin, C.K.; Han, H.; Coulon, S.M.; Allen, H.R.; Champagne, C.M.; Anton, S.D. A novel method to remotely measure food intake of free-living people in real-time: The remote food photography method (rfpm). Br. J. Nutr. 2009, 101, 446–456. [Google Scholar] [CrossRef] [PubMed]
- Martin, C.K.; Correa, J.B.; Han, H.; Allen, H.R.; Rood, J.C.; Champagne, C.M.; Gunturk, B.K.; Bray, G.A. Validity of the Remote Food Photography Method (RFPM) for Estimating Energy and Nutrient Intake in Near Real-Time. Obesity 2012, 20, 891–899. [Google Scholar] [CrossRef] [Green Version]
- Pettitt, C.; Liu, J.; Kwasnicki, R.M.; Yang, G.-Z.; Preston, T.; Frost, G. A pilot study to determine whether using a lightweight, wearable micro-camera improves dietary assessment accuracy and offers information on macronutrients and eating rate. Br. J. Nutr. 2016, 115, 160–167. [Google Scholar] [CrossRef]
- Bonilla, C.; Brauer, P.; Royall, D.; Keller, H.; Hanning, R.M.; DiCenso, A. Use of electronic dietary assessment tools in primary care: An interdisciplinary perspective. BMC Med. Inform. Decis. Mak. 2015, 15, 14. [Google Scholar] [CrossRef] [PubMed]
- Desendorf, J.; Bassett, D.R.; Raynor, H.A.; Coe, D.P. Validity of the Bite Counter device in a controlled laboratory setting. Eat. Behav. 2014, 15, 502–504. [Google Scholar] [CrossRef] [PubMed]
- Faul, F.; Erdfelder, E.; Buchner, A.; Lang, A.-G. Statistical power analyses using G* Power 3.1: Tests for correlation and regression analyses. Behav. Res. Methods 2009, 41, 1149–1160. [Google Scholar] [CrossRef] [PubMed]
- Salley, J. Accuracy of a Bite-Count Based Calorie Estimate Compared to Human Estimates with and without Calorie Information Available. Master’s Thesis, Clemson University, Clemson, SC, USA, 2013. [Google Scholar]
- Scisco, J.L.; Muth, E.R.; Hoover, A.W. Examining the Utility of a Bite-Count–Based Measure of Eating Activity in Free-Living Human Beings. J. Acad. Nutr. Diet. 2014, 114, 464–469. [Google Scholar] [CrossRef]
- Salley, J.N.; Hoover, A.W.; Wilson, M.L.; Muth, E.R. Comparison between human and bite-based methods of estimating caloric intake. J. Acad. Nutr. Diet. 2016, 116, 1568–1577. [Google Scholar] [CrossRef] [PubMed]
- Bland, J.M.; Altman, D. Statistical methods for assessing agreement between two methods of clinical measurement. Lancet 1986, 327, 307–310. [Google Scholar] [CrossRef]
- R Core Team. R: A Language and Environment for Statistical Computing; R Foundation for Statistical Computing: Vienna, Austria, 2017. [Google Scholar]
- Dong, Y.; Hoover, A.; Scisco, J.; Muth, E. A new method for measuring meal intake in humans via automated wrist motion tracking. Appl. Psychophysiol. Biofeedback 2012, 37, 205–215. [Google Scholar] [CrossRef]
- Pérez-Escamilla, R.; Obbagy, J.E.; Altman, J.M.; Essery, E.V.; McGrane, M.M.; Wong, Y.P.; Spahn, J.M.; Williams, C.L. Dietary energy density and body weight in adults and children: A systematic review. J. Acad. Nutr. Diet. 2012, 112, 671–684. [Google Scholar] [CrossRef]
- Stelmach-Mardas, M.; Rodacki, T.; Dobrowolska-Iwanek, J.; Brzozowska, A.; Walkowiak, J.; Wojtanowska-Krosniak, A.; Zagrodzki, P.; Bechthold, A.; Mardas, M.; Boeing, H. Link between food energy density and body weight changes in obese adults. Nutrients 2016, 8, 229. [Google Scholar] [CrossRef] [PubMed]
- Turner-McGrievy, G.M.; Boutté, A.; Crimarco, A.; Wilcox, S.; Hutto, B.E.; Hoover, A.; Muth, E.R. Byte by bite: Use of a mobile Bite Counter and weekly behavioral challenges to promote weight loss. Smart Health 2017, 3, 20–26. [Google Scholar] [CrossRef] [PubMed]
- Turner-McGrievy, G.M.; Wilcox, S.; Boutté, A.; Hutto, B.E.; Singletary, C.; Muth, E.R.; Hoover, A.W. The Dietary Intervention to Enhance Tracking with Mobile Devices (DIET Mobile) Study: A 6-Month Randomized Weight Loss Trial. Obesity 2017, 25, 1336–1342. [Google Scholar] [CrossRef] [Green Version]
- Fuscà, E.; Bolzon, A.; Buratin, A.; Ruffolo, M.; Berchialla, P.; Gregori, D.; Perissinotto, E.; Baldi, I. NOTION Group. Measuring Caloric Intake at the Population Level (NOTION): Protocol for an Experimental Study. JMIR Res. Protoc. 2019, 8, e12116. [Google Scholar]


| Energy | Protein | Carbs | Fat | Saturated Fat | Sodium | Sugar | Dietary Fiber | |
|---|---|---|---|---|---|---|---|---|
| CHICKEN McNUGGETS® (6 pieces) | 268 | 17 | 18 | 14 | 1.7 | 1.2 | 0.4 | 1.5 |
| CRISPY McBACON® | 492 | 27 | 32 | 28 | 11 | 1.7 | 6.3 | 1.8 |
| McCHICKEN® | 428 | 21 | 46 | 17 | 2.3 | 1.9 | 6.5 | 2.8 |
| McWRAP® (grilled chicken) | 440 | 36 | 37 | 16 | 5.5 | 2.7 | 8.1 | 2.1 |
| CHICKEN COUNTRY | 479 | 35 | 46 | 17 | 3.5 | 2.7 | 5.3 | 2.2 |
| HAMBURGER | 254 | 13 | 30 | 8.8 | 3.5 | 1.3 | 6.6 | 2 |
| 1955® | 625 | 35 | 49 | 31 | 11 | 2.3 | 13 | 4 |
| CHICKENBURGER | 344 | 12 | 37 | 16 | 2.9 | 1.5 | 4.4 | 2.5 |
| McVEGGIE® | 467 | 11 | 65 | 18 | 2.8 | 3.1 | 11 | 5.3 |
| QUARTER POUNDER® DELUXE | 533 | 30 | 35 | 30 | 12 | 1.9 | 8.4 | 2.7 |
| CHICKEN WINGS | 227 | 22 | 3.6 | 14 | 3.3 | 2.5 | 1.1 | 0 |
| FRENCH FRIES (Regular) | 239 | 2.7 | 29 | 12 | 1.1 | 0.55 | 0.3 | 2.9 |
| FRENCH FRIES (Medium) | 341 | 3.98 | 42 | 17 | 1.5 | 0.79 | 0.5 | 4.2 |
| VERTIGO FRENCH FRIES (Medium) | 330 | 3.8 | 41 | 16 | 1.7 | 1.9 | 0.7 | 6.1 |
| SALAD | 118 | 9.2 | 4 | 6.7 | 4.3 | 0.49 | 2.9 | 2.4 |
| GREEK SALAD | 210 | 11 | 6 | 15 | 8 | 2.2 | 4 | 4 |
| APPLE SLICES | 41 | 0.2 | 8.7 | 0.2 | 0 | 0 | 6.6 | 2.1 |
| ID | Food Item 1 | Food Item 2 | Food Item 3 | Energy (Kcal) | Protein (g) | Carbs (g) | Fat (g) | Saturated Fat (g) | Sodium (g) | Sugar (g) | Dietary Fiber (g) |
|---|---|---|---|---|---|---|---|---|---|---|---|
| 1 | CHICKEN McNUGGETS® | FRENCH FRIES (Medium) | 609 | 20.98 | 60 | 31 | 3.2 | 1.99 | 0.9 | 5.7 | |
| 2 | CRISPY McBACON® | FRENCH FRIES (Medium) | 833 | 30.98 | 74 | 45 | 12.5 | 2.49 | 6.8 | 6 | |
| 3 | McCHICKEN® | FRENCH FRIES (Medium) | 769 | 24.98 | 88 | 34 | 3.8 | 2.69 | 7 | 7 | |
| 4 | McWRAP® (grilled chicken) | SALAD | 558 | 45.2 | 41 | 22.7 | 9.8 | 3.19 | 11 | 4.5 | |
| 5 | CHICKEN COUNTRY | FRENCH FRIES (Medium) | 820 | 38.98 | 88 | 34 | 5 | 3.49 | 5.8 | 6.4 | |
| 6 | HAMBURGER | CHICKENBURGER | FRENCH FRIES (Regular) | 837 | 27.7 | 96 | 36.8 | 7.5 | 3.35 | 11.3 | 7.4 |
| 7 | CHICKEN COUNTRY | FRENCH FRIES (Medium) | 820 | 38.98 | 88 | 34 | 5 | 3.49 | 5.8 | 6.4 | |
| 8 | 1955® | VERTIGO FRENCH FRIES (Medium) | 955 | 38.8 | 90 | 47 | 12.7 | 4.2 | 13.7 | 10.4 | |
| 9 | McCHICKEN® | FRENCH FRIES (Medium) | 769 | 24.98 | 88 | 34 | 3.8 | 2.69 | 7 | 7 | |
| 10 | 1955® | VERTIGO FRENCH FRIES (Medium) | 955 | 38.8 | 90 | 47 | 12.7 | 4.2 | 13.7 | 10.4 | |
| 11 | 1955® | VERTIGO FRENCH FRIES (Medium) | 955 | 38.8 | 90 | 47 | 12.7 | 4.2 | 13.7 | 10.4 | |
| 12 | MENU HAPPY MEAL®: HAMBURGER + FRENCH FRIES (Regular) + APPLE SLICES | 534 | 15.9 | 67.7 | 21 | 4.6 | 1.85 | 13.5 | 7 | ||
| 13 | CHICKEN McNUGGETS® | 268 | 17 | 18 | 14 | 1.7 | 1.2 | 0.4 | 1.5 | ||
| 14 | McCHICKEN® | VERTIGO FRENCH FRIES (Medium) | 758 | 24.8 | 87 | 33 | 4 | 3.8 | 7.2 | 8.9 | |
| 15 | CHICKEN McNUGGETS® | FRENCH FRIES (Medium) | 609 | 20.98 | 60 | 31 | 3.2 | 1.99 | 0.9 | 5.7 | |
| 16 | CHICKEN WINGS | GREEK SALAD | 437 | 33 | 9.6 | 29 | 11.3 | 4.7 | 5.1 | 4 | |
| 17 | McVEGGIE® | SALAD | 585 | 20.2 | 69 | 24.7 | 7.1 | 3.59 | 13.9 | 7.7 | |
| 18 | QUARTER POUNDER® DELUXE | VERTIGO FRENCH FRIES (Medium) | 863 | 33.8 | 76 | 46 | 13.7 | 3.8 | 9.1 | 8.8 | |
| Subject Characteristics | Overall (n = 18) | |
|---|---|---|
| Age (years) | 28.50 [26.00, 29.75] | |
| Gender | Female | 61.1 (11) |
| Male | 38.9 (7) | |
| BMI | 21.72 [19.31, 24.83] | |
| Waist | 74.50 [68.75, 84.50] | |
| Hip | 95.00 [93.00, 95.75] | |
| WHR | 0.80 [0.74, 0.90] | |
| Real caloric intake (Kcal) | 769.00 [591.00, 836.00] | |
| Protein content (g) | 29.34 [21.93, 38.80] | |
| Carbohydrate content (g) | 81.50 [61.92, 88.00] | |
| Fat content (g) | 34.00 [29.50, 42.95] | |
| Saturated fat content (g) | 6.05 [3.85, 12.20] | |
| Sodium content (g) | 3.42 [2.54, 3.80] | |
| Sugars content (g) | 7.10 [5.80, 12.95] | |
| Dietary fiber content (g) | 7.00 [5.78, 8.53] | |
| Number of bites | 36.50 [34.00, 45.25] |
| Nutritional Value | 0–20 Percentile | 20–40 Percentile | 40–60 Percentile | 60–80 Percentile | 80–100 Percentile | p-Value |
|---|---|---|---|---|---|---|
| Salley (2013) | [−198.2, 80.48] | [80.48, 174.74] | [174.74, 289.95] | [289.95, 383.95] | [383.95, 484.47] | |
| Protein content (g) | 26.60 [19.40, 36.05] | 20.98 [18.44, 29.98] | 29.39 [23.98, 35.09] | 24.98 [24.89, 31.89] | 34.89 [30.16, 38.80] | 0.84 |
| Carbohydrate content (g) | 29.50 [15.90, 48.00] | 67.70 [63.85, 77.85] | 82.00 [72.00, 88.00] | 88.00 [87.50, 89.00] | 90.00 [86.00, 91.50] | 0.03 |
| Fat content (g) | 23.70 [20.52, 25.77] | 31.00 [26.00, 32.50] | 34.00 [33.25, 37.00] | 34.00 [33.50, 40.50] | 46.00 [42.95, 47.00] | 0.017 |
| Saturated fat content (g) | 8.45 [5.75, 10.18] | 4.60 [3.90, 4.80] | 4.40 [3.65, 7.17] | 4.00 [3.90, 8.35] | 12.60 [11.25, 12.70] | 0.314 |
| Sodium content (g) | 3.39 [2.69, 3.87] | 1.99 [1.92, 2.74] | 3.09 [2.52, 3.57] | 3.80 [3.25, 4.00] | 3.78 [3.14, 4.20] | 0.521 |
| Sugar content (g) | 8.05 [3.92, 11.72] | 5.80 [3.35, 9.65] | 6.40 [4.57, 7.53] | 7.20 [7.10, 10.45] | 12.50 [10.18, 13.70] | 0.447 |
| Dietary fiber content (g) | 4.25 [3.38, 5.30] | 6.40 [6.05, 6.70] | 6.70 [6.23, 7.45] | 8.90 [7.95, 9.65] | 8.90 [7.05, 10.40] | 0.106 |
| Scisco (2014) | [−179, 26.6] | [26.6, 167.2] | [167.2, 293.8] | [293.8, 361.2] | [361.2, 448] | |
| Protein content (g) | 26.60 [19.40, 34.49] | 20.98 [18.44, 33.09] | 29.39 [23.98, 35.09] | 38.80 [31.80, 38.80] | 29.34 [27.02, 32.94] | 0.905 |
| Carbohydrate content (g) | 43.50 [15.90, 73.75] | 60.00 [50.50, 63.85] | 82.00 [72.00, 88.00] | 90.00 [88.50, 90.00] | 89.00 [84.50, 91.50] | 0.052 |
| Fat content (g) | 26.85 [22.02, 30.25] | 22.70 [21.85, 26.85] | 34.00 [33.25, 37.00] | 47.00 [40.00, 47.00] | 40.90 [36.10, 45.50] | 0.027 |
| Saturated fat content (g) | 6.05 [4.17, 8.15] | 4.60 [3.90, 7.20] | 4.40 [3.65, 7.17] | 12.70 [8.35, 12.70] | 10.00 [6.58, 12.55] | 0.63 |
| Sodium content (g) | 3.54 [2.92, 3.87] | 1.99 [1.92, 2.59] | 3.09 [2.52, 3.57] | 4.20 [4.00, 4.20] | 3.02 [2.64, 3.56] | 0.176 |
| Sugar content (g) | 5.45 [3.92, 7.82] | 11.00 [5.95, 12.25] | 6.40 [4.57, 7.53] | 13.70 [10.45, 13.70] | 9.15 [6.95, 11.90] | 0.368 |
| Dietary fiber content (g) | 5.20 [3.38, 6.73] | 5.70 [5.10, 6.35] | 6.70 [6.23, 7.45] | 10.40 [9.65, 10.40] | 7.20 [6.75, 8.15] | 0.068 |
| Salley (2016) | [−458.67, −224.52] | [−224.52, −40.98] | [−40.98, 103.72] | [103.72, 203.73] | [203.73, 318.56] | |
| Protein content (g) | 26.60 [19.40, 34.49] | 20.98 [20.98, 33.09] | 29.39 [22.71, 35.09] | 38.80 [31.80, 38.80] | 29.34 [27.02, 32.94] | 0.95 |
| Carbohydrate content (g) | 43.50 [15.90, 73.75] | 60.00 [50.50, 60.00] | 82.00 [73.92, 88.00] | 90.00 [88.50, 90.00] | 89.00 [84.50, 91.50] | 0.04 |
| Fat content (g) | 26.85 [22.02, 30.25] | 31.00 [26.85, 31.00] | 34.00 [30.75, 37.00] | 47.00 [40.00, 47.00] | 40.90 [36.10, 45.50] | 0.057 |
| Saturated fat content (g) | 6.05 [4.17, 8.15] | 3.20 [3.20, 6.50] | 4.80 [4.40, 7.17] | 12.70 [8.35, 12.70] | 10.00 [6.58, 12.55] | 0.495 |
| Sodium content (g) | 3.54 [2.92, 3.87] | 1.99 [1.99, 2.59] | 3.09 [2.48, 3.57] | 4.20 [4.00, 4.20] | 3.02 [2.64, 3.56] | 0.203 |
| Sugar content (g) | 5.45 [3.92, 7.82] | 0.90 [0.90, 5.95] | 8.05 [6.70, 10.20] | 13.70 [10.45, 13.70] | 9.15 [6.95, 11.90] | 0.299 |
| Dietary fiber content (g) | 5.20 [3.38, 6.73] | 5.70 [5.10, 5.70] | 7.00 [6.85, 7.45] | 10.40 [9.65, 10.40] | 7.20 [6.75, 8.15] | 0.032 |
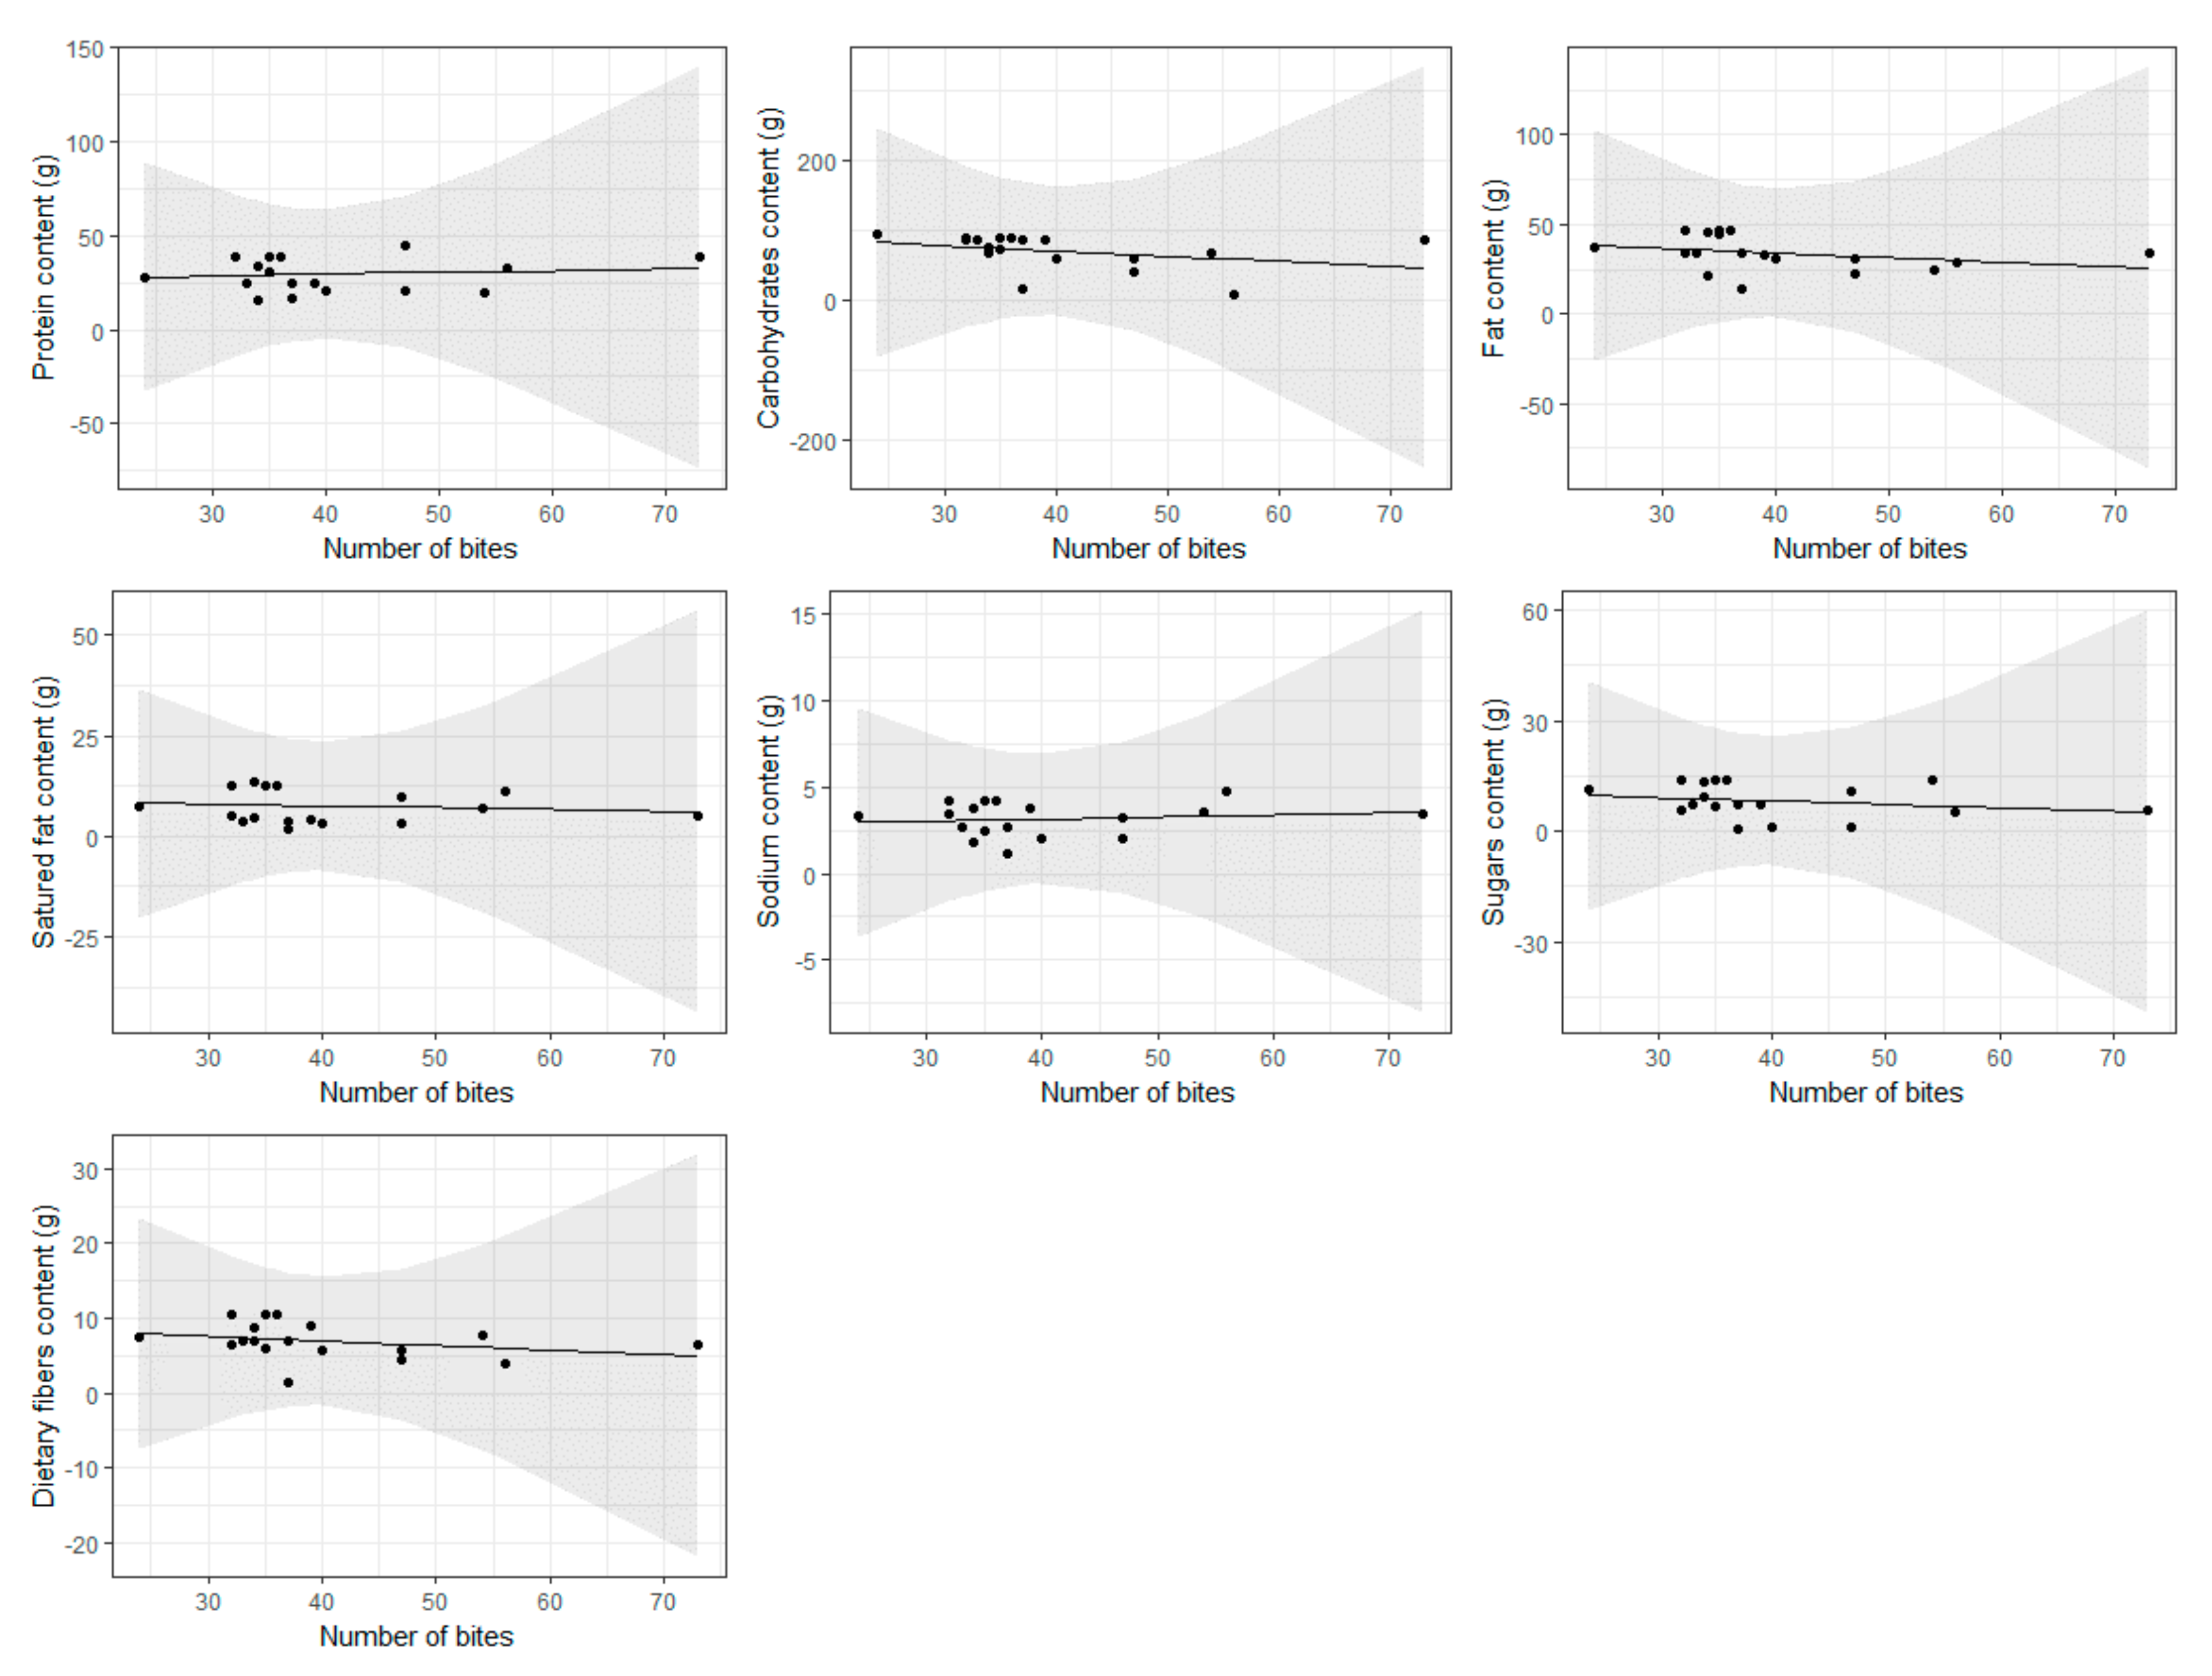
| Nutritional Value | Increase in (g) for One More Bite | p-Value |
|---|---|---|
| Protein content (g) | 0.0981 (−0.312, 0.508) | 0.619 |
| Carbohydrate content | −0.74 (−1.84, 0.364) | 0.175 |
| Fat content (g) | −0.253 (−0.683, 0.177) | 0.23 |
| Saturated fat content (g) | −0.0433 (−0.235, 0.148) | 0.639 |
| Sodium content (g) | 0.0124 (−0.0322, 0.0569) | 0.565 |
| Sugar content (g) | −0.0889 (−0.298, 0.12) | 0.381 |
| Dietary fiber content (g) | −0.0606 (−0.164, 0.0427) | 0.231 |
© 2019 by the authors. Licensee MDPI, Basel, Switzerland. This article is an open access article distributed under the terms and conditions of the Creative Commons Attribution (CC BY) license (http://creativecommons.org/licenses/by/4.0/).
Share and Cite
Lorenzoni, G.; Bottigliengo, D.; Azzolina, D.; Gregori, D. Food Composition Impacts the Accuracy of Wearable Devices When Estimating Energy Intake from Energy-Dense Food. Nutrients 2019, 11, 1170. https://0-doi-org.brum.beds.ac.uk/10.3390/nu11051170
Lorenzoni G, Bottigliengo D, Azzolina D, Gregori D. Food Composition Impacts the Accuracy of Wearable Devices When Estimating Energy Intake from Energy-Dense Food. Nutrients. 2019; 11(5):1170. https://0-doi-org.brum.beds.ac.uk/10.3390/nu11051170
Chicago/Turabian StyleLorenzoni, Giulia, Daniele Bottigliengo, Danila Azzolina, and Dario Gregori. 2019. "Food Composition Impacts the Accuracy of Wearable Devices When Estimating Energy Intake from Energy-Dense Food" Nutrients 11, no. 5: 1170. https://0-doi-org.brum.beds.ac.uk/10.3390/nu11051170