Dietary Inflammatory Index and Risk of Breast Cancer Based on Hormone Receptor Status: A Case-Control Study in Korea


Abstract
:1. Introduction
2. Materials and Methods
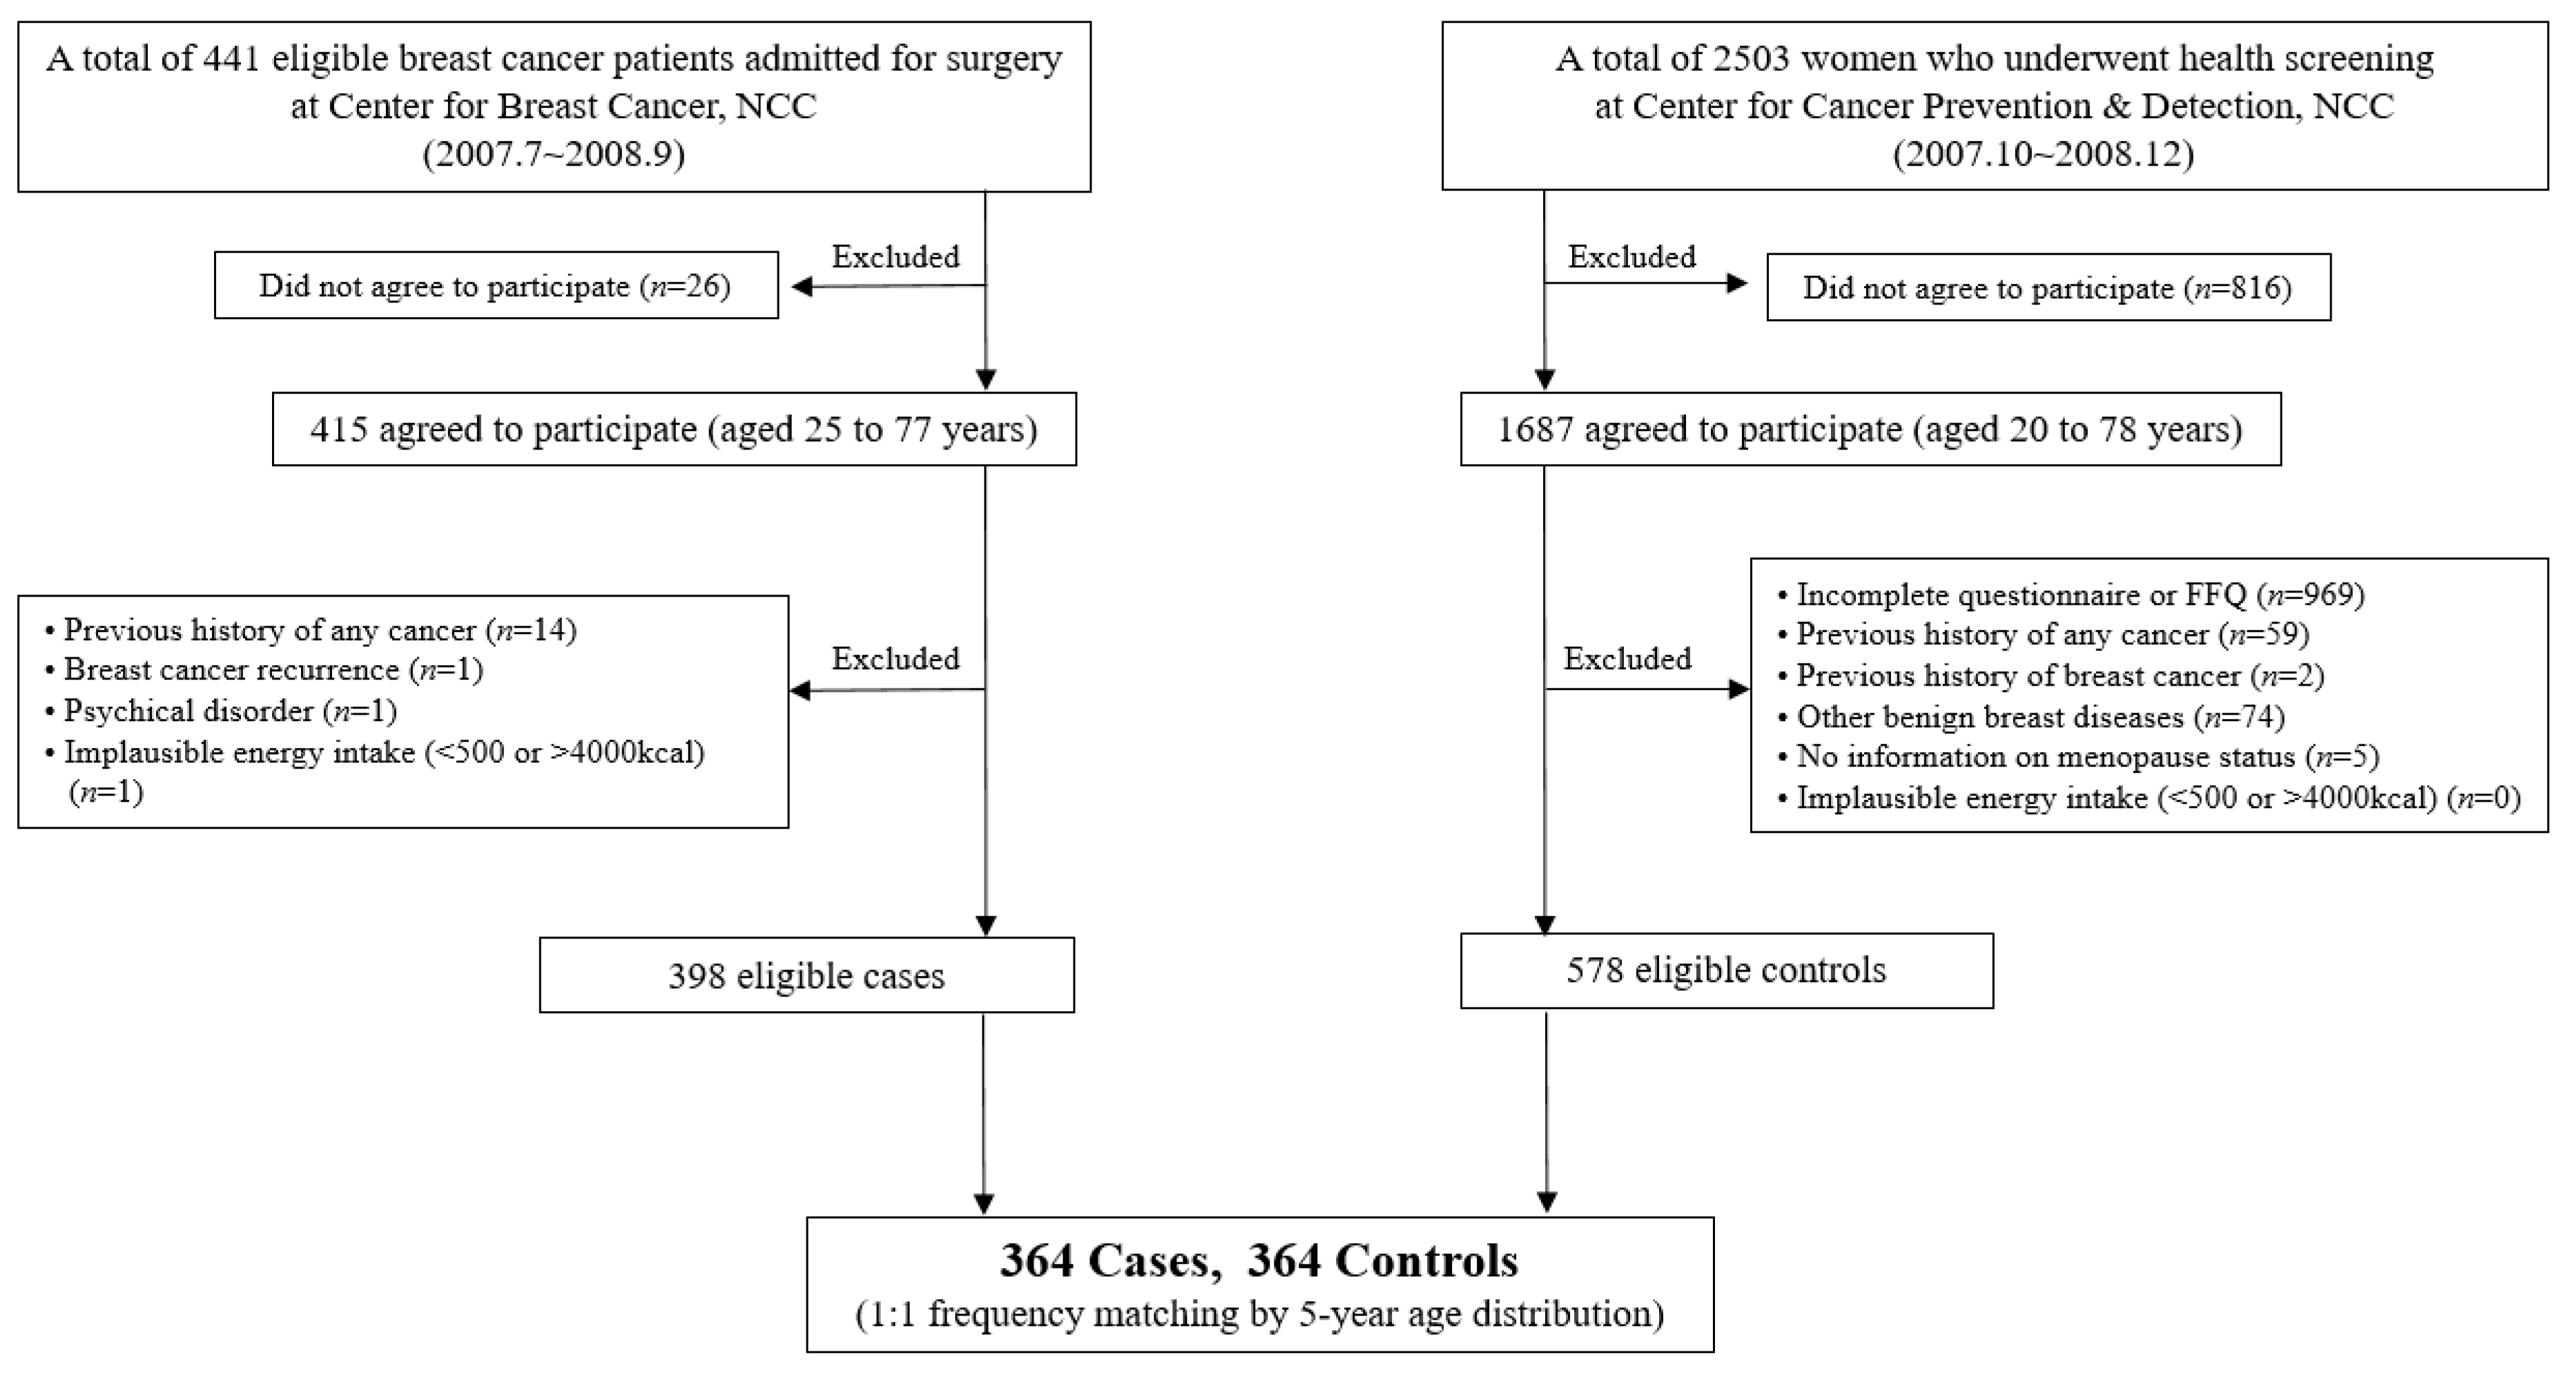
2.1. Data Source and Study Population
2.2. Dietary Assessment and Calculation of the DII
2.3. Other Measurements
2.4. Statistical Analysis
3. Results
3.1. General Characteristics of the Study Population
3.2. Food and Nutrient Intake as Components of the DII of the Participants
3.3. Association Between the DII Score and the Risk of Breast Cancer
3.4. Association Between the DII Score and the Risk of Breast Cancer According to Hormone Receptor Status
4. Discussion
5. Conclusions
Author Contributions
Funding
Conflicts of Interest
References
- Ferlay, J.; Colombet, M.; Soerjomataram, I.; Mathers, C.; Parkin, D.M.; Piñeros, M.; Znaor, A.; Bray, F. Estimating the global cancer incidence and mortality in 2018: GLOBOCAN sources and methods. Int. J. Cancer 2019, 144, 1941–1953. [Google Scholar] [CrossRef] [PubMed]
- Jemal, A.; Bray, F.; Center, M.M.; Ferlay, J.; Ward, E.; Forman, D. Global cancer statistics. CA Cancer J. Clin. 2011, 61, 69–90. [Google Scholar] [CrossRef] [Green Version]
- Jung, K.W.; Won, Y.J.; Kong, H.J.; Lee, E.S. Prediction of cancer incidence and mortality in Korea, 2019. Cancer Res. Treat. 2019, 51, 431–437. [Google Scholar] [CrossRef]
- Sommer, S.; Fuqua, S.A. Estrogen receptor and breast cancer. Semin. Cancer Biol. 2001, 11, 339–352. [Google Scholar] [CrossRef]
- Daniel, A.R.; Qiu, M.; Faivre, E.J.; Ostrander, J.H.; Skildum, A.; Lange, C.A. Linkage of progestin and epidermal growth factor signaling: phosphorylation of progesterone receptors mediates transcriptional hypersensitivity and increased ligand-independent breast cancer cell growth. Steroids 2007, 72, 188–201. [Google Scholar] [CrossRef] [PubMed]
- Althuis, M.D.; Fergenbaum, J.H.; Garcia-Closas, M.; Brinton, L.A.; Madigan, M.P.; Sherman, M.E. Etiology of hormone receptor-defined breast cancer: a systematic review of the literature. Cancer Epidemiol. Biomark. Prev. 2004, 13, 1558–1568. [Google Scholar]
- Early Breast Cancer Trialists’ Collaborative Group. Tamoxifen for early breast cancer: an overview of the randomised trials. Lancet 1998, 351, 1451–1467. [Google Scholar] [CrossRef]
- Colditz, G.A.; Rosner, B.A.; Chen, W.Y.; Holmes, M.D.; Hankinson, S.E. Risk factors for breast cancer according to estrogen and progesterone receptor status. J. Natl. Cancer Inst. 2004, 96, 218–228. [Google Scholar] [CrossRef] [PubMed]
- Potter, J.D.; Cerhan, J.R.; Sellers, T.A.; McGovern, P.G.; Drinkard, C.; Kushi, L.R.; Folsom, A.R. Progesterone and estrogen receptors and mammary neoplasia in the Iowa Women’s Health Study: How many kinds of breast cancer are there? Cancer Epidemiol. Biomark. Prev. 1995, 4, 319–326. [Google Scholar]
- Olsen, A.; Tjønneland, A.; Thomsen, B.L.; Loft, S.; Stripp, C.; Overvad, K.; Møller, S.; Olsen, J.H. Fruits and vegetables intake differentially affects estrogen receptor negative and positive breast cancer incidence rates. J. Nutr. 2003, 133, 2342–2347. [Google Scholar] [CrossRef] [PubMed]
- Cho, Y.A.; Kim, J.; Park, K.S.; Lim, S.Y.; Shin, A.; Sung, M.K.; Ro, J. Effect of dietary soy intake on breast cancer risk according to menopause and hormone receptor status. Eur. J. Clin. Nutr. 2010, 64, 924–932. [Google Scholar] [CrossRef] [PubMed] [Green Version]
- Coussens, L.M.; Werb, Z. Inflammation and cancer. Nature 2002, 420, 860–867. [Google Scholar] [CrossRef] [PubMed]
- Shacter, E.; Weitzman, S.A. Chronic inflammation and cancer. Oncology (Willston Park) 2002, 16, 217–229. [Google Scholar]
- Benoy, I.H.; Salgado, R.; Van Dam, P.; Geboers, K.; Van Marck, E.; Scharpé, S.; Vermeulen, P.B.; Dirix, L.Y. Increased serum interleukin-8 in patients with early and metastatic breast cancer correlates with early dissemination and survival. Clin. Cancer Res. 2004, 10, 7157–7162. [Google Scholar] [CrossRef] [PubMed]
- Knüpfer, H.; Preiß, R. Significance of interleukin-6 (IL-6) in breast cancer. Breast Cancer Res. Treat. 2007, 102, 129–135. [Google Scholar] [CrossRef]
- Pierce, B.L.; Ballard-Barbash, R.; Bernstein, L.; Baumgartner, R.N.; Neuhouser, M.L.; Wener, M.H.; Baumgartner, K.B.; Gilliland, F.D.; Sorensen, B.E.; McTiernan, A.; et al. Elevated biomarkers of inflammation are associated with reduced survival among breast cancer patients. J. Clin. Oncol. 2009, 27, 3437–3444. [Google Scholar] [CrossRef] [PubMed]
- Galland, L. Diet and inflammation. Nutr. Clin. Pract. 2010, 25, 634–640. [Google Scholar] [CrossRef] [PubMed]
- Giugliano, D.; Ceriello, A.; Esposito, K. The effects of diet on inflammation: emphasis on the metabolic syndrome. J. Am. Coll. Cardiol. 2006, 48, 677–685. [Google Scholar] [CrossRef] [PubMed]
- Esposito, K.; Marfella, R.; Ciotola, M.; Di Palo, C.; Giugliano, F.; Giugliano, G.; D’Armiento, M.; D’Andrea, F.; Giugliano, D. Effect of a Mediterranean-style diet on endothelial dysfunction and markers of vascular inflammation in the metabolic syndrome. A randomized trial. JAMA 2004, 292, 1440–1446. [Google Scholar] [CrossRef] [PubMed]
- Shivappa, N.; Steck, S.E.; Hurley, T.G.; Hussey, J.R.; Hébert, J.R. Designing and developing a literature-derived, population-based dietary inflammatory index. Public Health Nutr. 2014, 17, 1689–1696. [Google Scholar] [CrossRef]
- Shivappa, N.; Steck, S.E.; Hurley, T.G.; Hussey, J.R.; Ma, Y.; Ockene, I.S.; Tabung, F.; Hébert, J.R. A population-based dietary inflammatory index predicts levels of C-reactive protein in the Seasonal Variation of Blood Cholesterol Study (SEASONS). Public Health Nutr. 2014, 17, 1825–1833. [Google Scholar] [CrossRef] [PubMed]
- Wirth, M.D.; Burch, J.; Shivappa, N.; Violanti, J.M.; Burchfiel, C.M.; Fekedulegn, D.; Andrew, M.E.; Hartley, T.A.; Miller, D.B.; Mnatsakanova, A.; et al. Association of a dietary inflammatory index with inflammatory indices and the metabolic syndrome among police officers. J. Occup. Environ. Med. 2014, 56, 986–989. [Google Scholar] [CrossRef]
- Tabung, F.K.; Smith-Warner, S.A.; Chavarro, J.E.; Fung, T.T.; Hu, F.B.; Willett, W.C.; Giovannucci, E.L. An empirical dietary inflammatory pattern score enhances prediction of circulating inflammatory biomarkers in adults. J. Nutr. 2017, 147, 1567–1577. [Google Scholar] [CrossRef]
- Huang, W.Q.; Mo, X.F.; Ye, Y.B.; Shivappa, N.; Lin, F.Y.; Huang, J.; Hébert, J.R.; Yan, B.; Zhang, C.X. A higher dietary inflammatory index score is associated with a higher risk of breast cancer among Chinese women: A case–control study. Br. J. Nutr. 2017, 117, 1358–1367. [Google Scholar] [CrossRef] [PubMed]
- Shivappa, N.; Hébert, J.R.; Rosato, V.; Montella, M.; Serraino, D.; La Vecchia, C. Association between the dietary inflammatory index and breast cancer in a large Italian case–control study. Mol. Nutr. Food Res. 2017, 61, 1600500. [Google Scholar] [CrossRef] [PubMed]
- Shivappa, N.; Blair, C.K.; Prizment, A.E.; Jacobs, D.R.; Hébert, J.R. Prospective study of the dietary inflammatory index and risk of breast cancer in postmenopausal women. Mol. Nutr. Food Res. 2017, 61, 1600592. [Google Scholar] [CrossRef] [PubMed]
- Tabung, F.K.; Steck, S.E.; Liese, A.D.; Zhang, J.; Ma, Y.; Caan, B.; Chlebowski, R.T.; Freudenheim, J.L.; Hou, L.; Mossavar-Rahmani, Y.; et al. Association between dietary inflammatory potential and breast cancer incidence and death: results from the Women’s Health Initiative. Br. J. Cancer 2016, 114, 1277–1285. [Google Scholar] [CrossRef] [PubMed]
- Ahn, Y.; Kwon, E.; Shim, J.E.; Park, M.K.; Joo, Y.; Kimm, K.; Park, C.; Kim, D.H. Validation and reproducibility of food frequency questionnaire for Korean genome epidemiologic study. Eur. J. Clin. Nutr. 2007, 61, 1435–1441. [Google Scholar] [CrossRef]
- Cavicchia, P.P.; Steck, S.E.; Hurley, T.G.; Hussey, J.R.; Ma, Y.; Ockene, I.S.; Hébert, J.R. A new dietary inflammatory index predicts interval changes in serum high-sensitivity C-reactive protein. J. Nutr. 2009, 139, 2365–2372. [Google Scholar] [CrossRef] [PubMed]
- Willett, W.C.; Howe, G.R.; Kushi, L.H. Adjustment for total energy intake in epidemiologic studies. Am. J. Clin. Nutr. 1997, 65, 1220S–1228S. [Google Scholar] [CrossRef] [PubMed]
- Harmon, B.E.; Wirth, M.D.; Boushey, C.J.; Wilkens, L.R.; Draluck, E.; Shivappa, N.; Steck, S.E.; Hofseth, L.A.; Haiman, C.A.; Le Marchand, L.; et al. The dietary inflammatory index is associated with colorectal cancer risk in the Multiethnic Cohort. J. Nutr. 2017, 147, 430–438. [Google Scholar] [CrossRef] [PubMed]
- Vázquez-Salas, R.A.; Shivappa, N.; Galván-Portillo, M.; López-Carrillo, L.; Hébert, J.R.; Torres-Sánchez, L. Dietary inflammatory index and prostate cancer risk in a case–control study in Mexico. Br. J. Nutr. 2016, 116, 1945–1953. [Google Scholar] [CrossRef] [PubMed]
- Shivappa, N.; Wirth, M.D.; Murphy, E.A.; Hurley, T.G.; Hébert, J.R. Association between the Dietary Inflammatory Index (DII) and urinary enterolignans and C-reactive protein from the National Health and Nutrition Examination Survey-2003–2008. Eur. J. Nutr. 2019, 58, 797–805. [Google Scholar] [CrossRef] [PubMed]
- Kim, J. Cancer screenee cohort study of the National Cancer Center in South Korea. Epidemiol. Health 2014, 36, e2014013. [Google Scholar] [CrossRef] [PubMed]
- Nam, B.-H.; Kim, S.Y.; Han, H.-S.; Kwon, Y.; Lee, K.S.; Kim, T.H.; Ro, J. Breast cancer subtypes and survival in patients with brain metastases. Breast Cancer Res. 2008, 10, R20. [Google Scholar] [CrossRef]
- Grivennikov, S.I.; Greten, F.R.; Karin, M. Immunity, inflammation, and cancer. Cell 2010, 140, 883–899. [Google Scholar] [CrossRef]
- Kawanishi, S.; Hiraku, Y.; Pinlaor, S.; Ma, N. Oxidative and nitrative DNA damage in animals and patients with inflammatory diseases in relation to inflammation-related carcinogenesis. Biol. Chem. 2006, 387, 365–372. [Google Scholar] [CrossRef] [PubMed]
- Willett, W.C. Diet and cancer. Oncologist 2000, 5, 393–404. [Google Scholar] [CrossRef]
- Shin, A.; Kim, J.; Lim, S.Y.; Kim, G.; Sung, M.K.; Lee, E.S.; Ro, J. Dietary mushroom intake and the risk of breast cancer based on hormone receptor status. Nutr. Cancer 2010, 62, 476–483. [Google Scholar] [CrossRef]
- Cho, Y.A.; Kim, J.; Shin, A.; Park, K.S.; Ro, J. Dietary patterns and breast cancer risk in Korean women. Nutr. Cancer 2010, 62, 1161–1169. [Google Scholar] [CrossRef] [PubMed]
- Vahid, F.; Shivappa, N.; Hatami, M.; Sadeghi, M.; Ameri, F.; Jamshidi Naeini, Y.; Hebert, J.R.; Davoodi, S.H. Association between dietary inflammatory index (DII) and risk of breast cancer: a case-control study. Asian Pac. J. Cancer Prev. 2018, 19, 1215–1221. [Google Scholar]
- Ge, I.; Rudolph, A.; Shivappa, N.; Flesch-Janys, D.; Hebert, J.R.; Chang-Claude, J. Dietary inflammation potential and postmenopausal breast cancer risk in a German case-control study. Breast 2015, 24, 491–496. [Google Scholar] [CrossRef] [PubMed]
- Gardeazabal, I.; Ruiz-Canela, M.; Sánchez-Bayona, R.; Romanos-Nanclares, A.; Aramendía-Beitia, J.M.; Shivappa, N.; Hébert, J.R.; Martínez-González, M.A.; Toledo, E. Dietary inflammatory index and incidence of breast cancer in the SUN Project. Clin. Nutr. 2018, in press. [Google Scholar] [CrossRef] [PubMed]
- Esmaillzadeh, A.; Kimiagar, M.; Mehrabi, Y.; Azadbakht, L.; Hu, F.B.; Willett, W.C. Fruit and vegetable intakes, C-reactive protein, and the metabolic syndrome. Am. J. Clin. Nutr. 2006, 84, 1489–1497. [Google Scholar] [CrossRef] [PubMed]
- Kitabchi, A.E.; McDaniel, K.A.; Wan, J.Y.; Tylavsky, F.A.; Jacovino, C.A.; Sands, C.W.; Nyenwe, E.A.; Stentz, F.B. Effects of high-protein versus high-carbohydrate diets on markers of β-cell function, oxidative stress, lipid peroxidation, proinflammatory cytokines, and adipokines in obese, premenopausal women without diabetes: a randomized controlled trial. Diabetes Care 2013, 36, 1919–1925. [Google Scholar] [CrossRef]
- Ma, Y.; Griffith, J.A.; Chasan-Taber, L.; Olendzki, B.C.; Jackson, E.; Stanek, E.J., III; Li, W.; Pagoto, S.L.; Hafner, A.R.; Ockene, I.S. Association between dietary fiber and serum C-reactive protein. Am. J. Clin. Nutr. 2006, 83, 760–766. [Google Scholar] [CrossRef]
- Davis, C.D.; Ross, S. Diet and cancer prevention. In Lifestyle Medicine, 3rd ed.; Rippe, J.M., Ed.; CRC Press Taylor & Francis Group: New York, NY, USA, 2019; pp. 409–415. [Google Scholar]
- Gregersen, S.; Samocha-Bonet, D.; Heilbronn, L.K.; Campbell, L.V. Inflammatory and oxidative stress responses to high-carbohydrate and high-fat meals in healthy humans. J. Nutr. Metab. 2012, 2012, 238056. [Google Scholar] [CrossRef]
- Yeon, J.Y.; Suh, Y.J.; Kim, S.W.; Baik, H.W.; Sung, C.J.; Kim, H.S.; Sung, M.K. Evaluation of dietary factors in relation to the biomarkers of oxidative stress and inflammation in breast cancer risk. Nutrition 2011, 27, 912–918. [Google Scholar] [CrossRef]
- Michels, K.B.; Holmberg, L.; Bergkvist, L.; Ljung, H.; Bruce, Å.; Wolk, A. Dietary antioxidant vitamins, retinol, and breast cancer incidence in a cohort of Swedish women. Int. J. Cancer 2001, 91, 563–567. [Google Scholar] [CrossRef]
- Akl, M.R.; Ayoub, N.M.; Mohyeldin, M.M.; Busnena, B.A.; Foudah, A.I.; Liu, Y.Y.; Sayed, K.A.E. Olive phenolics as c-Met Inhibitors: (-)-Oleocanthal attenuates cell proliferation, invasiveness, and tumor growth in breast cancer models. PLoS ONE 2014, 9, e97622. [Google Scholar] [CrossRef]
- Nemec, M.J.; Kim, H.; Marciante, A.B.; Barnes, R.C.; Hendrick, E.D.; Bisson, W.H.; Talcott, S.T.; Mertens-Talcott, S.U. Polyphenolics from mango (Mangifera indica L.) suppress breast cancer ductal carcinoma in situ proliferation through activation of AMPK pathway and suppression of mTOR in athymic nude mice. J. Nutr. Biochem. 2017, 41, 12–19. [Google Scholar] [CrossRef] [PubMed]
- Carruba, G.; Granata, O.M.; Pala, V.; Campisi, I.; Agostara, B.; Cusimano, R.; Ravazzolo, B.; Traina, A. A traditional Mediterranean diet decreases endogenous estrogens in healthy postmenopausal women. Nutr. Cancer 2006, 56, 253–259. [Google Scholar] [CrossRef]
- Yu, M.; Zhou, X.; Niu, L.; Lin, G.; Huang, J.; Zhou, W.; Gan, H.; Wang, J.; Jiang, X.; Yin, B.; et al. Targeting transmembrane TNF-α suppresses breast cancer growth. Cancer Res. 2013, 73, 4061–4074. [Google Scholar] [CrossRef] [PubMed]
- Ma, Y.; Ren, Y.; Dai, Z.J.; Wu, C.J.; Ji, Y.H.; Xu, J. IL-6, IL-8 and TNF-α levels correlate with disease stage in breast cancer patients. Adv. Clin. Exp. Med. 2017, 26, 421–426. [Google Scholar] [CrossRef]
- Shivappa, N.; Hébert, J.R.; Rietzschel, E.R.; De Buyzere, M.L.; Langlois, M.; Debruyne, E.; Marcos, A.; Huybrechts, I. Associations between dietary inflammatory index and inflammatory markers in the Asklepios Study. Br. J. Nutr. 2015, 113, 665–671. [Google Scholar] [CrossRef] [Green Version]
- Shin, D.; Lee, K.W.; Brann, L.; Shivappa, N.; Hébert, J.R. Dietary inflammatory index is positively associated with serum high-sensitivity C-reactive protein in a Korean adult population. Nutrition 2019, 63, 155–161. [Google Scholar] [CrossRef] [PubMed]
- Na, W.; Kim, M.; Sohn, C. Dietary inflammatory index and its relationship with high-sensitivity C-reactive protein in Korean: data from the Health Examinee cohort. J. Clin. Biochem. Nutr. 2018, 62, 83–88. [Google Scholar] [CrossRef]
- Collaborative Group on Hormonal Factors in Breast Cancer. Menarche, menopause, and breast cancer risk: individual participant meta-analysis, including 118 964 women with breast cancer from 117 epidemiological studies. Lancet Oncol. 2012, 13, 1141–1151. [Google Scholar] [CrossRef]
- Folsom, A.R.; Kaye, S.A.; Prineas, R.J.; Potter, J.D.; Gapstur, S.M.; Wallace, R.B. Increased incidence of carcinoma of the breast associated with abdominal adiposity in postmenopausal women. Am. J. Epidemiol. 1990, 131, 794–803. [Google Scholar] [CrossRef]
- Endogenous Hormones Breast Cancer Collaborative Group. Body mass index, serum sex hormones, and breast cancer risk in postmenopausal women. J. Natl. Cancer Inst. 2003, 95, 1218–1226. [Google Scholar] [CrossRef]
- Farvid, M.S.; Chen, W.Y.; Rosner, B.A.; Tamimi, R.M.; Willett, W.C.; Eliassen, A.H. Fruit and vegetable consumption and breast cancer incidence: Repeated measures over 30 years of follow-up. Int. J. Cancer 2019, 144, 1496–1510. [Google Scholar] [CrossRef] [PubMed]
- Jung, S.; Spiegelman, D.; Baglietto, L.; Bernstein, L.; Boggs, D.A.; van den Brandt, P.A.; Buring, J.E.; Cerhan, J.R.; Gaudet, M.M.; Giles, G.G.; et al. Fruit and vegetable intake and risk of breast cancer by hormone receptor status. J. Natl. Cancer Inst. 2013, 105, 219–236. [Google Scholar] [CrossRef] [PubMed]
- Perou, C.M.; Sørlie, T.; Eisen, M.B.; van de Rijn, M.; Jeffrey, S.S.; Rees, C.A.; Pollack, J.R.; Ross, D.T.; Johnsen, H.; Akslen, L.A.; et al. Molecular portraits of human breast tumours. Nature 2000, 406, 747–752. [Google Scholar] [CrossRef] [PubMed]
- Zhang, M.H.; Man, H.T.; Zhao, X.D.; Dong, N.; Ma, S.L. Estrogen receptor-positive breast cancer molecular signatures and therapeutic potentials. Biomed. Rep. 2014, 2, 41–52. [Google Scholar] [CrossRef] [PubMed]
- Metastatic Breast Cancer Networks. Who Gets Breast Cancer? Available online: http://mbcn.org/who-gets-breast-cancer/ (accessed on 23 May 2019).
- Yamashita, H.; Iwase, H.; Toyama, T.; Takahashi, S.; Sugiura, H.; Yoshimoto, N.; Endo, Y.; Fujii, Y.; Kobayashi, S. Estrogen receptor-positive breast cancer in Japanese women: trends in incidence, characteristics, and prognosis. Ann. Oncol. 2010, 22, 1318–1325. [Google Scholar] [CrossRef] [PubMed]
- Willett, W. Diet and breast cancer. J. Intern. Med. 2001, 249, 395–411. [Google Scholar] [CrossRef] [PubMed]
- Hebert, J.R.; Ma, Y.; Clemow, L.; Ockene, I.S.; Saperia, G.; Stanek, E.J., III; Merriam, P.A.; Ockene, J.K. Gender differences in social desirability and social approval bias in dietary self-report. Am. J. Epidemiol. 1997, 146, 1046–1055. [Google Scholar] [CrossRef] [PubMed]


| Total (n= 728) | Premenopausal Women (n = 444) | Postmenopausal Women (n = 284) | |||||||
|---|---|---|---|---|---|---|---|---|---|
| Controls (n = 364) | Cases (n = 364) | p-Value | Controls (n = 223) | Cases (n = 221) | p-Value | Controls (n = 141) | Cases (n = 143) | p-Value | |
| Age (year) | 47.7 ± 7.9 | 47.8 ± 8.1 | 0.71 | 43.0 ± 4.4 | 43.2 ± 5.0 | 0.63 | 55.2 ± 6.3 | 54.1 ± 7.6 | 0.20 |
| Height (cm) | 158.0 ± 5.4 | 156.9 ± 5.4 | 0.01 | 158.6 ± 5.3 | 157.7 ± 5.2 | 0.08 | 156.9 ± 5.3 | 155.7 ± 5.5 | 0.05 |
| Weight (kg) | 56.8 ± 6.7 | 57.8 ± 8.2 | 0.10 | 56.3 ± 7.1 | 57.2 ± 8.6 | 0.23 | 57.7 ± 5.9 | 58.6 ± 7.5 | 0.23 |
| BMI (kg/m2) | 22.8 ± 2.5 | 23.5 ± 3.1 | 0.002 | 22.4 ± 7.1 | 23.0 ± 3.2 | 0.04 | 23.4 ± 2.1 | 24.2 ± 2.9 | 0.01 |
| <25 | 306 (84.1) | 265 (72.8) | 0.0002 | 196 (87.9) | 174 (78.7) | 0.01 | 110 (78.0) | 91 (63.6) | 0.01 |
| ≥25 | 58 (15.9) | 99 (27.2) | 27 (12.1) | 47 (21.3) | 31 (22.0) | 52 (36.4) | |||
| First-degree family history of breast cancer (yes) | 10 (2.8) | 18 (5.0) | 0.13 | 6 (2.7) | 9 (4.1) | 0.14 | 4 (2.9) | 9 (6.3) | 0.17 |
| Supplement use (yes) | 215 (59.9) | 194 (53.4) | 0.08 | 120 (54.3) | 123 (55.9) | 0.73 | 114 (82.6) | 97 (67.8) | 0.004 |
| Education level | <0.0001 | <0.0001 | <0.0001 | ||||||
| ≤Elementary | 21 (5.8) | 65 (14.9) | 5 (2.3) | 8 (3.6) | 16 (11.4) | 46 (32.2) | |||
| Middle school | 20 (5.5) | 45 (12.4) | 6 (2.7) | 25 (11.4) | 14 (10.0) | 20 (17.0) | |||
| High school | 131 (36.3) | 169 (46.6) | 71 (21.2) | 108 (49.1) | 60 (42.9) | 61 (42.7) | |||
| >High school | 189 (52.4) | 95 (26.2) | 139 (62.9) | 79 (35.9) | 50 (35.7) | 16 (11.2) | |||
| Marital status | 0.73 | 0.46 | 0.70 | ||||||
| Married | 305 (84.0) | 299 (82.1) | 196 (88.3) | 187 (3.6) | 109 (77.3) | 112 (78.3) | |||
| Single | 18 (5.0) | 18 (5.0) | 14 (6.3) | 16 (7.2) | 7 (2.8) | 2 (1.4) | |||
| Others | 40 (11.0) | 47 (12.9) | 12 (5.4) | 18 (8.1) | 28 (19.9) | 29 (20.3) | |||
| Occupation | 0.04 | 0.15 | 0.29 | ||||||
| Housewife | 198 (54.7) | 218 (60.1) | 104 (46.9) | 112 (50.9) | 94 (67.1) | 106 (74.1) | |||
| Profession or office worker | 85 (23.5) | 59 (16.3) | 66 (29.7) | 48 (21.8) | 19 (13.6) | 11 (7.7) | |||
| Sales or service | 56 (15.5) | 51 (14.1) | 28 (17.1) | 37 (16.8) | 18 (12.9) | 14 (9.8) | |||
| Others | 23 (6.4) | 35 (6.9) | 14 (6.3) | 23 (10.5) | 9 (6.4) | 12 (8.4) | |||
| Smoking status | 0.35 | 0.25 | 0.25 | ||||||
| Past/never | 347 (97.2) | 353 (97.0) | 211 (95.9) | 115 (97.3) | 136 (99.2) | 138 (96.5) | |||
| Current | 10 (2.8) | 11 (3.0) | 9 (4.1) | 6 (2.7) | 1 (0.7) | 5 (3.5) | |||
| Alcohol intake | 0.97 | 0.43 | 0.53 | ||||||
| Never | 191 (52.9) | 192 (52.8) | 109 (49.3) | 103 (46.61) | 82 (58.6) | 89 (62.2) | |||
| Ever | 170 (47.1) | 172 (47.3) | 112 (50.7) | 118 (53.4) | 58 (41.4) | 54 (37.8) | |||
| Physical activity (MET-min/week) | 2425.5 ± 4903.1 | 2121.3 ± 2772.3 | 0.31 | 2669.6 ± 5855.6 | 1812.2 ± 2330.1 | 0.046 | 2021.0 ± 2633.5 | 2594.7 ± 3290.9 | 0.11 |
| <396 | 98 (28.2) | 76 (21.0) | 0.06 | 67 (30.9) | 55 (25.1) | 0.06 | 31 (23.7) | 21 (14.7) | 0.27 |
| 396–1272 | 85 (24.4) | 100 (27.6) | 55 (25.4) | 60 (27.4) | 30 (22.9) | 40 (28.0) | |||
| 1272–2772 | 77 (22.1) | 102 (28.2) | 39 (18.0) | 60 (27.4) | 38 (29.0) | 42 (29.4) | |||
| ≥2772 | 88 (25.3) | 84 (23.2) | 56 (25.8) | 44 (20.1) | 32 (24.4) | 40 (28.0) | |||
| Age at menarche (years) | 14.5 ± 1.6 | 14.7 ± 1.9 | 0.05 | 14.3 ± 1.5 | 14.3 ± 1.6 | 0.77 | 14.7 ± 1.6 | 15.4 ± 2.0 | 0.001 |
| Parity | <0.0001 | <0.0001 | 0.003 | ||||||
| Nulliparous | 6 (1.8) | 39 (10.7) | 6 (2.9) | 32 (14.5) | 0 (0.0) | 7 (4.9) | |||
| Primiparous | 40 (11.8) | 71 (19.5) | 26 (12.8) | 44 (19.9) | 14 (10.4) | 27 (18.9) | |||
| Multiparous | 293 (86.4) | 254 (69.8) | 172 (84.3) | 145 (65.6) | 121 (89.6) | 109 (76.2) | |||
| Menopause status | 0.88 | ||||||||
| Premenopausal | 223 (61.3) | 221 (60.7) | – | – | – | – | |||
| Postmenopausal | 141 (38.7) | 143 (39.3) | – | – | – | – | |||
| Age at menopause (years) § | – | – | – | – | 48.8 ± 4.2 | 48.1 ± 5.2 | 0.23 | ||
| Type of menopause § | 0.02 | ||||||||
| Natural | – | – | – | – | 110 (78.6) | 27 (65.5) | |||
| Surgery or others | – | – | – | – | 30 (21.4) | 36 (34.5) | |||
| Postmenopausal hormone therapy § | 0.0004 | ||||||||
| Yes | – | – | – | – | 53 (39.3) | 27 (19.6) | |||
| No | – | – | – | – | 82 (60.7) | 111 (80.4) | |||
| Energy intake (kcal/day) | 1632.8 ± 534.8 | 1722.9 ± 442.9 | 0.01 | 1722.5 ± 557.3 | 1713.3 ± 405.6 | 0.84 | 1490.9 ± 464.8 | 1737.7 ± 496.3 | <0.0001 |
| DII score | 0.05 ± 2.59 | 1.03 ± 2.41 | <0.0001 | 0.26 ± 2.57 | 0.95 ± 2.42 | 0.004 | -0.29 ± 2.60 | 1.15 ± 2.39 | <0.0001 |
| Total (n= 728) | Premenopausal Women (n = 444) | Postmenopausal Women (n = 284) | |||||||
|---|---|---|---|---|---|---|---|---|---|
| Controls (n = 364) | Cases (n = 364) | p-Value | Controls (n = 223) | Cases (n = 221) | p-Value | Controls (n = 141) | Cases (n = 143) | p-Value | |
| Carbohydrate (g/d) | 187.97 ± 20.01 | 195.74 ± 19.85 | <0.0001 | 188.56 ± 18.74 | 192.45 ± 19.92 | 0.04 | 187.04 ± 21.92 | 200.84 ± 18.67 | <0.0001 |
| Protein (g/d) | 37.30 ± 6.51 | 34.21 ± 5.56 | <0.0001 | 36.73 ± 6.27 | 34.69 ± 5.92 | 0.001 | 38.20 ± 6.79 | 33.48 ± 4.86 | <0.0001 |
| Total fat (g/d) | 17.44 ± 6.02 | 15.68 ± 6.46 | 0.0002 | 17.31 ± 5.58 | 16.74 ± 6.37 | 0.32 | 17.64 ± 6.68 | 14.03 ± 6.29 | <0.0001 |
| MUFAs (g/d) | 5.03 ± 2.40 | 4.54 ± 2.85 | 0.01 | 4.86 ± 2.17 | 4.53 ± 2.52 | 0.15 | 5.31 ± 2.71 | 4.56 ± 3.31 | 0.04 |
| PUFAs (g/d) | 2.87 ± 0.97 | 2.59 ± 1.07 | 0.0002 | 2.80 ± 0.86 | 2.61 ± 0.98 | 0.03 | 2.98 ± 1.12 | 2.55 ± 1.19 | 0.002 |
| Saturated fat (g/d) | 4.97 ± 2.35 | 4.46 ± 2.55 | 0.01 | 4.78 ± 2.10 | 4.45 ± 2.36 | 0.12 | 5.25 ± 2.69 | 4.47 ± 2.82 | 0.02 |
| ω-3 fatty acid (g/d) | 0.37 ± 0.24 | 0.31 ± 0.21 | 0.0002 | 0.36 ± 0.22 | 0.32 ± 0.22 | 0.10 | 0.39 ± 0.27 | 0.28 ± 0.18 | 0.0001 |
| ω-6 fatty acid (g/d) | 2.27 ± 0.71 | 1.95 ± 0.66 | <0.0001 | 2.25 ± 0.63 | 2.04 ± 0.67 | 0.001 | 2.32 ± 0.82 | 1.80 ± 0.60 | <0.0001 |
| Cholesterol (mg/d) | 112.43 ± 57.99 | 92.73 ± 52.51 | <0.0001 | 109.82 ± 51.84 | 97.93 ± 52.28 | 0.02 | 116.57 ± 66.55 | 84.69 ± 52.03 | <0.0001 |
| Vitamin B1 (mg/d) | 0.58 ± 0.13 | 0.50 ± 0.12 | <0.0001 | 0.58 ± 0.13 | 0.51 ± 0.12 | <0.0001 | 0.58 ± 0.14 | 0.48 ± 0.12 | <0.0001 |
| Vitamin B2 (mg/d) | 0.59 ± 0.18 | 0.51 ± 0.16 | <0.0001 | 0.57 ± 0.17 | 0.51 ± 0.16 | 0.0004 | 0.62 ± 0.21 | 0.49 ± 0.12 | <0.0001 |
| Vitamin B6 (mg/d) | 0.88 ± 0.18 | 0.80 ± 0.17 | <0.0001 | 0.85 ± 0.17 | 0.79 ± 0.17 | 0.0003 | 0.92 ± 0.19 | 0.81 ± 0.16 | <0.0001 |
| Vitamin B12 (μg/d) | 5.11 ± 2.78 | 3.85 ± 1.80 | <0.0001 | 4.80 ± 2.60 | 3.91 ± 1.87 | <0.0001 | 5.59 ± 2.99 | 3.75 ± 1.68 | <0.0001 |
| Niacin (mg/d) | 8.12 ± 2.03 | 7.23 ± 1.84 | <0.0001 | 8.01 ± 1.93 | 7.47 ± 1.99 | 0.004 | 8.30 ± 2.18 | 6.86 ± 1.52 | <0.0001 |
| β-carotene (μg/d) | 2048.98 ± 1106.03 | 1688.73 ± 804.25 | <0.0001 | 1951.46 ± 1009.76 | 1676.17 ± 794.76 | 0.002 | 2203.20 ± 1231.23 | 1708.16 ± 821.13 | <0.0001 |
| Vitamin A (μg R.E./d) | 384.23 ± 187.41 | 317.06 ± 137.64 | <0.0001 | 365.96 ± 172.19 | 317.26 ± 135.91 | 0.001 | 413.12 ± 206.59 | 316.75 ± 140.76 | <0.0001 |
| Vitamin C (mg/d) | 73.99 ± 33.43 | 60.63 ± 27.23 | <0.0001 | 74.18 ± 31.08 | 60.68 ± 27.94 | 0.0001 | 77.96 ± 36.59 | 60.55 ± 26.19 | <0.0001 |
| Vitamin D(μg/d) | 1.86 ± 1.26 | 1.55 ± 1.19 | 0.001 | 1.74 ± 1.13 | 1.61 ± 1.28 | 0.27 | 2.04 ± 1.44 | 1.45 ± 1.05 | <0.0001 |
| Vitamin E (mg/d) | 5.20 ± 1.44 | 4.61 ± 1.11 | <0.0001 | 5.06 ± 1.29 | 4.69 ± 1.12 | 0.001 | 5.41 ± 1.64 | 4.48 ± 1.07 | <0.0001 |
| Iron (mg/d) | 8.24 ± 2.26 | 7.14 ± 1.48 | <0.0001 | 7.97 ± 2.8 | 7.11 ± 1.56 | <0.0001 | 8.66 ± 2.33 | 7.19 ± 1.37 | <0.0001 |
| Magnesium (mg/d) | 67.96 ± 18.67 | 62.28 ± 13.48 | <0.0001 | 66.61 ± 17.35 | 62.66 ± 14.59 | 0.01 | 70.10 ± 20.48 | 61.70 ± 11.58 | <0.0001 |
| Zinc (mg/d) | 5.75 ± 0.84 | 5.44 ± 0.82 | <0.0001 | 5.67 ± 0.81 | 5.42 ± 0.82 | 0.001 | 5.89 ± 0.87 | 5.47 ± 0.84 | <0.0001 |
| Selenium (μg/d) | 53.93 ± 8.00 | 51.15 ± 7.63 | <0.0001 | 53.83 ± 7.49 | 51.78 ± 7.66 | 0.004 | 54.07 ± 8.78 | 50.17 ± 7.51 | <0.0001 |
| Folic acid (μg/d) | 312.52 ± 100.67 | 271.50 ± 78.36 | <0.0001 | 301.87 ± 95.52 | 268.88 ± 79.61 | <0.0001 | 329.36 ± 106.51 | 275.54 ± 76.48 | <0.0001 |
| Fiber (g/d) | 12.33 ± 3.93 | 10.75 ± 2.92 | <0.0001 | 11.81 ± 3.53 | 10.62 ± 2.95 | 0.0001 | 13.16 ± 4.38 | 10.94 ± 2.87 | <0.0001 |
| Flavan-3-ol (mg/d) | 6.02 ± 5.07 | 5.07 ± 5.17 | 0.01 | 5.63 ± 5.05 | 5.17 ± 5.62 | 0.36 | 6.65 ± 5.05 | 4.91 ± 4.41 | 0.002 |
| Flavones (mg/d) | 0.99 ± 0.59 | 1.03 ± 0.63 | 0.35 | 0.94 ± 0.51 | 1.06 ± 0.68 | 0.04 | 1.07 ± 0.70 | 0.99 ± 0.55 | 0.30 |
| Flavonols (mg/d) | 12.62 ± 8.25 | 8.99 ± 5.02 | <0.0001 | 11.72 ± 7.19 | 8.99 ± 5.23 | <0.0001 | 14.05 ± 9.55 | 9.00 ± 4.69 | <0.0001 |
| Flavonones (mg/d) | 6.63 ± 7.01 | 6.64 ± 6.68 | 0.98 | 6.60 ± 6.41 | 6.91 ± 6.92 | 0.62 | 6.68 ± 7.90 | 6.23 ± 6.30 | 0.60 |
| Anthocyanidins (mg/d) | 2.48 ± 1.70 | 1.80 ± 1.37 | <0.0001 | 2.15 ± 1.47 | 1.67 ± 1.25 | 0.0003 | 3.00 ± 1.91 | 1.99 ± 1.53 | <0.0001 |
| Isoflavones (mg/d) | 9.44 ± 7.27 | 8.14 ± 5.31 | 0.01 | 8.62 ± 5.81 | 8.11 ± 5.23 | 0.33 | 10.72 ± 8.98 | 8.19 ± 5.46 | 0.005 |
| Garlic (g/d) | 0.87 ± 0.55 | 0.56 ± 0.32 | <0.0001 | 0.85 ± 0.55 | 0.58 ± 0.35 | <0.0001 | 0.90 ± 0.56 | 0.54 ± 0.26 | <0.0001 |
| Ginger (g/d) | 0.003 ± 0.01 | 0.003 ± 0.01 | 0.91 | 0.004 ± 0.01 | 0.004 ± 0.01 | 0.86 | 0.003 ± 0.01 | 0.002 ± 0.01 | 0.65 |
| Onion (g/d) | 8.17 ± 4.83 | 6.88 ± 3.67 | <0.0001 | 8.19 ± 4.71 | 6.95 ± 3.81 | 0.002 | 8.12 ± 5.02 | 6.76 ± 3.44 | 0.01 |
| Green tea (g/d) | 29.14 ± 48.17 | 45.99 ± 87.65 | 0.001 | 29.22 ± 47.85 | 52.34 ± 96.11 | 0.002 | 29.01 ± 48.83 | 36.17 ± 71.91 | 0.33 |
| Pepper (g/d) | 0.025 ± 0.02 | 0.019 ± 0.02 | 0.0002 | 0.025 ± 0.02 | 0.019 ± 0.02 | 0.01 | 0.024 ± 0.02 | 0.018 ± 0.02 | 0.01 |
| Alcohol (g/d) | 7.78 ± 94.52 | 2.30 ± 11.97 | 0.27 | 10.95 ± 120.29 | 2.88 ± 14.74 | 0.32 | 2.78 ± 13.35 | 1.41 ± 5.33 | 0.26 |
| Tertiles of DII | p-Trend ‡ | |||
|---|---|---|---|---|
| T1 | T2 | T3 | ||
| Total (n = 728) | ||||
| Median (range) | −2.74 (≤−1.52) | −0.01 (−1.51–1.23) | 2.91 (>1.23) | |
| No. of controls/cases | 121/56 | 122/141 | 121/167 | |
| Crude OR (95% CI) | Ref. | 2.50 (1.68–3.72) | 2.98 (2.01–4.42) | <0.0001 |
| Adjusted OR (95% CI) a | Ref. | 2.94 (1.87–4.63) | 3.68 (2.34–5.80) | <0.0001 |
| Premenopausal women (n = 444) | ||||
| Median (range) | −2.37 (≤−1.10) | 0.13 (−1.09–1.45) | 3.20 (>1.45) | |
| No. of controls/cases | 74/46 | 75/85 | 74/90 | |
| Crude OR (95% CI) | Ref. | 1.82 (1.13–2.95) | 1.96 (1.21–3.16) | 0.01 |
| Adjusted OR (95% CI) b | Ref. | 1.87 (1.08–3.24) | 2.11 (1.21–3.67) | 0.01 |
| Postmenopausal women (n = 284) | ||||
| Median (range) | −2.94 (≤−1.96) | −0.06 (−1.95–1.02) | 2.62 (>1.02) | |
| No. of controls/cases | 47/19 | 47/49 | 47/75 | |
| Crude OR (95% CI) | Ref. | 2.58 (1.32–5.02) | 3.95 (2.07–7.53) | <0.0001 |
| Adjusted OR (95% CI) c | Ref. | 3.21 (1.35–7.23) | 6.13 (2.66–14.12) | <0.0001 |
| No. of Controls | ER+/PR+ | ER−/PR− | |||||||
|---|---|---|---|---|---|---|---|---|---|
| No. of Cases | Median | Crude OR (95% CI) | Adjusted OR (95% CI) | No. of Cases | Median | Crude OR (95% CI) | Adjusted OR (95% CI) | ||
| Total a | |||||||||
| T1 (≤−1.52) | 121 | 28 | −2.75 | Ref. | Ref. | 14 | −2.75 | Ref. | Ref. |
| T2 (−1.51–1.23) | 122 | 91 | 0.05 | 3.22 (1.97–5.28) | 3.88 (2.21–6.79) | 31 | 0.03 | 2.20 (1.11–4.33) | 2.56 (1.18–5.55) |
| T3 (>1.23) | 121 | 100 | 2.80 | 3.57 (2.19–5.82) | 4.29 (2.45–7.54) | 40 | 2.88 | 2.86 (1.48–5.52) | 5.00 (2.32–10.77) |
| p-Trend ‡ | <0.0001 | <0.0001 | <0.0001 | <0.0001 | |||||
| Premenopausal women b | |||||||||
| T1 (≤−1.10) | 74 | 26 | −2.52 | Ref. | Ref. | 12 | −2.37 | Ref. | Ref. |
| T2 (−1.09–1.45) | 75 | 67 | 0.16 | 2.54 (1.46–4.43) | 2.48 (1.32–4.65) | 11 | 0.11 | 0.90 (0.38–2.18) | 0.94 (0.35–2.51) |
| T3 (>1.45) | 74 | 68 | 3.03 | 2.62 (1.50–4.56) | 2.59 (1.37–4.88) | 14 | 3.18 | 1.17 (0.51–2.69) | 1.64 (0.62–4.33) |
| p-Trend ‡ | 0.002 | 0.01 | 0.69 | 0.28 | |||||
| Postmenopausal women c | |||||||||
| T1 (≤−1.96) | 47 | 6 | −2.97 | Ref. | Ref. | 6 | −3.00 | Ref. | Ref. |
| T2 (−1.95–1.02) | 47 | 22 | −0.03 | 3.67 (1.36–9.85) | 5.96 (1.63–21.84) | 15 | −0.03 | 2.50 (0.89–7.00) | 2.62 (0.73–9.47) |
| T3 (>1.02) | 47 | 30 | 2.41 | 5.00 (1.90–13.12) | 11.00 (2.93–41.30) | 27 | 2.55 | 4.50 (1.70–11.90) | 5.22 (1.55–17.55) |
| p-Trend ‡ | <0.0001 | 0.0004 | 0.002 | 0.01 | |||||
© 2019 by the authors. Licensee MDPI, Basel, Switzerland. This article is an open access article distributed under the terms and conditions of the Creative Commons Attribution (CC BY) license (http://creativecommons.org/licenses/by/4.0/).
Share and Cite
Lee, S.; Quiambao, A.L.; Lee, J.; Ro, J.; Lee, E.-S.; Jung, S.-Y.; Sung, M.-K.; Kim, J. Dietary Inflammatory Index and Risk of Breast Cancer Based on Hormone Receptor Status: A Case-Control Study in Korea. Nutrients 2019, 11, 1949. https://0-doi-org.brum.beds.ac.uk/10.3390/nu11081949
Lee S, Quiambao AL, Lee J, Ro J, Lee E-S, Jung S-Y, Sung M-K, Kim J. Dietary Inflammatory Index and Risk of Breast Cancer Based on Hormone Receptor Status: A Case-Control Study in Korea. Nutrients. 2019; 11(8):1949. https://0-doi-org.brum.beds.ac.uk/10.3390/nu11081949
Chicago/Turabian StyleLee, Seohyun, Arlene Lansangan Quiambao, Jeonghee Lee, Jungsil Ro, Eun-Sook Lee, So-Youn Jung, Mi-Kyung Sung, and Jeongseon Kim. 2019. "Dietary Inflammatory Index and Risk of Breast Cancer Based on Hormone Receptor Status: A Case-Control Study in Korea" Nutrients 11, no. 8: 1949. https://0-doi-org.brum.beds.ac.uk/10.3390/nu11081949