Malnutrition is Associated with Behavioral and Psychiatric Symptoms of Dementia in Older Women with Mild Cognitive Impairment and Early-Stage Alzheimer’s Disease

Abstract
:1. Introduction
2. Materials and Methods
2.1. Subjects
2.2. Measurements
2.2.1. Nutritional Status
2.2.2. Behavioral and Psychological Symptoms of Dementia
2.2.3. Other Assessments
2.3. Statistical Analysis
3. Results
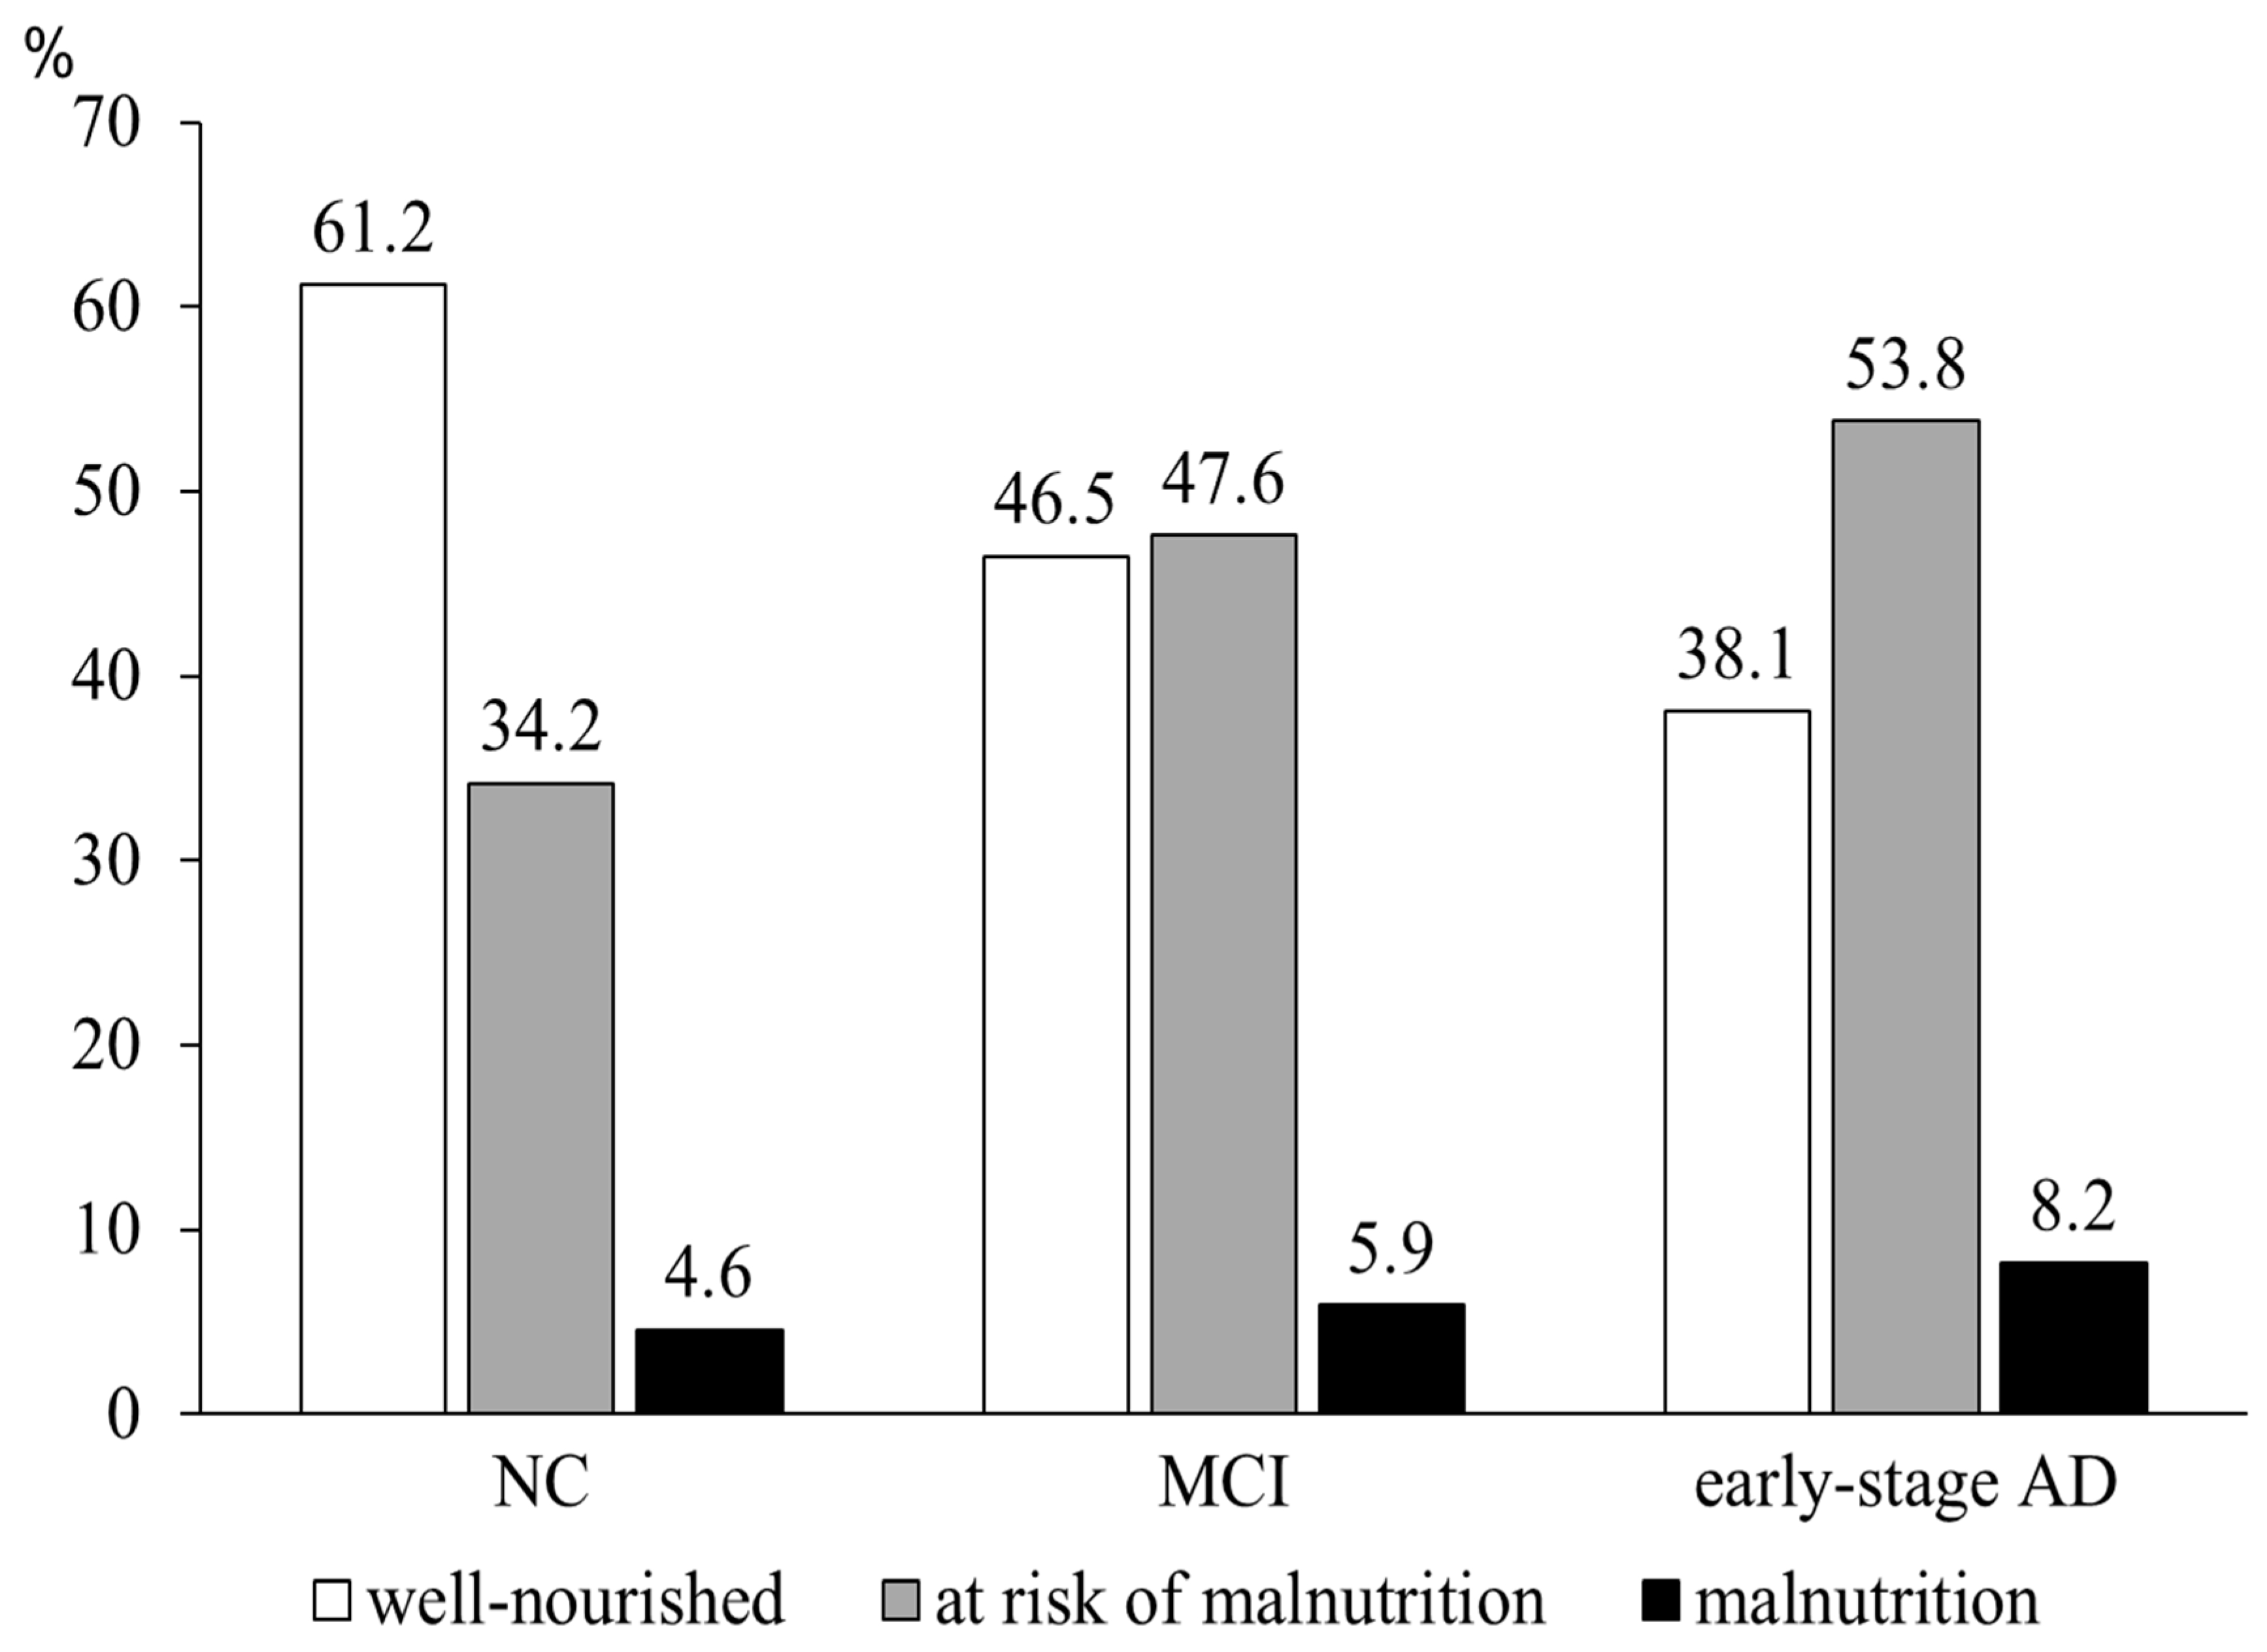
3.1. Nutritional Status at the Respective Cognitive Stages
3.2. Association between Nutritional Status and Behavioral Psychiatric Symptoms of Dementia (BPSD)
4. Discussion
5. Conclusions
Author Contributions
Funding
Acknowledgments
Conflicts of Interest
References
- Soto, M.E.; Secher, M.; Gillette-Guyonnet, S.; van Kan, G.A.; Andrieu, S.; Nourhashemi, F.; Rolland, Y.; Vellas, B. Weight loss and rapid cognitive decline in community-dwelling patients with Alzheimer’s disease. J. Alzheimers Dis. 2012, 28, 647–654. [Google Scholar] [CrossRef] [PubMed]
- Payette, H.; Coulombe, C.; Boutier, V.; Gray-Donald, K. Nutrition risk factors for institutionalization in a free-living functionally dependent elderly population. J. Clin. Epidemiol. 2000, 53, 579–587. [Google Scholar] [CrossRef]
- Faxén-Irving, G.; Basun, H.; Cederholm, T. Nutritional and cognitive relationships and long-term mortality in patients with various dementia disorders. Age Ageing 2005, 34, 136–141. [Google Scholar] [CrossRef] [PubMed] [Green Version]
- Kai, K.; Hashimoto, M.; Amano, K.; Tanaka, H.; Fukuhara, R.; Ikeda, M. Relationship between Eating Disturbance and Dementia Severity in Patients with Alzheimer’s disease. PLoS ONE 2015, 10, e0133666. [Google Scholar] [CrossRef] [PubMed]
- Suma, S.; Watanabe, Y.; Hirano, H.; Kimura, A.; Edahiro, A.; Awata, S.; Yamashita, Y.; Matsushita, K.; Arai, H.; Sakurai, T. Factors affecting the appetites of persons with Alzheimer’s disease and mild cognitive impairment. Geriatr. Gerontol. Int. 2018, 18, 1236–1243. [Google Scholar] [CrossRef] [PubMed]
- Johnson, D.K.; Wilkins, C.H.; Morris, J.C. Accelerated Weight Loss May Precede Diagnosis in Alzheimer Disease. Arch. Neurol. 2006, 63, 1312. [Google Scholar] [CrossRef] [PubMed]
- Sugimoto, T.; Ono, R.; Murata, S.; Saji, N.; Matsui, Y.; Niida, S.; Toba, K.; Sakurai, T. Prevalence and associated factors of sarcopenia in elderly subjects with amnestic mild cognitive impairment or Alzheimer disease. Curr. Alzheimer Res. 2016, 13, 718–726. [Google Scholar] [CrossRef] [PubMed]
- Ye, B.S.; Jang, E.Y.; Kim, S.Y.; Kim, E.J.; Park, S.A.; Lee, Y.; Hong, C.H.; Choi, S.H.; Yoon, B.; Yoon, S.J.; et al. Unstable Body Mass Index and Progression to Probable Alzheimer’s Disease Dementia in Patients with Amnestic Mild Cognitive Impairment. J. Alzheimers Dis. 2016, 49, 483–491. [Google Scholar] [CrossRef]
- Lyketsos, C.G.; Lopez, O.; Jones, B.; Fitzpatrick, A.L.; Breitner, J.; DeKosky, S. Prevalence of neuropsychiatric symptoms in dementia and mild cognitive impairment: results from the cardiovascular health study. JAMA 2002, 288, 1475–1483. [Google Scholar] [CrossRef] [PubMed]
- Kamiya, M.; Sakurai, T.; Ogama, N.; Maki, Y.; Toba, K. Factors associated with increased caregivers’ burden in several cognitive stages of Alzheimer’s disease. Geriatr. Gerontol. Int. 2014, 14 (Suppl. 2), 45–55. [Google Scholar] [CrossRef] [PubMed]
- Chiao, C.-Y.; Wu, H.-S.; Hsiao, C.-Y. Caregiver burden for informal caregivers of patients with dementia: A systematic review. Int. Nurs. Rev. 2015, 62, 340–350. [Google Scholar] [CrossRef] [PubMed]
- Voisin, T.; Andrieu, S.; Cantet, C.; Vellas, B.; REAL.FR Group. Predictive factors of hospitalizations in Alzheimer’s disease: A two-year prospective study in 686 patients of the REAL.FR study. J. Nutr. Health Aging 2010, 14, 288–291. [Google Scholar] [CrossRef] [PubMed]
- Shimabukuro, J.; Awata, S.; Matsuoka, H. Behavioral and psychological symptoms of dementia characteristic of mild Alzheimer patients. Psychiatry Clin. Neurosci. 2005, 59, 274–279. [Google Scholar] [CrossRef] [PubMed]
- Apostolova, L.G.; Di, L.J.; Duffy, E.L.; Brook, J.; Elashoff, D.; Tseng, C.H.; Fairbanks, L.; Cummings, J.L. Risk factors for behavioral abnormalities in mild cognitive impairment and mild Alzheimer’s disease. Dement. Geriatr. Cogn. Disord. 2014, 37, 315–326. [Google Scholar] [CrossRef] [PubMed]
- Steinberg, M.; Corcoran, C.; Tschanz, J.; Huber, C.; Welsh-Bohmer, K.; Norton, M.; Zandi, P.; Breitner, J.; Steffens, D.; Lyketsos, C. Risk factors for neuropsychiatric symptoms in dementia: the Cache County Study. Int. J. Geriatr. Psychiatry 2006, 21, 824–830. [Google Scholar] [CrossRef] [PubMed]
- Spaccavento, S.; Del Prete, M.; Craca, A.; Fiore, P. Influence of nutritional status on cognitive, functional and neuropsychiatric deficits in Alzheimer’s disease. Arch. Gerontol. Geriatr. 2009, 48, 356–360. [Google Scholar] [CrossRef] [PubMed]
- White, H.K.; McConnell, E.S.; Bales, C.W.; Kuchibhatla, M. A 6-Month Observational Study of the Relationship between Weight Loss and Behavioral Symptoms in Institutionalized Alzheimer’s Disease Subjects. J. Am. Med. Dir. Assoc. 2004, 5, 89–97. [Google Scholar] [CrossRef]
- Perneczky, R.; Wagenpfeil, S.; Komossa, K.; Grimmer, T.; Diehl, J.; Kurz, A. Mapping Scores onto Stages: Mini-Mental State Examination and Clinical Dementia Rating. Am. J. Geriatr. Psychiatry 2006, 14, 139–144. [Google Scholar] [CrossRef]
- Albert, M.S.; DeKosky, S.T.; Dickson, D.W.; Dubois, B.; Feldman, H.H.; Fox, N.C.; Gamst, A.; Holtzman, D.M.; Jagust, W.J.; Petersen, R.C.; et al. The diagnosis of mild cognitive impairment due to Alzheimer’s disease: Recommendations from the National Institute on Aging-Alzheimer’s Association workgroups on diagnostic guidelines for Alzheimer’s disease. Alzheimer’s Dement. 2011, 7, 270–279. [Google Scholar] [CrossRef]
- McKhann, G.M.; Knopman, D.S.; Chertkow, H.; Hyman, B.T.; Jack, C.R.; Kawas, C.H.; Klunk, W.E.; Koroshetz, W.J.; Manly, J.J.; Mayeux, R.; et al. The diagnosis of dementia due to Alzheimer’s disease: Recommendations from the National Institute on Aging-Alzheimer’s Association workgroups on diagnostic guidelines for Alzheimer’s disease. Alzheimer’s Dement. 2011, 7, 263–269. [Google Scholar] [CrossRef]
- Kitamura, T.; Kitamura, M.; Hino, S.; Tanaka, N.; Kurata, K. Gender Differences in Clinical Manifestations and Outcomes among Hospitalized Patients with Behavioral and Psychological Symptoms of Dementia. J. Clin. Psychiatry 2012, 73, 1548–1554. [Google Scholar] [CrossRef] [PubMed]
- Rubenstein, L.Z.; Harker, J.O.; Salvà, A.; Guigoz, Y.; Vellas, B. Screening for Undernutrition in Geriatric Practice: Developing the Short-Form Mini-Nutritional Assessment (MNA-SF). J. Gerontol. Ser. A Boil. Sci. Med. Sci. 2001, 56, M366–M372. [Google Scholar] [CrossRef] [PubMed] [Green Version]
- Smith, A.D.; Refsum, H. Homocysteine, B Vitamins, and Cognitive Impairment. Annu. Rev. Nutr. 2016, 36, 211–239. [Google Scholar] [CrossRef] [PubMed]
- Nourhashemi, F.; Guyonnet, S.; Ousset, P.; Kostek, V.; Lauque, S.; Chumlea, W.; Nourhashemi, F.; Vellas, B.; Albarède, J. Mini Nutritional Assessment and Alzheimer Patients. In Mini Nutritional Assessment (MNA): Research and Practice in the Elderly; Karger Publishers: Basel, Switzerland, 1999; Volume 1, pp. 87–92. [Google Scholar]
- Kaiser, M.J.; MNA-International Group; Bauer, J.M.; Rämsch, C.; Uter, W.; Guigoz, Y.; Cederholm, T.; Thomas, D.R.; Anthony, P.; Charlton, K.E.; et al. Validation of the Mini Nutritional Assessment short-form (MNA®-SF): A practical tool for identification of nutritional status. J. Nutr. Health Aging 2009, 13, 782–788. [Google Scholar] [PubMed]
- Baumgarten, M.; Becker, R.; Gauthier, S. Validity and Reliability of the Dementia Behavior Disturbance Scale. J. Am. Geriatr. Soc. 1990, 38, 221–226. [Google Scholar] [CrossRef] [PubMed]
- Mizoguchi, T.; Iijima, S.; Eto, F.; Ishizuka, A.; Orimo, H. Reliability and Validity of a Japanese Version of the Dementia Behavior Disturbance Scale. Nihon Ronen Igakkai zasshi Jpn. J. Geriatr. 1993, 30, 835–840. [Google Scholar] [CrossRef]
- Gnjidic, D.; Hilmer, S.N.; Blyth, F.M.; Naganathan, V.; Waite, L.; Seibel, M.J.; McLachlan, A.J.; Cumming, R.G.; Handelsman, D.J.; Le Couteur, D.G. Polypharmacy cutoff and outcomes: five or more medicines were used to identify community-dwelling older men at risk of different adverse outcomes. J. Clin. Epidemiol. 2012, 65, 989–995. [Google Scholar] [CrossRef]
- Folstein, M.F.; Folstein, S.E.; McHugh, P.R. “Mini-mental state”: A practical method for grading the cognitive state of patients for the clinician. J. Psychiatr. Res. 1975, 12, 189–198. [Google Scholar] [CrossRef]
- Mahoney, F.I.; Barthel, D.W. Functional Evaluation: The BARTHEL Index. Md. State Med. J. 1965, 14, 61–65. [Google Scholar]
- Lawton, M.P.; Brody, E.M. Assessment of Older People: Self-Maintaining and Instrumental Activities of Daily Living. Gerontologist 1969, 9, 179–186. [Google Scholar] [CrossRef]
- Toba, K.; Nakai, R.; Iijima, S.; Nishinaga, M.; Mizoguchi, T.; Yamada, S.; Yumita, K.; Akishita, M.; Ouchi, Y. Vitality Index as a useful tool to assess elderly with dementia. Geriatr. Gerontol. Int. 2002, 2, 23–29. [Google Scholar] [CrossRef]
- Yesavage, J.A.; Brink, T.; Rose, T.L.; Lum, O.; Huang, V.; Adey, M.; Leirer, V.O. Development and validation of a geriatric depression screening scale: A preliminary report. J. Psychiatr. Res. 1982, 17, 37–49. [Google Scholar] [CrossRef]
- Lach, H.W.; Change, Y.P.; Edwards, D. Can older adults with dementia accurately report depression using brief forms? Reliability and validity of the Geriatric Depression Scale. J. Gerontol. Nurs. 2010, 36, 30–37. [Google Scholar] [CrossRef] [PubMed]
- Guigoz, Y. The Mini Nutritional Assessment (MNA) review of the literature—What does it tell us? J. Nutr. Health Aging 2006, 10, 466–485. [Google Scholar] [PubMed]
- Orsitto, G.; Fulvio, F.; Tria, D.; Turi, V.; Venezia, A.; Manca, C. Nutritional status in hospitalized elderly patients with mild cognitive impairment. Clin. Nutr. 2009, 28, 100–102. [Google Scholar] [CrossRef] [PubMed]
- Khater, M.S.; Abouelezz, N.F. Nutritional status in older adults with mild cognitive impairment living in elderly homes in Cairo, Egypt. J. Nutr. Health Aging 2011, 15, 104–108. [Google Scholar] [CrossRef] [PubMed]
- Koyama, A.; Hashimoto, M.; Tanaka, H.; Fujise, N.; Matsushita, M.; Miyagawa, Y.; Hatada, Y.; Fukuhara, R.; Hasegawa, N.; Todani, S.; et al. Malnutrition in Alzheimer’s Disease, Dementia with Lewy Bodies, and Frontotemporal Lobar Degeneration: Comparison Using Serum Albumin, Total Protein, and Hemoglobin Level. PLoS ONE 2016, 11, e0157053. [Google Scholar] [CrossRef] [PubMed]
- Sergi, G.; De Rui, M.; Coin, A.; Inelmen, E.M.; Manzato, E. Weight loss and Alzheimer’s disease: Temporal and aetiologic connections. Proc. Nutr. Soc. 2013, 72, 160–165. [Google Scholar] [CrossRef]
- Poehlman, E.T.; Dvorak, R.V. Energy expenditure, energy intake, and weight loss in Alzheimer disease. Am. J. Clin. Nutr. 2000, 71, 650S–655S. [Google Scholar] [CrossRef] [Green Version]
- Ahmed, R.M.; Landin-Romero, R.; Collette, T.-H.; Van Der Klaauw, A.; Devenney, E.; Henning, E.; Piguet, O.; Farooqi, S.; Hodges, J.R.; Kiernan, M.C. Energy expenditure in frontotemporal dementia: a behavioural and imaging study. J. Neurol. Neurosurg. Psychiatry 2017, 88, 171–183. [Google Scholar] [CrossRef]
- Di Iulio, F.; Palmer, K.; Blundo, C.; Casini, A.R.; Gianni, W.; Caltagirone, C.; Spalletta, G. Occurrence of neuropsychiatric symptoms and psychiatric disorders in mild Alzheimer’s disease and mild cognitive impairment subtypes. Int. Psychogeriatr. 2010, 22, 629–640. [Google Scholar] [CrossRef] [PubMed]
- Gonfrier, S.; Andrieu, S.; Renaud, D.; Vellas, B.; Robert, P.H. Course of neuropsychiatric symptoms during a 4-year follow up in the REAL-FR cohort. J. Nutr. Health Aging 2012, 16, 134–137. [Google Scholar] [CrossRef] [PubMed]
- Guerin, O.; Soto, M.E.; Brocker, P.; Robert, P.H.; Benoit, M.; Vellas, B.; Group, R.F. Nutritional status assessment during Alzheimer’s disease: results after one year (the REAL French Study Group). J. Nutr. Health Aging 2005, 9, 81–84. [Google Scholar] [PubMed]
- Scarmeas, N.; Anastasiou, C.A.; Yannakoulia, M. Nutrition and prevention of cognitive impairment. Lancet Neurol. 2018, 17, 1006–1015. [Google Scholar] [CrossRef]
- Volicer, L.; Frijters, D.H.; Van Der Steen, J.T. Apathy and Weight Loss in Nursing Home Residents: Longitudinal Study. J. Am. Med. Dir. Assoc. 2013, 14, 417–420. [Google Scholar] [CrossRef]
- Boublay, N.; Schott, A.M.; Krolak-Salmon, P. Neuroimaging correlates of neuropsychiatric symptoms in Alzheimer’s disease: a review of 20 years of research. Eur. J. Neurol. 2016, 23, 1500–1509. [Google Scholar] [CrossRef] [PubMed]
- Ismail, Z.; Herrmann, N.; Rothenburg, L.S.; Cotter, A.; Leibovitch, F.S.; Rafi-Tari, S.; Black, S.E.; Lanctôt, K.L. A functional neuroimaging study of appetite loss in Alzheimer’s disease. J. Neurol. Sci. 2008, 271, 97–103. [Google Scholar] [CrossRef]
- Marshall, G.A.; Monserratt, L.; Harwood, D.; Mandelkern, M.; Cummings, J.L.; Sultzer, D.L. Positron Emission Tomography Metabolic Correlates of Apathy in Alzheimer Disease. Arch. Neurol. 2007, 64, 1015. [Google Scholar] [CrossRef]
- Trzepacz, P.T.; Yu, P.; Bhamidipati, P.K.; Willis, B.; Forrester, T.; Tabas, L.; Schwarz, A.J.; Saykin, A.J.; Alzheimer’s Disease Neuroimaging Initiative. Frontolimbic atrophy is associated with agitation and aggression in mild cognitive impairment and Alzheimer’s disease. Alzheimer’s Dement. 2013, 9, S95–S104 e1. [Google Scholar] [CrossRef]
- Jonsson, M.; Edman, A.; Lind, K.; Rolstad, S.; Sjogren, M.; Wallin, A. Apathy is a prominent neuropsychiatric feature of radiological white-matter changes in patients with dementia. Int. J. Geriatr. Psychiatry 2010, 25, 588–595. [Google Scholar] [CrossRef]
- Grundman, M.; Corey-Bloom, J.; Jernigan, T.; Archibald, S.; Thal, L.J. Low body weight in Alzheimer’s disease is associated with mesial temporal cortex atrophy. Neurology 1996, 46, 1585–1591. [Google Scholar] [CrossRef] [PubMed]
- Kramer, M.H.; Maier, A.B.; Muller, M.; De Van Der Schueren, M.A.E.; Lonterman-Monasch, S.; Van Der Flier, W.M. Malnutrition and Risk of Structural Brain Changes Seen on Magnetic Resonance Imaging in Older Adults. J. Am. Geriatr. Soc. 2016, 64, 2457–2463. [Google Scholar]
- Sugimoto, T.; Kato, T.; Iwata, K.; Saji, N.; Arahata, Y.; Hattori, H.; Bundo, M.; Ito, K.; Niida, S.; Sakurai, T.; et al. Decreased Glucose Metabolism in Medial Prefrontal Areas is Associated with Nutritional Status in Patients with Prodromal and Early Alzheimer’s Disease. J. Alzheimer’s Dis. 2017, 60, 225–233. [Google Scholar] [CrossRef] [PubMed]


| Verbal Aggressiveness/Emotional Disinhibition | Motor Aggressiveness | Behavior Disturbance | Apathy/Memory Impairment | Incontinence | Sexual Disinhibition | |
|---|---|---|---|---|---|---|
| 09. Is verbally abusive, curses | 0.683 | 0.219 | −0.018 | −0.030 | −0.138 | −0.125 |
| 05. Makes unwarranted accusations | 0.652 | 0.196 | 0.004 | 0.031 | −0.189 | −0.078 |
| 14. Moves arms or legs in a restless or agitated way | 0.576 | −0.075 | 0.038 | −0.117 | 0.072 | 0.068 |
| 12. Refuses to be helped with personal care | 0.462 | −0.053 | 0.080 | 0.097 | 0.063 | 0.086 |
| 11. Cries or laughs inappropriately | 0.445 | −0.002 | 0.064 | −0.043 | 0.033 | 0.043 |
| 13. Hoards things for no obvious reason | 0.360 | −0.138 | 0.031 | 0.308 | 0.047 | 0.027 |
| 15. Empties drawers or closets | 0.344 | 0.003 | 0.041 | 0.111 | 0.046 | 0.070 |
| 19. Overeats | 0.343 | −0.074 | 0.097 | 0.010 | 0.251 | −0.054 |
| 08. Repeats the same action over and over again | 0.326 | −0.099 | 0.193 | 0.094 | 0.096 | −0.042 |
| 22. Makes physical attacks | 0.062 | 0.799 | −0.040 | 0.046 | 0.030 | −0.042 |
| 23. Screams for no reason | 0.106 | 0.726 | −0.009 | 0.023 | 0.040 | −0.068 |
| 26. Destroys property of clothing | −0.125 | 0.509 | 0.275 | 0.007 | −0.006 | 0.064 |
| 28. Throws food | 0.132 | 0.386 | −0.135 | −0.075 | 0.296 | 0.240 |
| 16. Wanders in the house at night | 0.106 | 0.079 | 0.667 | −0.143 | −0.177 | 0.025 |
| 07. Paces up and down | 0.189 | −0.060 | 0.550 | −0.016 | −0.029 | −0.042 |
| 04. Wakes up at night for no obvious reason | 0.032 | 0.030 | 0.512 | 0.021 | 0.074 | −0.077 |
| 21. Wanders aimlessly outside or in the house during the day | 0.129 | 0.017 | 0.466 | −0.080 | −0.027 | 0.148 |
| 17. Gets lost outside | −0.265 | 0.386 | 0.454 | 0.054 | −0.010 | 0.026 |
| 10. Dresses inappropriately | 0.213 | −0.105 | 0.365 | 0.074 | 0.153 | 0.005 |
| 18. Refuses to eat | 0.042 | 0.049 | 0.244 | 0.126 | −0.022 | 0.105 |
| 02. Loses, misplaces, or hides things | 0.070 | 0.012 | −0.119 | 0.787 | −0.109 | 0.071 |
| 01. Asks the same question over and over again | −0.030 | 0.057 | −0.078 | 0.742 | −0.062 | 0.025 |
| 03. Shows lack of interest in daily activities | −0.055 | 0.045 | 0.119 | 0.522 | 0.108 | −0.041 |
| 06. Sleeps excessively during the day | −0.061 | 0.035 | 0.225 | 0.233 | 0.188 | −0.117 |
| 27. Is incontinent of feces | 0.053 | 0.100 | −0.165 | −0.051 | 0.790 | 0.042 |
| 20. Is incontinent of urine | −0.055 | 0.016 | 0.065 | −0.015 | 0.696 | −0.119 |
| 24. Makes inappropriate sexual advances | 0.000 | 0.018 | 0.084 | −0.012 | −0.027 | 0.815 |
| 25. Exposes himself/herself indecently | 0.000 | −0.042 | −0.023 | 0.072 | −0.071 | 0.682 |
| NC (n = 152) | MCI (n = 271) | Early-Stage AD (n = 318) | p Value | |
|---|---|---|---|---|
| Age, years | 73.8 ± 5.2 | 76.4 ± 5.6 a | 78.3 ± 5.6 a,b | <0.001 |
| Education, years | 11.5 ± 2.5 | 10.6 ± 2.0 a | 10.2 ± 2.2 a | <0.001 |
| Marital status, n (%) | ||||
| Never married | 2 (1.3) | 2 (0.7) | 4 (1.3) | 0.021 |
| Married | 106 (69.7) | 159 (58.7) | 171 (53.8) | |
| Divorced or widowed | 44 (29.0) | 110 (40.6) | 143 (45.0) | |
| Living alone, n (%) | 19 (12.5) | 49 (18.1) | 70 (22.0) | 0.045 |
| Body mass index, kg/m2 | 22.2 ± 3.3 | 22.1 ± 3.5 | 21.9 ± 3.3 | 0.588 |
| MNA-SF, score | 11.7 ± 1.9 | 11.1 ± 2.1 a | 10.7 ± 2.1 a | <0.001 |
| A. Food intake | 1.95 ± 0.2 | 1.80 ± 0.4 a | 1.76 ± 0.5 a | <0.001 |
| B. Weight loss | 2.37 ± 1.0 | 2.06 ± 1.0 a | 2.15 ± 1.0 | 0.004 |
| C. Mobility | 1.97 ± 0.2 | 1.98 ± 0.2 | 1.92 ± 0.3 b | 0.006 |
| D. Psychological stress | 1.62 ± 0.8 | 1.66 ± 0.8 | 1.56 ± 0.8 | 0.347 |
| E. Neuropsychological disturbance | 1.89 ± 0.4 | 1.75 ± 0.5 a | 1.55 ± 0.6 a,b | <0.001 |
| F. BMI | 1.86 ± 1.1 | 1.82 ± 1.1 | 1.74 ± 1.1 | 0.588 |
| MMSE, score | 28.3 ± 1.9 | 25.1 ± 2.4 a | 23.2 ± 2.0 a,b | <0.001 |
| Barthel Index, score | 99.2 ± 4.2 | 98.6 ± 4.9 | 97.0 ± 8.5 a | 0.001 |
| Lawton Index, score | 7.7 ± 0.7 | 7.3 ± 1.2 a | 6.2 ± 1.6 a,b | <0.001 |
| Vitality Index, score | 9.8 ± 0.5 | 9.6 ± 0.7 | 9.2 ± 1.1 a,b | <0.001 |
| GDS-15, score | 4.0 ± 3.0 | 4.6 ± 3.0 | 4.2 ± 2.8 | 0.049 |
| DBD, score | 5.7 ± 6.7 | 8.2 ± 6.7a | 14.0 ± 8.9 a,b | <0.001 |
| Serum albumin, g/dl, n = 608 | 4.5 ± 0.2 | 4.5 ± 0.3 | 4.4 ± 0.3 a | 0.012 |
| vitamin B1, ng/dl, n = 613 | 51.4 ± 48.3 | 46.1 ± 38.8 | 54.3 ± 82.6 | 0.132 |
| vitamin B12, pg/dl, n = 610 | 753.1 ± 506.0 | 887.1 ± 1794.0 | 967.3 ± 4584.0 | 0.144 |
| folate, ng/mL, n = 612 | 9.4 ± 3.9 | 9.2 ± 4.6 | 8.0 ± 5.3 a,b | <0.001 |
| Current smoker, n (%) | 5 (3.3) | 15 (5.5) | 19 (6.0) | 0.461 |
| Drinking status, n (%) | ||||
| Never | 113 (74.3) | 212 (78.2) | 258 (81.1) | 0.315 |
| ethanol <43.2 g/d | 38 (25.0) | 59 (21.8) | 58 (18.2) | |
| ethanol ≥43.2 g/d | 1 (0.7) | 0 (0.0) | 2 (0.6) | |
| Need for financial support, n (%) | 8 (5.3) | 11 (4.1) | 21 (6.6) | 0.394 |
| Polypharmacy (≥5), n (%) | 129 (47.4) | 126 (46.5) | 134 (42.1) | 0.442 |
| Comorbid conditions, mean | 1.4 ± 1.1 | 1.5 ± 1.1 | 1.5 ± 1.0 | 0.879 |
| Diabetes mellitus, n (%) | 54 (35.5) | 86 (31.7) | 112 (35.2) | 0.610 |
| Hypertension, n (%) | 69 (45.4) | 162 (59.8) | 190 (59.7) | 0.006 |
| Dyslipidemia, n (%) | 73 (48.0) | 123 (45.4) | 133 (41.8) | 0.412 |
| Cardiac disease, n (%) | 20 (13.2) | 18 (6.6) | 32 (10.1) | 0.079 |
| Stroke, n (%) | 4 (2.6) | 10 (3.7) | 10 (3.1) | 0.834 |
| Overall (n = 589) | Well-Nourished Subjects (n = 247) | Subjects at Risk of/with Malnutrition (n = 342) | p Value | |
|---|---|---|---|---|
| Age, years | 77.4 ± 5.7 | 76.9 ± 5.6 | 77.7 ± 5.6 | 0.098 |
| Education, years | 10.4 ± 2.2 | 10.5 ± 2.1 | 10.5 ± 2.1 | 0.581 |
| Marital status, n (%) | ||||
| Never married | 6 (1.0) | 1 (0.4) | 5 (1.5) | 0.420 |
| Married | 330 (56.0) | 137 (55.5) | 193 (56.4) | |
| Divorced or widowed | 253 (43.0) | 109 (44.1) | 144 (42.1) | |
| Living alone, n (%) | 119 (20.2) | 48 (19.4) | 71 (20.8) | 0.692 |
| Body mass index, kg/m2 | 22.0 ± 3.4 | 23.6 ± 2.7 | 20.8 ± 3.4 | <0.001 |
| MNA-SF, score | 10.9 ± 2.1 | 12.8 ± 0.8 | 9.5 ± 1.6 | <0.001 |
| MMSE, score | 24.1 ± 2.4 | 24.2 ± 2.5 | 24.0 ± 2.3 | 0.488 |
| Barthel Index, score | 97.8 ± 7.1 | 98.9 ± 4.1 | 96.9 ± 8.5 | 0.002 |
| Lawton Index, score | 6.7 ± 1.5 | 7.0 ± 1.4 | 6.5 ± 1.6 | <0.001 |
| Vitality Index, score | 9.4 ± 1.0 | 9.6 ± 0.8 | 9.3 ± 1.1 | 0.002 |
| GDS-15, score | 4.4 ± 2.9 | 4.0 ± 2.7 | 4.7 ± 3.0 | 0.013 |
| DBD, score | 11.4 ± 8.5 | 9.5 ± 7.3 | 12.7 ± 9.0 | <0.001 |
| Serum albumin, g/dl, n = 493 | 4.4 ± 0.3 | 4.4 ± 0.3 | 4.4 ± 0.3 | 0.522 |
| vitamin B1, ng/dl, n = 497 | 50.7 ± 66.7 | 51.2 ± 69.6 | 50.3 ± 64.7 | 0.692 |
| vitamin B12, pg/dl, n = 494 | 931.4 ± 3609.9 | 1205.4 ± 5558.8 | 745.0 ± 923.8 | 0.646 |
| folate, ng/mL, n = 497 | 8.5 ± 5.0 | 8.3 ± 3.6 | 8.6 ± 5.8 | 0.544 |
| Current smoker, n (%) | 34 (5.8) | 16 (6.5) | 18 (5.3) | 0.533 |
| Drinking status, n (%) | ||||
| Never | 470 (79.8) | 196 (79.4) | 274 (80.1) | 0.452 |
| ethanol <43.2 g/d | 117 (19.9) | 51 (20.6) | 66 (19.3) | |
| ethanol ≥43.2 g/d | 2 (0.3) | 0 (0.0) | 2 (0.6) | |
| Need for financial support, n (%) | 32 (5.4) | 14 (5.7) | 18 (5.3) | 0.831 |
| Polypharmacy (≥5), n (%) | 260 (44.1) | 118 (47.8) | 142 (41.5) | 0.132 |
| Comorbid conditions, mean | 1.5 ± 1.1 | 1.6 ± 1.0 | 1.4 ± 1.1 | 0.093 |
| Diabetes mellitus, n (%) | 198 (33.6) | 83 (33.6) | 115 (33.6) | 0.995 |
| Hypertension, n (%) | 352 (59.8) | 157 (63.6) | 195 (57.0) | 0.110 |
| Dyslipidemia, n (%) | 256 (43.5) | 122 (49.4) | 134 (39.2) | 0.014 |
| Cardiac disease, n (%) | 50 (8.5) | 17 (6.9) | 33 (9.6) | 0.235 |
| Stroke, n (%) | 20 (3.4) | 8 (3.2) | 12 (3.5) | 0.858 |
| ANOVA | ANCOVA | |||||||
|---|---|---|---|---|---|---|---|---|
| Well-Nourished Subjects | Subjects at Risk of/with Malnutrition | F | P | Model 1 a | Model 2 b | |||
| Mean ± SD | Mean ± SD | F | P | F | P | |||
| Verbal aggressiveness/Emotional disinhibition | −0.17 ± 0.74 | 0.12 ± 1.00 | 15.36 | <0.001 | 14.95 | <0.001 | 5.87 | 0.016 |
| Motor aggressiveness | −0.10 ± 0.48 | 0.07 ± 1.11 | 5.00 | 0.026 | 5.31 | 0.022 | 2.82 | 0.094 |
| Behavior disturbance | −0.15 ± 0.62 | 0.11 ± 1.02 | 13.14 | <0.001 | 11.84 | 0.001 | 3.18 | 0.075 |
| Apathy/Memory impairment | −0.22 ± 0.85 | 0.16 ± 0.88 | 27.30 | <0.001 | 25.85 | <0.001 | 15.38 | <0.001 |
| Incontinence | −0.07 ± 0.89 | 0.05 ± 0.86 | 2.67 | 0.103 | 1.74 | 0.187 | 0.55 | 0.458 |
| Sexual disinhibition | −0.00 ± 0.93 | 0.00 ± 0.85 | 0.09 | 0.913 | 0.01 | 0.920 | 0.15 | 0.901 |
© 2019 by the authors. Licensee MDPI, Basel, Switzerland. This article is an open access article distributed under the terms and conditions of the Creative Commons Attribution (CC BY) license (http://creativecommons.org/licenses/by/4.0/).
Share and Cite
Kimura, A.; Sugimoto, T.; Kitamori, K.; Saji, N.; Niida, S.; Toba, K.; Sakurai, T. Malnutrition is Associated with Behavioral and Psychiatric Symptoms of Dementia in Older Women with Mild Cognitive Impairment and Early-Stage Alzheimer’s Disease. Nutrients 2019, 11, 1951. https://0-doi-org.brum.beds.ac.uk/10.3390/nu11081951
Kimura A, Sugimoto T, Kitamori K, Saji N, Niida S, Toba K, Sakurai T. Malnutrition is Associated with Behavioral and Psychiatric Symptoms of Dementia in Older Women with Mild Cognitive Impairment and Early-Stage Alzheimer’s Disease. Nutrients. 2019; 11(8):1951. https://0-doi-org.brum.beds.ac.uk/10.3390/nu11081951
Chicago/Turabian StyleKimura, Ai, Taiki Sugimoto, Kazuya Kitamori, Naoki Saji, Shumpei Niida, Kenji Toba, and Takashi Sakurai. 2019. "Malnutrition is Associated with Behavioral and Psychiatric Symptoms of Dementia in Older Women with Mild Cognitive Impairment and Early-Stage Alzheimer’s Disease" Nutrients 11, no. 8: 1951. https://0-doi-org.brum.beds.ac.uk/10.3390/nu11081951