The Effect of a Low Glycemic Index Pulse-Based Diet on Insulin Sensitivity, Insulin Resistance, Bone Resorption and Cardiovascular Risk Factors during Bed Rest

Abstract
:1. Introduction
2. Methods
2.1. Participants
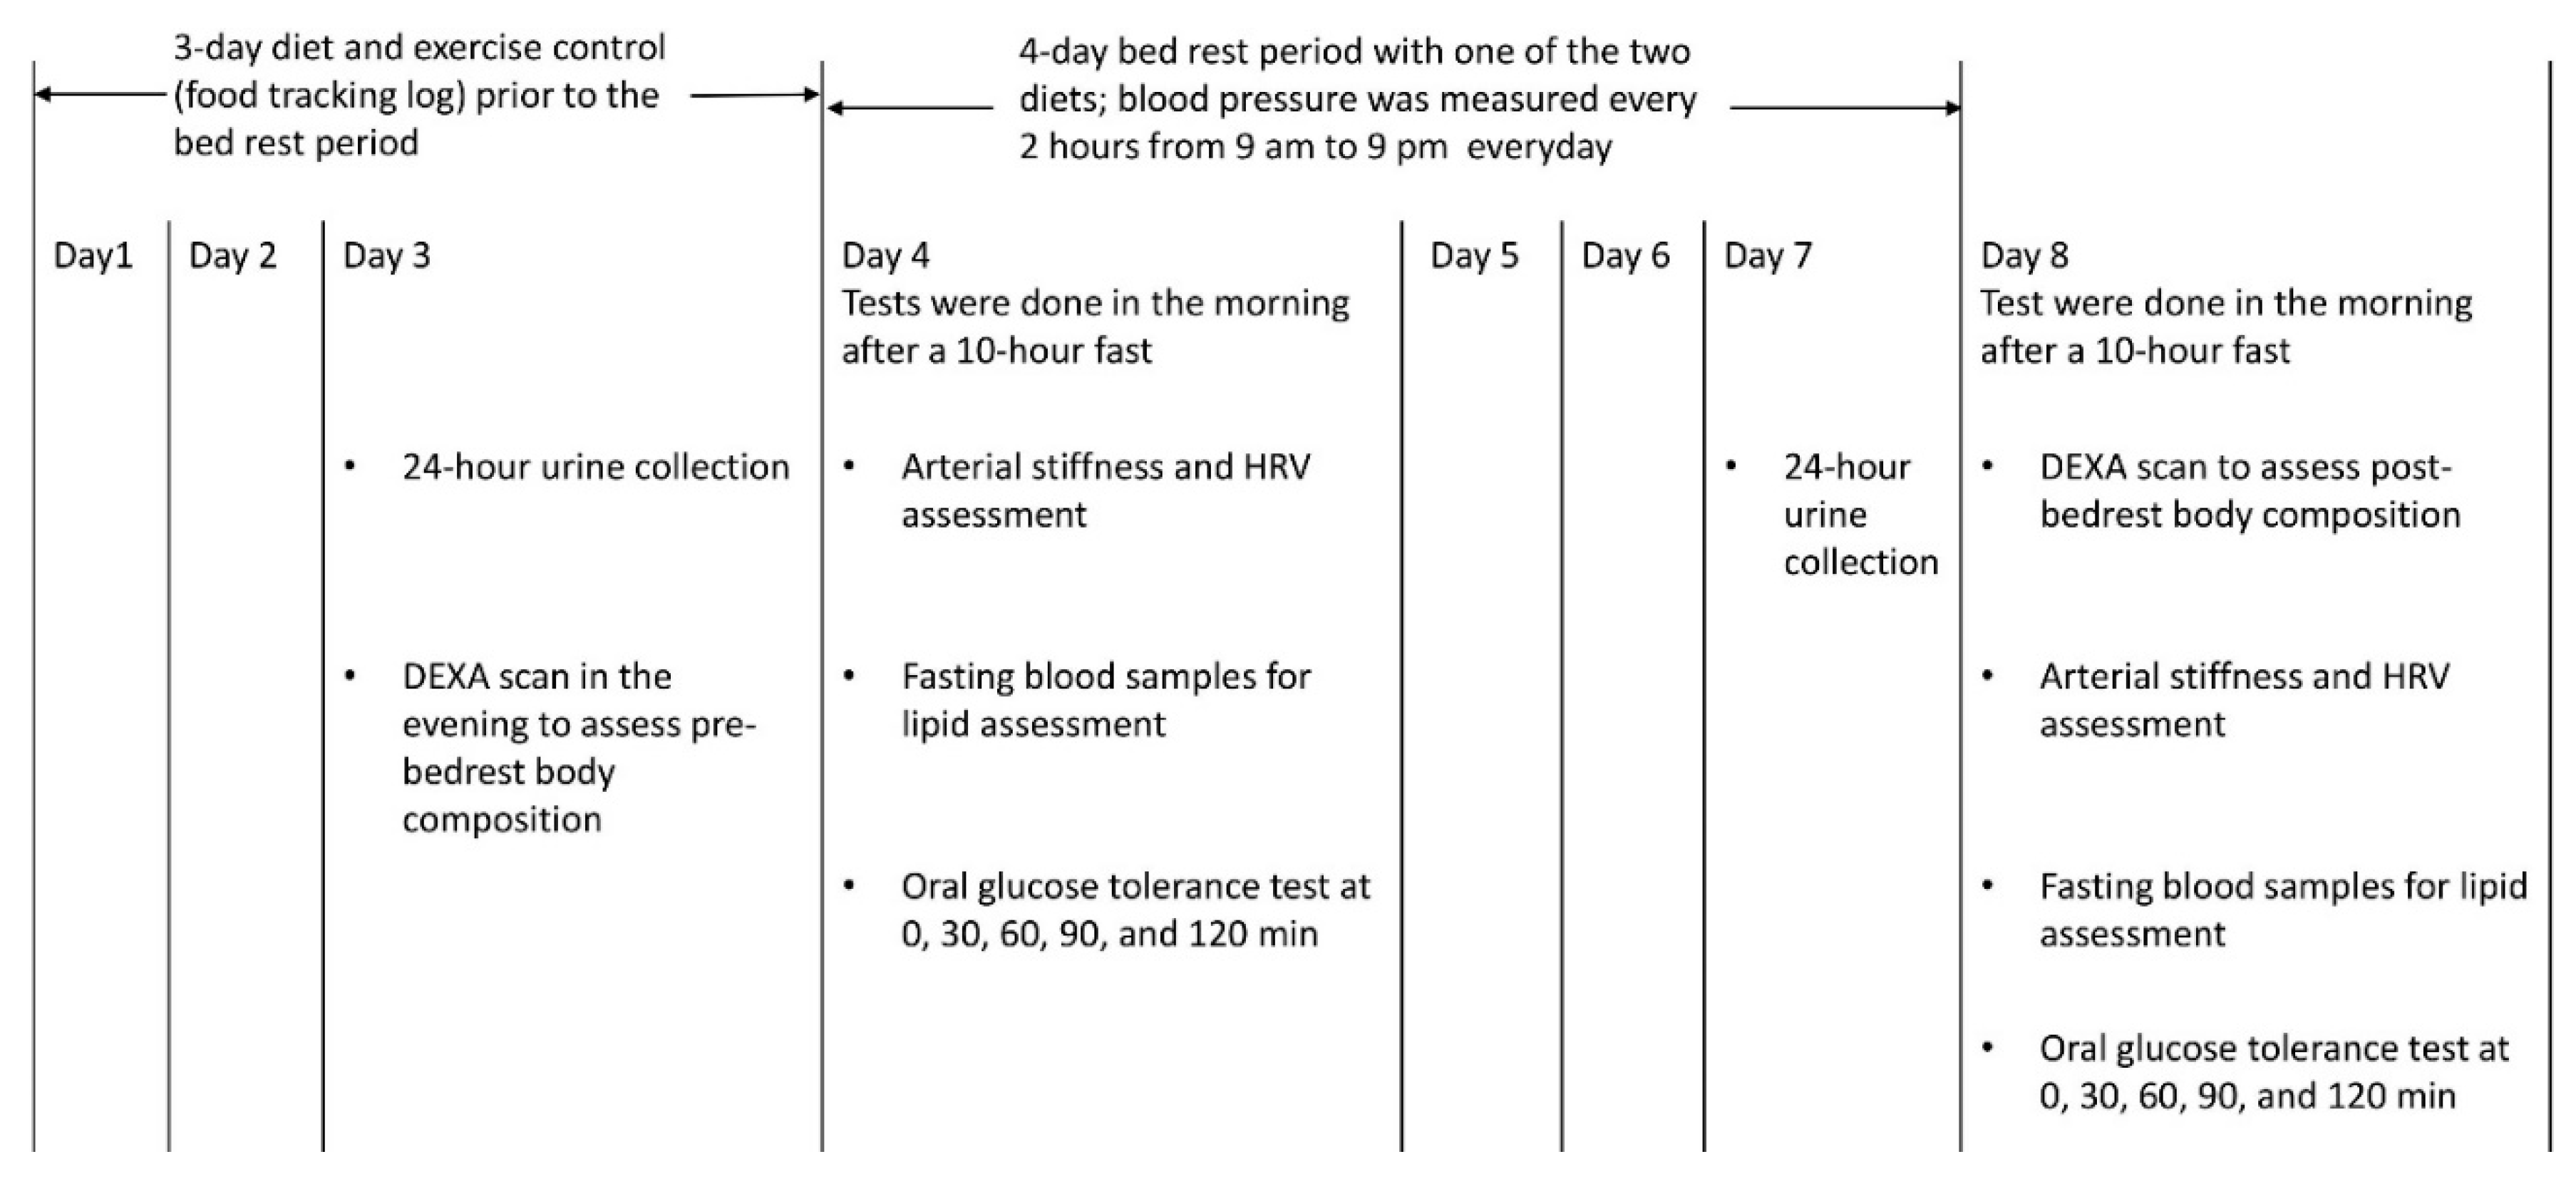
2.2. Study Design
2.3. Measurements
2.4. Diets during Bedrest Period
2.5. Diet and Exercise Control Prior to Bed Rest Period
2.6. Statistical Analyses
3. Results
All Six Participants Tolerated the Bedrest Condition and No Participants Dropped Out
4. Discussion
4.1. Effect of Pulse-Based Diet on Insulin Sensitivity and Insulin Resistance
4.2. Effect of Pulse-Based Diet on Bone Resorption and Body Composition
4.3. Effect of Pulse-Based Diet on CVD Risk Factors
5. Conclusions
Author Contributions
Funding
Conflicts of Interest
References
- Macho, L.; Koska, J.; Ksinantova, L.; Pacak, K.; Hoff, T.; Noskov, V.B.; Grigoriev, A.I.; Vigas, M.; Kvetnansky, R. The response of endocrine system to stress loads during space flight in human subject. Adv. Space Res. 2003, 31, 1605–1610. [Google Scholar] [CrossRef]
- Nosova, E.V.; Yen, P.; Chong, K.C.; Alley, H.F.; Stock, E.O.; Quinn, A.; Hellmann, J.; Conte, M.S.; Owens, C.D.; Spite, M.; et al. Short-Term physical inactivity impairs vascular function. J. Surg. Res. 2014, 190, 672–682. [Google Scholar] [CrossRef] [PubMed]
- Smith, S.M.; Castaneda-Sceppa, C.; O’Brien, K.O.; Abrams, S.A.; Gillman, P.; Brooks, N.E.; Cloutier, G.J.; Heer, M.; Zwart, S.R.; Wastney, M.E. Calcium kinetics during bed rest with artificial gravity and exercise countermeasures. Osteoporos. Int. 2014, 25, 2237–2244. [Google Scholar] [CrossRef] [PubMed] [Green Version]
- Stead, L.G.; Gilmore, R.M.; Bellolio, M.F.; Mishra, S.; Bhagra, A.; Vaidyanathan, L.; Decker, W.W.; Brown, R.D., Jr. Hyperglycemia as an independent predictor of worse outcome in non-Diabetic patients presenting with acute ischemic stroke. Neurocritical care 2009, 10, 181–186. [Google Scholar] [CrossRef] [PubMed]
- Umpierrez, G.E.; Isaacs, S.D.; Bazargan, N.; You, X.; Thaler, L.M.; Kitabchi, A.E. Hyperglycemia: An independent marker of in-Hospital mortality in patients with undiagnosed diabetes. J. Clin. Endocrinol. Metab. 2002, 87, 978–982. [Google Scholar] [CrossRef] [PubMed]
- Pomposelli, J.J.; Baxter, J.K., 3rd; Babineau, T.J.; Pomfret, E.A.; Driscoll, D.F.; Forse, R.A.; Bistrian, B.R. Early postoperative glucose control predicts nosocomial infection rate in diabetic patients. J. Parenter. Enter. Nutr. 1998, 22, 77–81. [Google Scholar] [CrossRef] [PubMed]
- Ahmann, A. Reduction of hospital costs and length of stay by good control of blood glucose levels. Endocr. Pract. 2004, 10, 53–56. [Google Scholar] [CrossRef] [PubMed]
- Estrada, C.A.; Young, J.A.; Nifong, L.W.; Chitwood, W.R., Jr. Outcomes and perioperative hyperglycemia in patients with or without diabetes mellitus undergoing coronary artery bypass grafting. Ann. Thorac. Surg. 2003, 75, 1392–1399. [Google Scholar] [CrossRef]
- Galvan, E.; Arentson-Lantz, E.; Lamon, S.; Paddon-Jones, D. Protecting Skeletal Muscle with Protein and Amino Acid during Periods of Disuse. Nutrients 2016, 8, 404. [Google Scholar] [CrossRef]
- Thalacker-Mercer, A.E.; Drummond, M.J. The importance of dietary protein for muscle health in inactive, hospitalized older adults. Ann. N. Y. Acad. Sci. 2014, 1328, 1–9. [Google Scholar] [CrossRef] [Green Version]
- Newgard, C.B. Interplay between lipids and branched-Chain amino acids in development of insulin resistance. Cell Metab. 2012, 15, 606–614. [Google Scholar] [CrossRef]
- Zwart, S.R.; Davis-Street, J.E.; Paddon-Jones, D.; Ferrando, A.A.; Wolfe, R.R.; Smith, S.M. Amino acid supplementation alters bone metabolism during simulated weightlessness. J. Appl. Physiol. 2005, 99, 134–140. [Google Scholar] [CrossRef]
- Kozakova, M.; Palombo, C. Diabetes Mellitus, Arterial Wall, and Cardiovascular Risk Assessment. Int. J. Environ. Res. Public Health 2016, 13, 201. [Google Scholar] [CrossRef]
- Sievenpiper, J.L.; Kendall, C.W.; Esfahani, A.; Wong, J.M.; Carleton, A.J.; Jiang, H.Y.; Bazinet, R.P.; Vidgen, E.; Jenkins, D.J. Effect of non-Oil-Seed pulses on glycaemic control: A systematic review and meta-Analysis of randomised controlled experimental trials in people with and without diabetes. Diabetologia 2009, 52, 1479–1495. [Google Scholar] [CrossRef]
- Kazemi, M.; McBreairty, L.E.; Chizen, D.R.; Pierson, R.A.; Chilibeck, P.D.; Zello, G.A. A Comparison of a Pulse-Based Diet and the Therapeutic Lifestyle Changes Diet in Combination with Exercise and Health Counselling on the Cardio-Metabolic Risk Profile in Women with Polycystic Ovary Syndrome: A Randomized Controlled Trial. Nutrients 2018, 10, 1387. [Google Scholar] [CrossRef]
- Kaviani, M.; Chilibeck, P.D.; Yee, P.; Zello, G.A. The effect of consuming low-Versus high-Glycemic index meals after exercise on postprandial blood lipid response following a next-Day high-Fat meal. Nutr. Diabetes 2016, 6, 216. [Google Scholar] [CrossRef]
- Kinabo, J.L.; Durnin, J.V. Thermic effect of food in man: Effect of meal composition, and energy content. Br. J. Nutr. 1990, 64, 37–44. [Google Scholar] [CrossRef] [Green Version]
- Chilibeck, P.D.; Vatanparast, H.; Pierson, R.; Case, A.; Olatunbosun, O.; Whiting, S.J.; Beck, T.J.; Pahwa, P.; Biem, H.J. Effect of exercise training combined with isoflavone supplementation on bone and lipids in postmenopausal women: A randomized clinical trial. J. Bone Miner. Res. 2013, 28, 780–793. [Google Scholar] [CrossRef]
- Pinkoski, C.; Chilibeck, P.D.; Candow, D.G.; Esliger, D.; Ewaschuk, J.B.; Facci, M.; Farthing, J.P.; Zello, G.A. The effects of conjugated linoleic acid supplementation during resistance training. Med. Sci Sports Exerc. 2006, 38, 339–348. [Google Scholar] [CrossRef]
- Matthews, D.R.; Hosker, J.P.; Rudenski, A.S.; Naylor, B.A.; Treacher, D.F.; Turner, R.C. Homeostasis model assessment: Insulin resistance and beta-Cell function from fasting plasma glucose and insulin concentrations in man. Diabetologia 1985, 28, 412–419. [Google Scholar] [CrossRef]
- Matsuda, M.; DeFronzo, R.A. Insulin sensitivity indices obtained from oral glucose tolerance testing: Comparison with the euglycemic insulin clamp. Diabetes Care 1999, 22, 1462–1470. [Google Scholar] [CrossRef]
- Laurent, S.; Cockcroft, J.; Van Bortel, L.; Boutouyrie, P.; Giannattasio, C.; Hayoz, D.; Pannier, B.; Vlachopoulos, C.; Wilkinson, I.; Struijker-Boudier, H. Expert consensus document on arterial stiffness: Methodological issues and clinical applications. Eur. Heart J. 2006, 27, 2588–2605. [Google Scholar] [CrossRef]
- Abeysekara, S.; Chilibeck, P.D.; Vatanparast, H.; Zello, G.A. A pulse-Based diet is effective for reducing total and LDL-Cholesterol in older adults. Br. J. Nutr. 2012, 108, 103–110. [Google Scholar] [CrossRef]
- Salt, I.P.; Morrow, V.A.; Brandie, F.M.; Connell, J.M.; Petrie, J.R. High glucose inhibits insulin-Stimulated nitric oxide production without reducing endothelial nitric-Oxide synthase Ser1177 phosphorylation in human aortic endothelial cells. J. Biol. Chem. 2003, 278, 18791–18797. [Google Scholar] [CrossRef]
- Wilcox, G. Insulin and insulin resistance. Clin. Biochem. Rev. 2005, 26, 19–39. [Google Scholar]
- Alberti, K.G.M.M.; Zimmet, P.; DeFronzo, R.A. Insulin secretion in the normal and diabetic human. In International Textbook of Diabetes Mellitus, 2nd ed.; Ferrannini, E., Alberti, G., Zimmet, P., DeFronzo, R.A., Eds.; John Wiley & Sons: New York, NY, USA, 1997; pp. 337–354. [Google Scholar]
- Pi-Sunyer, X. Do glycemic index, glycemic load, and fiber play a role in insulin sensitivity, disposition index, and type 2 diabetes? Diabetes Care 2005, 28, 2978–2979. [Google Scholar] [CrossRef]
- Weickert, M.O.; Roden, M.; Isken, F.; Hoffmann, D.; Nowotny, P.; Osterhoff, M.; Blaut, M.; Alpert, C.; Gogebakan, O.; Bumke-Vogt, C.; et al. Effects of supplemented isoenergetic diets differing in cereal fiber and protein content on insulin sensitivity in overweight humans. Am. J. Clin. Nutr. 2011, 94, 459–471. [Google Scholar] [CrossRef] [Green Version]
- Weickert, M.O.; Pfeiffer, A.F.H. Impact of Dietary Fiber Consumption on Insulin Resistance and the Prevention of Type 2 Diabetes. J. Nutr. 2018, 148, 7–12. [Google Scholar] [CrossRef] [Green Version]
- Dodson, G.; Steiner, D. The role of assembly in insulin’s biosynthesis. Curr. Opin. Struct. Biol. 1998, 8, 189–194. [Google Scholar] [CrossRef]
- Cruz, K.J.; Morais, J.B.; de Oliveira, A.R.; Severo, J.S.; Marreiro, D.D. The Effect of Zinc Supplementation on Insulin Resistance in Obese Subjects: A Systematic Review. Biol. Trace Elem. Res. 2017, 176, 239–243. [Google Scholar] [CrossRef]
- Cruz, K.J.C.; de Oliveira, A.R.S.; Morais, J.B.S.; Severo, J.S.; Mendes, P.M.V.; de Sousa Melo, S.R.; de Sousa, G.S.; Marreiro, D.D.N. Zinc and Insulin Resistance: Biochemical and Molecular Aspects. Biol. Trace Elem. Res. 2018, 186, 407–412. [Google Scholar] [CrossRef]
- Wang, Y.; Lin, M.; Gao, X.; Pedram, P.; Du, J.; Vikram, C.; Gulliver, W.; Zhang, H.; Sun, G. High dietary selenium intake is associated with less insulin resistance in the Newfoundland population. PLoS ONE 2017, 12, 0174149. [Google Scholar] [CrossRef]
- Farrokhian, A.; Bahmani, F.; Taghizadeh, M.; Mirhashemi, S.M.; Aarabi, M.H.; Raygan, F.; Aghadavod, E.; Asemi, Z. Selenium Supplementation Affects Insulin Resistance and Serum hs-CRP in Patients with Type 2 Diabetes and Coronary Heart Disease. Horm. Metab. Res. 2016, 48, 263–268. [Google Scholar] [CrossRef] [Green Version]
- Yadav, C.; Manjrekar, P.A.; Agarwal, A.; Ahmad, A.; Hegde, A.; Srikantiah, R.M. Association of Serum Selenium, Zinc and Magnesium Levels with Glycaemic Indices and Insulin Resistance in Pre-diabetes: A Cross-Sectional Study from South India. Biol. Trace Elem. Res. 2017, 175, 65–71. [Google Scholar] [CrossRef]
- Fonseca-Alaniz, M.H.; Brito, L.C.; Borges-Silva, C.N.; Takada, J.; Andreotti, S.; Lima, F.B. High dietary sodium intake increases white adipose tissue mass and plasma leptin in rats. Obesity 2007, 15, 2200–2208. [Google Scholar] [CrossRef]
- Fonseca-Alaniz, M.H.; Takada, J.; Andreotti, S.; de Campos, T.B.; Campana, A.B.; Borges-Silva, C.N.; Lima, F.B. High sodium intake enhances insulin-Stimulated glucose uptake in rat epididymal adipose tissue. Obesity 2008, 16, 1186–1192. [Google Scholar] [CrossRef]
- Olivares-Reyes, J.A.; Arellano-Plancarte, A.; Castillo-Hernandez, J.R. Angiotensin II and the development of insulin resistance: Implications for diabetes. Mol. Cell. Endocrinol. 2009, 302, 128–139. [Google Scholar] [CrossRef]
- Bosutti, A.; Salanova, M.; Blottner, D.; Buehlmeier, J.; Mulder, E.; Rittweger, J.; Yap, M.H.; Ganse, B.; Degens, H. Whey protein with potassium bicarbonate supplement attenuates the reduction in muscle oxidative capacity during 19 days of bed rest. J. Appl. Physiol. 2016, 121, 838–848. [Google Scholar] [CrossRef] [Green Version]
- Nimni, M.E.; Han, B.; Cordoba, F. Are we getting enough sulfur in our diet? Nutr. Metab. 2007, 4, 24. [Google Scholar] [CrossRef]
- Teucher, B.; Dainty, J.R.; Spinks, C.A.; Majsak-Newman, G.; Berry, D.J.; Hoogewerff, J.A.; Foxall, R.J.; Jakobsen, J.; Cashman, K.D.; Flynn, A.; et al. Sodium and bone health: Impact of moderately high and low salt intakes on calcium metabolism in postmenopausal women. J. Bone Miner. Res. 2008, 23, 1477–1485. [Google Scholar] [CrossRef]
- Breslau, N.A.; McGuire, J.L.; Zerwekh, J.E.; Pak, C.Y. The role of dietary sodium on renal excretion and intestinal absorption of calcium and on vitamin D metabolism. J. Clin. Endocrinol. Metab. 1982, 55, 369–373. [Google Scholar] [CrossRef]
- Pereira, M.A.; O’Reilly, E.; Augustsson, K.; Fraser, G.E.; Goldbourt, U.; Heitmann, B.L.; Hallmans, G.; Knekt, P.; Liu, S.; Pietinen, P.; et al. Dietary fiber and risk of coronary heart disease: A pooled analysis of cohort studies. Arch. Intern. Med. 2004, 164, 370–376. [Google Scholar] [CrossRef]
- Hur, S.J.; Lee, S.Y.; Lee, S.J. Effect of biopolymer encapsulation on the digestibility of lipid and cholesterol oxidation products in beef during in vitro human digestion. Food Chem. 2015, 166, 254–260. [Google Scholar] [CrossRef]
- Den Besten, G.; van Eunen, K.; Groen, A.K.; Venema, K.; Reijngoud, D.J.; Bakker, B.M. The role of short-chain fatty acids in the interplay between diet, gut microbiota, and host energy metabolism. J. Lipid Res. 2013, 54, 2325–2340. [Google Scholar] [CrossRef] [Green Version]
- Fechner, A.; Kiehntopf, M.; Jahreis, G. The formation of short-Chain fatty acids is positively associated with the blood lipid-lowering effect of lupin kernel fiber in moderately hypercholesterolemic adults. J. Nutr. 2014, 144, 599–607. [Google Scholar] [CrossRef]
- Catena, C.; Colussi, G.; Nait, F.; Capobianco, F.; Sechi, L.A. Plasma lipoprotein(a) levels and atherosclerotic renal artery stenosis in hypertensive patients. Kidney Blood Press. Res. 2015, 40, 166–175. [Google Scholar] [CrossRef]
- Voronova, V.; Zhudenkov, K.; Helmlinger, G.; Peskov, K. Interpretation of metabolic memory phenomenon using a physiological systems model: What drives oxidative stress following glucose normalization? PLoS ONE 2017, 12, 0171781. [Google Scholar] [CrossRef]
- Jayalath, V.H.; de Souza, R.J.; Sievenpiper, J.L.; Ha, V.; Chiavaroli, L.; Mirrahimi, A.; Di Buono, M.; Bernstein, A.M.; Leiter, L.A.; Kris-Etherton, P.M.; et al. Effect of dietary pulses on blood pressure: A systematic review and meta-Analysis of controlled feeding trials. Am. J. Hypertens. 2014, 27, 56–64. [Google Scholar] [CrossRef]
- Martinez, R.; Lopez-Jurado, M.; Wanden-Berghe, C.; Sanz-Valero, J.; Porres, J.M.; Kapravelou, G. Beneficial effects of legumes on parameters of the metabolic syndrome: A systematic review of trials in animal models. Br. J. Nutr. 2016, 116, 402–424. [Google Scholar] [CrossRef]
- He, F.J.; Li, J.; Macgregor, G.A. Effect of longer term modest salt reduction on blood pressure: Cochrane systematic review and meta-Analysis of randomised trials. BMJ 2013, 346, 1325. [Google Scholar] [CrossRef]
- Aburto, N.J.; Ziolkovska, A.; Hooper, L.; Elliott, P.; Cappuccio, F.P.; Meerpohl, J.J. Effect of lower sodium intake on health: Systematic review and meta-Analyses. BMJ 2013, 346, f1326. [Google Scholar] [CrossRef]
- Rochfort, S.; Panozzo, J. Phytochemicals for health, the role of pulses. J. Agric. Food Chem. 2007, 55, 7981–7994. [Google Scholar] [CrossRef]
- Gacek, M. Soy and legume seeds as sources of isoflavones: Selected individual determinants of their consumption in a group of perimenopausal women. Prz. Menopauzalny 2014, 13, 27–31. [Google Scholar] [CrossRef]
- Hertog, M.G.; Feskens, E.J.; Hollman, P.C.; Katan, M.B.; Kromhout, D. Dietary antioxidant flavonoids and risk of coronary heart disease: The Zutphen Elderly Study. Lancet 1993, 342, 1007–1011. [Google Scholar] [CrossRef]
- Mudryj, A.N.; Yu, N.; Aukema, H.M. Nutritional and health benefits of pulses. Appl. Physiol. Nutr. Metab. 2014, 39, 1197–1204. [Google Scholar] [CrossRef]
- Belski, R.; Mori, T.A.; Puddey, I.B.; Sipsas, S.; Woodman, R.J.; Ackland, T.R.; Beilin, L.J.; Dove, E.R.; Carlyon, N.B.; Jayaseena, V.; et al. Effects of lupin-Enriched foods on body composition and cardiovascular disease risk factors: A 12-Month randomized controlled weight loss trial. Int. J. Obes. 2011, 35, 810–819. [Google Scholar] [CrossRef]
- Hosseinpour-Niazi, S.; Mirmiran, P.; Hedayati, M.; Azizi, F. Substitution of red meat with legumes in the therapeutic lifestyle change diet based on dietary advice improves cardiometabolic risk factors in overweight type 2 diabetes patients: A cross-Over randomized clinical trial. Eur. J. Clin. Nutr. 2015, 69, 592–597. [Google Scholar] [CrossRef]
- Winham, D.M.; Hutchins, A.M. Baked bean consumption reduces serum cholesterol in hypercholesterolemic adults. Nutr. Res. 2007, 27, 380–386. [Google Scholar] [CrossRef]
- Duane, W.C. Effects of legume consumption on serum cholesterol, biliary lipids, and sterol metabolism in humans. J. Lipid Res. 1997, 38, 1120–1128. [Google Scholar]
- Bazzano, L.A.; Thompson, A.M.; Tees, M.T.; Nguyen, C.H.; Winham, D.M. Non-Soy legume consumption lowers cholesterol levels: A meta-Analysis of randomized controlled trials. Nutr. Metab. Cardiovasc. Dis. 2011, 21, 94–103. [Google Scholar] [CrossRef]
- Finley, J.W.; Burrell, J.B.; Reeves, P.G. Pinto bean consumption changes SCFA profiles in fecal fermentations, bacterial populations of the lower bowel, and lipid profiles in blood of humans. J. Nutr. 2007, 137, 2391–2398. [Google Scholar] [CrossRef]
- Ha, V.; Sievenpiper, J.L.; de Souza, R.J.; Jayalath, V.H.; Mirrahimi, A.; Agarwal, A.; Chiavaroli, L.; Mejia, S.B.; Sacks, F.M.; Di Buono, M.; et al. Effect of dietary pulse intake on established therapeutic lipid targets for cardiovascular risk reduction: A systematic review and meta-analysis of randomized controlled trials. Can. Med. Assoc. J. 2014, 186, E252–E262. [Google Scholar] [CrossRef]
- Brower, R.G. Consequences of bed rest. Crit. Care Med. 2009, 37, 422–428. [Google Scholar] [CrossRef]


| Pulse-Based Diet | Hospital Diet | |
|---|---|---|
| Energy intake (kcal/day) | 1016 ± 311 | 1019 ± 307 |
| Fat (g/day) | 28.3 ± 8.7 | 24.5 ± 11.2 |
| Saturated fat (g/day) | 4.9 ± 1.0 | 5.9 ± 2.3 |
| Carbohydrate (g/day) | 152.1 ± 49.1 | 152.1 ± 41.2 |
| Protein (g/day) | 47.8 ± 13.3 | 45.3 ± 15.0 |
| Fibre (g/day) | 25.9 ± 9.4 * | 6.7 ± 2.3 |
| Sodium (mg) | 730 ± 334 * | 1886 ± 718 |
| Energy intake (% energy) per day for 3 meals | ||
| Breakfast (% energy) | 20.8 ± 10.7 | 20.8 ± 10.6 |
| Lunch (% energy) | 40.7 ± 19.3 | 42.6 ± 17.7 |
| Dinner (% energy) | 38.5 ± 13.5 | 36.6 ± 10.9 |
| Hospital Diet | Pulse Diet | |||||
|---|---|---|---|---|---|---|
| Pre-Bedrest | Post-Bedrest | Change | Pre-Bedrest | Post-Bedrest | Change | |
| OGTT | ||||||
| Glucose I-AUC (mmol L−1 h) * | 218 ± 58 | 308 ± 57 | 90 ± 52 | 230 ± 102 | 358 ± 102 | 127 ± 196 |
| Glucose T-AUC (mmol L−1 h) * | 693 ± 77 | 761 ± 77 | 68 ± 39 | 680 ± 109 | 774 ± 66 | 95 ± 123 |
| Insulin I-AUC (mU L−1 h) | 4702 ± 801 | 5095 ± 2060 | 393 ± 1408 | 3725 ± 1625 | 4086 ± 1203 | 362 ± 636 |
| Insulin T-AUC (mU L−1 h) | 5627 ± 905 | 6070 ± 2253 | 443 ± 1438 | 4781 ± 1734 | 4775 ± 1477 | −6.2 ± 458 |
| HOMA-IR * | 1.38 ± 0.54 | 1.37 ± 0.50 | −0.01 ± 0.24 | 1.48 ± 0.54 | 0.88 ± 0.37 | −0.59 ± 0.42 a |
| Matsuda Index | 6.54 ± 1.94 | 6.39 ± 2.71 | −0.14 ± 1.10 | 7.14 ± 2.36 | 8.75 ± 3.13 | 1.61 ± 1.49 a |
| Bone resorption | ||||||
| Ntx level (Nm BCE) × 103 * | 262 ± 175 | 430 ± 222 | 168 ± 66 | 265 ± 75 | 361 ± 136 | 96 ± 65 a |
| Ntx/lean mass (Nm BCE/g) * | 6.2 ± 3.6 | 10.8 ± 4.5 | 4.6 ± 1.6 | 6.6 ± 1.7 | 9.2 ± 2.9 | 2.6 ± 1.6 a |
| Ntx/crt (Nm BCE/mg/mL) | 4611 ± 4789 | 3845 ± 1790 | −766 ± 3285 | 2258 ± 1636 | 3646 ± 2311 | 1388 ± 909 |
| Blood lipids | ||||||
| Triglyceride (mmol/L) | 0.7 ± 0.3 | 0.7 ± 0.4 | 0.0 ± 0.3 | 0.6 ± 0.3 | 0.6 ± 0.3 | 0.0 ± 0.3 |
| Total cholesterol (mmol/L) | 4.0 ± 0.7 | 4.2 ± 0.6 | 0.2 ± 0.4 | 4.1 ± 0.8 | 4.2 ± 0.9 | 0.1 ± 0.6 |
| HDL (mmol/L) | 1.6 ± 0.4 | 1.5 ± 0.4 | −0.1 ± 0.3 | 1.6 ± 0.3 | 1.6 ± 0.5 | 0.0 ± 0.3 |
| LDL and VLDL (mmol/L) | 2.7 ± 0.7 | 3.1 ± 1.1 | 0.4 ± 0.6 | 2.9 ± 0.8 | 2.8 ± 1.1 | −0.1 ± 0.8 |
| Body composition | ||||||
| BMC (g) | 2084 ± 561 | 2029 ± 498 | −55 ± 120 | 1987 ± 458 | 2024 ± 528 | 37 ± 90 |
| Fat mass (kg) | 17.0 ± 10.1 | 17.0 ± 10.0 | 0 ± 0.4 | 16.8 ± 9.6 | 16.8 ± 9.5 | 0 ± 0.3 |
| Lean mass (kg) * | 40.9 ± 11.1 | 39.2 ± 10.6 | −1.7 ± 0.9 | 41.1 ± 11.8 | 39.7 ± 11.8 | −1.4 ± 0.9 |
| Lean + BMC (kg) * | 43.0 ± 11.6 | 41.3 ± 11.1 | −1.8 ± 0.9 | 43.1 ± 12.3 | 41.7 ± 12.4 | −1.4 ± 0.8 |
| Total mass (kg) * | 60.0 ± 15.8 | 58.3 ± 15.2 | −1.7 ± 0.8 | 59.9 ± 15.5 | 58.5 ± 15.4 | −1.4 ± 0.7 |
| % fat * | 27.7 ± 10.9 | 28.6 ± 11.3 | 0.9 ± 1.0 | 27.8 ± 11.2 | 28.5 ± 11.6 | 0.7 ± 0.8 |
| BMD (g/cm2) | 1.12 ± 0.11 | 1.09 ± 0.09 | −0.03 ± 0.04 | 1.09 ± 0.08 | 1.10 ± 0.09 | 0.01 ± 0.02 |
| Trunk fat mass (kg) | 7.5 ± 5.2 | 7.7 ± 4.6 | 0.1 ± 0.9 | 7.4 ± 4.7 | 7.5 ± 4.5 | 0.1 ± 5.7 |
| Spine BMC (g) | 47.9 ± 12.7 | 48.3 ± 13.3 | 0.3 ± 1.6 | 47.8 ± 12.3 | 48.0 ± 13.3 | 0.2 ± 1.9 |
| Spine BMD (g/cm2) | 0.89 ± 0.10 | 0.89 ± 0.10 | 0.0 ± 0.03 | 0.89 ± 0.10 | 0.90 ± 0.17 | 0.0 ± 0.01 |
| Total hip BMC (g) | 32.6 ± 12.9 | 33.1 ± 12.5 | 0.5 ± 1.7 | 31.6 ± 11.8 | 32.2 ± 12.3 | 0.7 ± 0.8 |
| Total hip BMD (g/cm2) * | 0.94 ± 0.19 | 0.95 ± 0.18 | 0.01 ± 0.02 | 0.93 ± 0.19 | 0.94 ± 0.19 | 0.02 ± 0.01 |
| Femoral neck BMC (g) | 3.7 ± 1.0 | 3.9 ± 1.2 | 0.2 ± 0.2 | 3.8 ± 1.2 | 3.9 ± 1.2 | 0.10 ± 0.2 |
| Femoral neck BMD (g/cm2) | 0.76 ± 0.16 | 0.77 ± 0.18 | 0.01 ± 0.03 | 0.76 ± 0.19 | 0.78 ± 0.17 | 0.02 ± 0.02 |
| Arterial stiffness and HRV | ||||||
| Pulse wave velocity (m/s) | 9.4 ± 1.6 | 9.2 ± 1.6 | −0.2 ± 2.2 | 9.9 ± 2.8 | 9.2 ± 2.0 | −0.7 ± 1.5 |
| SDRR (ms) | 55 ± 34 | 53 ± 31 | −2 ± 9 | 49 ± 32 | 40 ± 31 | −9 ± 9 |
| Heart rate (beats/min) | 69 ± 13 | 66 ± 10 | −3 ± 7 | 67 ± 13 | 67 ± 13 | 0 ± 5 |
| SDSD (ms) | 47 ± 32 | 34 ± 14 | −13 ± 21 | 40 ± 30 | 30 ± 9 | −10 ± 25 |
| RMSSD (ms) | 47 ± 32 | 34 ± 14 | −13 ± 21 | 40 ± 30 | 30 ± 9 | −10 ± 25 |
| Prr50 (%) | 17 ± 18 | 14 ± 13 | −3 ± 11 | 18 ± 19 | 10 ± 9 | −7 ± 12 |
| LF Power (%) | 31 ± 23 | 24 ± 7 | −7 ± 22 | 34 ± 12 | 24 ± 11 | −10 ± 12 |
| LF Power (nu) | 50 ± 36 | 56 ± 20 | 6 ± 24 | 56 ± 23 | 45 ± 17 | −11 ± 19 |
| HF Power (%) | 38 ± 31 | 22 ± 14 | −15 ± 26 | 29 ± 17 | 29 ± 12 | 0 ± 15 |
| HF Power (nu) | 48 ± 33 | 45 ± 19 | −3 ± 22 | 44 ± 22 | 55 ± 17 | 11 ± 19 |
| LF/HF * | 2.6 ± 2.9 | 1.8 ± 1.7 | −0.8 ± 1.6 | 2.0 ± 1.9 | 1.1 ± 1.0 | −1.0 ± 1.3 |
| Systolic Blood Pressure (mmHg) | Diastolic Blood Pressure (mmHg) | |||
|---|---|---|---|---|
| Hospital Diet | Pulse Diet | Hospital Diet | Pulse Diet | |
| Day 1 | 103 ± 10 | 102 ± 13 | 65 ± 5 | 64 ± 7 |
| Day 2 | 103 ± 9 | 102 ± 11 | 64 ± 7 | 65 ± 6 |
| Day 3 | 104 ± 10 | 97 ± 16 | 66 ± 7 | 61 ± 9 * |
| Day 4 | 103 ± 11 | 100 ± 15 | 65 ± 7 | 63 ± 10 |
© 2019 by the authors. Licensee MDPI, Basel, Switzerland. This article is an open access article distributed under the terms and conditions of the Creative Commons Attribution (CC BY) license (http://creativecommons.org/licenses/by/4.0/).
Share and Cite
Gao, R.; Duff, W.; Chizen, D.; Zello, G.A.; Chilibeck, P.D. The Effect of a Low Glycemic Index Pulse-Based Diet on Insulin Sensitivity, Insulin Resistance, Bone Resorption and Cardiovascular Risk Factors during Bed Rest. Nutrients 2019, 11, 2012. https://0-doi-org.brum.beds.ac.uk/10.3390/nu11092012
Gao R, Duff W, Chizen D, Zello GA, Chilibeck PD. The Effect of a Low Glycemic Index Pulse-Based Diet on Insulin Sensitivity, Insulin Resistance, Bone Resorption and Cardiovascular Risk Factors during Bed Rest. Nutrients. 2019; 11(9):2012. https://0-doi-org.brum.beds.ac.uk/10.3390/nu11092012
Chicago/Turabian StyleGao, Ruirui, Whitney Duff, Donna Chizen, Gordon A. Zello, and Philip D. Chilibeck. 2019. "The Effect of a Low Glycemic Index Pulse-Based Diet on Insulin Sensitivity, Insulin Resistance, Bone Resorption and Cardiovascular Risk Factors during Bed Rest" Nutrients 11, no. 9: 2012. https://0-doi-org.brum.beds.ac.uk/10.3390/nu11092012