Article

Impact of the Apolipoprotein E (epsilon) Genotype on Cardiometabolic Risk Markers and Responsiveness to Acute and Chronic Dietary Fat Manipulation

by
Kumari M. Rathnayake
1,2,
Michelle Weech
1,
Kim G. Jackson
1 and
Julie A. Lovegrove
1,*
1
Hugh Sinclair Unit of Human Nutrition, Department of Food & Nutritional Sciences and Institute for Cardiovascular and Metabolic Research and Institute for Food, Nutrition and Health, University of Reading, Whiteknights, P.O. Box 226, Reading RG6 6AP, UK
2
Department of Applied Nutrition, Faculty of Livestock, Fisheries and Nutrition, Wayamba University of Sri Lanka, Makandura 60170, Sri Lanka
*
Author to whom correspondence should be addressed.
Nutrients 2019, 11(9), 2044; https://doi.org/10.3390/nu11092044
Submission received: 22 July 2019 / Revised: 19 August 2019 / Accepted: 20 August 2019 / Published: 1 September 2019
(This article belongs to the Special Issue Nutrient Gene Interactions)

Abstract

:
Apolipoprotein (APO) E (ε) genotype is considered to play an important role in lipid responses to dietary fat manipulation but the impact on novel cardiometabolic risk markers is unclear. To address this knowledge gap, we investigated the relationship between the APOE genotype and cardiometabolic risk markers in response to acute and chronic dietary fat intakes. Associations with fasting (baseline) outcome measures (n = 218) were determined using data from the chronic DIVAS (n = 191/195 adults at moderate cardiovascular disease risk) and acute DIVAS-2 (n = 27/32 postmenopausal women) studies examining the effects of diets/meals varying in saturated, polyunsaturated and monounsaturated (MUFA) fatty acid composition. Participants were retrospectively genotyped for APOE (rs429358, rs7412). For baseline cardiometabolic outcomes, E4 carriers had higher fasting total and low-density lipoprotein-cholesterol (LDL-C), total cholesterol: high-density lipoprotein-cholesterol (HDL-C) and LDL-C: HDL-C ratios, but lower C-reactive protein (CRP) than E3/E3 and E2 carriers (p ≤ 0.003). Digital volume pulse stiffness index was higher in E2 carriers than the E3/E3 group (p = 0.011). Following chronic dietary fat intake, the significant diet × genotype interaction was found for fasting triacylglycerol (p = 0.010), with indication of a differential responsiveness to MUFA intake between the E3/E3 and E4 carriers (p = 0.006). Test fat × genotype interactions were observed for the incremental area under the curve for the postprandial apolipoprotein B (apoB; p = 0.022) and digital volume pulse reflection index (DVP-RI; p = 0.030) responses after the MUFA-rich meals, with a reduction in E4 carriers and increase in the E3/E3 group for the apoB response, but an increase in E4 carriers and decrease in the E3/E3 group for the DVP-RI response. In conclusion, baseline associations between the APOE genotype and fasting lipids and CRP confirm previous findings, although a novel interaction with digital volume pulse arterial stiffness was observed in the fasted state and differential postprandial apoB and DVP-RI responses after the MUFA-rich meals. The reported differential impact of the APOE genotype on cardiometabolic markers in the acute and chronic state requires confirmation.

1. Introduction

The apolipoprotein (APO) E (ε) genotype is the most widely researched single nucleotide polymorphism in relation to cardiovascular disease (CVD) risk, with the APOE4 allele linked with increased total cholesterol (TC) and low-density lipoprotein cholesterol (LDL-C), CVD risk and mortality [1,2,3,4,5]. The APOE genotype has also been reported to influence the fasting lipid profile in response to dietary fat intake. Studies to date have focused on high-fat, high saturated fatty acid (SFA), low-fat and high-fat, high-SFA with fish oil interventions [6,7,8,9,10,11,12], whilst little is known of the interactions between the APOE genotype with n-6 polyunsaturated (PUFA) and monounsaturated (MUFA) fatty acid intakes. This is particularly important and timely given that population dietary recommendations for CVD prevention advise the reduction of SFA intakes to ≤10% of total energy (%TE) via replacement with n-6 PUFA or MUFA. Although fasting lipids contribute to the increased CVD risk they do not seem to solely explain this increased risk in APOE4 carriers, with limited information available on other cardiometabolic risk markers. In particular, endothelial dysfunction is now recognised as a key modifiable event in coronary atherosclerosis, but limited data are available on the impact of APOE on the responsiveness of vascular reactivity to dietary fat composition [13].
Most of the studies investigating the interaction between the APOE genotype with dietary fat intake on lipid metabolism have been performed in the fasted state. However, postprandial lipaemia is now recognised as an independent CVD risk factor [14,15,16], which is particularly relevant given that individuals are in the fed state for the majority of the day. Previous studies have reported polymorphisms in the APOE gene to be associated with increased postprandial triacylglycerol (TAG) responses [17,18,19]. The Reading, Imperial, Surrey, Cambridge and Kings (RISCK) study reported differential effects on the lipid response when SFA was replaced with MUFA and low glycaemic index carbohydrates after a 24-week dietary intervention with variations in the APOE genotype [20]. However, data is extremely limited on the impact of meal fatty acids on postprandial lipid and vascular outcomes according to the APOE genotype.
The present analysis explored the interaction of the APOE genotype with both chronic and acute intake of diets/meals rich in SFA, MUFA or n-6 PUFA on established and novel cardiometabolic risk markers. This was achieved using data form the chronic Dietary Intervention and Vascular Function (DIVAS) study performed in 195 individuals with moderate CVD risk [21], and the DIVAS-2 postprandial study conducted in 32 postmenopausal women. We hypothesised that the APOE genotype would influence these risk markers both at baseline and in response to fat manipulation. The overall diet/meal fat effects for both studies will not be the focus of the current manuscript as these data have been previously reported for each subject group [21,22].

2. Methods

2.1. Study Participants and Design

This paper was based on a retrospective APOE genotype analysis and previously analysed cardiometabolic risk markers in participants from two studies (DIVAS and DIVAS-2) performed at the Hugh Sinclair Unit of Human Nutrition (University of Reading, Reading, UK). The details of the chronic DIVAS and acute DIVAS-2 studies have been previously published [21,22]. Only participants who had provided informed consent for the retrospective genotyping for APOE were included in this data analysis (n = 191 out of 195 participants for DIVAS and n = 27 out of 32 for DIVAS-2). Furthermore, five women had participated in both the DIVAS and DIVAS-2 studies, so only baseline data from the DIVAS study for these participants were included. Both studies were conducted in accordance with the Declaration of Helsinki.

2.2. Baseline Associations Between APOE Genotype with Established and Novel Cardiometabolic Risk Markers

Baseline data (n = 218) from both the DIVAS (n = 84 men and n = 107 women) [21] and DIVAS-2 (n = 27 postmenopausal women) [21,22] studies were combined to investigate the impact of APOE genotype on vascular function, blood pressure, biomarkers of endothelial dysfunction, lipids, glucose, insulin and inflammatory markers determined in the fasting state. Habitual dietary intake according to the APOE genotype was assessed using data extracted from 4-day weighed food diaries and analysed using Dietplan (DIVAS: version 6.6; DIVAS-2: version 7; Forestfield, Horsham, UK).

2.3. Impact of the APOE Genotype on the Responsiveness of Cardiometabolic Risk Markers

2.3.1. Chronic Dietary Fat Composition

The DIVAS study was a single-blind, parallel-group randomised controlled trial that replaced 9.5–9.6 %TE of dietary SFA with MUFA or n-6 PUFA for 16 weeks. Non-smoking women and men (n = 191) aged 21–60 y identified as having moderate CVD risk were recruited in three cohorts from November 2009 to June 2012 [23]. Participants were randomly assigned to follow one of three intervention diets, stratified by sex, age, body mass index (BMI) and CVD risk score. The isoenergetic diets (target compositions of total fat:SFA:MUFA:n-6 PUFA as %TE) were rich in SFA (36:17:11:4), MUFA (36:9:19:4) or n-6 PUFA (36:9:13:10), and were matched for protein, carbohydrate and n-3 PUFA [23]. A flexible food-exchange model replaced sources of exchangeable fats in the diet with intervention foods that had a specific fatty acid composition, which included oils, spreads, snacks, and dairy products. Primary sources of exchangeable fats were: Butter (SFA-rich diet; Wyke Farms, Somerset, UK); refined olive oil and MUFA-rich spread (MUFA-rich diet; Unilever R&D, Vlaardingen B.V, Netherlands); safflower oil and n-6 PUFA-rich spread (n-6 PUFA-rich diet; Unilever R&D Vlaardingen B.V, Netherlands). At baseline (week 0) and after the intervention period (week 16), macro-vascular reactivity was assessed by conducting flow mediated dilatation (FMD) of the brachial artery and a fasted blood sample was taken, as previously described [21]. This study was approved for conduct by the West Berkshire Local Research Ethics Committee (09/H0505/56) and the Research Ethics Committee at the University of Reading (project reference number 09/40), and registered as a clinical trial at www.clinicaltrials.gov (NCT01478958).

2.3.2. Acute Meal Fat Composition

The DIVAS-2 study was an acute, double-blind, randomised, cross-over study conducted between June 2014 and September 2015. Postmenopausal women (n = 32) were randomly assigned to consume sequential mixed test meals (0 min, 50 g fat and 330 min, 30 g fat) that were rich in SFA, MUFA or n-6 PUFA on three different occasions that were 4–6 weeks apart. Test fats included butter (SFA meal), refined olive oil and MUFA-rich spread (MUFA meal), and safflower oil and n-6 PUFA-rich spreads (n-6 PUFA meal). Details of the test meal fat composition and study procedures are given elsewhere [22]. Blood samples were collected regularly (every 30 min until 180 min, followed by every 60 min until 300 min) after breakfast until the participant was provided with lunch at 330 min. Blood samples were then collected at 30 min intervals until 420 min, with the last sample being taken at 480 min. In this study, FMD was performed at baseline (fasting), 180, 300 and 420 min, and clinic blood pressure, laser Doppler imaging (LDI) with iontophoresis and digital volume pulse (DVP) at baseline, 240 and 450 min. This study was approved for conduct by the Research Ethics Committee at the University of Reading (project reference number 14/16) and was registered at www.clinicaltrials.gov (NCT02144454).

2.4. Vascular Reactivity Measurements and Blood Pressure

For both DIVAS and DIVAS-2 studies, macro- and micro-vascular reactivity were assessed by conducting FMD of the brachial artery (primary outcome measure) and LDI with iontophoresis, respectively [24]. In the peripheral arteries, DVP (Pulse Trace PCA2; Micro Medical Ltd., Chatham, UK) assessed arterial stiffness and vascular tone by measuring the stiffness index (DVP-SI; m/s) and reflection index (DVP-RI; %), respectively [24]. In DIVAS, 24 h ambulatory blood pressure (ABP) and heart rate measurements were taken at 30 min intervals throughout the day and 60 min intervals during the night at baseline and week 16 using A/A grade automated oscillometric ABP monitors (A & D Instruments Ltd., Abingdon, UK) as described elsewhere [21]. In DIVAS and DIVAS-2, clinic measurements of systolic blood pressure (SBP), diastolic blood pressure (DBP) and heart rate were recorded at each study visit using an OMRON blood pressure monitor (OMRON Healthcare UK Ltd., Milton Keynes, UK). The difference between the average systolic and diastolic blood pressures was used to determine pulse pressure.

2.5. Biochemical Analysis, Estimates of Insulin Sensitivity/Resistance and CVD Risk Score

Serum samples from both studies were used to determine lipids (TC, high density lipoprotein-cholesterol (HDL-C), TAG, apolipoprotein (apo)B (DIVAS-2 only)), glucose, C-reactive protein (CRP) and non-esterified fatty acids (NEFA) using an ILAB600 clinical autoanalyzer (reagents and analyser: Werfen, UK, Warrington UK.; NEFA reagent: Alpha Laboratories, Eastleigh, UK; apoB reagent: Randox Laboratories Ltd., Crumlin, UK). The Friedewald formula was used to estimate fasting concentrations of LDL-C [25]. The use of commercial ELISA kits determined concentrations of serum insulin (Dako UK Ltd.; Ely, UK), and plasma concentrations of soluble intercellular adhesion molecule-1 (sICAM-1), soluble vascular cell adhesion molecule (sVCAM-1), P-selectin and E-selectin (R & D Systems, Biotechne, Abingdon, UK). Plasma nitrite and nitrate levels were analysed with ozone-based chemiluminescence [26] in the DIVAS study and Eicom NOx Analyser ENO-30 (Eicom; San Diego, CA, USA) [27], which is a HPLC-based approach, was used in the DIVAS-2 study.
Using baseline measures, standard equations were used to calculate the homeostatic model assessment-insulin resistance (HOMA-IR) and the revised quantitative insulin sensitivity check index (rQUICKI) as measures of insulin resistance and insulin sensitivity, respectively [28]. Estimation of 10 y CVD risk was determined using the QRISK®2-2016 online risk calculator (https://qrisk.org/2017/).

2.6. DNA Extraction and Genotyping

The buffy coat was isolated from 9 mL of blood collected into K2EDTA blood collection tube, and DNA was extracted using the Qiagen DNA Blood Mini Kit (Qiagen Ltd., Crawley, UK). APOE genotype (E2/E4, E2/E3, E2/E2, E3/E3, E3/E4 or E4/E4) was determined retrospectively by allelic discrimination using “Assay-on-Demand” single nucleotide polymorphism genotyping assays (rs7412 and rs429358; Life Technologies, Paisley, UK).

2.7. Statistical Analysis

The DIVAS and DIVAS-2 studies were powered to detect a 2% (SD 2.3%, 80% power and 5% significance level) and 1.5% (SD 2.0%, 80% power and 5% significance level) difference in %FMD response (primary outcome), requiring 171 and 28 participants, respectively. Secondary outcome measures in both studies included arterial stiffness, microvascular reactivity, blood pressure, serum lipid profile, circulating markers of endothelial activation and inflammation and estimates of insulin sensitivity/resistance. The analysis presented in this manuscript is explorative, investigating the interactions between APOE genotype with fat manipulation on the primary and secondary outcome measures.
Data analysis was performed using the statistical analysis software SPSS, version 21 (SPSS Inc., Chicago, IL, USA). Results are presented in the text, tables and figure as means ± SEMs. p ≤ 0.05 was considered significant. Data were checked for normality of distribution, and skewed variables were normalized prior to statistical analysis. For the baseline data analysis, which included data from both the DIVAS and DIVAS-2 studies, a univariate general linear model (analysis of covariance—ANCOVA) was implemented using the baseline outcome measures as the dependent variables, with sex and the APOE genotype included as fixed factors and age and BMI as covariates, to assess the APOE genotype effect. If a significant genotype effect was observed, pairwise comparisons were carried out. These included a Bonferroni correction in which p ≤ 0.017 was considered significant.
To determine the effects of chronic dietary fat manipulation (DIVAS), a general linear model (ANCOVA) was used to determine the overall effect of diet and the APOE genotype on the primary and secondary outcome measures. In this model, the post-intervention (week 16)—baseline (week 0) difference was the dependent variable, with the genotype, sex and intervention diet as fixed factors, and baseline value of the variable of interest, age and BMI included as covariates. The interaction term was included in the model to assess the overall diet × APOE genotype interaction. If a significant interaction was found, a general linear model was performed for the three diets to determine which diets were different within each genotype group separately. When there was no overall diet effect for each genotype group, independent t-tests were performed for the three diet groups separately to identify whether there were any differences between the genotype groups.
Acute effects of test fat composition (DIVAS-2) on the time response profiles were analysed using a mixed factor repeated measures ANOVA with test fat and time included as within-subject factors and genotype as the between-group factor. Postprandial response summary measures were expressed as area and incremental area under the curve (AUC and IAUC, respectively) over 420, 450 or 480 min. The IAUC denotes the specific response to the test meals irrespective of baseline concentrations. For NEFA, AUC and IAUC were computed from the mean time of suppression until the final postprandial time point (120–480 min). Non-parametric one-way repeated measures ANOVA was used for the statistical analysis of IAUC with negative values and for any data that was not normalized following transformation. If a significant test fat × genotype interaction was found, a repeated measures ANOVA was performed in the two genotype groups separately, with a Bonferroni correction (where p ≤ 0.017 was considered significant). An independent t-test compared the responses to the different test fats between genotype groups, where values p ≤ 0.05 were significant.

3. Results

3.1. Baseline Associations between the APOE Genotype with Established and Novel Cardiometabolic Risk Markers

Table 1 presents the baseline subject characteristics and cardiometabolic risk markers of the 216 participants (84 males and 132 females (self-reported menopausal status: 66 pre-, 8 peri- and 58 postmenopausal women)) according to the APOE genotype, which were presented as E2 carriers (E2/E2 and E2/E3, n = 30), the wild-type homozygous E3/E3 group (n = 128) and E4 carriers (E3/E4 and E4/E4, n = 58). Individuals with the E2/E4 genotype were excluded from all data analyses due to the small subject group (n = 2).
At baseline, there was no significant effect of genotype on the %FMD response (primary outcome). For TC (p = 0.0001), LDL-C (p = 0.0001), TC:HDL-C ratio (p = 0.002) and LDL-C:HDL-C ratio (p = 0.0001), a significant genotype effect was evident with lipid concentrations and ratios increasing in the order: E2 carriers > E3/E3 group > E4 carriers (Table 1). There was also an influence of genotype on baseline CRP (p = 0.002), with lower concentrations in E4 carriers compared with the wild-type group (p = 0.003) and E2 carriers (p = 0.002). DVP-SI was found to be different between genotype groups (p = 0.027), with a 17% higher DVP-SI in the E2 carriers than the E3/E3 group (p = 0.011). The APOE genotype did not influence any of the other baseline characteristics or cardiometabolic risk markers (Table 1). Habitual dietary intakes stratified according to the genotype (Table S1) showed differences in %TE of trans fatty acids (p = 0.031), whereby intakes were greater in the E2 carriers than E3/E3 group (p = 0.043). However, this difference was not significant after correcting for multiple comparisons (p ≥ 0.017).

3.2. Effect of Dietary Fat Manipulation and the APOE Genotype on Cardiometabolic Risk Markers

Since low numbers of E2 carriers (E2/E2 and E2/E3) were identified by retrospective genotyping, they were excluded from the datasets for the (i) chronic (n = 27, SFA diet (n = 12), MUFA diet (n = 5) and n-6 PUFA diet (n = 10)) and (ii) acute (n = 3, E2/E3) fat manipulations.

3.2.1. Chronic Dietary Fat Composition (DIVAS)

In this analysis, a total of 159 subjects (n = 68 men and 91 women) were included with a mean age of 44 ± 1 y and mean BMI of 26.4 ± 0.3 kg/m2, of which 107 had the E3/E3 genotype and 52 were E4 carriers. E2 carriers (n = 32) were excluded from this analysis due to relatively small numbers within each dietary intervention group (Table 2). No diet × genotype interaction was evident for the change in the primary outcome, %FMD response, or other measures of vascular function during the 16-wk chronic intervention. A significant diet × genotype interaction was found for the change in fasting TAG (p = 0.010) but there was no overall diet effect when the APOE3/E3 and E4 carrier groups were analysed separately. However, there was an indication of a differential responsiveness of fasting TAG to MUFA intake (but not SFA and n-6 PUFA) with an increase and decrease in TAG concentration in the E3/E3 and E4 carriers, respectively (p = 0.006; Table 2). APOE genotype was not found to influence any of the other secondary outcome measures in response to chronic dietary fat intake.
Independent of the 16-wk dietary intervention, genotype effects were observed for the changes from baseline for HDL-C (p = 0.015), CRP (p = 0.036), as well as P-selectin (p = 0.026; Table 2) where there was a reduction in HDL-C and CRP in the E4 carriers as opposed to an increase in the E3/E3 group, and an increase in P-selectin in the E4 carriers relative to the decrease observed in the E3/E3 group.

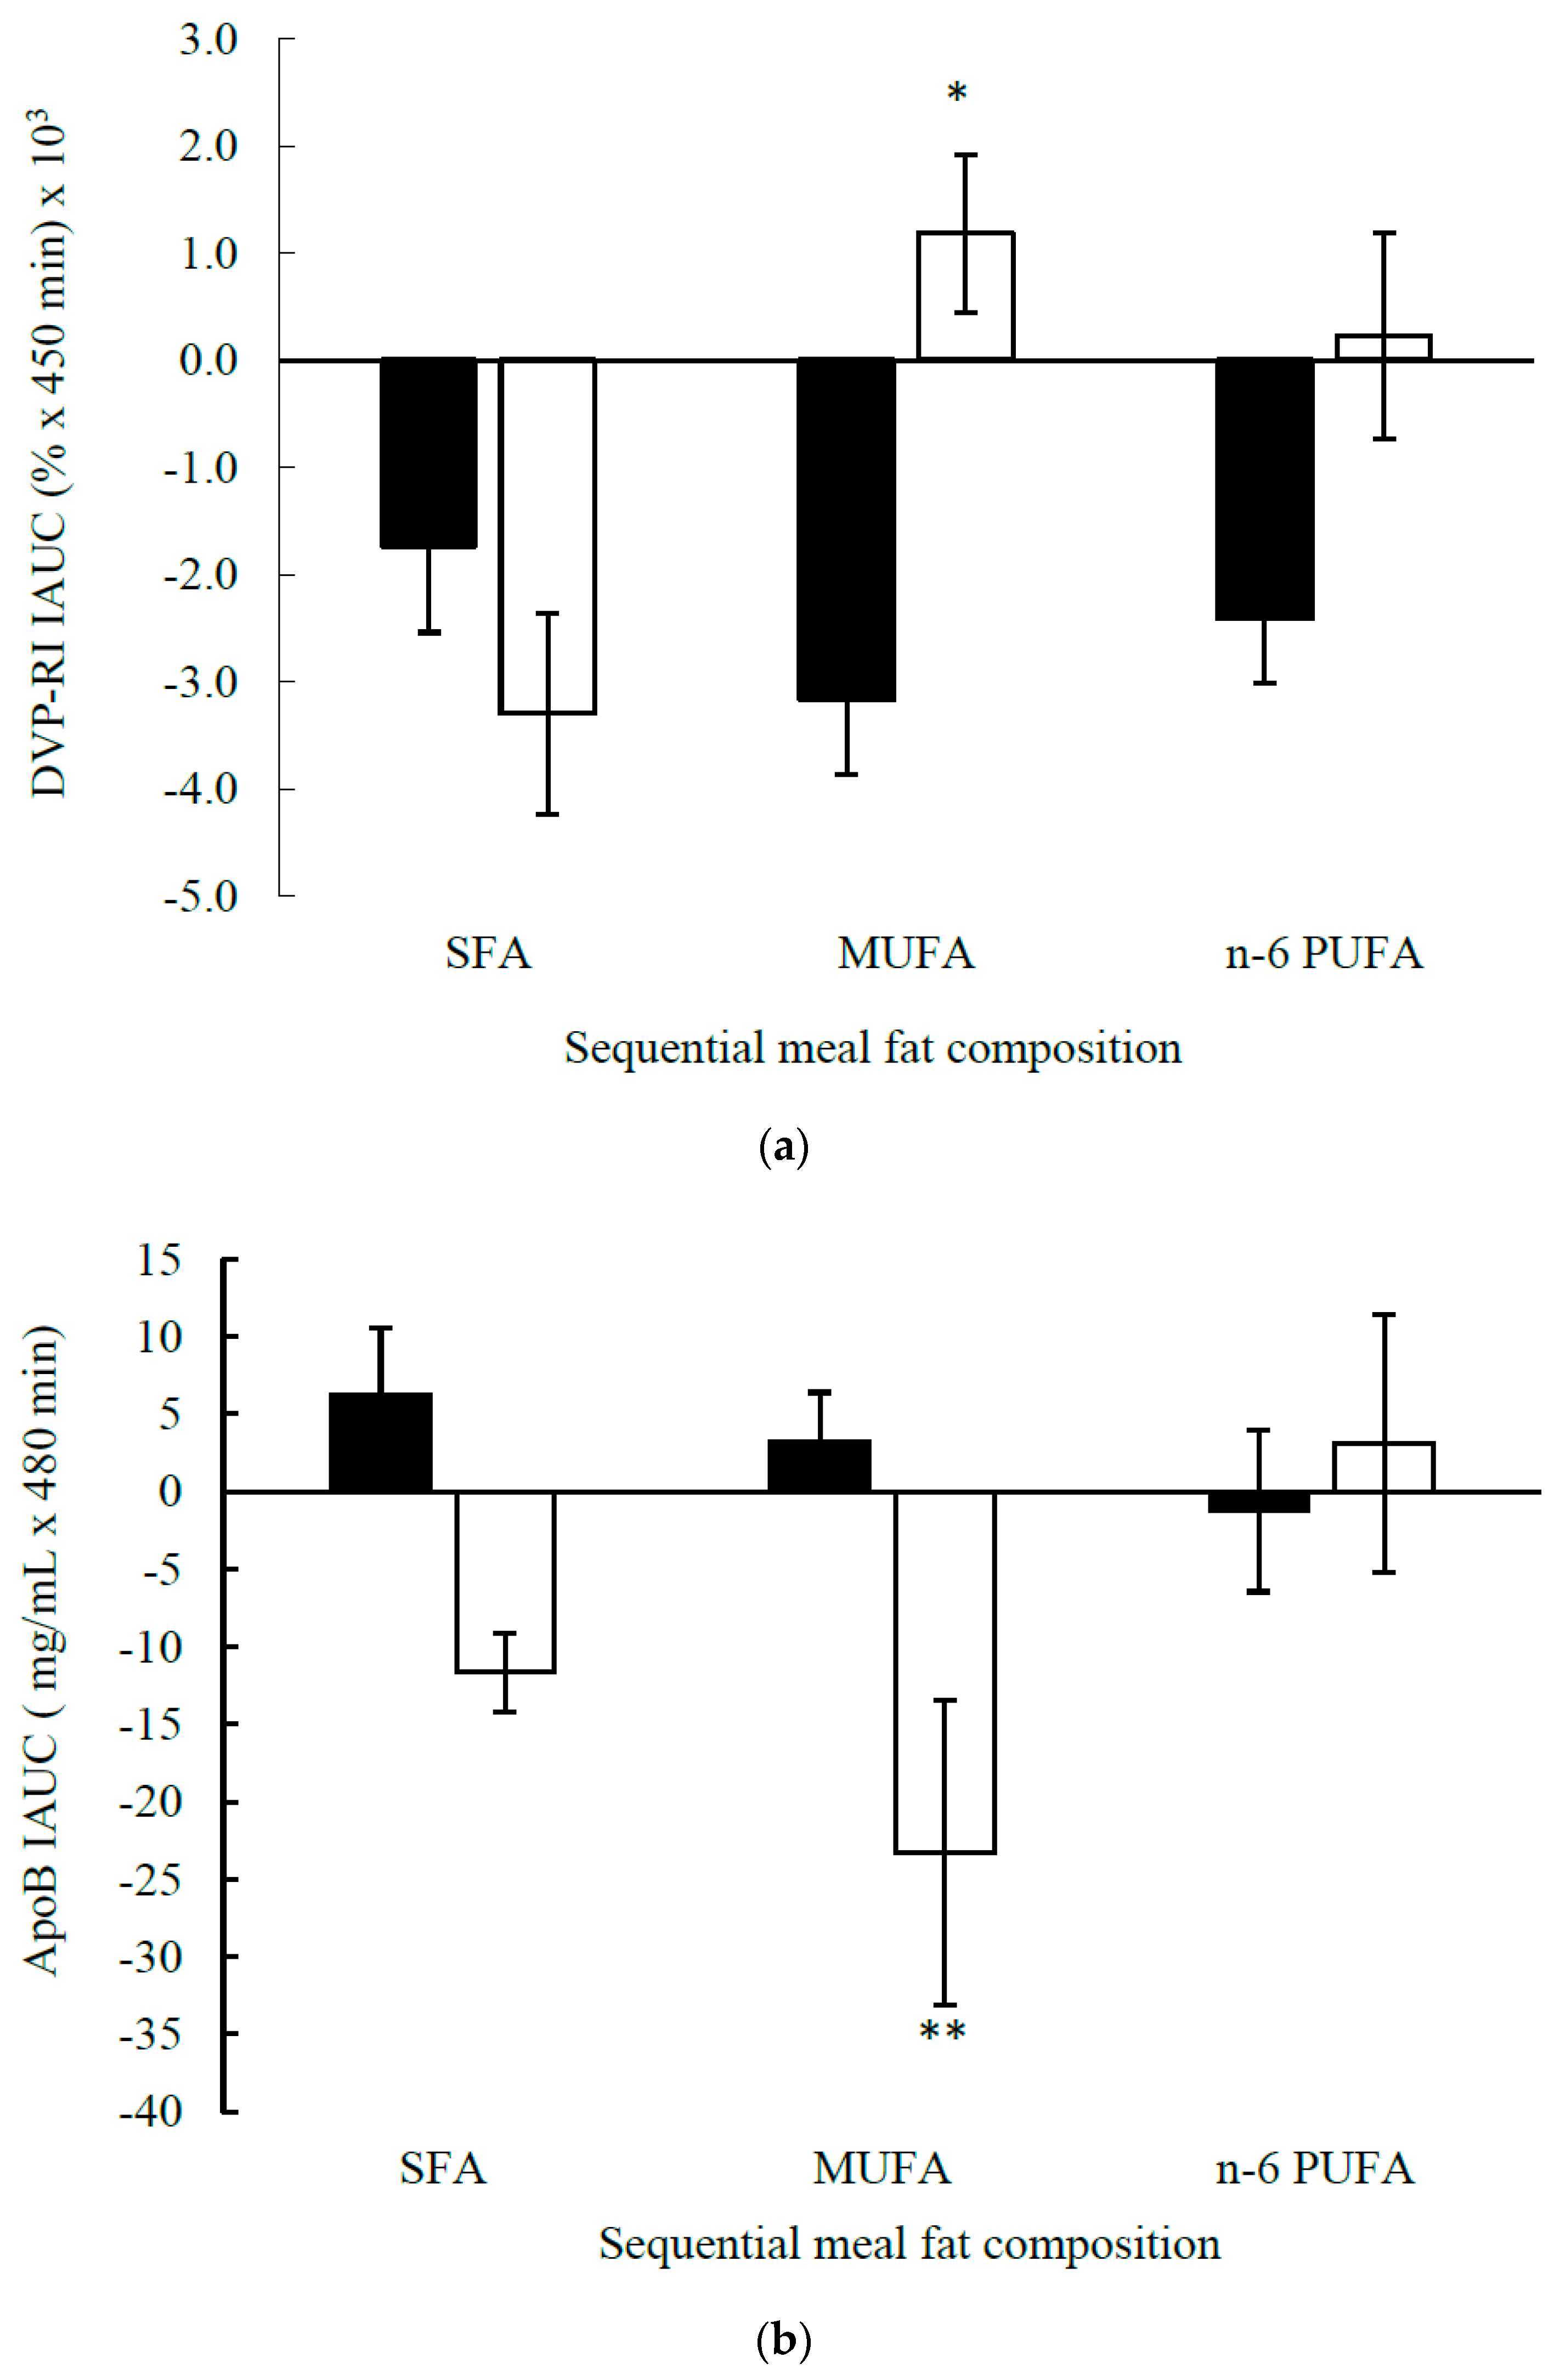
3.2.2. Acute Meal Fat Composition (DIVAS-2)

This analysis included 27 postmenopausal women (n = 22, E3/E3 and n = 5, E3/E4), with a mean age of 58 ± 1 y and mean BMI of 26.1 ± 0.7 kg/m2 (Table 3). The APOE genotype did not influence the responsiveness of postprandial measures of macrovascular function (%FMD response), microvascular function (LDI) or arterial stiffness (DVP-SI) to the meal fat composition. However, the postprandial DVP-RI time response profile showed a significant test fat × time × APOE genotype interaction (p = 0.014; Figure 1a,b). This was associated with a significant genotype × test fat interaction for the DVP-RI IAUC (p = 0.030; Figure 2a) with an increase in the DVP-RI IAUC in E4 carriers as opposed to a reduction in the E3/E3 group (p = 0.002) to the MUFA-rich meal. When data were split according to the genotype group, there was a significant test fat × time interaction (p = 0.037) and test fat effect (p = 0.027) in the E4 carriers only, in which the SFA-rich meal reduced the DVP-RI IAUC relative to MUFA (p = 0.033) and n-6 PUFA-rich (p = 0.028) meals, although these effects were not considered significant after applying the Bonferroni correction (p ≥ 0.017).
There was a test fat × genotype interaction for the total serum postprandial apoB response IAUC (p = 0.022), with a tendency for higher IAUC after the n-6 PUFA than MUFA and SFA-rich meals (p = 0.068) in E4 carriers only (Table 3, Figure 2b). However, there were differential effects on the responsiveness of the genotype groups to the MUFA-rich meals, with a reduction in the total apoB IAUC in E4 carriers compared to an increase in the E3/E3 group (p = 0.002). For all other cardiometabolic risk markers, the APOE genotype did not appear to influence the postprandial responses to the test fats.

4. Discussion

It has been suggested that personalised gene-based dietary advice is more useful than general dietary guidelines [29] and more effective at motivating dietary change [30]. It is, therefore, important to investigate common single nucleotide polymorphisms related with CVD risk that impact on response to key population dietary fat recommendations for CVD risk reduction. To our knowledge, this is the first data analysis that has examined both the chronic and acute impact of dietary fat manipulation on novel and established cardiometabolic risk markers according to the APOE genotype.
In the present baseline analysis, the higher fasting TC and LDL-C concentrations, and TC: HDL-C and LDL-C:HDL-C ratios were more evident in E4 carriers than E2 carriers and the E3/E3 wild-type genotype group, which confirms previous studies [4,5,20,31,32,33]. A number of possible mechanisms could explain the higher fasting TC and LDL-C concentrations in E4 carriers [11]. ApoE is present on TAG-rich lipoproteins (chylomicrons and very low-density lipoproteins (VLDL)) and HDL, but not LDL particles and is involved with lipid transport and receptor mediated clearance. The apoE4 protein isoform has selective affinity for larger TAG-rich lipoproteins, for example dietary derived chylomicrons, which would be expected to increase the competition with LDL for the LDL receptor mediated clearance, increasing circulating LDL-C concentrations [34,35]. However, the lower binding affinity of the E2 isoform to the hepatic LDL receptor, compared with both E3 and E4 would be expected to slow the clearance of VLDL and dietary chylomicron remnants, and increase LDL clearance leading to typically lower concentrations of TC and LDL-C, yet higher postprandial TAG in E2 carriers [36]. Furthermore, the lipolytic conversion of VLDL remnants to LDL is reportedly faster in E4 carriers [37]. All of these mechanisms could contribute to varying extents to the higher fasted TC and LDL-C concentrations in E4 carriers in the current study, in the order of E4 carriers > E3/E3 group > E2 carriers.
We also observed genotype effects on a biomarker of inflammation, with E2 carriers having greater fasting CRP concentrations compared with E4 carriers. Additionally, serum CRP was lower in E4 carriers, a finding that has also been observed in other studies [4,38,39,40,41,42,43,44,45]. Although both fasting LDL-C and CRP are recognised as independent CVD risk factors [46], some recent literature has indicated that elevated CRP does not raise the risk of CVD events as much as originally thought [47,48,49]. Therefore, the greater CVD risk previously reported in E4 carriers could be due to increased TC and LDL-C concentrations despite lower CRP [3,5]. Findings from an experimental study have reported apoE to influence immune cell function, with APOE4 carriers more predisposed to a pro-inflammatory phenotype [50]. Further studies incorporating markers of immune function are needed to confirm these findings and determine the mechanisms linking the APOE genotype with inflammation.
The present study found a limited impact of the APOE genotype on the responsiveness of cardiometabolic risk markers to differences in chronic fat intake, although there was some evidence that E4 carriers were more sensitive to the TAG lowering effect of a diet in which 8 %TE SFA was replaced with MUFA. Analysis of data from the Diet, genomics and metabolic syndrome: an integrated nutrition, agro-food, social and economic analysis (LIPGENE; n = 442 men and women classified with metabolic syndrome) and RISCK (n = 389 men and women ‘at risk’ from metabolic syndrome) studies revealed no differences in fasted TAG following a 19 and 17 %TE MUFA diet for 12 or 16 weeks, respectively, according to the APOE genotype [33]. However, analysis of the data from the LIPGENE study was performed according to plasma fatty acids concentrations, rather than dietary intake, and although circulating fatty acids (particularly PUFA) can reflect consumption, only weak correlations between dietary and plasma SFA and MUFA exist due to endogenous de novo synthesis of these fatty acids from lipid and non-lipid sources [51]. Furthermore, a study in 84 young healthy students with a mean age of 22.5 years (66 APOE3/3, 8 APOE4/E3 and 10 APOE2/E3) following a 22 %TE MUFA diet for 4 weeks also reported no difference in TAG according to the APOE genotype, although there were low numbers of E4 carriers and could have been underpowered for these comparisons as a result of retrospective genotyping [52]. Additional research is required to confirm the effects of different unsaturated fats on fasting TAG according to APOE genotype.
Our study found the APOE genotype had a limited impact on postprandial lipid levels in relation to dietary fat manipulation, which is in agreement with our SATurated fat and gene APOE (SATgene) study [7], which prospectively genotyped according to APOE (E3/E3 and E4 carriers). However, in the current study a greater reduction in the postprandial apoB response (IAUC) was identified in E4 carriers compared with the E3/3 group after the MUFA-rich meals, although no difference in TAG responses were evident. This was surprising since TAG is transported in chylomicrons (containing apoB48) and VLDL (containing apoB100) and postprandial total apoB generally reflects concentrations of these TAG-rich lipoproteins. In contrast, Cardona et al. investigated adults identified as having the metabolic syndrome and found no impact on apoB measured 4 h postprandially after a MUFA-rich meal, but observed E2 and E4 carriers combined to have higher postprandial TAG, with E2 carriers having the highest TAG [19]. Postprandial differences in TAG were observed after a SFA-rich test meal in E4 carriers compared with E3/E3, although these were reported to be reflective of the higher baseline TAG concentrations [18]. In support of the importance of fasted TAG concentrations, the significantly higher postprandial TAG concentrations in E4 carriers compared with E3/E3 in response to a high fat meal were attenuated when the incremental response was calculated [17].
We found no differences in measures of fasted macrovascular (%FMD response) or microvascular (LDI) reactivity, however we provided novel evidence of a difference in baseline (fasting) arterial stiffness according to the APOE genotype. Vascular dysfunction is considered to be an important risk factor for CVD and associations have been reported between cardiovascular mortality and related vascular conditions, including hypertension [53], arterial stiffness [54] and endothelial dependent vasodilation [55], and arterial stiffness is related to chronic inflammation and dyslipidaemia, particularly elevated TAG [56], often found in E2 carriers, with E2 homozygotes having a higher risk of Type III hyperlipoproteinemia, which leads to progressive atherosclerosis [35,38]. The higher arterial stiffness (measured by DVP-SI) observed in the E2 carriers, compared with E3/E3 in our study, might have reflected the higher inflammatory marker (CRP) in our E2 carriers, although further confirmation of this association is required. However, there was no diet/meal fat and APOE genotype interaction observed for arterial stiffness. This is perhaps not surprising as arterial stiffness is a progressively slow process and longer term dietary fat manipulation may be necessary before differences are observed [57]. With regards to vascular function, this study is the first to report that the APOE genotype had a limited impact on fasting and postprandial measures of vascular function after chronic and acute fat manipulation, respectively. Yet, a reduction in DVP-RI was observed in the E3/E3 compared with E4 carriers after the MUFA-rich meals, which indicates that differences in small vessel tone after meal ingestion are dependent on genotype, although the mechanism of action and the clinical relevance are unclear.
This study is novel, being the first to investigate the effect of the APOE genotype on vascular function and cardiometabolic risk markers at baseline and in response to chronic and acute dietary fat manipulation. Furthermore, there are a number of strengths in the study design of both the chronic and acute interventions. Firstly, the target intakes of SFA in the unsaturated fat diets in the chronic DIVAS study were compliant with the current population recommendation for CVD risk reduction of ≤10 %TE SFA. Secondly, the chronic diets were followed for a longer duration (16 weeks) than many published dietary fat interventions investigating the effects on vascular function as the primary outcome. Moreover, the acute study (DIVAS-2) used a two meal sequential postprandial protocol, which is considered superior to a single test meal challenge as it better represents a habitual meal intake pattern [58,59]. Since the genotyping was performed retrospectively, the number of participants who carried the E2 allele was low in both the chronic and acute datasets, which necessitated removal of E2 carriers, and could be considered as a limitation. Furthermore, there was a small sample size for E4 carriers in the DIVAS-2 study. In addition, as only postmenopausal women were recruited for the postprandial analysis (DIVAS-2), our postprandial findings may not relate to other population subgroups, including men and premenopausal women. However, both the baseline and chronic data analyses included a wider population, consisting of both men and pre- and postmenopausal women in the UK.
In conclusion, this study has confirmed previous findings that the APOE genotype is associated with fasting lipid profile and CRP and presents novel evidence of an association between the APOE genotype with fasting DVP-SI. Moreover, our findings revealed a limited influence of the APOE genotype on the responsiveness of novel and established cardiometabolic risk markers to chronic and acute fat manipulation. However, further studies are warranted using prospective genotyping in relation to dietary fat recommendations for CVD risk reduction to confirm the findings in relation to the effects of the APOE genotype on markers of vascular functions, lipids and inflammation.

Supplementary Materials

The following are available online at https://0-www-mdpi-com.brum.beds.ac.uk/2072-6643/11/9/2044/s1, Table S1: Habitual dietary intakes for the study group as a whole and according to APOE genotype.

Author Contributions

In DIVAS study; J.A.L. and K.G.J. designed the study, M.W. conducted the DIVAS study, analysed the data and gave statistical guidance; K.G.J.: performed the training for the DNA extraction and genotyping and gave statistical guidance. In DIVAS-2 study; J.A.L., K.G.J., K.M.R. and M.W. designed the study, K.M.R. carried out DNA extraction and genotyping of DIVAS-2 samples, analysed the data, performed the statistical analysis, and wrote the manuscript under the guidance of J.A.L., K.G.J. and M.W. M.W. analysed the data and gave statistical guidance; K.G.J.: provided guidance for the genotyping and statistical analyses, all authors critically appraised the manuscript at all stages and approved the final manuscript. J.A.L. had final responsibility for the paper. None of the authors had conflicts of interest with regards to the writing or submission of the manuscript.

Funding

Funded by the United Kingdom Food Standards Agency and Department of Health Policy Research Programme (024/0036). Unilever R&D produced and supplied in kind the study spreads and oils according to our specification, but was not involved in the design, implementation, analysis or interpretation of the data. KMR was supported by the Commonwealth Scholarship Commission in the UK (London, UK).

Acknowledgments

The authors would like to thank Marinela Hasaj for the DNA extraction and Rachel Rothwell for the genotyping of the DIVAS study samples.

Conflicts of Interest

J.A.L. is a member of the Scientific Advisory Committee on Nutrition (SACN) and SACN’s Saturated Fats Working Group.

Abbreviations

%TETotal energy
ANCOVAAnalysis of covariance
ANOVAAnalysis of variance
apoApolipoprotein
AUArbitrary units
AUCArea under the curve
BMIBody mass index
CRPC-reactive protein
CVDCardiovascular disease
DBPDiastolic blood pressure
DIVASDietary intervention and vascular function
DVPDigital volume pulse
DVP-RIDVP reflection index
DVP-SIDVP stiffness index
FMDFlow mediated dilatation
HDL-CHigh-density lipoprotein cholesterol
HOMA-IRQuantitative insulin resistance index
IAUCIncremental AUC
LDILaser Doppler imaging
LDL-CLow-density lipoprotein cholesterol
MUFAMonounsaturated fatty acids
NEFANon-esterified fatty acids
NOxSum of nitrite and nitrate concentrations
PUFAPolyunsaturated fatty acids
rQUICKIRevised quantitative insulin sensitivity check index
SBPSystolic blood pressure
SFASaturated fatty acids
sICAM-1Soluble intercellular cell adhesion molecule-1
SNPSodium nitroprusside
sVCAM-1Soluble vascular cell adhesion molecule-1
TAGTriacylglycerol
TCTotal cholesterol

References

  1. Wilson, P.W.F.; Schaefer, E.J.; Larson, M.G.; Ordovas, J.M. Apolipoprotein E alleles and risk of coronary disease. Arterioscler. Thromb. Vasc. Biol. 1996, 16, 1250–1255. [Google Scholar] [CrossRef] [PubMed]
  2. Waterworth, D.M.; Ricketts, S.L.; Song, K.; Chen, L.; Zhao, J.H.; Ripatti, S.; Aulchenko, Y.S.; Zhang, W.; Yuan, X.; Lim, N. Genetic variants influencing circulating lipid levels and risk of coronary artery disease. Arterioscler. Thromb. Vasc. Biol. 2010, 30, 2264–2276. [Google Scholar] [CrossRef] [PubMed]
  3. Song, Y.; Stampfer, M.J.; Liu, S. Meta-analysis: Apolipoprotein E genotypes and risk for coronary heart disease. Ann. Intern. Med. 2004, 141, 137–147. [Google Scholar] [CrossRef] [PubMed]
  4. Fallaize, R.; Celis-Morales, C.; Macready, A.L.; Marsaux, C.F.M.; Forster, H.; O’Donovan, C.; Woolhead, C.; San-Cristobal, R.; Kolossa, S.; Hallmann, J. The effect of the apolipoprotein E genotype on response to personalized dietary advice intervention: Findings from the Food4Me randomized controlled trial. Am. J. Clin. Nutr. 2016, 104, 827–836. [Google Scholar] [PubMed]
  5. Bennet, A.M.; Di Angelantonio, E.; Ye, Z.; Wensley, F.; Dahlin, A.; Ahlbom, A.; Keavney, B.; Collins, R.; Wiman, B.; de Faire, U. Association of apolipoprotein E genotypes with lipid levels and coronary risk. JAMA 2007, 298, 1300–1311. [Google Scholar] [CrossRef] [PubMed]
  6. Fernández-Miranda, C.; Cancelas, P.; Sanz, M.; Porres, A.; Gerique, J.G. Influence of apolipoprotein-E phenotypes on postprandial lipoprotein metabolism after three different fat loads. Nutrition 2001, 17, 529–533. [Google Scholar] [CrossRef]
  7. Jackson, K.G.; Lockyer, S.; Carvalho-Wells, A.L.; Williams, C.M.; Minihane, A.M.; Lovegrove, J.A. Dietary fat manipulation has a greater impact on postprandial lipid metabolism than the apolipoprotein E (epsilon) genotype–insights from the SATgenε study. Mol. Nutr. Food Res. 2012, 56, 1761–1770. [Google Scholar] [CrossRef] [PubMed]
  8. Leigh-Firbank, E.C.; Minihane, A.M.; Leake, D.S.; Wright, J.W.; Murphy, M.C.; Griffin, B.A.; Williams, C.M. Eicosapentaenoic acid and docosahexaenoic acid from fish oils: Differential associations with lipid responses. Br. J. Nutr. 2002, 87, 435–445. [Google Scholar] [CrossRef]
  9. Moreno, J.A.; Pérez-Jiménez, F.; Marín, C.; Gómez, P.; Pérez-Martínez, P.; Moreno, R.; Bellido, C.; Fuentes, F.; López-Miranda, J. Apolipoprotein E gene promoter −219G→ T polymorphism increases LDL-cholesterol concentrations and susceptibility to oxidation in response to a diet rich in saturated fat. Am. J. Clin. Nutr. 2004, 80, 1404–1409. [Google Scholar] [CrossRef]
  10. Olano-Martin, E.; Anil, E.; Caslake, M.J.; Packard, C.J.; Bedford, D.; Stewart, G.; Peiris, D.; Williams, C.M.; Minihane, A.M. Contribution of apolipoprotein E genotype and docosahexaenoic acid to the LDL-cholesterol response to fish oil. Atherosclerosis 2010, 209, 104–110. [Google Scholar] [CrossRef]
  11. Wei, M.Y.; Jacobson, T.A. Effects of eicosapentaenoic acid versus docosahexaenoic acid on serum lipids: A systematic review and meta-analysis. Curr. Atheroscler. Rep. 2011, 13, 474–483. [Google Scholar] [CrossRef] [PubMed]
  12. Wu, K.; Bowman, R.; Welch, A.A.; Luben, R.N.; Wareham, N.; Khaw, K.T.; Bingham, S.A. Apolipoprotein E polymorphisms, dietary fat and fibre, and serum lipids: The EPIC Norfolk study. Eur. Heart J. 2007, 28, 2930–2936. [Google Scholar] [CrossRef] [PubMed]
  13. Schächinger, V.; Britten, M.B.; Zeiher, A.M. Prognostic impact of coronary vasodilator dysfunction on adverse long-term outcome of coronary heart disease. Circulation 2000, 101, 1899–1906. [Google Scholar] [CrossRef]
  14. Jackson, K.G.; Poppitt, S.D.; Minihane, A.M. Postprandial lipemia and cardiovascular disease risk: Interrelationships between dietary, physiological and genetic determinants. Atherosclerosis 2012, 220, 22–33. [Google Scholar] [CrossRef] [PubMed]
  15. Lopez-Miranda, J.; Williams, C.; Lairon, D. Dietary, physiological, genetic and pathological influences on postprandial lipid metabolism. Br. J. Nutr. 2007, 98, 458–473. [Google Scholar] [CrossRef] [PubMed] [Green Version]
  16. Perez-Martinez, P.; Delgado-Lista, J.; Perez-Jimenez, F.; Lopez-Miranda, J. Update on genetics of postprandial lipemia. Atheroscler. Suppl. 2010, 11, 39–43. [Google Scholar] [CrossRef] [PubMed]
  17. Irvin, M.R.; Kabagambe, E.K.; Tiwari, H.K.; Parnell, L.D.; Straka, R.J.; Tsai, M.; Ordovas, J.M.; Arnett, D.K. Apolipoprotein E polymorphisms and postprandial triglyceridemia before and after fenofibrate treatment in the Genetics of Lipid Lowering and Diet Network (GOLDN) Study. Circ. Cardiovasc. Genet. 2010, 3, 462–467. [Google Scholar] [CrossRef]
  18. Carvalho-Wells, A.L.; Jackson, K.G.; Gill, R.; Olano-Martin, E.; Lovegrove, J.A.; Williams, C.M.; Minihane, A.M. Interactions between age and apoE genotype on fasting and postprandial triglycerides levels. Atherosclerosis 2010, 212, 481–487. [Google Scholar] [CrossRef]
  19. Cardona, F.; Morcillo, S.; Gonzalo-Marin, M.; Tinahones, F.J. The apolipoprotein E genotype predicts postprandial hypertriglyceridemia in patients with the metabolic syndrome. J. Clin. Endocrinol. Metab. 2005, 90, 2972–2975. [Google Scholar] [CrossRef]
  20. Griffin, B.; Walker, C.; Jebb, S.; Moore, C.; Frost, G.; Goff, L.; Sanders, T.; Lewis, F.; Griffin, M.; Gitau, R.; et al. APOE4 genotype exerts greater benefit in lowering plasma cholesterol and apolipoprotein B than wild type (E3/E3), after replacement of dietary saturated fats with low glycaemic index carbohydrates. Nutrients 2018, 10, 1524. [Google Scholar] [CrossRef]
  21. Vafeiadou, K.; Weech, M.; Altowaijri, H.; Todd, S.; Yaqoob, P.; Jackson, K.G.; Lovegrove, J.A. Replacement of saturated with unsaturated fats had no impact on vascular function but beneficial effects on lipid biomarkers, E-selectin, and blood pressure: Results from the randomized, controlled Dietary Intervention and VAScular function (DIVAS) study. Am. J. Clin. Nutr. 2015, 102, 40–48. [Google Scholar] [CrossRef] [PubMed]
  22. Rathnayake, K.M.; Weech, M.; Jackson, K.G.; Lovegrove, J.A. Meal Fatty Acids Have Differential Effects on Postprandial Blood Pressure and Biomarkers of Endothelial Function but Not Vascular Reactivity in Postmenopausal Women in the Randomized Controlled Dietary Intervention and VAScular function (DIVAS)-2 Study. J. Nutr. 2018, 148, 348–357. [Google Scholar] [CrossRef] [PubMed]
  23. Weech, M.; Vafeiadou, K.; Hasaj, M.; Todd, S.; Yaqoob, P.; Jackson, K.G.; Lovegrove, J.A. Development of a food-exchange model to replace saturated fat with MUFAs and n–6 PUFAs in adults at moderate cardiovascular risk. J. Nutr. 2014, 144, 846–855. [Google Scholar] [CrossRef] [PubMed]
  24. Newens, K.J.; Thompson, A.K.; Jackson, K.G.; Wright, J.; Williams, C.M. DHA-rich fish oil reverses the detrimental effects of saturated fatty acids on postprandial vascular reactivity. Am. J. Clin. Nutr. 2011, 94, 742–748. [Google Scholar] [CrossRef] [PubMed] [Green Version]
  25. Friedewald, W.T.; Levy, R.I.; Fredrickson, D.S. Estimation of the concentration of low-density lipoprotein cholesterol in plasma, without use of the preparative ultracentrifuge. Clin. Chem. 1972, 18, 499–502. [Google Scholar]
  26. Ignarro, L.J.; Fukuto, J.M.; Griscavage, J.M.; Rogers, N.E.; Byrns, R.E. Oxidation of nitric oxide in aqueous solution to nitrite but not nitrate: Comparison with enzymatically formed nitric oxide from L-arginine. Proc. Natl. Acad. Sci. USA 1993, 90, 8103–8107. [Google Scholar] [CrossRef] [PubMed]
  27. Rassaf, T.; Bryan, N.S.; Kelm, M.; Feelisch, M. Concomitant presence of N-nitroso and S-nitroso proteins in human plasma. Free Radic. Biol. Med. 2002, 33, 1590–1596. [Google Scholar] [CrossRef]
  28. Brady, L.M.; Gower, B.A.; Lovegrove, S.S.; Williams, C.M.; Lovegrove, J.A. Revised QUICKI provides a strong surrogate estimate of insulin sensitivity when compared with the minimal model. Int. J. Obes. 2004, 28, 222–227. [Google Scholar] [CrossRef] [Green Version]
  29. Nielsen, D.E.; El-Sohemy, A. A randomized trial of genetic information for personalized nutrition. Genes Nutr. 2012, 7, 559. [Google Scholar] [CrossRef]
  30. Joost, H.G.; Gibney, M.J.; Cashman, K.D.; Görman, U.; Hesketh, J.E.; Mueller, M.; Van Ommen, B.; Williams, C.M.; Mathers, J.C. Personalised nutrition: Status and perspectives. Br. J. Nutr. 2007, 98, 26–31. [Google Scholar] [CrossRef]
  31. Carvalho-Wells, A.L.; Jackson, K.G.; Lockyer, S.; Lovegrove, J.A.; Minihane, A.M. APOE genotype influences triglyceride and C-reactive protein responses to altered dietary fat intake in UK adults. Am. J. Clin. Nutr. 2012, 96, 1447–1453. [Google Scholar] [CrossRef] [PubMed]
  32. Caslake, M.J.; Miles, E.A.; Kofler, B.M.; Lietz, G.; Curtis, P.; Armah, C.K.; Kimber, A.C.; Grew, J.P.; Farrell, L.; Stannard, J. Effect of sex and genotype on cardiovascular biomarker response to fish oils: The FINGEN Study. Am. J. Clin. Nutr. 2008, 88, 618–629. [Google Scholar] [CrossRef] [PubMed]
  33. Fallaize, R.; Carvalho-Wells, A.L.; Tierney, A.C.; Marin, C.; Kieć-Wilk, B.; Dembińska-Kieć, A.; Drevon, C.A.; DeFoort, C.; Lopez-Miranda, J.; Risérus, U.; et al. APOE genotype influences insulin resistance, apolipoprotein CII and CIII according to plasma fatty acid profile in the Metabolic Syndrome. Sci. Rep. 2017, 7, 6274. [Google Scholar] [CrossRef] [PubMed]
  34. Weisgraber, K.H. Apolipoprotein E distribution among human plasma lipoproteins: Role of the cysteine-arginine interchange at residue 112. J. Lipid Res. 1990, 31, 1503–1511. [Google Scholar] [PubMed]
  35. Jackson, K.G.; Maitin, V.; Leake, D.S.; Yaqoob, P.; Williams, C.M. Saturated fat-induced changes in Sf 60–400 particle composition reduces uptake of LDL by HepG2 cells. J. Lipid Res. 2006, 47, 393–403. [Google Scholar] [CrossRef] [PubMed]
  36. Weintraub, M.S.; Eisenberg, S.; Breslow, J.L. Dietary fat clearance in normal subjects is regulated by genetic variation in apolipoprotein E. J. Clin. Investig. 1987, 80, 1571. [Google Scholar] [CrossRef] [PubMed]
  37. Gregg, R.E.; Zech, L.A.; Schaefer, E.J.; Stark, D.; Wilson, D.; Brewer, H.B., Jr. Abnormal in vivo metabolism of apolipoprotein E4 in humans. J. Clin. Investig. 1986, 78, 815. [Google Scholar] [CrossRef]
  38. Rontu, R.; Ojala, P.; Hervonen, A.; Goebeler, S.; Karhunen, P.J.; Nikkilä, M.; Kunnas, T.; Jylhä, M.; Eklund, C.; Hurme, M. Apolipoprotein E genotype is related to plasma levels of C-reactive protein and lipids and to longevity in nonagenarians. Clin. Endocrinol. 2006, 64, 265–270. [Google Scholar] [CrossRef]
  39. Mänttäri, M.; Manninen, V.; Palosuo, T.; Ehnholm, C. Apolipoprotein E polymorphism and C-reactive protein in dyslipidemic middle-aged men. Atherosclerosis 2001, 156, 237–238. [Google Scholar] [CrossRef]
  40. Judson, R.; Brain, C.; Dain, B.; Windemuth, A.; Ruaño, G.; Reed, C. New and confirmatory evidence of an association between APOE genotype and baseline C-reactive protein in dyslipidemic individuals. Atherosclerosis 2004, 177, 345–351. [Google Scholar] [CrossRef]
  41. Grönroos, P.; Raitakari, O.T.; Kähönen, M.; Hutri-Kähönen, N.; Marniemi, J.; Viikari, J.; Lehtimäki, T. Association of high sensitive C-reactive protein with apolipoprotein E polymorphism in children and young adults: The Cardiovascular Risk in Young Finns Study. Clin. Chem. Lab. Med. 2008, 46, 179–186. [Google Scholar] [CrossRef]
  42. Golledge, J.; Biros, E.; Cooper, M.; Warrington, N.; Palmer, L.J.; Norman, P.E. Apolipoprotein E genotype is associated with serum C-reactive protein but not abdominal aortic aneurysm. Atherosclerosis 2010, 209, 487–491. [Google Scholar] [CrossRef] [Green Version]
  43. Eiriksdottir, G.; Aspelund, T.; Bjarnadottir, K.; Olafsdottir, E.; Launer, L.J.; Harris, T.B.; Gudnason, V. Apolipoprotein E genotype and statins affect CRP levels through independent and different mechanisms: AGES-Reykjavik Study. Atherosclerosis 2006, 186, 222–224. [Google Scholar] [CrossRef] [PubMed]
  44. Austin, M.A.; Zhang, C.; Humphries, S.E.; Chandler, W.L.; Talmud, P.J.; Edwards, K.L.; Leonetti, D.L.; McNeely, M.J.; Fujimoto, W.Y. Heritability of C-Reactive Protein and Association with Apolipoprotein E Genotypes in Japanese Americans. Ann. Hum. Genet. 2004, 68, 179–188. [Google Scholar] [CrossRef]
  45. Angelopoulos, T.J.; Miles, M.P.; Lowndes, J.; Sivo, S.A.; Seip, R.L.; Pescatello, L.S.; Zoeller, R.F.; Visich, P.S.; Gordon, P.M.; Moyna, N.M. Apolipoprotein E genotype and sex influence C-reactive protein levels regardless of exercise training status. Metabolism 2008, 57, 1204–1210. [Google Scholar] [CrossRef] [Green Version]
  46. Pearson, T.A.; Mensah, G.A.; Alexander, R.W.; Anderson, J.L.; Cannon, R.O.; Criqui, M.; Fadl, Y.Y.; Fortmann, S.P.; Hong, Y.; Myers, G.L. Markers of inflammation and cardiovascular disease. Circulation 2003, 107, 499–511. [Google Scholar] [CrossRef] [PubMed]
  47. Danesh, J.; Wheeler, J.G.; Hirschfield, G.M.; Eda, S.; Eiriksdottir, G.; Rumley, A.; Lowe, G.D.O.; Pepys, M.B.; Gudnason, V. C-reactive protein and other circulating markers of inflammation in the prediction of coronary heart disease. N. Engl. J. Med. 2004, 350, 1387–1397. [Google Scholar] [CrossRef] [PubMed]
  48. Tall, A.R. C-reactive protein reassessed. Mass. Med. Soc. 2004, 350, 1450–1452. [Google Scholar] [CrossRef]
  49. Eltoft, A.; Arntzen, K.A.; Hansen, J.B.; Wilsgaard, T.; Mathiesen, E.B.; Johnsen, S.H. C-reactive protein in atherosclerosis–A risk marker but not a causal factor? A 13-year population-based longitudinal study: The Tromsø study. Atherosclerosis 2017, 263, 293–300. [Google Scholar] [CrossRef]
  50. Bonacina, F.; Coe, D.; Wang, G.; Longhi, M.P.; Baragetti, A.; Moregola, A.; Garlaschelli, K.; Uboldi, P.; Pellegatta, F.; Grigore, L.; et al. Myeloid apolipoprotein E controls dendritic cell antigen presentation and T cell activation. Nat. Commun. 2018, 9, 3083. [Google Scholar] [CrossRef]
  51. Hodson, L.; Skeaff, C.M.; Fielding, B.A. Fatty acid composition of adipose tissue and blood in humans and its use as a biomarker of dietary intake. Prog. Lipid Res. 2008, 47, 348–380. [Google Scholar] [CrossRef] [PubMed]
  52. Moreno, J.A.; Pérez-Jiménez, F.; Moreno-Luna, R.; Pérez-Martínez, P.; Fuentes-Jiménez, F.; Marín, C.; Portugal, H.; Lairon, D.; López-Miranda, J. The effect of apoE genotype and sex on ApoE plasma concentration is determined by dietary fat in healthy subjects. Br. J. Nutr. 2008, 101, 1745–1752. [Google Scholar] [CrossRef] [PubMed]
  53. Kannel, W.B. Blood pressure as a cardiovascular risk factor: Prevention and treatment. JAMA 1996, 275, 1571–1576. [Google Scholar] [CrossRef] [PubMed]
  54. Mattace-Raso, F.U.S.; van der Cammen, T.J.M.; Hofman, A.; van Popele, N.M.; Bos, M.L.; Schalekamp, M.A.D.H.; Asmar, R.; Reneman, R.S.; Hoeks, A.P.G.; Breteler, M.M.B. Arterial stiffness and risk of coronary heart disease and stroke the Rotterdam study. Circulation 2006, 113, 657–663. [Google Scholar] [CrossRef] [PubMed]
  55. Yeboah, J.; Crouse, J.R.; Hsu, F.C.; Burke, G.L.; Herrington, D.M. Brachial flow-mediated dilation predicts incident cardiovascular events in older adults the cardiovascular health study. Circulation 2007, 115, 2390–2397. [Google Scholar] [CrossRef] [PubMed]
  56. Urbina, E.M.; Khoury, P.R.; McCoy, C.E.; Dolan, L.M.; Daniels, S.R.; Kimball, T.R. Triglyceride to HDL-C ratio and increased arterial stiffness in children, adolescents, and young adults. Pediatrics 2013, 131, 1082–1090. [Google Scholar] [CrossRef] [PubMed]
  57. Sanders, T.A.B.; Lewis, F.J.; Goff, L.M.; Chowienczyk, P.J. SFAs do not impair endothelial function and arterial stiffness. Am. J. Clin. Nutr. 2013, 98, 677–683. [Google Scholar] [Green Version]
  58. Fielding, B.A.; Callow, J.; Owen, R.M.; Samra, J.S.; Matthews, D.R.; Frayn, K.N. Postprandial lipemia: The origin of an early peak studied by specific dietary fatty acid intake during sequential meals. Am. J. Clin. Nutr. 1996, 63, 36–41. [Google Scholar] [CrossRef]
  59. Evans, K.; Kuusela, P.J.; Cruz, M.L.; Wilhelmova, I.; Fielding, B.A.; Frayn, K.N. Rapid chylomicron appearance following sequential meals: Effects of second meal composition. Br. J. Nutr. 1998, 79, 425–429. [Google Scholar] [CrossRef]
Figure 1. Mean ± SEM for the postprandial digital volume pulse reflection index (DVP-RI) response in (a) the E3/E3 group (n = 22) and (b) E4 carriers (n = 5) response following sequential meals (breakfast: 0 min and lunch: 330 min) enriched in saturated fatty acids (SFA; ■), monounsaturated fatty acids (MUFA; □) and n-6 polyunsaturated fatty acids (PUFA; ●). Two-way repeated measures ANOVA revealed a significant test fat × time × genotype interaction (p = 0.014) for the DVP-RI response. There was also a significant genotype × test fat interaction for the DVP-RI IAUC (p = 0.030).
Nutrients 11 02044 g001
Figure 2. Incremental area under the curve (IAUC) for the postprandial (a) digital volume pulse reflection index (DVP-RI) and (b) total serum apolipoprotein (apo)B response according to APOE in the postmenopausal women following sequential meals (breakfast: 0 min and lunch: 330 min) enriched in saturated fatty acids (SFA), monounsaturated fatty acids (MUFA) and n-6 polyunsaturated fatty acids (PUFA). Data represent mean ± SEM for the APOE3/E3 group (black bars, n = 17) and APOE4 carriers (white bars, n = 4). There was a significant genotype × test fat interaction for the DVP-RI IAUC (p = 0.030) with an increase in the DVP-RI IAUC in E4 carriers compared to a reduction in the E3/E3 group (* p = 0.002) to the MUFA-rich meal. There was a significant genotype × test fat interaction for the postprandial total apoB IAUC (p = 0.022) with a reduction in the apoB IAUC in E4 carriers compared to an increase in the E3/E3 group after the MUFA-rich meals (** p = 0.002).
Nutrients 11 02044 g002
Table 1. Baseline characteristics in the combined study group and according to the APOE genotype.
All (n = 216)E2 Carriers (n = 30)E3/E3 (n = 128)E4 Carriers (n = 58)P (Genotype) 1
Genotype Frequency (%)-145927
Characteristics
Sex, M/F84/13213/1743/8528/30
Age, y46 ± 148 ± 245 ± 146 ± 20.537
Weight, kg76.5 ± 1.078.2 ± 2.875.0 ± 1.278.9 ± 1.80.082
BMI, kg/m226.6 ± 0.327.7 ± 0.826.4 ± 0.326.5 ± 0.50.341
Waist circumference, cm91.3 ± 0.896.2 ± 2.790.1 ± 1.091.3 ± 1.50.091
Waist:hip ratio0.87 ± 0.010.90 ± 0.020.86 ± 0.010.88 ± 0.010.152
Clinic blood pressure
 Systolic, mm Hg119 ± 1122 ± 3119 ± 1118 ± 20.432
 Diastolic, mm Hg74 ± 177 ± 174 ± 173 ± 10.193
 Pulse pressure, mm Hg45 ± 145 ± 245 ± 145 ± 10.873
Biochemical profile and CVD risk
TC, mmol/L5.49 ± 0.074.77 ± 0.20 a5.49 ± 0.09 b5.88 ± 0.13 c0.0001
HDL-C, mmol/L1.49 ± 0.021.43 ± 0.061.52 ± 0.031.47 ± 0.050.606
LDL-C, mmol/L3.42 ± 0.062.73 ± 0.16 a3.42 ± 0.07 b3.77 ± 0.11 c0.0001
TC: HDL-C ratio3.84 ± 0.073.49 ± 0.19 a3.77 ± 0.09 b4.20 ± 0.16 c0.002
LDL-C: HDL-C ratio2.41 ± 0.062.02 ± 0.15 a2.37 ± 0.07 b2.72 ± 0.12 c0.0001
TAG, mmol/L1.27 ± 0.041.34 ± 0.131.21 ± 0.051.34 ± 0.100.551
NEFA, µmol/L502 ± 12525 ± 28509 ± 17472 ± 220.413
Glucose, mmol/L5.09 ± 0.035.12 ± 0.075.05 ± 0.045.18 ± 0.070.527
Insulin, pmol/L31.2 ± 1.336.4 ± 4.630.4 ± 1.630.2 ± 2.30.619
HOMA-IR1.19 ± 0.051.41 ± 0.191.14 ± 0.061.18 ± 0.100.605
rQUICKI0.45 ± 0.010.43 ± 0.010.45 ± 0.010.46 ± 0.010.238
QRISK®2, 2 %2.8 ± 0.23.3 ± 0.72.4 ± 0.23.3 ± 0.40.142
Vascular function
%FMD response6.2 ± 0.25.8 ± 0.56.4 ± 0.36.0 ± 0.40.698
LDI-Ach, AUC, PU1548 ± 591529 ± 1641523 ± 771601 ± 1140.588
LDI-SNP, AUC, PU1464 ± 501327 ± 1061448 ± 641557 ± 1050.370
DVP-RI, %63.2 ± 0.964.8 ± 2.562.1 ± 1.164.8 ± 1.70.649
DVP-SI, m/s6.9 ± 0.17.7 ± 0.5 a6.6 ± 0.1 b7.2 ± 0.2 a,b0.027
Biomarkers of inflammation and endothelial activation
C-reactive protein, mg/L2.23 ± 0.233.20 ± 0.70 a2.27 ± 0.29 a1.66 ± 0.41 b0.002
sVCAM-1, ng/mL661 ± 11653 ± 23652 ± 16685 ± 200.400
sICAM-1, ng/mL218 ± 3228 ± 9220 ± 4207 ± 50.120
E-selectin, ng/mL34.2 ± 1.031.4 ± 2.534.5 ± 1.335.0 ± 1.90.189
P-selectin, ng/mL40.7 ± 1.037.3 ± 2.541.0 ± 1.341.8 ± 1.90.078
Values represent mean ± SEM, E2 carriers = E2/E2 and E2/E3; E4 carriers = E3/E4 and E4/E4. E2/E4 individuals were excluded from the analysis. 1 Data analysed by univariate general linear model (analysis of covariance—ANCOVA) adjusted for age, BMI and sex. If significant, pairwise comparisons were used to determine differences between genotype groups. 2 QRISK®2 10 y risk of cardiovascular disease (https://qrisk.org/2017/) a, b, c Different superscript letters within a row indicate significant differences between genotype groups (p ≤ 0.017). Abbreviations: Ach, acetylcholine; PU, perfusion units; DBP, diastolic blood pressure; DVP-RI, digital volume pulse reflection index; DVP-SI, digital volume pulse stiffness index; FMD, flow-mediated dilatation; HDL-C, high-density lipoprotein cholesterol; HOMA-IR, quantitative insulin resistance index; LDI, laser Doppler imaging; AUC, area under the curve; LDL-C, low-density lipoprotein cholesterol; NEFA, non-esterified fatty acids; rQUICKI, revised quantitative insulin sensitivity index; SBP, systolic blood pressure; sICAM-1, soluble intercellular adhesion molecule-1; SNP, sodium nitroprusside; sVCAM-1, soluble vascular cell adhesion molecule-1; TAG, triacylglycerol; TC, total cholesterol.
Table 2. Changes in fasting cardiometabolic risk markers after chronic dietary fat manipulation according to the APOE genotype (DIVAS study).
E3/E3 (n = 107)E4 Carriers (E3/E4 and E4/E4, n = 52) p Value 1
SFAMUFAn-6 PUFASFAMUFAn-6 PUFAGenotypeDiet × Genotype
N353636171718
Age, y44 ± 142 ± 243 ± 244 ± 346 ± 347 ± 3
BMI, kg/m225.8 ± 0.826.5 ± 0.826.9 ± 0.627.5 ± 0.926.1 ± 1.025.9 ± 0.8
Biochemical profile and estimates of insulin sensitivity/resistance
TC, mmol/L0.42 ± 0.10−0.03 ± 0.13−0.01 ± 0.130.21 ± 0.19−0.29 ± 0.17−0.19 ± 0.200.1650.760
HDL-C, mmol/L0.06 ± 0.030.04 ± 0.030.12 ± 0.040.03 ± 0.05−0.05 ± 0.05−0.02 ± 0.070.0150.473
LDL-C, mmol/L0.35 ± 0.09−0.09 ± 0.11−0.11 ± 0.100.17 ± 0.15−0.19 ± 0.15−0.18 ± 0.140.4010.984
TC: HDL-C ratio0.20 ± 0.08−0.11 ± 0.07−0.25 ± 0.070.01 ± 0.13−0.13 ± 0.17−0.05 ± 0.080.7030.263
LDL-C: HDL-C ratio0.19 ± 0.08−0.12 ± 0.07−0.23 ± 0.070.02 ± 0.11−0.10 ± 0.15−0.07 ± 0.080.6520.324
TAG, mmol/L−0.00 ± 0.050.10 ± 0.06 a−0.07 ± 0.050.06 ± 0.14−0.23 ± 0.10 b0.08 ± 0.180.1600.010
NEFA, µmol/L−17.6 ± 35.1−13.6 ± 22.1−11.1 ± 21.5−64.8 ± 40.246.5 ± 66.387.7 ± 26.20.4130.082
Glucose, mmol/L0.04 ± 0.050.07 ± 0.040.10 ± 0.060.08 ± 0.090.01 ± 0.060.01 ± 0.110.9570.614
Insulin, pmol/L1.10 ± 2.731.23 ± 1.862.67 ± 2.310.97 ± 2.770.49 ± 1.550.71 ± 1.670.8510.857
HOMA-IR0.07 ± 0.110.05 ± 0.080.12 ± 0.100.05 ± 0.120.03 ± 0.070.06 ± 0.070.8210.930
rQUICKI0.00 ± 0.01−0.00 ± 0.01−0.01 ± 0.010.00 ± 0.01−0.01 ± 0.01−0.02 ± 0.010.6200.420
Vascular function
%FMD response−0.55 ± 0.330.33 ± 0.44−0.09 ± 0.36−0.40 ± 0.49−0.20 ± 0.69−0.95 ± 0.730.9180.368
LDI 2
 LDI-Ach AUC, PU−460.3 ± 198.1−2.1 ± 154.691.1 ± 119.938.5 ± 164.6−40.7 ± 232.8−115.4 ± 142.20.4380.134
 LDI-SNP AUC, PU−283 ± 173−187 ± 158131 ± 127−28 ± 212−296 ± 287187 ± 1740.2330.601
DVP-RI, %−1.98 ± 2.344.33 ± 2.574.29 ± 2.27−0.27 ± 2.571.47 ± 1.91−4.92 ± 3.520.0780.171
DVP-SI, m/s0.23 ± 0.320.76 ± 0.310.22 ± 0.370.37 ± 0.37−0.15 ± 0.32−0.93 ± 0.430.1250.562
Ambulatory blood pressure 3
24-h blood pressure
 SBP, mm Hg1.7 ± 1.3−1.1 ± 1.30.2 ± 1.80.5 ± 2.7−0.9 ± 2.4−1.3 ± 2.00.6810.860
 DBP, mm Hg1.6 ± 0.9−0.4 ± 0.9−0.3 ± 1.11.1 ± 1.90.9 ± 1.7−1.4 ± 1.30.9210.813
 Pulse pressure, mm Hg0.2 ± 1.4−0.7 ± 0.80.6 ± 1.0−0.6 ± 1.1−1.7 ± 1.40.1 ± 1.50.5020.974
 Heart rate, bpm0.8 ± 1.00.7 ± 1.10.6 ± 1.12.8 ± 1.31.9 ± 1.8−1.6 ± 1.60.5650.292
Biomarkers of inflammation and endothelial activation
C-reactive protein, mg/L0.60 ± 0.600.04 ± 0.280.024 ± 0.51−0.14 ± 1.14−0.25 ± 0.57−0.79 ± 0.630.0360.786
NOx, µmol/L0.51 ± 3.22−1.89 ± 1.52−1.78 ± 1.871.70 ± 3.484.43 ± 2.97−2.27 ± 1.620.2080.073
sVCAM-1, ng/mL−40.0 ± 16.811.4 ± 22.22.3 ± 13.6−2.1 ± 16.23.9 ± 35.425.1 ± 25.20.0630.451
sICAM-1, ng/mL−1.4 ± 4.21.3 ± 3.61.5 ± 6.35.2 ± 6.615.3 ± 8.212.8 ± 5.10.1000.836
E-selectin, ng/mL0.41 ± 1.39−2.90 ± 1.15−0.63 ± 1.030.70 ± 2.01−3.03 ± 1.86−0.24 ± 1.430.8270.881
P-selectin, ng/mL−0.94 ± 1.70−1.94 ± 1.06−3.49 ± 1.233.63 ± 1.74−1.18 ± 2.320.21 ± 1.440.0260.403
Values represent mean ± SEM, change from baseline after post intervention (week 16). Total n = 131–157, with n = 89–107 E3/E3 and n = 4252 E4 carriers per outcome. E2/E4 and E2 = E2/E2 + E2/E3 individuals were excluded from the analysis. 1 Data analysed by univariate general linear model (ANCOVA) by using the difference from baseline (post-intervention (Visit 2) minus baseline (Visit 1)) as the dependent variable, with genotype, sex and intervention diet as fixed factors and with baseline data for the variable of interest, age and BMI as covariates. The interaction term was added to the model to assess the APOE genotype and diet interaction. a,b Different superscript letters within a row indicate significant differences between genotype groups (p ≤ 0.017). 2 LDI-Ach and LDI-SNP were expressed as area under the curve (AUC) for the 20-scan protocol. Incremental AUC (IAUC) was also determined for the 20-scan protocol but differences between test fats for subsequent AUC and IAUC were not significant (data not shown). 3 Day and night ambulatory blood pressure were analysed and no significant effects were found (data not shown). Abbreviations: Ach, acetylcholine; PU, perfusion units; AUC, area under the curve, BMI, body mass index; DBP, diastolic blood pressure; DVP-RI, digital volume pulse reflection index; DVP-SI, digital volume pulse stiffness index; DIVAS, Dietary Intervention and vascular function; FMD, flow mediated dilatation; HDL-C, high-density lipoprotein cholesterol; HOMA, quantitative insulin resistance index; LDI, laser Doppler imaging; LDL-C, low-density lipoprotein cholesterol; MUFA, monounsaturated fatty acids; NEFA, non-esterified fatty acid; NOx, total nitrites and nitrates; PUFA, polyunsaturated fatty acids; rQUICKI, revised quantitative insulin sensitivity index; SBP, systolic blood pressure; SFA, saturated fatty acids; sICAM-1, soluble intercellular cell adhesion molecule 1; SNP, sodium nitroprusside; sVCAM-1, soluble vascular cell adhesion molecule 1; TAG, triacylglycerol; TC, total cholesterol.
Table 3. Summary measures for the impact of the APOE genotype on postprandial cardiometabolic risk markers after sequential meals of varying fat composition (DIVAS-2 study).
E3/E3 (n = 22)E3/E4 (n = 5)p Value 1
SFAMUFAn-6 PUFASFAMUFAn-6 PUFAGenotypeTest Fat × Genotype
Biochemical measures 2
TAG, mmol/L
 AUC942 ± 901022 ± 871035 ± 1241063 ± 1861022 ± 1641125 ± 2990.7020.683
 IAUC320 ± 52360 ± 53361 ± 77402 ± 94403 ± 126386 ± 1150.7020.828
NEFA, μmol/L
 AUC143.5 ± 8.4136.1 ± 11.3126.9 ± 7.3108.6 ± 16.1102.4 ± 13.3116.9 ± 21.10.1470.382
 IAUC−73.5 ± 12.3−87.9 ± 12.7−83.7 ± 12.7−75.2 ± 29.6−12.6 ± 16.9−62.0 ± 29.80.8020.111
Apo B, mg/mL
 AUC473 ± 18469 ± 22480 ± 25549 ± 32561 ± 50512 ± 340.3290.134
 IAUC62.4 ± 4.350.7 ± 3.2−12.4 ± 5.2−11.6 ± 2.5−23.3 ± 9.831.3 ± 8.30.1970.022 3
Glucose, mmol/L
 AUC942 ± 901022 ± 871035 ± 1241063 ± 1861022 ± 1641125 ± 2990.6660.299
 IAUC320 ± 52360 ± 53361 ± 77402 ± 94403 ± 126386 ± 1150.3420.523
Insulin, μmol/L
 AUC913 ± 8877 ± 11821 ± 9948 ± 19951 ± 15952 ± 180.6400.814
 IAUC881 ± 8831 ± 9779 ± 6795 ± 16783 ± 12753 ± 140.6100.750
Vascular function 2
% FMD response
 AUC1939 ± 1482305 ± 1912131 ± 1912105 ± 2352629 ± 4862329 ± 2180.5100.898
 IAUC−149 ± 183156 ± 261114 ± 189345 ± 335431 ± 27979 ± 2810.4330.683
LDI-Ach 4, AU × 103
 AUC 742 ± 47766 ± 56772 ± 50871 ± 101973 ± 320941 ± 1600.8880.931
 IAUC7.8 ± 35.1−8.1 ± 62.2−11.0 ± 53.9−46.4 ± 101.6−70.0 ± 132.3−21.8 ± 127.90.0880.975
LDI-SNP 4, AU × 103
 AUC755 ± 57807 ± 66652 ± 33802 ± 99957 ± 264113 ± 2270.6900.083
 IAUC318 ± 60−101 ± 59−331 ± 61−118 ± 74−286 ± 117−505 ± 1710.7540.624
DVP-RI, % × 103
 AUC26.1 ± 1.024.7 ± 0.725.5 ± 0.925.9 ± 0.827.6 ± 1.527.1 ± 2.70.4070.392
 IAUC−1.7 ± 0.8−3.2 ± 0.7−2.4 ± 0.6−3.3 ± 0.91.2 ± 0.70.2 ± 1.00.0550.030 3
DVP-SI, m/s
 AUC3193 ± 1213074 ± 1103169 ± 1143463 ± 1783505 ± 2773617 ± 4150.1770.735
 IAUC14.6 ± 97.6−181.2 ± 110.140.5 ± 120.4171.3 ± 178.4−44.0 ± 241.3226.5 ± 154.40.3730.987
SBP, mmHg × 103
 AUC56.3 ± 1.557.1 ± 1.457.1 ± 1.658.9 ± 3.556.7 ± 2.558.3 ± 3.50.7160.267
 IAUC−2.5 ± 0.6−4.8 ± 0.6−3.3 ± 0.7−3.6 ± 0.7−3.2 ± 1.5−4.2 ± 1.00.9140.178
DBP, mmHg × 103
 AUC32.9 ± 3.333.1 ± 3.333.3 ± 3.332.9 ± 1.231.9 ± 1.032.0 ± 1.40.6860.341
 IAUC−1.1 ± 0.4−2.2 ± 0.3−1.5 ± 0.3−1.0 ± 0.6−1.7 ± 0.3−9.7 ± 0.70.4420.867
Biomarkers of endothelial activation 2
NOx, μmol/L
 AUC5820 ± 4825962 ± 7085119 ± 3896308 ± 2586278 ± 2586084 ± 13300.2880.996
 IAUC−1618 ± 231−1446 ± 370−1057 ± 219−2165 ± 521−3015 ± 695−1762 ± 3930.0780.318
sVCAM-1, µg/mL
 AUC 263.0 ± 7.1270.7 ± 9.2256.9 ± 7.3263.4 ± 22.2243.0 ± 14.6243.5 ± 16.40.4310.118
 IAUC4.2 ± 5.03.1 ± 4.6−4.7 ± 2.93.9 ± 4.9−8.5 ± 9.2−9.6 ± 8.10.3600.707
sICAM-1, µg/mL
 AUC86.3 ± 3.1876.9 ± 3.8702.5 ± 5.7715.3 ± 3.5717.9 ± 2.9588.9 ± 6.10.1410.775
 IAUC−3.2 ± 1.3−0.2 ± 1.5−18.1 ± 4.10.4 ± 6.40.6 ± 2.5−15.9 ± 10.00.5810.881
E-selectin, µg/mL
 AUC 10.7 ± 0.911.0 ± 0.910.6 ± 0.811.4 ± 1.611.9 ± 1.510.6 ± 1.60.6940.407
 IAUC−0.4 ± 0.3−0.01 ± 0.2−0.2 ± 0.1−0.3 ± 0.30.6 ± 0.40.5 ± 0.010.0650.472
P-selectin, µg/mL
 AUC13.0 ± 0.713.0 ± 0.913.1 ± 0.814.7 ± 1.816.5 ± 2.914.8 ± 2.10.3000.131
 IAUC−0.6 ± 0.30.01 ± 0.2−0.01 ± 0.3−0.07 ± 0.01.3 ± 1.30.3 ± 0.40.0780.737
Values are mean ± SEM, for the E3/E3 and E3/E4 groups. E2 carriers and E2/E4 individuals were excluded from the analysis. 1 p value refers to the interaction between summary measures and the APOE genotype. A mixed factor repeated measures ANOVA determined the effects of the test fats on summary measures. For this, test fat and time were included as within-subject factors and genotype as the between group factor. 2 Units for AUC and IAUC expressed as biomarker units × time interval. The time interval for AUC and IAUC represents 480 min for TAG, apoB, glucose and insulin; 120–480 min for NEFA; 420 min for FMD and biomarkers of endothelial activation; 450 min for DBP, SBP, DVP-SI, DVP-RI and LDI. 3 For significant test fat × genotype interactions, independent samples t-test was performed to identify the effects of genotype for each test fat separately. 4 LDI-Ach and LDI-SNP were expressed as AUC for the 20-scan protocol. IAUC was also determined for the 20-scan protocol but differences between test fats for subsequent AUC and IAUC were not significant (data not shown). Abbreviations: Ach, acetylcholine; apoB, apolipoprotein B; AU, arbitrary units; AUC, area under the curve; DBP, diastolic blood pressure; DIVAS, Dietary Intervention and vascular function; DVP, digital volume pulse; DVP-RI, DVP-reflection index; DVP-SI, DVP-stiffness index; FMD, flow mediated dilatation; IAUC, incremental AUC; LDI, laser Doppler imaging; NEFA, non-esterified fatty acids; NOx, total nitrite and nitrate concentrations; SBP, systolic blood pressure; sICAM-1, soluble intercellular cell adhesion molecule-1; SNP, sodium nitroprusside; sVCAM-1, soluble vascular cell adhesion molecule-1.

