The Clinical Importance of 21-Day Combined Parenteral and Enteral Nutrition in Active Inflammatory Bowel Disease Patients

 ,
,
Abstract
:
1. Introduction
2. Materials and Methods
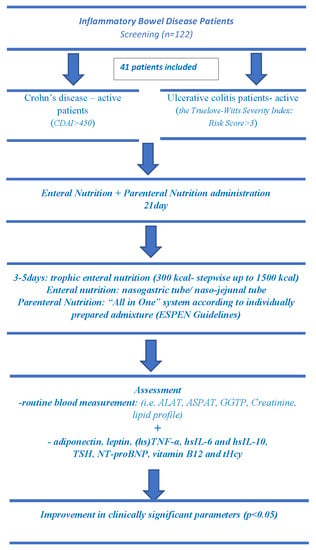
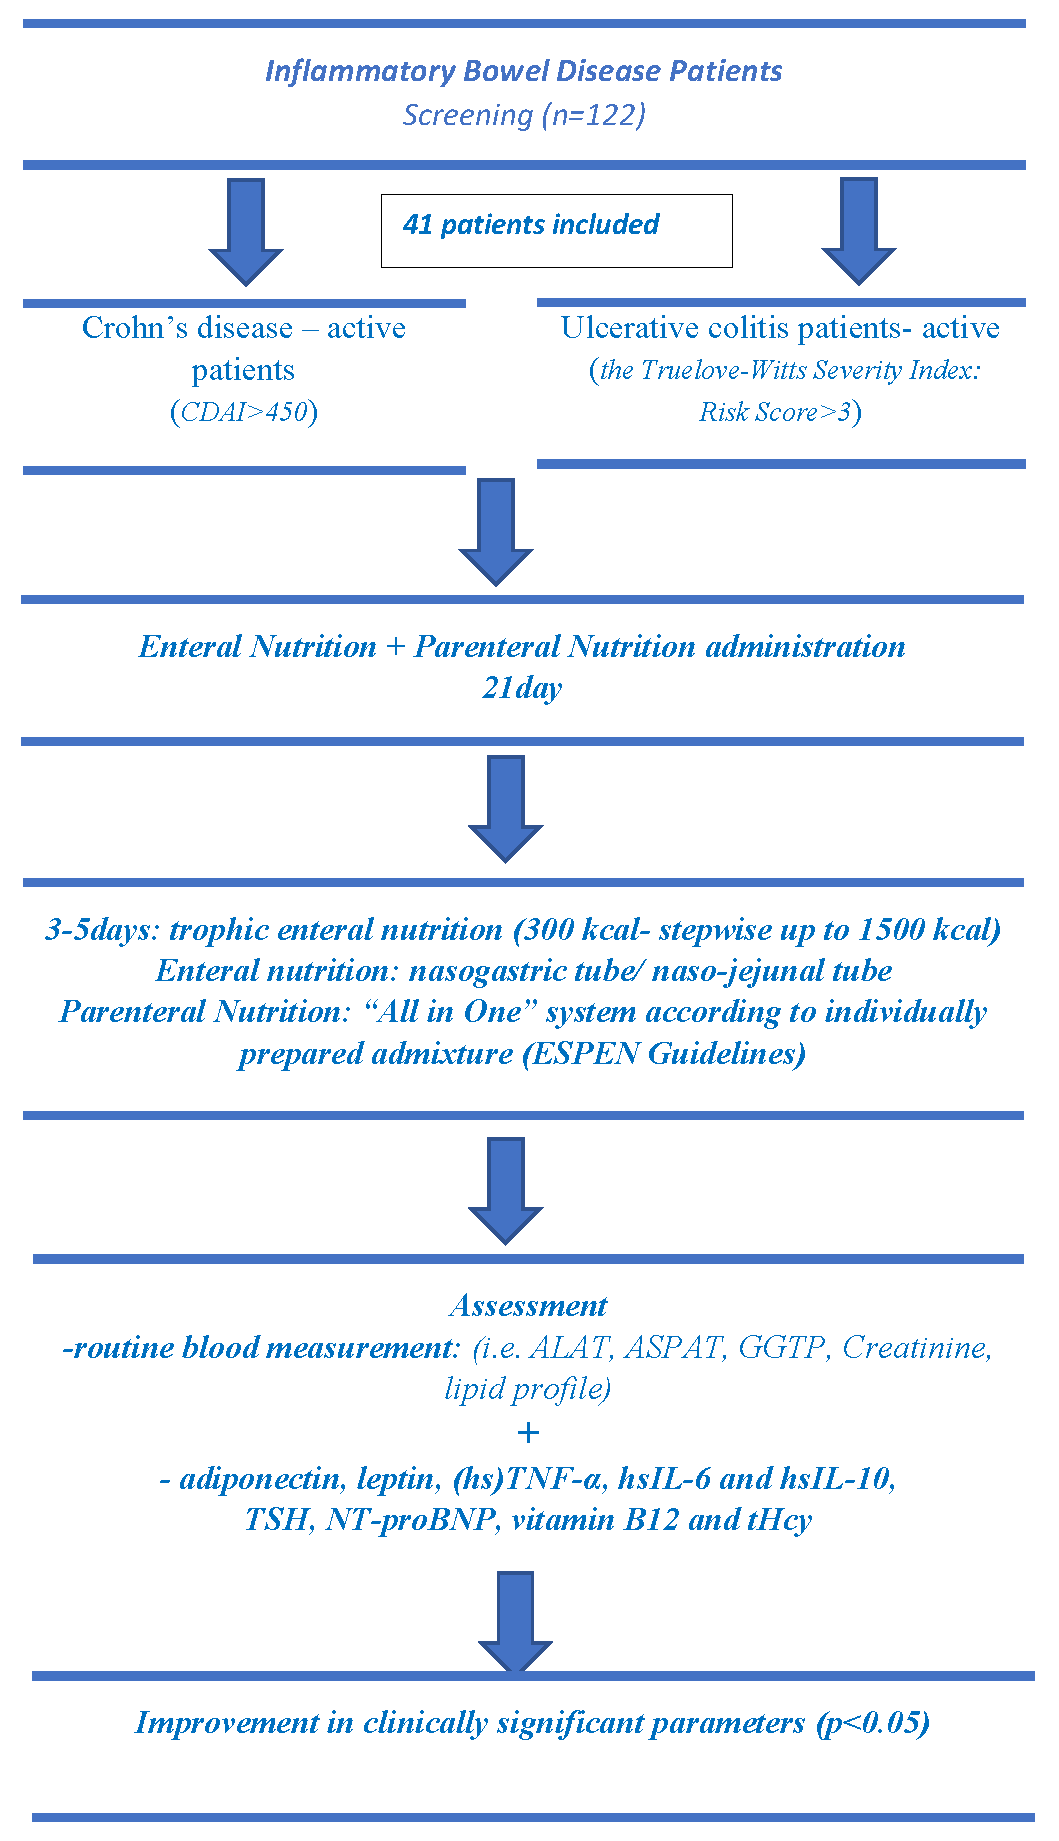
2.1. Study Design and Patients
2.2. Pharmacological Treatment, Enteral and Parenteral Nutrition
2.3. Anthropometry and Biochemical Assessment
2.4. Statistical Analysis
3. Results
4. Discussion
5. Conclusions
Author Contributions
Funding
Acknowledgments
Conflicts of Interest
References
- Sökülmez, P.; Demirbağ, A.E.; Arslan, P.; Dişibeyaz, S. Effects of enteral nutritional support on malnourished patients with inflammatory bowel disease by subjective global assessment. Turk J. Gastroenterol. 2014, 25, 493–507. [Google Scholar] [CrossRef] [PubMed]
- Yoon, S.R.; Lee, J.H.; Lee, J.H.; Na, G.Y.; Lee, K.H.; Lee, Y.B.; Jung, G.H.; Kim, O.Y. Low-FODMAP formula improves diarrhea and nutritional status in hospitalized patients receiving enteral nutrition: A randomized, multicenter, double-blind clinical trial. Nutr. J. 2015, 14, 116. [Google Scholar] [CrossRef] [PubMed]
- Sugihara, K.; Morhardt, T.L.; Kamada, N. The Role of Dietary Nutrients in Inflammatory Bowel Disease. Front. Immunol. 2019, 9, 31–83. [Google Scholar] [CrossRef] [PubMed]
- Gassull, M.A.; Fernández-Bañares, F.; Cabré, E.; Papo, M.; Giaffer, M.H.; Sánchez-Lombraña, J.L.; Richart, C.; Malchow, H.; González-Huix, F.; Esteve, M. Eurpoean Group on Enteral Nutrition in Crohn’s Disease. Fat composition may be a clue to explain the primary therapeutic effect of enteral nutrition in Crohn’s disease: Results of a double blind randomised multicenter European trial. Gut 2002, 51, 164–168. [Google Scholar] [CrossRef] [PubMed]
- Yamamoto, T.; Shimoyama, T.; Kuriyama, M. Dietary and enteral interventions for Crohn’s disease. Curr. Opin. Biotechnol. 2017, 44, 69–73. [Google Scholar] [CrossRef] [PubMed]
- Forbes, A.; Escher, J.; Hébuterne, X.; Kłęk, S.; Krznaric, Z.; Schneider, S.; Shamir, R.; Stardelova, K.; Wierdsma, N.; Wiskin, A.E.; et al. ESPEN guideline: Clinical nutrition in inflammatory bowel disease. Clin. Nutr. 2017, 36, 321–347. [Google Scholar] [CrossRef]
- Abad-Lacruz, A.; Gonzalez-Huix, F.; Esteve, M.; Fernández-Bañares, F.; Cabré, E.; Boix, J.; Acero, D.; Humbert, P.; Gassull, M.A. Liver Function Tests Abnormalities in Patients with Inflammatory Bowel Disease Receiving Artificial Nutrition: A Prospective Randomized Study of Total Enteral Nutrition vs Total Parenteral Nutrition. J. Parenter. Enter. Nutr. 1990, 14, 618–621. [Google Scholar] [CrossRef]
- Accinni, R.; Bartesaghi, S.; De Leo, G.; Cursano, C.F.; Achilli, G.; Loaldi, A.; Cellerino, C.; Parodi, O. Screening of homocysteine from newborn blood spots by high-performance liquid chromatography with coulometric array detection. J. Chromatogr. A 2000, 896, 183–189. [Google Scholar] [CrossRef]
- Friedewald, W.T.; Levy, R.I.; Fredrickson, D.S. Estimation of the concentration of low-density lipoprotein cholesterol in plasma, without use of the preparative ultracentrifuge. Clin. Chem. 1972, 18, 499–502. [Google Scholar]
- Ford, E.S.; Mokdad, A.H.; Giles, W.H.; Mensah, G.A. Serum total cholesterol concentrations and awareness, treatment, and control of hypercholesterolemia among US adults: Findings from the National Health and Nutrition Examination Survey, 1999 to 2000. Circulation 2003, 107, 2185–2189. [Google Scholar] [CrossRef]
- American Diabetes Association. Diagnosis and classification of diabetes mellitus. Diabetes Care 2014, 37, 81–89. [Google Scholar] [CrossRef] [PubMed]
- Vagianos, K.; Bector, S.; McConnell, J.; Bernstein, C.N. Nutrition Assessment of Patients with Inflammatory Bowel Disease. J. Parenter. Enter. Nutr. 2007, 31, 311–319. [Google Scholar] [CrossRef] [PubMed]
- Lochs, H.; Steinhardt, H.J.; Klaus-Wentz, B.; Zeitz, M.; Vogelsang, H.; Sommer, H.; Fleig, W.E.; Bauer, P.; Schirrmeister, J.; Malchow, H. Comparison of enteral nutrition and drug treatment in active Crohn’s disease: results of the European Cooperative Crohn’s Disease Study IV. Gastroenterology 1991, 101, 881–888. [Google Scholar] [CrossRef]
- Sakurai, T.; Matsui, T.; Yao, T.; Takagi, Y.; Hirai, F.; Aoyagi, K.; Okada, M. Short-term efficacy of enteral nutrition in the treatment of active Crohn’s disease: A randomized, controlled trial comparing nutrient formulas. J. Parenter. Enter. Nutr. 2002, 26, 98–103. [Google Scholar] [CrossRef] [PubMed]
- Khoshoo, V.; Reifen, R.; Neuman, M.G.; Griffiths, A.; Pencharz, P.B. Effect of Low- and High-Fat, Peptide-Based Diets on Body Composition and Disease Activity in Adolescents with Active Crohn’s Disease. J. Parenter. Enter. Nutr. 1996, 20, 401–405. [Google Scholar] [CrossRef] [PubMed]
- Verma, S.; Holdsworth, C.D.; Giaffer, M.H. Does Adjuvant Nutritional Support Diminish Steroid Dependency in Crohn Disease? Scand. J. Gastroenterol. 2001, 36, 383–388. [Google Scholar] [CrossRef] [PubMed]
- Verma, S.; Brown, S.; Kirkwood, B.; Giaffer, M. Polymeric versus elemental diet as primary treatment in active Crohn’s disease: A randomized, double-blind trial. Am. J. Gastroenterol. 2000, 95, 735–739. [Google Scholar] [CrossRef] [PubMed]
- Rigaud, D.; Cosnes, J.; Le Quintrec, Y.; Rene, E.; Gendre, J.P.; Mignon, M. Controlled trial comparing two types of enteral nutrition in treatment of active Crohn’s disease: Elemental versus polymeric diet. Gut 1991, 32, 1492–1497. [Google Scholar] [CrossRef]
- González-Huix, F.; Fernández-Bañares, F.; Esteve-Comas, M.; Abad-Lacruz, A.; Cabré, E.; Acero, D.; Figa, M.; Guilera, M.; Humbert, P.; de León, R.; et al. Enteral versus parenteral nutrition as adjunct therapy in acute ulcerative colitis. Am. J. Gastroenterol. 1993, 88, 227–232. [Google Scholar]
- Wright, R.A.; Adler, E.C. Peripheral parenteral nutrition is no better than enteral nutrition in acute exacerbation of Crohn’s disease: A prospective trial. J. Clin. Gastroenterol. 1990, 12, 396–399. [Google Scholar] [CrossRef]
- Cavallaro, F.; Duca, L.; Pisani, L.F.; Rigolini, R.; Spina, L.; Tontini, G.E.; Munizio, N.; Costa, E.; Cappellini, M.D.; Vecchi, M.; et al. Anti-TNF-Mediated Modulation of Prohepcidin Improves Iron Availability in Inflammatory Bowel Disease, in an IL-6-Mediated Fashion. Can. J. Gastroenterol. Hepatol. 2017, 2017, 1–12. [Google Scholar] [CrossRef] [PubMed]
- Bähler, C.; Schoepfer, A.M.; Vavricka, S.R.; Brüngger, B.; Reich, O. Chronic comorbidities associated with inflammatory bowel disease: Prevalence and impact on healthcare costs in Switzerland. Eur. J. Gastroenterol. Hepatol. 2017, 29, 916–925. [Google Scholar] [CrossRef] [PubMed]
- Blumenstein, I.; Dignass, A.; Vollmer, S.; Klemm, W.; Weber-Mangal, S.; Stein, J. Current practice in the diagnosis and management of IBD-associated anaemia and iron deficiency in Germany: The German AnaemIBD Study. J. Crohn’s Colitis 2014, 8, 1308–1314. [Google Scholar] [CrossRef] [PubMed]
- Stein, J.; Bager, P.; Befrits, R.; Gasche, C.; Gudehus, M.; Lerebours, E.; Magro, F.; Mearin, F.; Mitchell, D.; Oldenburg, B.; et al. Anaemia management in patients with inflammatory bowel disease: Routine practice across nine European countries. Eur. J. Gastroenterol. Hepatol. 2013, 25, 1456–1463. [Google Scholar] [CrossRef] [PubMed]
- Vidarsdottir, J.B.; Johannsdottir, S.E.; Thorsdottir, I.; Bjornsson, E.; Ramel, A. A cross-sectional study on nutrient intake and -status in inflammatory bowel disease patients. Nutr. J. 2016, 15, 61. [Google Scholar] [CrossRef] [PubMed]
- Vagianos, K.; Clara, I.; Carr, R.; Graff, L.A.; Walker, J.R.; Targownik, L.E.; Lix, L.M.; Rogala, L.; Miller, N.; Bernstein, C.N. What Are Adults with Inflammatory Bowel Disease (IBD) Eating? A Closer Look at the Dietary Habits of a Population-Based Canadian IBD Cohort. JPEN J. Parenter. Enter. Nutr. 2016, 40, 405–411. [Google Scholar] [CrossRef]
- Yakut, M.; Üstün, Y.; Kabacam, G.; Soykan, I. Serum vitamin B12 and folate status in patients with inflammatory bowel diseases. Eur. J. Intern. Med. 2010, 21, 320–323. [Google Scholar] [CrossRef]
- Battat, R.; Kopylov, U.; Byer, J.; Sewitch, M.J.; Rahme, E.; Nedjar, H.; Zelikovic, E.; Dionne, S.; Bessissow, T.; Afif, W.; et al. Vitamin B12 deficiency in inflammatory bowel disease: A prospective observational pilot study. Eur. J. Gastroenterol. Hepatol. 2017, 29, 1361–1367. [Google Scholar] [CrossRef]
- Mahmood, A.; Needham, J.; Prosser, J.; Mainwaring, J.; Trebble, T.; Mahy, G.; Ramage, J. Prevalence of hyperhomocysteinaemia, activated protein C resistance and prothrombin gene mutation in inflammatory bowel disease. Eur. J. Gastroenterol. Hepatol. 2005, 17, 739–744. [Google Scholar] [CrossRef]
- Romagnuolo, J.; Fedorak, R.N.; Dias, V.C.; Bamforth, F.; Teltscher, M. Hyperhomocysteinemia and inflammatory bowel disease: Prevalence and predictors in a cross-sectional study. Am. J. Gastroenterol. 2001, 96, 2143–2149. [Google Scholar] [CrossRef]
- Chen, M.; Mei, Q.; Xu, J.; Lu, C.; Fang, H.; Liu, X. Detection of melatonin and homocysteine simultaneously in ulcerative colitis. Clin. Chim. Acta 2012, 413, 30–33. [Google Scholar] [CrossRef] [PubMed]
- Morshedzadeh, N.; Rahimlou, M.; Asadzadeh Aghdaei, H.; Shahrokh, S.; Reza Zali, M.; Mirmiran, P. Association Between Adipokines Levels with Inflammatory Bowel Disease (IBD): Systematic Reviews. Dig. Dis. Sci. 2017, 62, 3280–3286. [Google Scholar] [CrossRef] [PubMed]
- Karmiris, K.; Koutroubakis, I.E.; Kouroumalis, E.A. Leptin, adiponectin, resistin, and ghrelin—Implications for inflammatory bowel disease. Mol. Nutr. Food Res. 2008, 52, 855–866. [Google Scholar] [CrossRef] [PubMed]
- Schoepfer, A.M.; Vavricka, S.; Zahnd-Straumann, N.; Straumann, A.; Beglinger, C. Monitoring inflammatory bowel disease activity: Clinical activity is judged to be more relevant than endoscopic severity or biomarkers. J. Crohn’s Colitis 2012, 6, 412–418. [Google Scholar] [CrossRef] [PubMed]
- Sullivan, S.; Alex, P.; Dassopoulos, T.; Zachos, N.C.; Iacobuzio-Donahue, C.; Donowitz, M.; Brant, S.R.; Cuffari, C.; Harris, M.L.; Datta, L.W.; et al. Down-Regulation of Sodium Transporters and NHERF Proteins in IBD Patients and Mouse Colitis Models: Potential Contributors to IBD-associated Diarrhea. Inflamm. Bowel Dis. 2009, 15, 261–274. [Google Scholar] [CrossRef] [PubMed]
- Cai, Q.; Li, F.; Zhou, Y. Experiences of Chinese patients with Crohn’s disease in the self-administration of nasogastric feeding: A descriptive qualitative study. PLoS ONE 2018, 13, e0201421. [Google Scholar] [CrossRef]
- Takagi, S.; Utsunomiya, K.; Kuriyama, S.; Yokoyama, H.; Iwabuchi, M.; Takahashi, H.; Takahashi, S.; Kinouchi, Y.; Hiwatashi, N.; Funayama, Y.; et al. Effectiveness of an ‘half elemental diet’ as maintenance therapy for Crohn’s disease: A randomized-controlled trial. Aliment. Pharmacol. Ther. 2006, 24, 1333–1340. [Google Scholar] [CrossRef] [PubMed]
- Yamamoto, T.; Nakahigashi, M.; Umegae, S.; Matsumoto, K. Prospective clinical trial: Enteral nutrition during maintenance infliximab in Crohn’s disease. J. Gastroenterol. 2010, 45, 24–29. [Google Scholar] [CrossRef] [PubMed]
- Yamamoto, T.; Shiraki, M.; Nakahigashi, M.; Umegae, S.; Matsumoto, K. Enteral nutrition to suppress postoperative Crohn’s disease recurrence: A five-year prospective cohort study. Int. J. Colorectal Dis. 2013, 28, 335–340. [Google Scholar] [CrossRef]
- Chandler, M. Focus on nutrition: Dietary management of gastrointestinal disease. Compendium 2013, 35, E1–E3. [Google Scholar]
- Nie, Y.; Lin, Q.; Luo, F. Effects of Non-Starch Polysaccharides on Inflammatory Bowel Disease. Int. J. Mol. Sci. 2017, 18, 1372. [Google Scholar] [CrossRef] [PubMed]
- Basson, A.; Trotter, A.; Rodriguez-Palacios, A.; Cominelli, F. Mucosal Interactions between Genetics, Diet, and Microbiome in Inflammatory Bowel Disease. Front. Immunol. 2016, 7, 290. [Google Scholar] [CrossRef] [PubMed] [Green Version]
- Hou, J.K.; Lee, D.; Lewis, J. Diet and Inflammatory Bowel Disease: Review of Patient-Targeted Recommendations. Clin. Gastroenterol. Hepatol. 2014, 12, 1592–1600. [Google Scholar] [CrossRef] [PubMed]
- Ruemmele, F.M. Role of Diet in Inflammatory Bowel Disease. Ann. Nutr. Metab. 2016, 68, 33–41. [Google Scholar] [CrossRef] [PubMed]
- Pedersen, N.; Ankersen, D.V.; Felding, M.; Wachmann, H.; Végh, Z.; Molzen, L.; Burisch, J.; Andersen, J.R.; Munkholm, P. Low-FODMAP diet reduces irritable bowel symptoms in patients with inflammatory bowel disease. World J. Gastroenterol. 2017, 23, 3356–3366. [Google Scholar] [CrossRef] [PubMed]
- Kakodkar, S.; Mutlu, E.A. Diet as a therapeutic option for adult inflammatory bowel disease. Gastroenterol. Clin. N. Am. 2017, 46, 745–767. [Google Scholar] [CrossRef] [PubMed]
- Barbalho, S.M.; Goulart, R.D.A.; Aranão, A.L.D.C.; De Oliveira, P.G.C. Inflammatory Bowel Diseases and Fermentable Oligosaccharides, Disaccharides, Monosaccharides, and Polyols: An Overview. J. Med. Food 2018, 21, 633–640. [Google Scholar] [CrossRef] [PubMed]
- Elhusseiny, M.H.; Amine, A.K.E.; Salem, O.I.; Tayel, D.A.; Elsayed, E. Low FODMAP diet in Egyptian patients with Crohn’s disease in remission phase with functional gastrointestinal symptoms. JGH Open 2018, 2, 15–20. [Google Scholar] [CrossRef] [PubMed]
- Whelan, K.; Cox, S.R.; Prince, A.C.; Myers, C.E.; Irving, P.M.; Lindsay, J.O.; Lomer, M.C. Fermentable Carbohydrates [FODMAPs] Exacerbate Functional Gastrointestinal Symptoms in Patients with Inflammatory Bowel Disease: A Randomised, Double-blind, Placebo-controlled, Cross-over, Re-challenge Trial. J. Crohn’s Coliti 2017, 11, 1420–1429. [Google Scholar]

| Analyzed Factor | Study Group | Control Group | ||
|---|---|---|---|---|
| CD (n = 22) | UC (n = 19) | CD (n = 12) | UC (n = 12) | |
| Age of diagnosis (years) | ||||
| < 40 | 95.5 | 78.9 | 94.0 | 79.9 |
| > 40 | 4.5 | 21.1 | 6.0 | 20.1 |
| Duration of disease (%) | ||||
| < 1 year | 22.3 | 42 | 13.6 | 15.8 |
| 1–5 years | 45 | 36.82 | 31.8 | 21.1 |
| > 5 years | 32.7 | 21.2 | 9.1 | 26.3 |
| Previous surgery (%) | 22.0 | 0.0 | 9.1 | 0.0 |
| Crohn’s disease location (%) | ||||
| ileum | 18.2 | - | 4.5 | - |
| colon | 31.8 | - | 22.7 | - |
| ileo-colon | 45.5 | - | 27.2 | - |
| upper GI | 4.5 | - | 0.0 | - |
| Fistula occurrence (%) | ||||
| perianal | 18.2 | - | 2.0 | - |
| subcutaneus | 13.6 | - | 9.0 | - |
| Ulcerative colitis location (%) | ||||
| Proctitis | - | 0.0 | - | 0.0 |
| left sided colitis | - | 31.6 | - | 26.3 |
| pancolitis | - | 68.4 | - | 36.8 |
| Medical treatment before study entry (%) * | ||||
| Aminosalicylates | 99.9 | 100 | 100 | 100 |
| Corticosteroids | 54.5 | 52.6 | 75.0 | 66.7 |
| Analyzed Parameters | Group 1: Crohn’s Disease (n = 22) | Group 2: Ulcerative Colitis (n = 19) | Control Group Crohn’s Disease (n = 12) | Control Group Ulcerative Colitis (n = 12) | |||||||||
|---|---|---|---|---|---|---|---|---|---|---|---|---|---|
| Baseline | Intervention | p-Value | Baseline | Intervention | p-Value | Baseline | Intervention | p-Value | Baseline | Intervention | p-Value | p-Value Inter Group | |
| Mean ± SD | Mean ± SD | Mean ± SD | Mean ± SD | Mean ± SD | Mean ± SD | Mean ± SD | Mean ± SD | ||||||
| Leukocytes (103/µL) | 11.25 ± 6.61 | 7.68 ± 1.97 | 0.0156 | 11.06 ± 4.83 | 8.63 ± 2.69 | 0.1264 | 9.97 ± 4.26 | 9.02 ± 4.06 | 0.2439 | 10.59 ± 3.81 | 9.51 ± 3.87 | 0.2500 | 0.2439 |
| Neutrocytes (103/µL) | 8.56 ± 4.59 | 5.71 ± 1.75 | 0.0195 | 15.88 ± 21.18 | 6.68 ± 3.10 | 0.0136 | 8.32 ± 3.88 | 7.48 ± 3.64 | 0.0024 | 8.35 ± 3.86 | 7.75 ± 3.26 | 0.2031 | 0.3259 |
| Lymphocytes (103/µL) | 1.84 ± 1.64 | 1.37 ± 0.51 | 0.6553 | 2.71 ± 4.09 | 1.59 ± 0.67 | 0.4554 | 1.33 ± 0.79 | 1.47 ± 0.91 | 0.0266 | 1.40 ± 0.44 | 1.28 ± 0.41 | 0.9102 | 0.7815 |
| Fibrinogen (mg/dL) | 512.50 ± 153.50 | 334.40 ± 85.57 | < 0.0001 | 538.90 ± 127.10 | 360.20 ± 80.09 | < 0.0001 | 425.31 ± 59.33 | 405.93 ± 55.11 | 0.3054 | 396.00 ± 2.79 | 396.67 ± 93.30 | 0.8203 | 0.0527 |
| Hemoglobin (g/dL) | 9.66 ± 1.63 | 11.52 ± 1.83 | 0.0009 | 9.037 ± 1.97 | 10.76 ± 2.10 | 0.0227 | 11.67 ± 2.73 | 10.64 ± 2.76 | 0.0803 | 10.34 ± 2.16 | 10.19 ± 1.83 | 0.8201 | 0.3761 |
| Hematocrit (%) | 30.01 ± 4.61 | 34.33 ± 4.82 | 0.0172 | 28.51 ± 4.92 | 32.87 ± 4.89 | 0.0202 | 35.61 ± 7.27 | 32.53 ± 7.42 | 0.1465 | 31.18 ± 5.54 | 26.93 ± 9.28 | 0.4961 | 0.0724 |
| Erythrocytes (106/µL) | 3.31 ± 0.77 | 4.08 ± 0.66 | 0.0015 | 3.14 ± 1.08 | 3.82 ± 0.54 | 0.0285 | 4.29 ± 0.87 | 3.89 ± 0.88 | 0.0866 | 3.67 ± 0.52 | 3.48 ± 0.59 | 0.0977 | 0.1577 |
| Mean corpuscular volume (fL) | 84.97 ± 8.41 | 83.82 ± 14.72 | 0.8233 | 84.86 ± 7.20 | 83.16 ± 13.98 | 0.7259 | 82.50 ± 6.73 | 83.48 ± 7.54 | 0.2253 | 85.66 ± 10.48 | 86.83 ± 9.95 | 0.1953 | 0.9061 |
| Platelet count (103/µL) | 430.40 ± 143.00 | 377.20 ± 90.30 | 0.2648 | 593.60 ± 253.60 | 398.50 ± 129.10 | 0.0069 | 396.15 ± 133.61 | 349.79 ± 119.03 | 0.1855 | 432.11 ± 171.81 | 413.67 ± 200.01 | 0.4961 | 0.6332 |
| Analyzed Parameters | Group 1: Crohn’s Disease (n = 22) | Group 2: Ulcerative Colitis (n = 19) | Control Group Crohn’s Disease (n = 12) | Control Group Ulcerative Colitis (n = 12) | |||||||||
|---|---|---|---|---|---|---|---|---|---|---|---|---|---|
| Baseline | Intervention | p-Value | Baseline | Intervention | p-Value | Baseline | Intervention | p-Value | Baseline | Intervention | p-Value | p-Value Inter Group | |
| Mean ± SD | Mean ± SD | Mean ± SD | Mean ± SD | Mean ± SD | Mean ± SD | Mean ± SD | Mean ± SD | ||||||
| TSH (µU/mL) | 2.29 ± 1.86 | 2.28 ± 0.44 | 0.0948 | 1.77 ± 1.00 | 1.98 ± 0.56 | 0.0171 | 1.86 ± 0.64 | 2.08 ± 0.59 | 0.1087 | 1.67 ± 0.30 | 1.83 ± 0.23 | 0.0078 | 0.0365 |
| Leptin (pg/mL) | 0.88 ± 1.19 | 2.97 ± 2.26 | <0.0001 | 2.33 ± 6.34 | 4.14 ± 4.53 | 0.0005 | 1.85 ± 0.95 | 1.71 ± 0.93 | 0.3832 | 1.95 ± 0.70 | 2.17 ± 1.05 | 0.1484 | 0.0450 |
| Adiponectin (µg/mL) | 7.22 ± 2.16 | 4.35 ± 2.22 | <0.0001 | 7.57 ± 4.21 | 4.81 ± 1.93 | 0.0111 | 5.10 ± 1.78 | 4.51 ± 1.91 | 0.0037 | 6.07 ± 2.32 | 5.72 ± 2.12 | 0.0273 | 0.3979 |
| NT-proBNP (pg/mL) | 289.10 ± 337.40 | 53.91 ± 32.97 | 0.0001 | 339.10 ± 623.80 | 62.37 ± 28.37 | 0.0015 | 391.61 ± 234.46 | 345.46.220.38 | 0.0012 | 318.33 ± 215.27 | 304.11 ± 232.27 | 0.5703 | < 0.0001 |
| Bilirubin (mg/dL) | 0.29 ± 0.15 | 0.41 ± 0.19 | 0.0345 | 0.33 ± 0.21 | 0.44 ± 0.26 | 0.2609 | 0.38 ± 0.18 | 0.32 ± 0.18 | 0.3828 | 0.72 ± 0.75 | 0.60 ± 0.72 | 0.3125 | 0.5532 |
| ALAT (U/L) | 13.18 ± 9.68 | 22.59 ± 13.42 | 0.0019 | 25.79 ± 26.85 | 26.79 ± 7.28 | 0.0106 | 25.46 ± 22.97 | 22.61 ± 22.52 | 0.3013 | 28.33 ± 26.96 | 18.67 ± 14.25 | 0.1563 | 0.0415 |
| ASPAT (U/L) | 20.59 ± 17.40 | 22.05 ± 11.64 | 0.0953 | 18.26 ± 10.40 | 24.89 ± 7.45 | 0.0101 | 20.85 ± 12.83 | 22.07 ± 14.16 | 0.9697 | 18.78 ± 13.03 | 13.89 ± 6.92 | 0.1094 | 0.0140 |
| GGTP (U/L) | 47.77 ± 6.49 | 54.82 ± 47.06 | 0.0618 | 39.42 ± 13.76 | 45.16 ± 14.00 | 0.0794 | 45.46 ± 26.01 | 56.92 ± 46.24 | 0.7869 | 34.00 ± 22.08 | 25.33 ± 11.59 | 0.0977 | 0.0503 |
| ALP (U/L) | 129.60 ± 13.39 | 102.50 ± 6.93 | 0.3299 | 87.84 ± 36.17 | 99.89 ± 17.19 | 0.0847 | 98.23 ± 40.23 | 102.92 ± 30 | 0.5879 | 69.56 ± 27.90 | 68.44 ± 30.80 | 0.8203 | 0.0507 |
| Urea (mg/dL) | 18.95 ± 8.78 | 24.73 ± 6.94 | 0.0070 | 21.21 ± 6.93 | 25.84 ± 4.34 | 0.0216 | 26.46 ± 11.38 | 20.23 ± 6.98 | 0.0171 | 24.56 ± 8.38 | 18.56 ± 6.19 | 0.0078 | 0.0034 |
| Creatinine (mg/dL) | 0.65 ± 0.30 | 0.65 ± 0.20 | 0.6047 | 0.60 ± 0.21 | 0.75 ± 0.16 | 0.0141 | 0.83 ± 0.25 | 0.64 ± 0.24 | 0.0015 | 0.83 ± 0.21 | 0.71 ± 0.16 | 0.0273 | 0.2478 |
| Uric Acid (mg/dL) | 3.26 ± 1.11 | 3.01 ± 0.62 | 0.3654 | 2.77 ± 1.14 | 3.10 ± 0.55 | 0.1245 | 4.25 ± 1.27 | 3.85 ± 1.43 | 0.0005 | 4.62 ± 1.41 | 4.11 ± 1.07 | 0.0039 | 0.0059 |
| Analyzed Parameters | Group 1: Crohn’s Disease (n = 22) | Group 2: Ulcerative Colitis (n = 19) | Control Group Crohn’s Disease (n = 12) | Control Group Ulcerative Colitis (n = 12) | |||||||||
|---|---|---|---|---|---|---|---|---|---|---|---|---|---|
| Baseline | Intervention | p-Value | Baseline | Intervention | p-Value | Baseline | Intervention | p-Value | Baseline | Intervention | p-Value | p-Value Inter Group | |
| Mean ± SD | Mean ± SD | Mean ± SD | Mean ± SD | Mean ± SD | Mean ± SD | Mean ± SD | Mean ± SD | ||||||
| Total protein (g/dL) | 5.99 ± 1.08 | 6.90 ± 0.93 | 0.0119 | 5.14 ± 0.65 | 6.72 ± 0.45 | < 0.0001 | 6.19 ± 1.22 | 5.52 ± 1.39 | 0.0002 | 6.40 ± 0.65 | 5.98 ± 0.86 | 0.0078 | 0.0054 |
| Albumin (g/dL) | 2.92 ± 0.67 | 3.74 ± 0.38 | < 0.0001 | 2.63 ± 0.47 | 3.69 ± 0.36 | < 0.0001 | 3.39 ± 0.89 | 3.00 ± 0.97 | 0.0002 | 3.63 ± 0.62 | 3.35 ± 0.65 | 0.0039 | 0.0028 |
| Pre-albumin (g/L) | 0.13 ± 0.07 | 0.34 ± 0.46 | 0.0005 | 0.13 ± 0.06 | 0.41 ± 0.77 | < 0.0001 | 0.13 ± 0.03 | 0.12 ± 0.03 | 0.0001 | 0.14 ± 0.03 | 0.12 ± 0.02 | 0.0039 | < 0.0001 |
| Fe (µg/dL) | 34.41 ± 19.42 | 56.73 ± 22.62 | 0.0002 | 24.21 ± 15.04 | 49.68 ± 21.34 | < 0.0001 | 42.43 ± 24.82 | 50.77 ± 22.36 | 0.4332 | 36.22 ± 15.19 | 42.67 ± 22.57 | 0.0977 | 0.0640 |
| TIBC (µg/dL) | 241.2 ± 96.49 | 261.90 ± 92.00 | 0.3477 | 220.60 ± 95.30 | 264.60 ± 70.79 | 0.1700 | 209.69 ± 98.92 | 202.69 ± 92.67 | 0.7910 | 216.44 ± 52.65 | 208.11 ± 70.38 | 0.5703 | 0.0828 |
| Vitamin B12 (pg/mL) | 262.20 ± 129.40 | 391.70 ± 181.70 | 0.0036 | 441.50 ± 131.90 | 454.30 ± 153.10 | 0.8838 | 331.23 ± 191.73 | 318.08 ± 176.24 | 0.2163 | 378.00 ± 152.23 | 366.11 ± 137.41 | 0.2031 | 0.1554 |
| Homocystein (µmol/L) | 16.87 ± 16.79 | 7.54 ± 2.82 | < 0.0001 | 10.92 ± 3.88 | 7.97 ± 3.72 | 0.0190 | 12.65 ± 1.74 | 11.53 ± 1.24 | 0.0134 | 12.60 ± 1.15 | 11.88 ± 1.10 | 0.0039 | 0.0005 |
| Glucose (mg/dL) | 87.36 ± 13.92 | 83.45 ± 7.94 | 0.5091 | 92.37 ± 16.84 | 86.16 ± 7.80 | 0.2136 | 91.23 ± 15.41 | 80.54 ± 10.51 | 0.0198 | 88.44 ± 12.24 | 90.22 ± 13.34 | 0.4258 | 0.2461 |
| TC (mg/dL) | 129.20 ± 40.02 | 157.40 ± 37.19 | 0.0195 | 130.90 ± 51.60 | 170.70 ± 30.25 | 0.0075 | 129.92 ± 40.17 | 126.00 ± 53.70 | 0.7354 | 139.00 ± 46.52 | 129.33 ± 32.97 | 0.8203 | 0.0018 |
| HDL-C (mg/dL) | 36.95 ± 16.18 | 46.68 ± 19.63 | 0.1156 | 40.68 ± 15.39 | 47.84 ± 15.22 | 0.3138 | 37.77 ± 20.59 | 35.00 ± 17.98 | 0.1272 | 39.89 ± 12.91 | 38.44 ± 10.09 | 0.4961 | 0.0914 |
| LDL-C (mg/dL) | 66.04 ± 31.03 | 85.32 ± 26.40 | 0.0120 | 72.56 ± 33.77 | 95.95 ± 27.22 | 0.0115 | 65.51 ± 28.11 | 69.23 ± 32.06 | 0.0574 | 61.82 ± 19.41 | 65.21 ± 20.42 | 0.2031 | 0.0274 |
| TG (mg/dL) | 104.70 ± 38.54 | 113.30 ± 39.59 | 0.5011 | 107.30 ± 36.07 | 139.50 ± 42.78 | 0.0136 | 104.62 ± 43.80 | 107.69 ± 40.86 | 0.6355 | 78.33 ± 22.52 | 78.22 ± 20.36 | 0.8203 | 0.0025 |
| Sodium (mmol/L) | 137.20 ± 3.13 | 140.90 ± 3.27 | 0.0006 | 129.00 ± 28.30 | 141.80 ± 1.58 | < 0.0001 | 137.85 ± 5.89 | 141.46 ± 2.79 | 0.0244 | 138.67 ± 3.24 | 141.44 ± 4.19 | 0.0182 | 0.9314 |
| Potassium (mmol/L) | 3.97 ± 0.70 | 4.48 ± 0.28 | 0.0009 | 3.76 ± 0.73 | 4.42 ± 0.23 | 0.0002 | 4.14 ± 0.44 | 3.99 ± 0.64 | 0.3396 | 4.28 ± 0.44 | 3.91 ± 0.66 | 0.0469 | 0.0255 |
| Calcium (mg/dL) | 8.23 ± 1.08 | 9.21 ± 0.40 | 0.0002 | 8.56 ± 0.61 | 9.15 ± 0.48 | 0.0027 | 8.35 ± 0.76 | 8.32 ± 0.48 | 0.6377 | 8.30 ± 1.49 | 8.24 ± 1.38 | 0.6470 | < 0.0001 |
| Magnesium (mg/dL) | 2.02 ± 0.27 | 3.54 ± 4.37 | < 0.0001 | 2.06 ± 0.20 | 2.66 ± 0.38 | < 0.0001 | 2.17 ± 0.63 | 2.04 ± 0.53 | 0.1514 | 2.06 ± 0.34 | 1.83 ± 0.31 | 0.0005 | < 0.0001 |
| Phosphates (mg/dL) | 3.41 ± 0.70 | 7.60 ± 10.84 | < 0.0001 | 3.02 ± 0.66 | 4.08 ± 0.48 | < 0.0001 | 2.80 ± 0.75 | 2.73 ± 0.84 | 0.4131 | 2.71 ± 0.57 | 2.31 ± 0.44 | 0.0039 | < 0.0001 |
| Analyzed Parameters | Group 1: Crohn’s Disease (n = 22) | Group 2: Ulcerative Colitis (n = 19) | Control Group Crohn’s Disease (n = 12) | Control Group Ulcerative Colitis (n = 12) | |||||||||
|---|---|---|---|---|---|---|---|---|---|---|---|---|---|
| Baseline | Intervention | p-Value | Baseline | Intervention | p-Value | Baseline | Intervention | p-Value | Baseline | Intervention | p-Value | p-Value Inter Group | |
| Mean ± SD | Mean ± SD | Mean ± SD | Mean ± SD | Mean ± SD | Mean ± SD | Mean ± SD | Mean ± SD | ||||||
| hsCRP (mg/L) | 80.23 ± 84.16 | 10.84 ± 8.78 | <0.0001 | 67.94 ± 64.34 | 9.78 ± 5.00 | < 0.0001 | 68.44 ± 55.52 | 36.29 ± 32.83 | 0.0022 | 58.28 ± 41.78 | 45.24 ± 44.40 | 0.2500 | < 0.0001 |
| ESR (mm/h) | 49.82 ± 35.19 | 22.00 ± 19.01 | 0.0034 | 66.89 ± 32.37 | 16.42 ± 9.16 | < 0.0001 | 32.38 ± 19.20 | 28.07 ± 21.95 | 0.2134 | 39.89 ± 30.25 | 38.78 ± 26.56 | 0.1953 | 0.1860 |
| Procalcytonin (ng/mL) | 0.25 ± 0.29 | 0.05 ± 0.02 | 0.0014 | 0.12 ± 0.16 | 0.05 ± 0.01 | 0.2852 | 0.25 ± 0.61 | 0.11 ± 0.13 | 0.3375 | 0.22 ± 0.20 | 0.17 ± 0.10 | 0.1250 | 0.7424 |
| hsTNF-α (pg/mL) | 0.13 ± 0.04 | 0.08 ± 0.05 | 0.0349 | 0.27 ± 0.59 | 0.10 ± 0.05 | 0.0113 | 0.10 ± 0.05 | 0.09 ± 0.05 | 0.8995 | 0.08 ± 0.06 | 0.07 ± 0.05 | 0.9988 | 0.3334 |
| IL-6 (pg/mL) | 7.83 ± 2.95 | 4.45 ± 2.20 | 0.0010 | 8.97 ± 2.63 | 5.73 ± 2.47 | 0.0001 | 8.13 ± 2.98 | 7.77 ± 2.60 | 0.0713 | 7.78 ± 2.74 | 7.82 ± 2.71 | 0.5703 | 0.0012 |
| IL-10 (pg/mL) | 4.44 ± 6.63 | 2.21 ± 2.87 | 0.2569 | 6.73 ± 6.20 | 3.65 ± 2.64 | 0.0769 | 4.10 ± 2.49 | 3.16 ± 1.99 | 0.0871 | 4.60 ± 3.50 | 4.16 ± 3.00 | 0.3008 | 0.0778 |
© 2019 by the authors. Licensee MDPI, Basel, Switzerland. This article is an open access article distributed under the terms and conditions of the Creative Commons Attribution (CC BY) license (http://creativecommons.org/licenses/by/4.0/).
Share and Cite
Mańkowska-Wierzbicka, D.; Karczewski, J.; Swora-Cwynar, E.; Dobrowolska, A.; Stelmach-Mardas, M. The Clinical Importance of 21-Day Combined Parenteral and Enteral Nutrition in Active Inflammatory Bowel Disease Patients. Nutrients 2019, 11, 2246. https://0-doi-org.brum.beds.ac.uk/10.3390/nu11092246
Mańkowska-Wierzbicka D, Karczewski J, Swora-Cwynar E, Dobrowolska A, Stelmach-Mardas M. The Clinical Importance of 21-Day Combined Parenteral and Enteral Nutrition in Active Inflammatory Bowel Disease Patients. Nutrients. 2019; 11(9):2246. https://0-doi-org.brum.beds.ac.uk/10.3390/nu11092246
Chicago/Turabian StyleMańkowska-Wierzbicka, Dorota, Jacek Karczewski, Ewelina Swora-Cwynar, Agnieszka Dobrowolska, and Marta Stelmach-Mardas. 2019. "The Clinical Importance of 21-Day Combined Parenteral and Enteral Nutrition in Active Inflammatory Bowel Disease Patients" Nutrients 11, no. 9: 2246. https://0-doi-org.brum.beds.ac.uk/10.3390/nu11092246