The Extract of Arctium lappa L. Fruit (Arctii Fructus) Improves Cancer-Induced Cachexia by Inhibiting Weight Loss of Skeletal Muscle and Adipose Tissue

 and
and
Abstract
: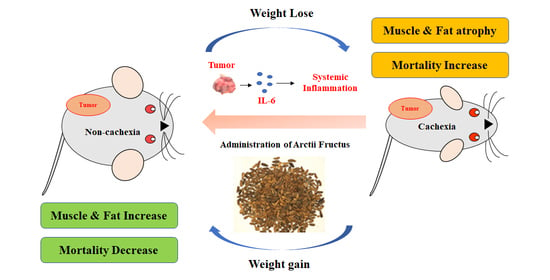
1. Introduction
2. Materials and Methods
2.1. Reagents and Antibodies
2.2. Extract of AF
2.3. HPLC Analysis of AF
2.4. Cachexia Mice Model by Colorectal Cancer Cells Injection
2.5. Hematoxylin and Eosin (H&E) Staining
2.6. CT-26 Conditioned Media (CM)
2.7. Measurement of IL-6
2.8. C2C12 Cell Differentiation
2.9. 3T3-L1 Cell Differentiation
2.10. Cell Viability
2.11. Oil Red O Staining
2.12. Western Blot Analysis
2.13. Quantitative Real-Time RT-PCR
2.14. Statistical Analysis
3. Results
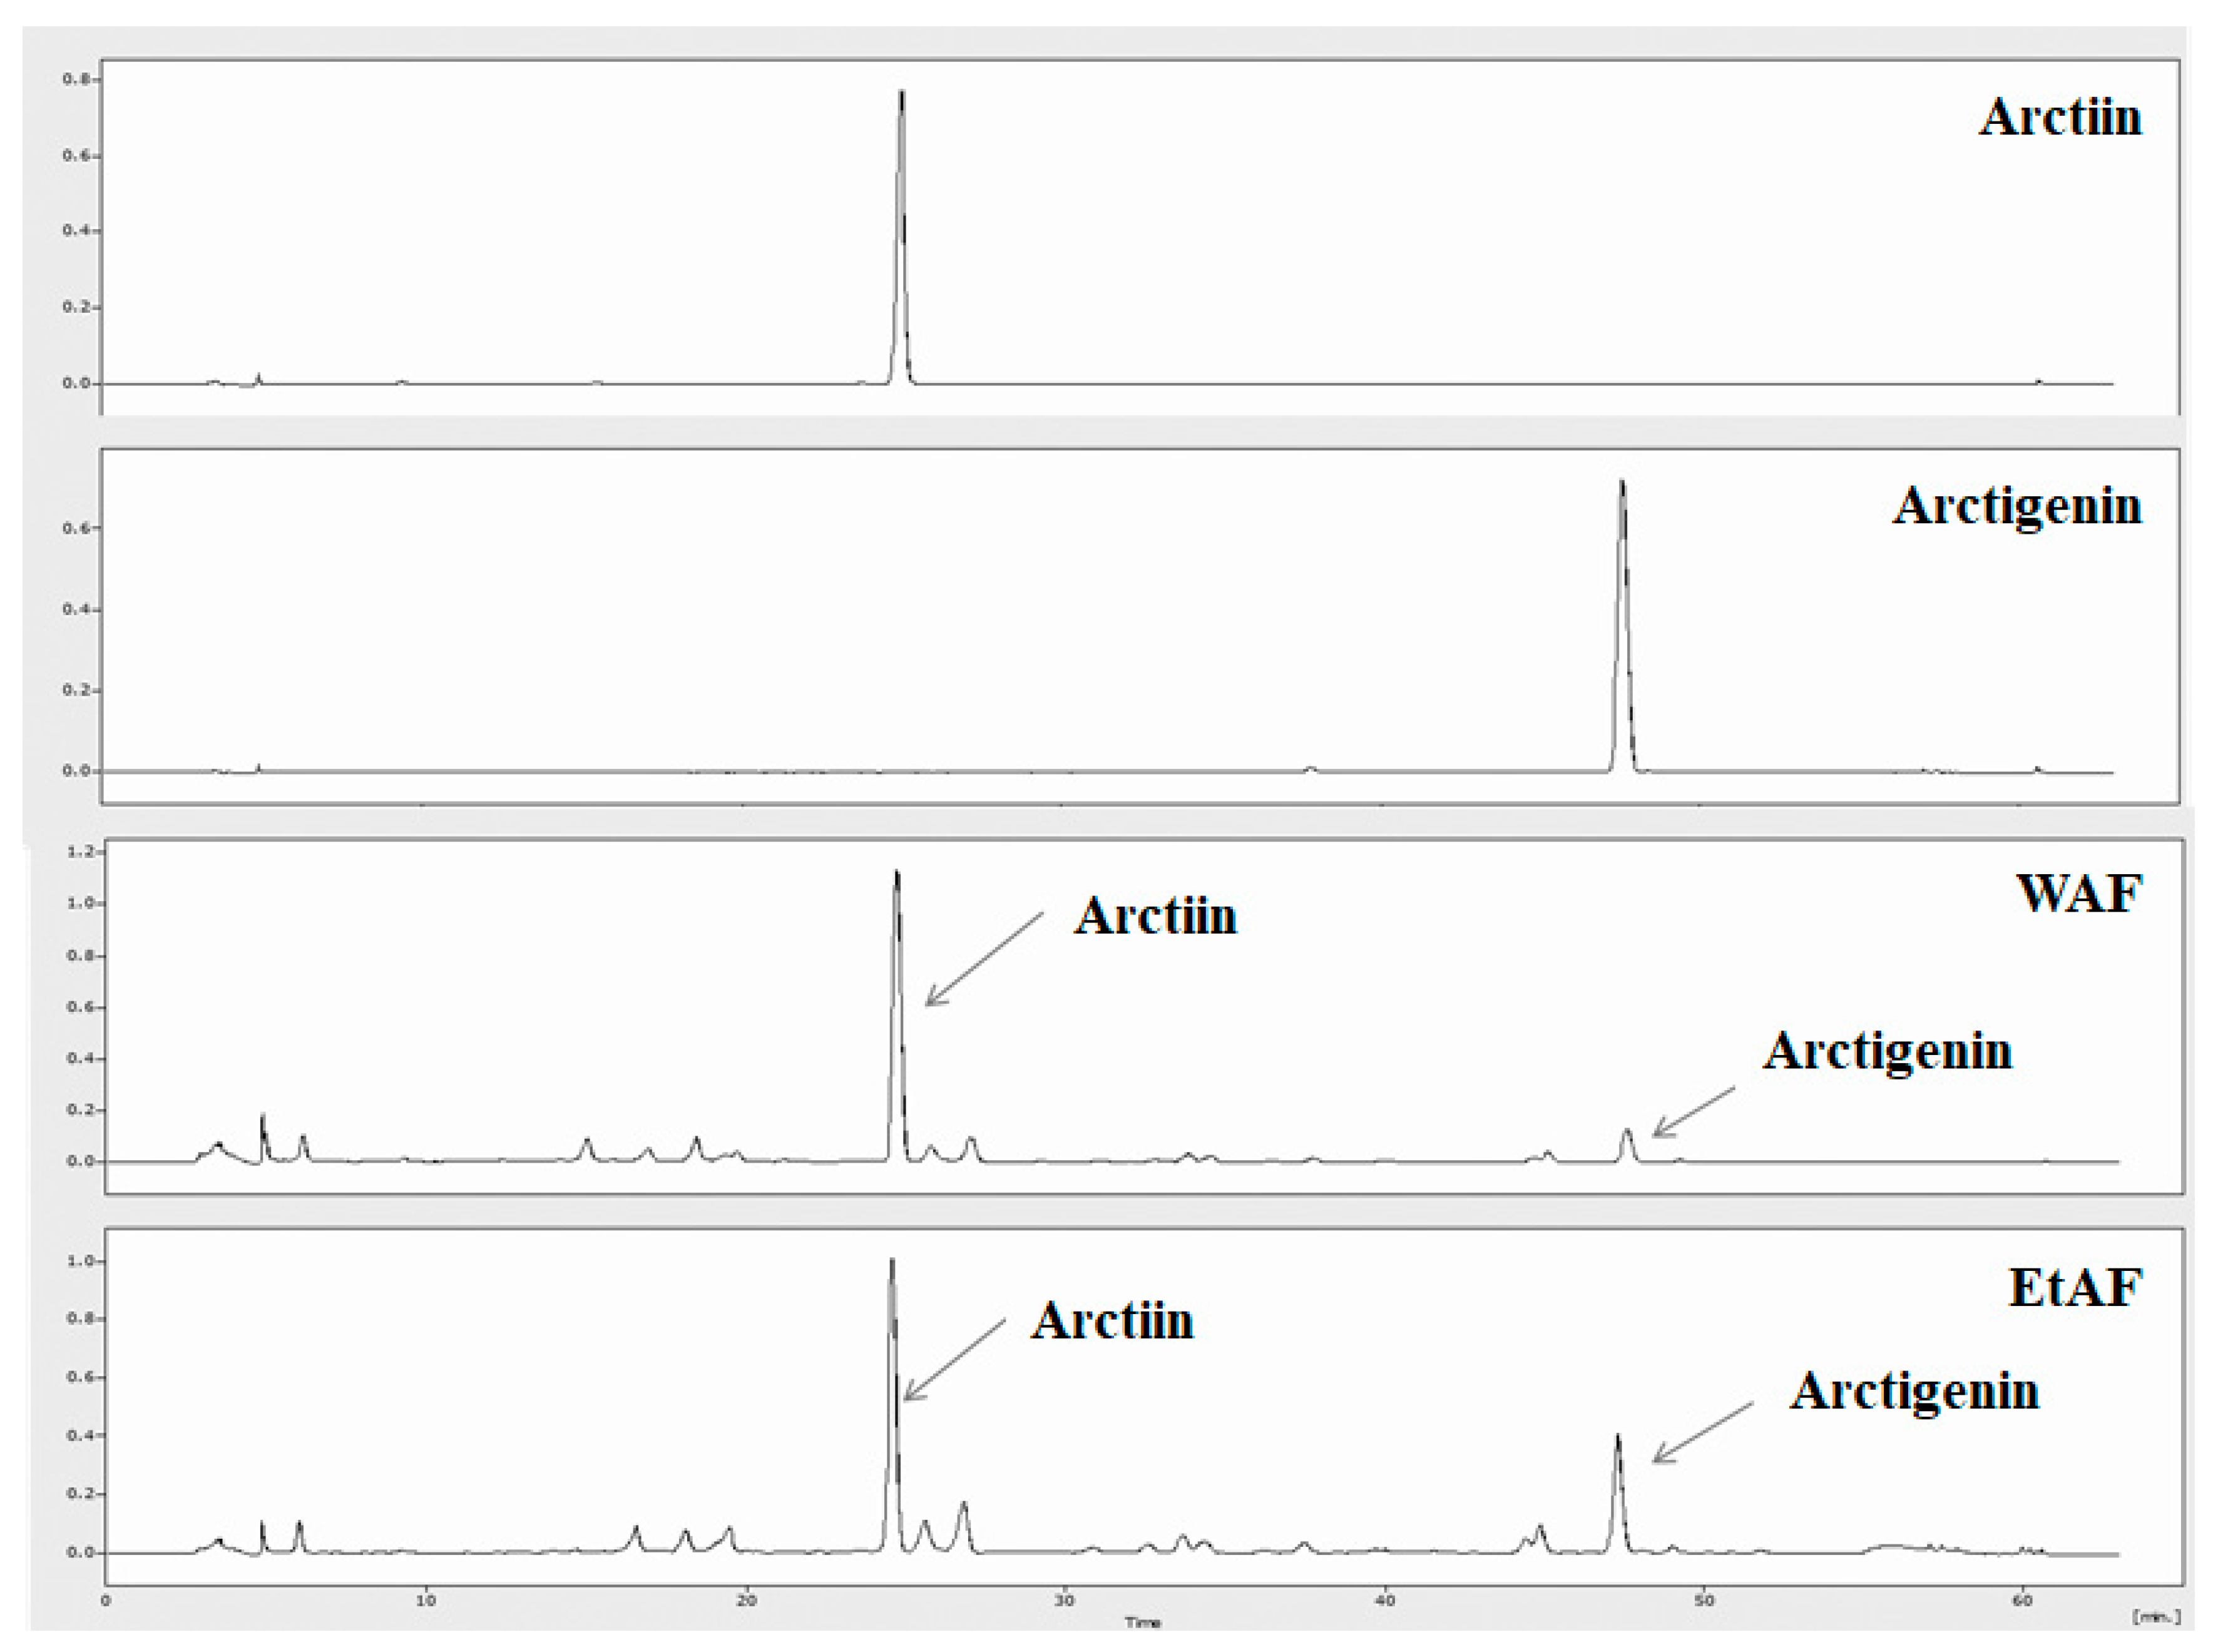
3.1. HPLC Analysis
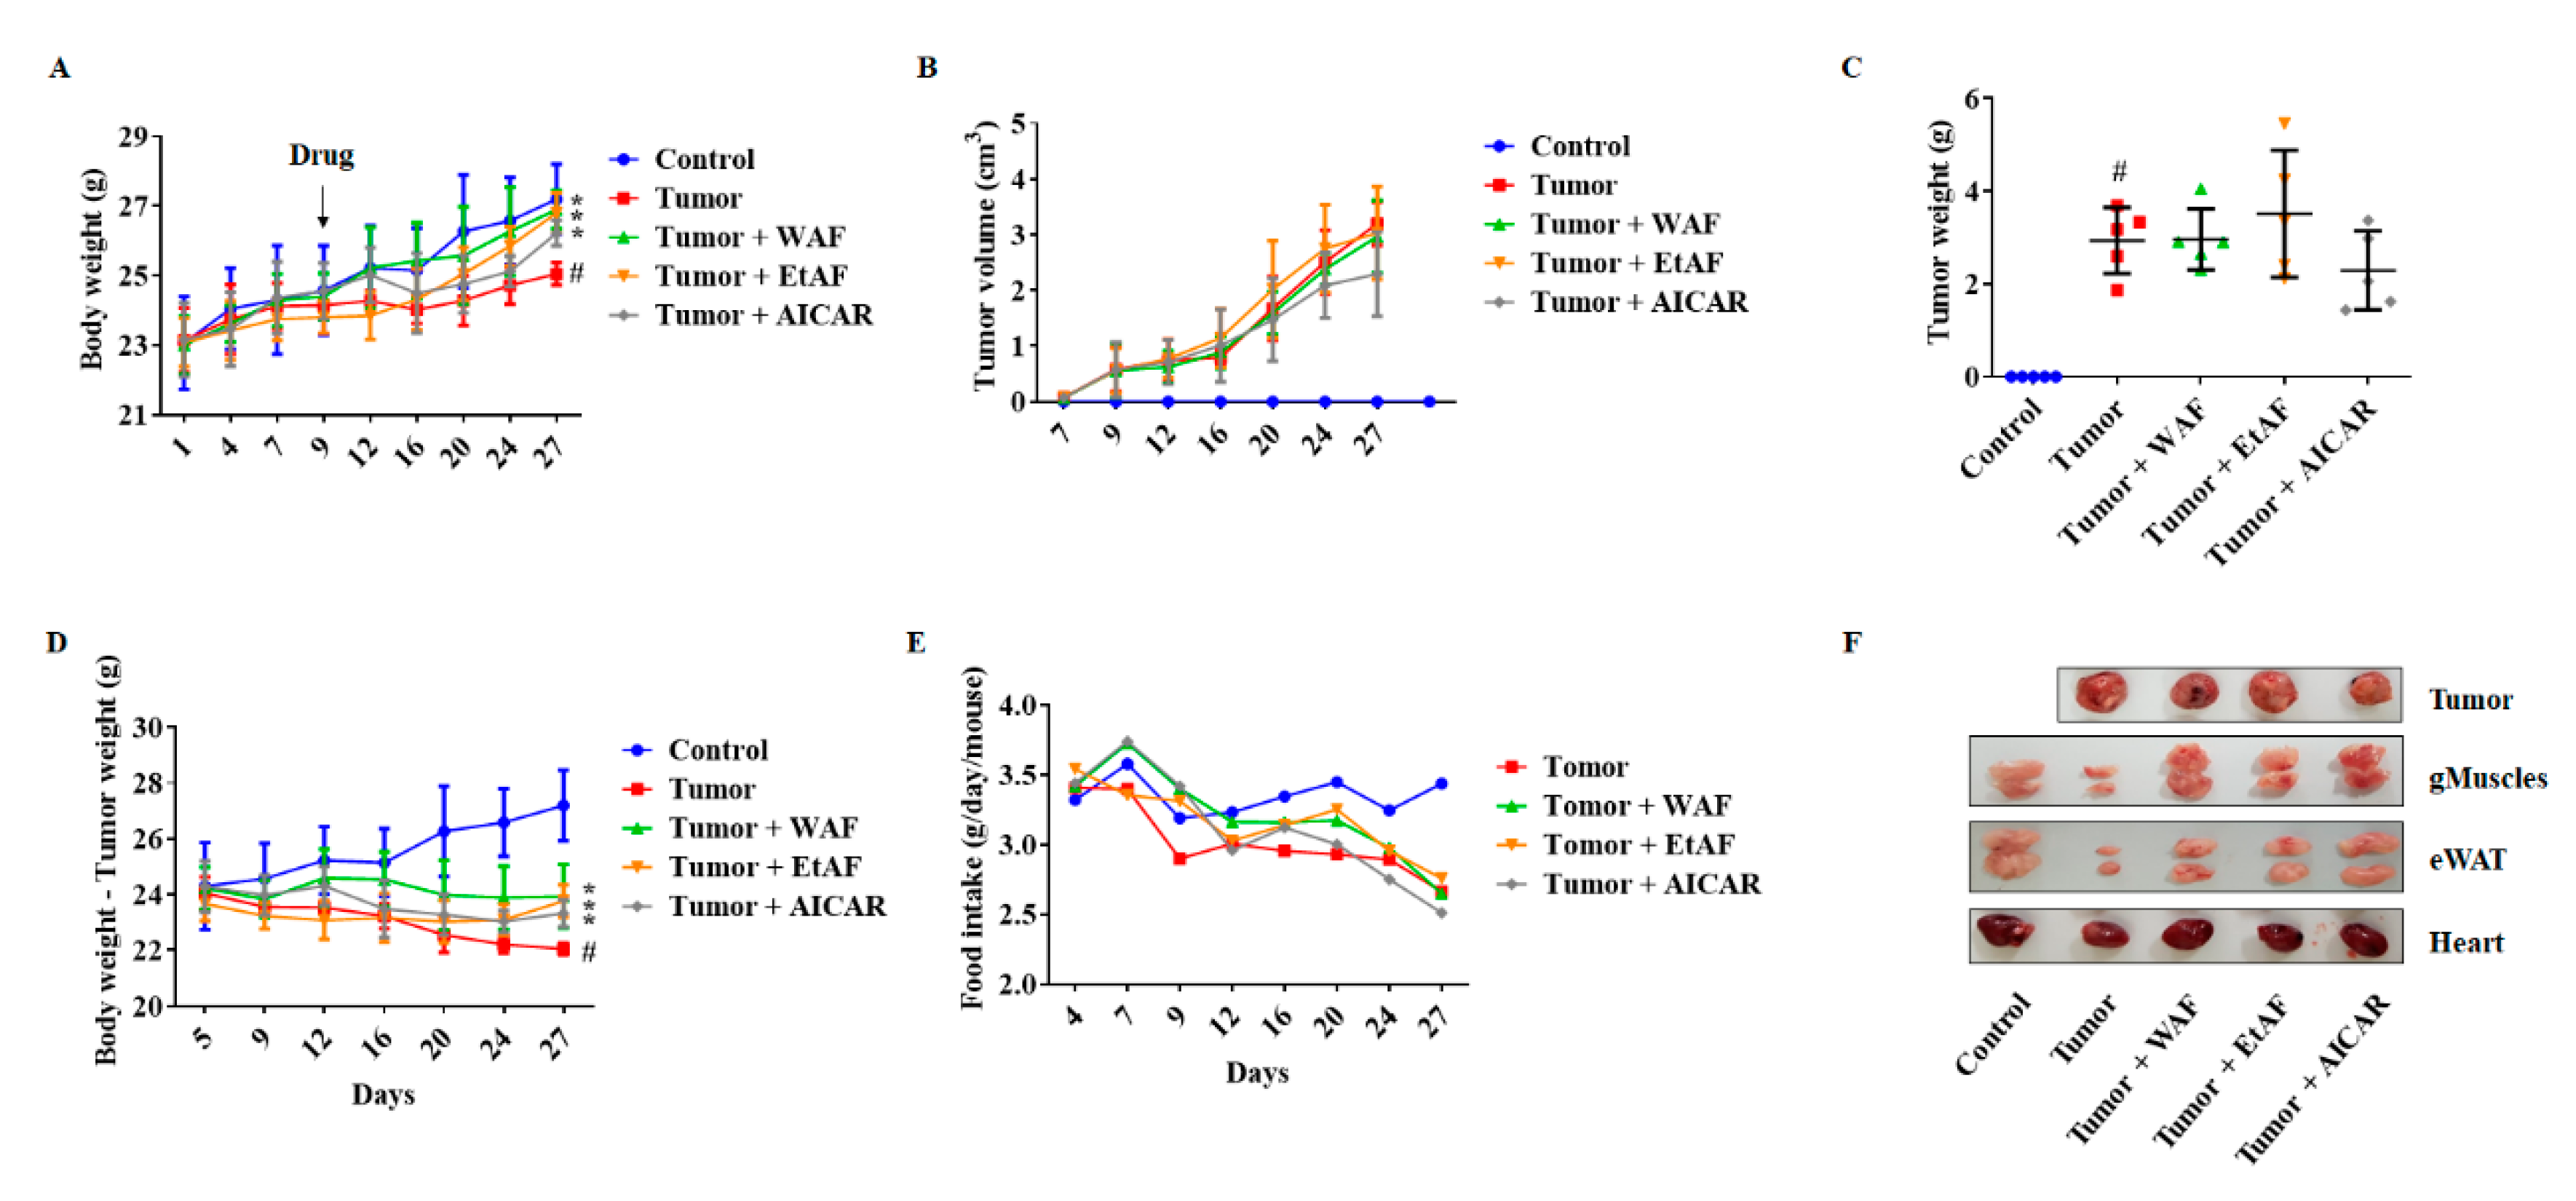
3.2. AF Treatment in Mild Cachectic Mice Inhibited Weight Loss and Improved Cachectic Symptoms
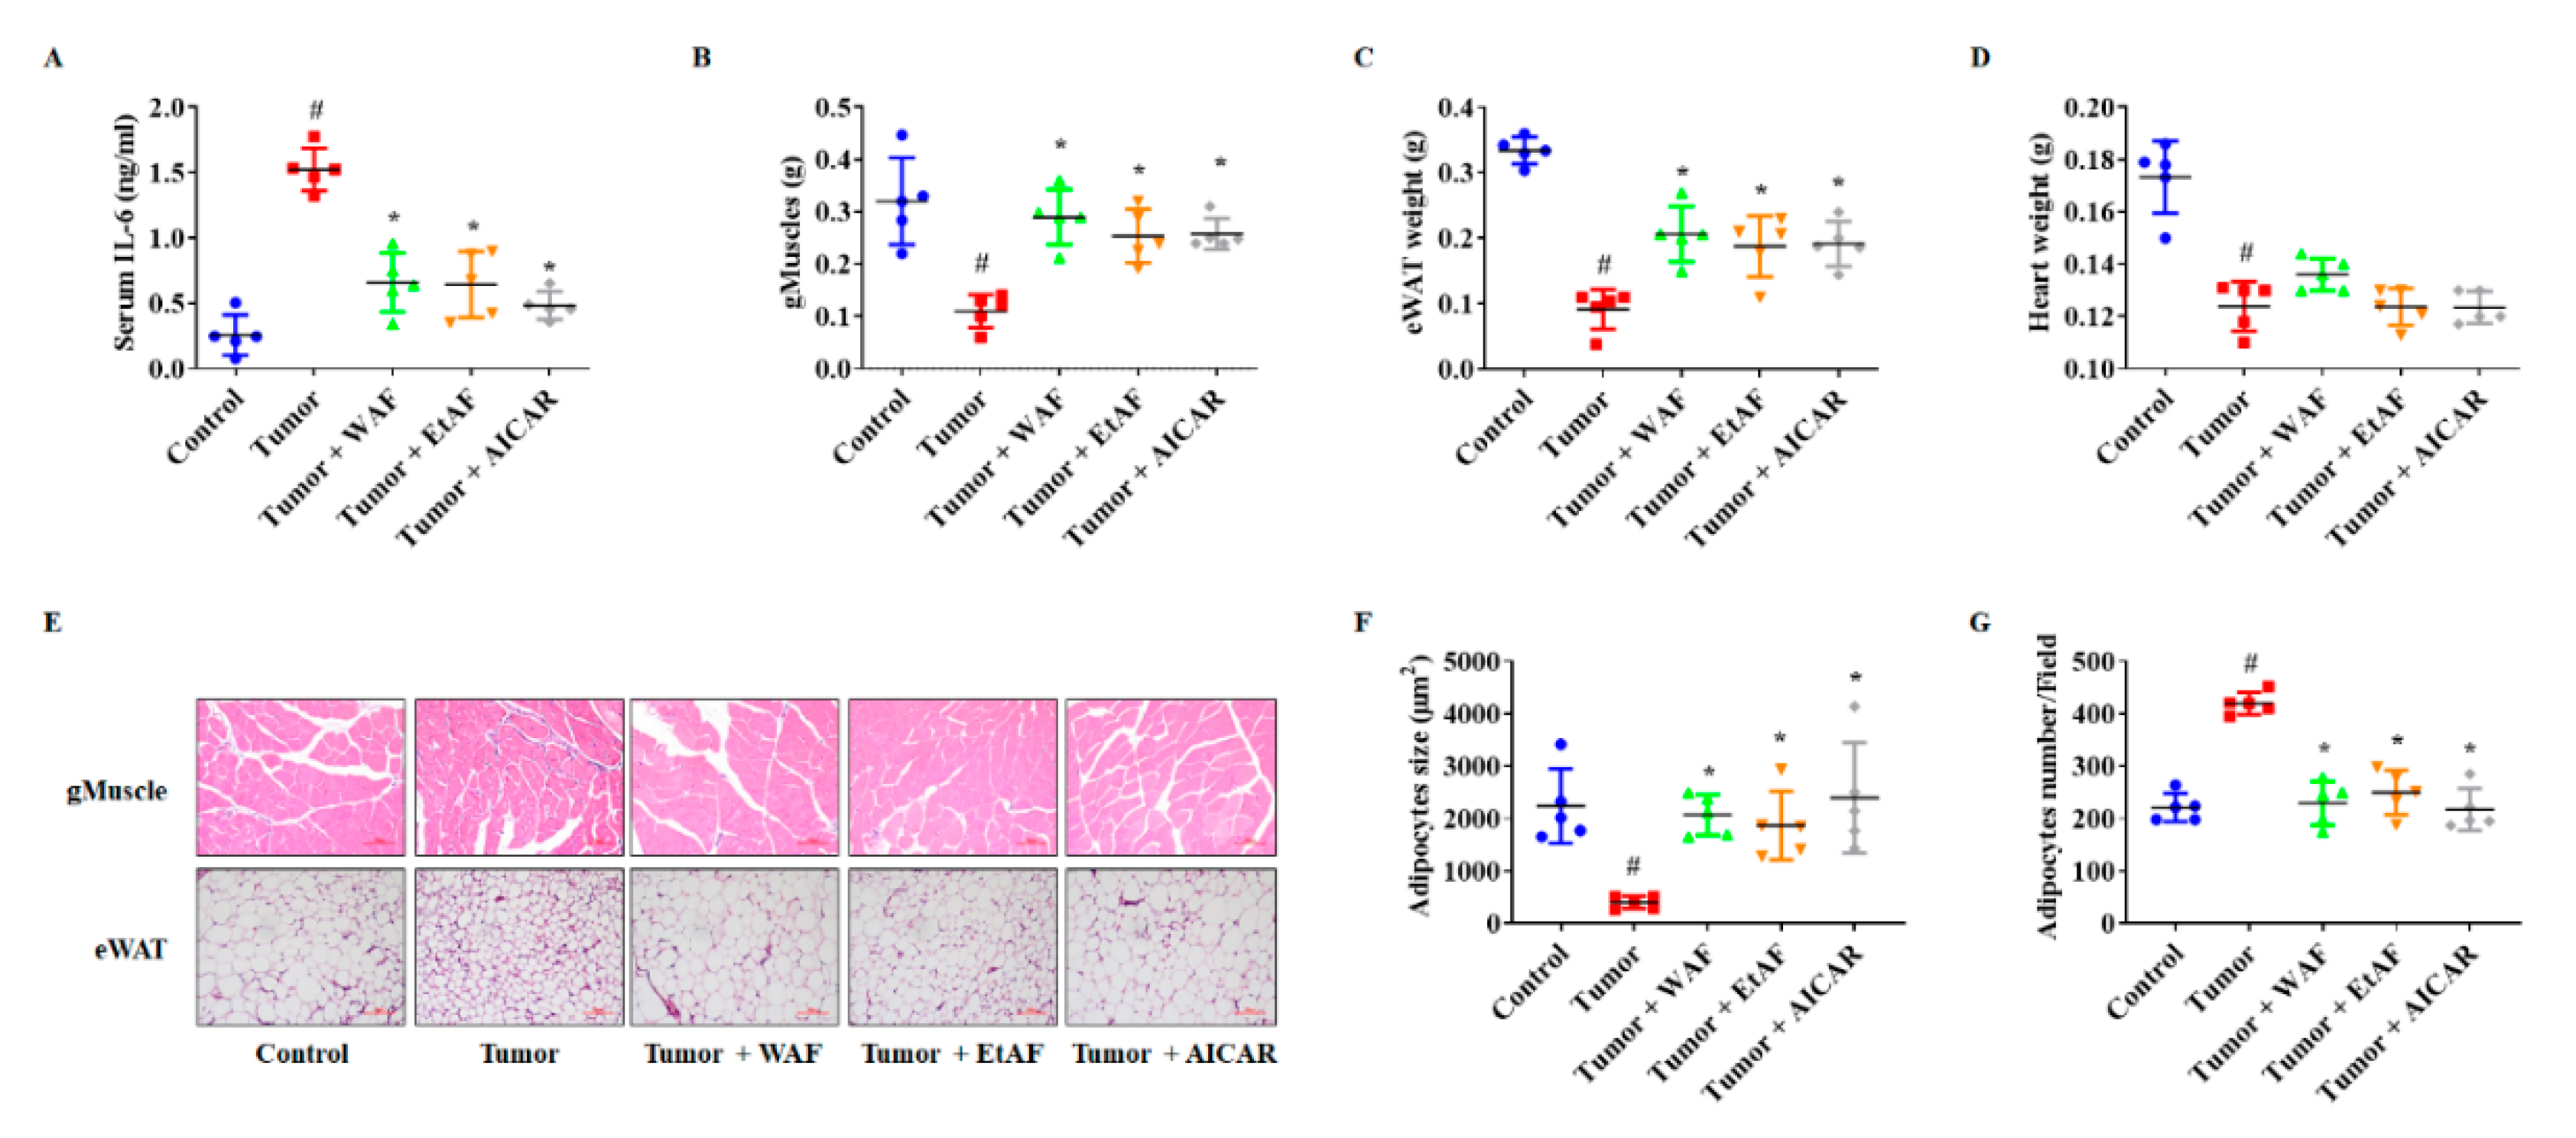
3.3. AF Treatment in Mild Cachectic Mice Regulated Atrophy of Muscle and WAT by Reducing Serum IL-6
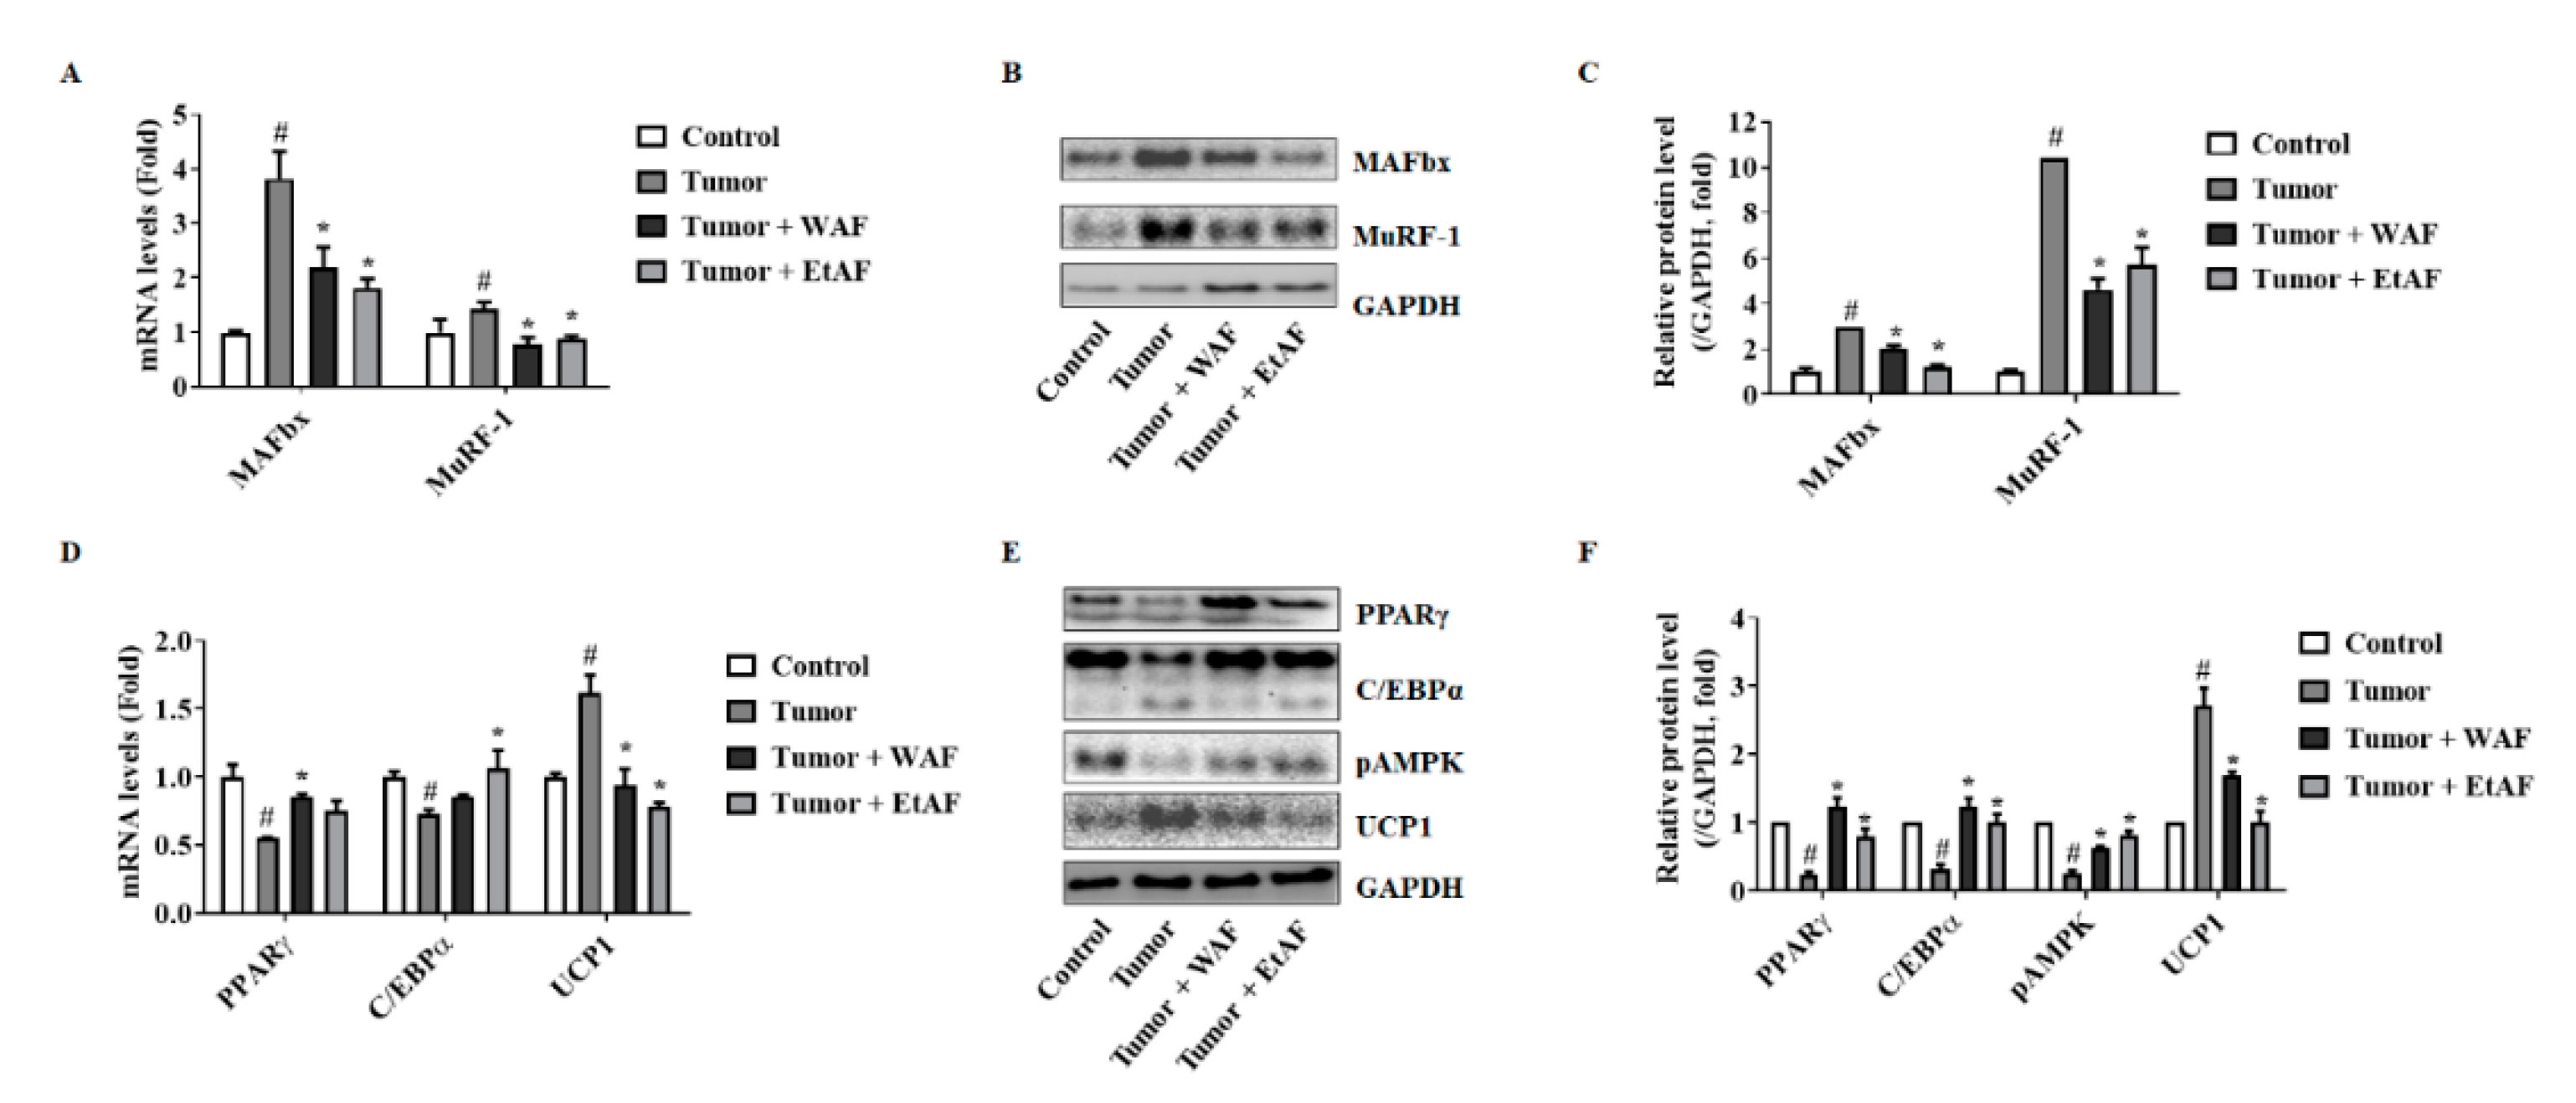
3.4. AF Treatment in Mild Cachectic Mice Regulated Muscle Degradation Factors and WAT Differentiation Factors
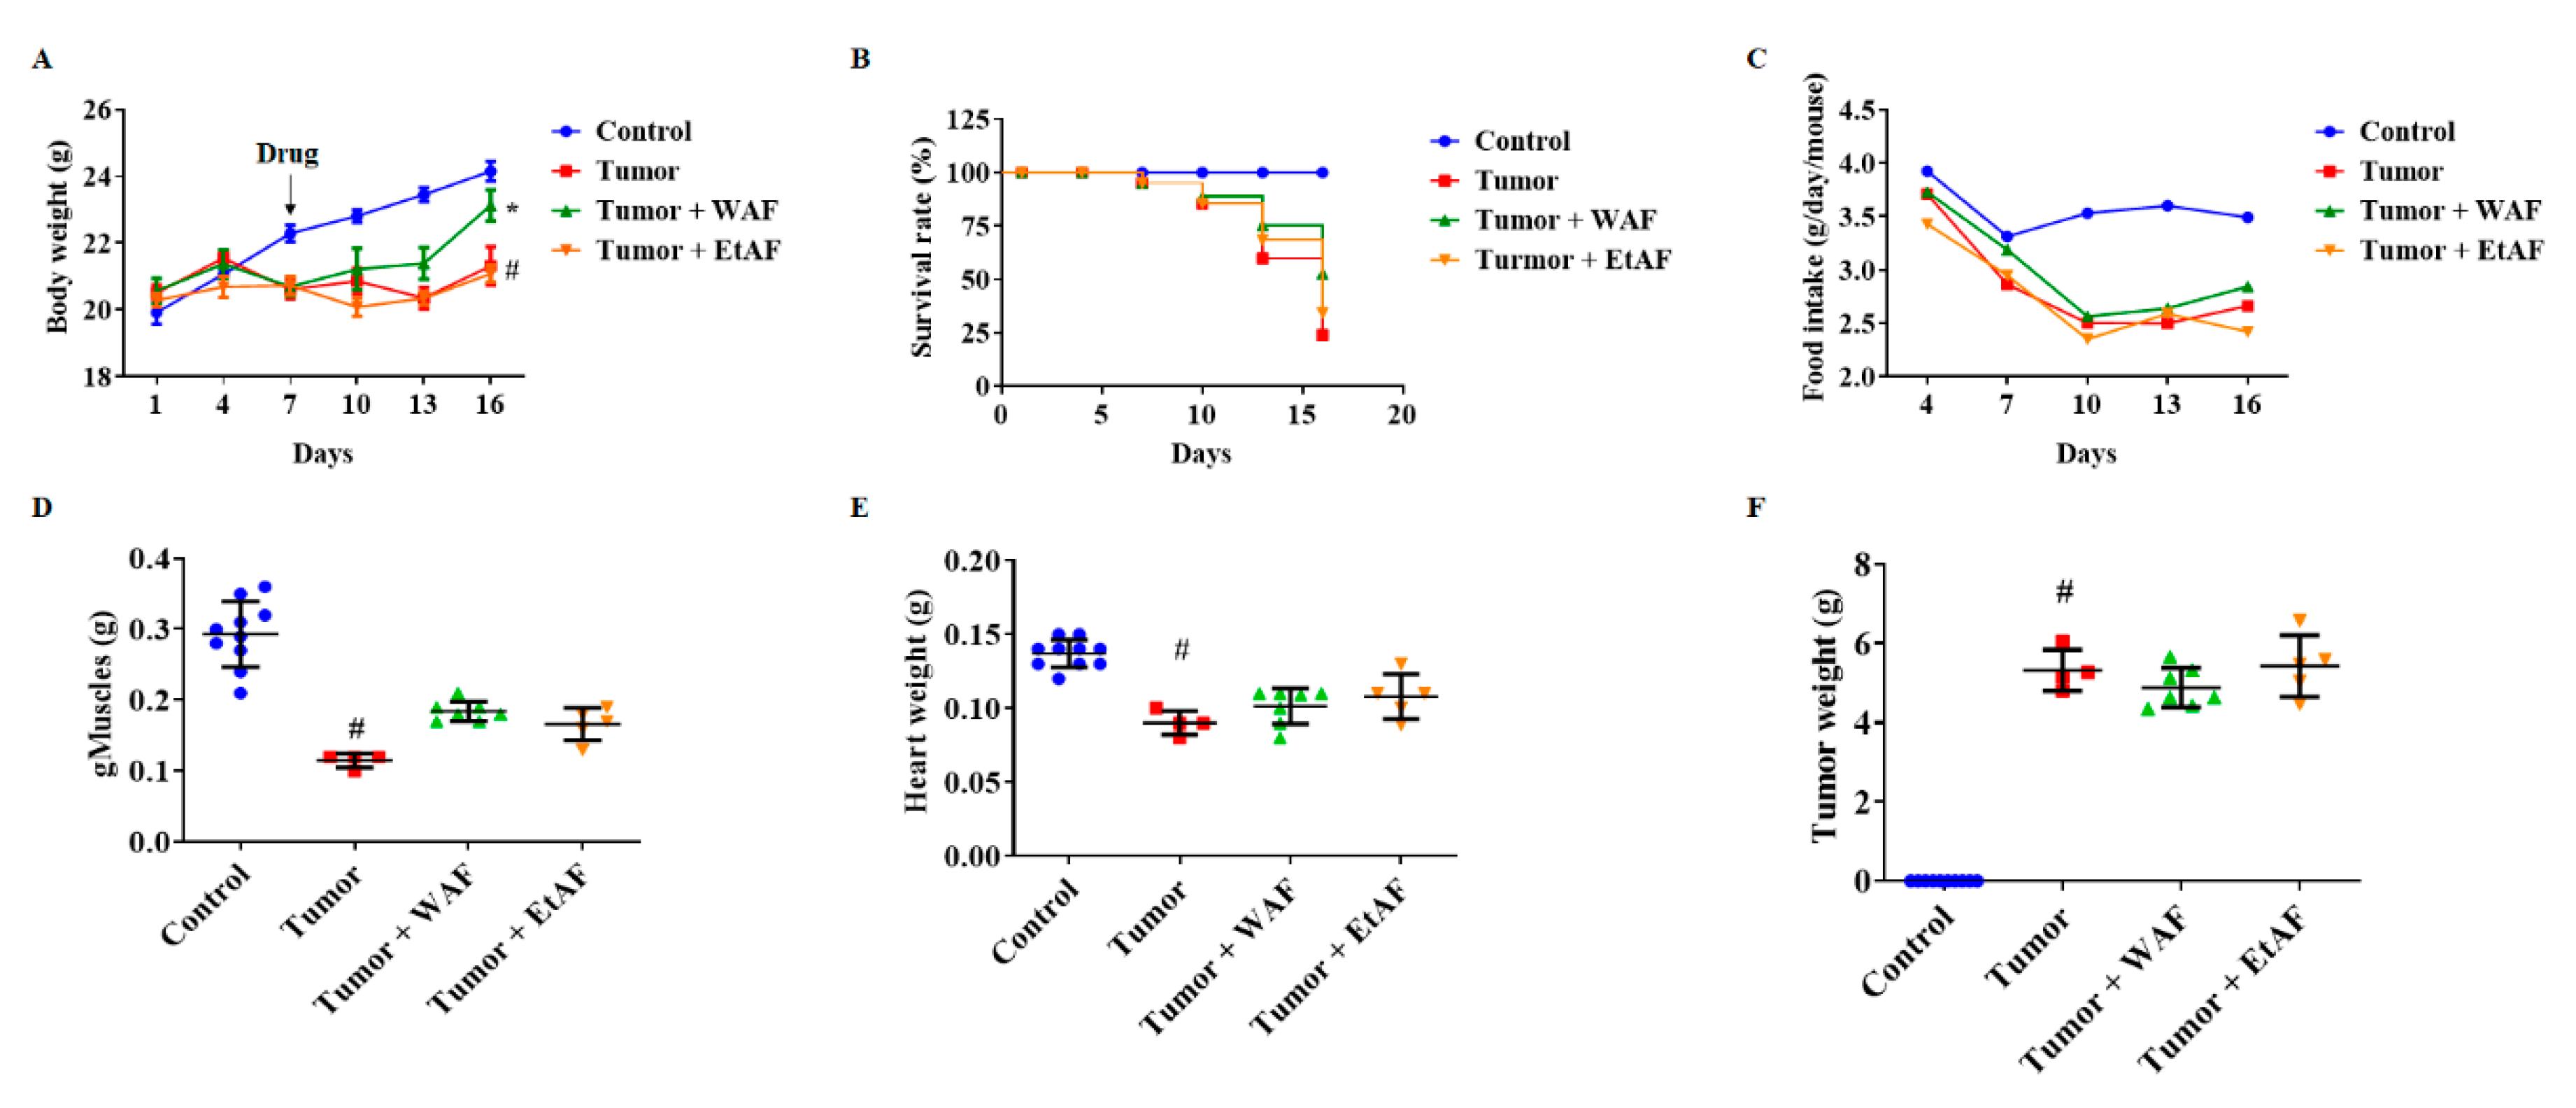
3.5. WAF Treatment in Severe Cachectic Mice Improved Tumor-Induced Weight Loss
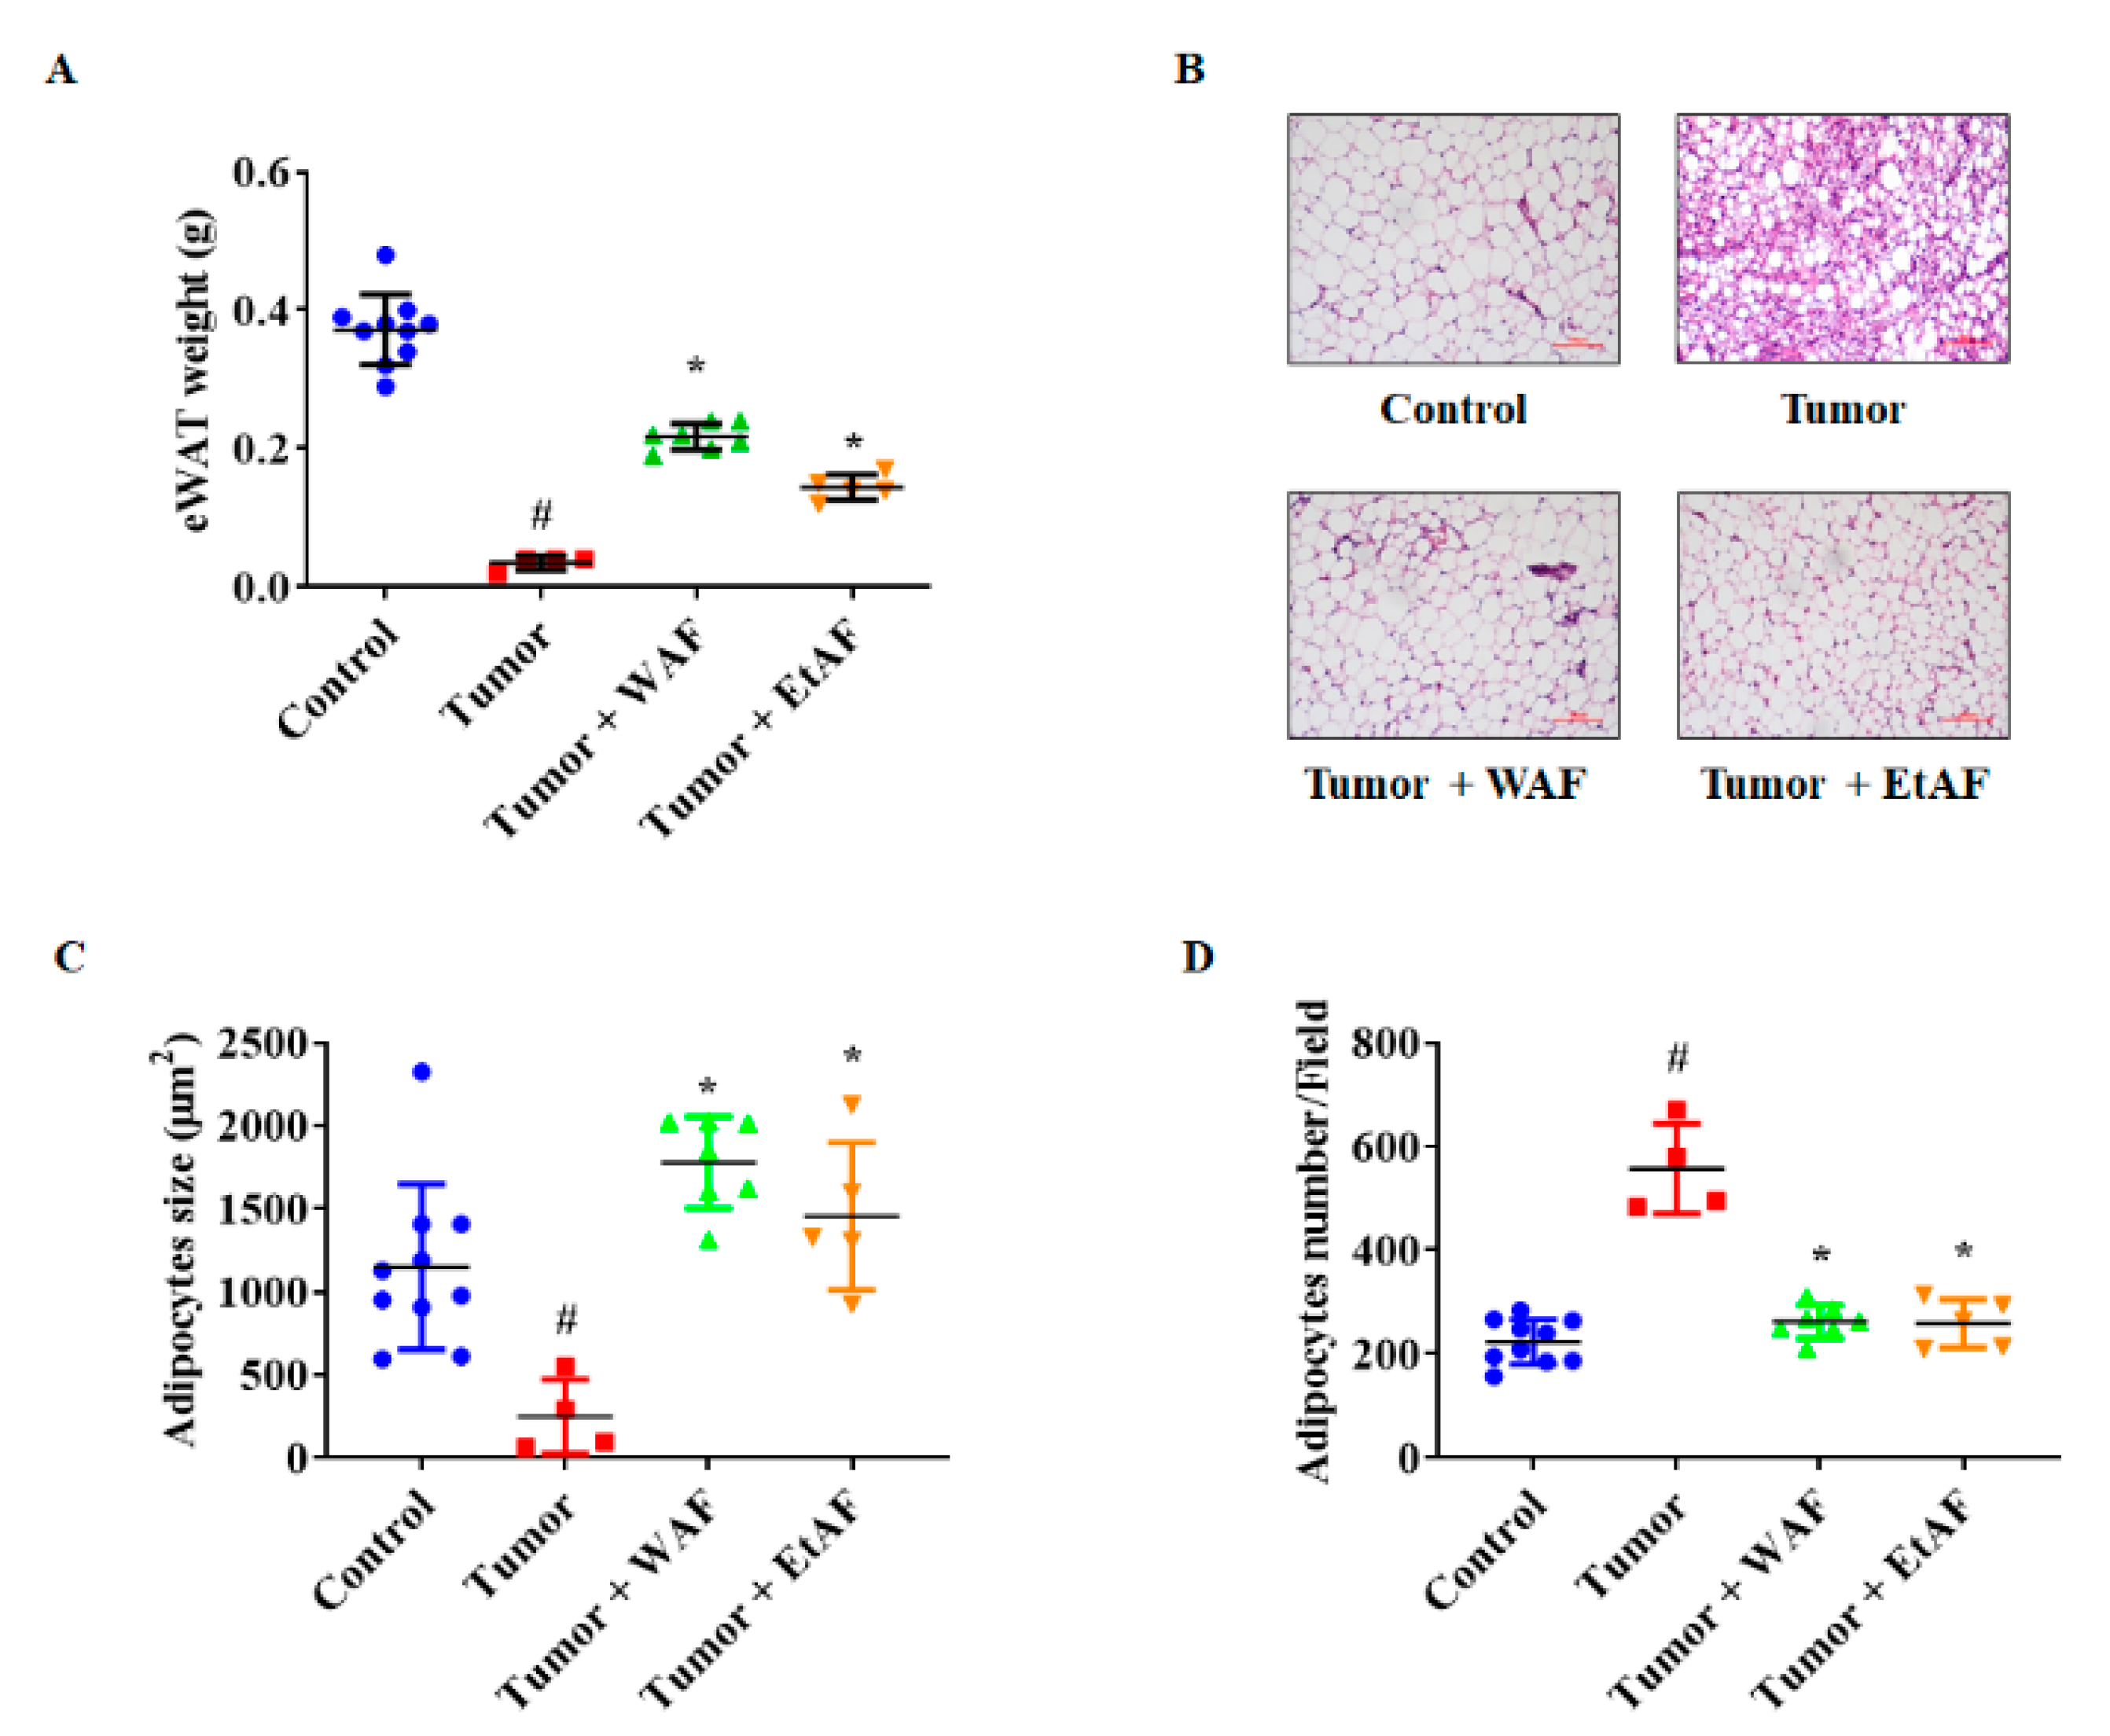
3.6. AF Treatment in Severe Cachectic Mice Prevents Atrophy of Adipose Tissue
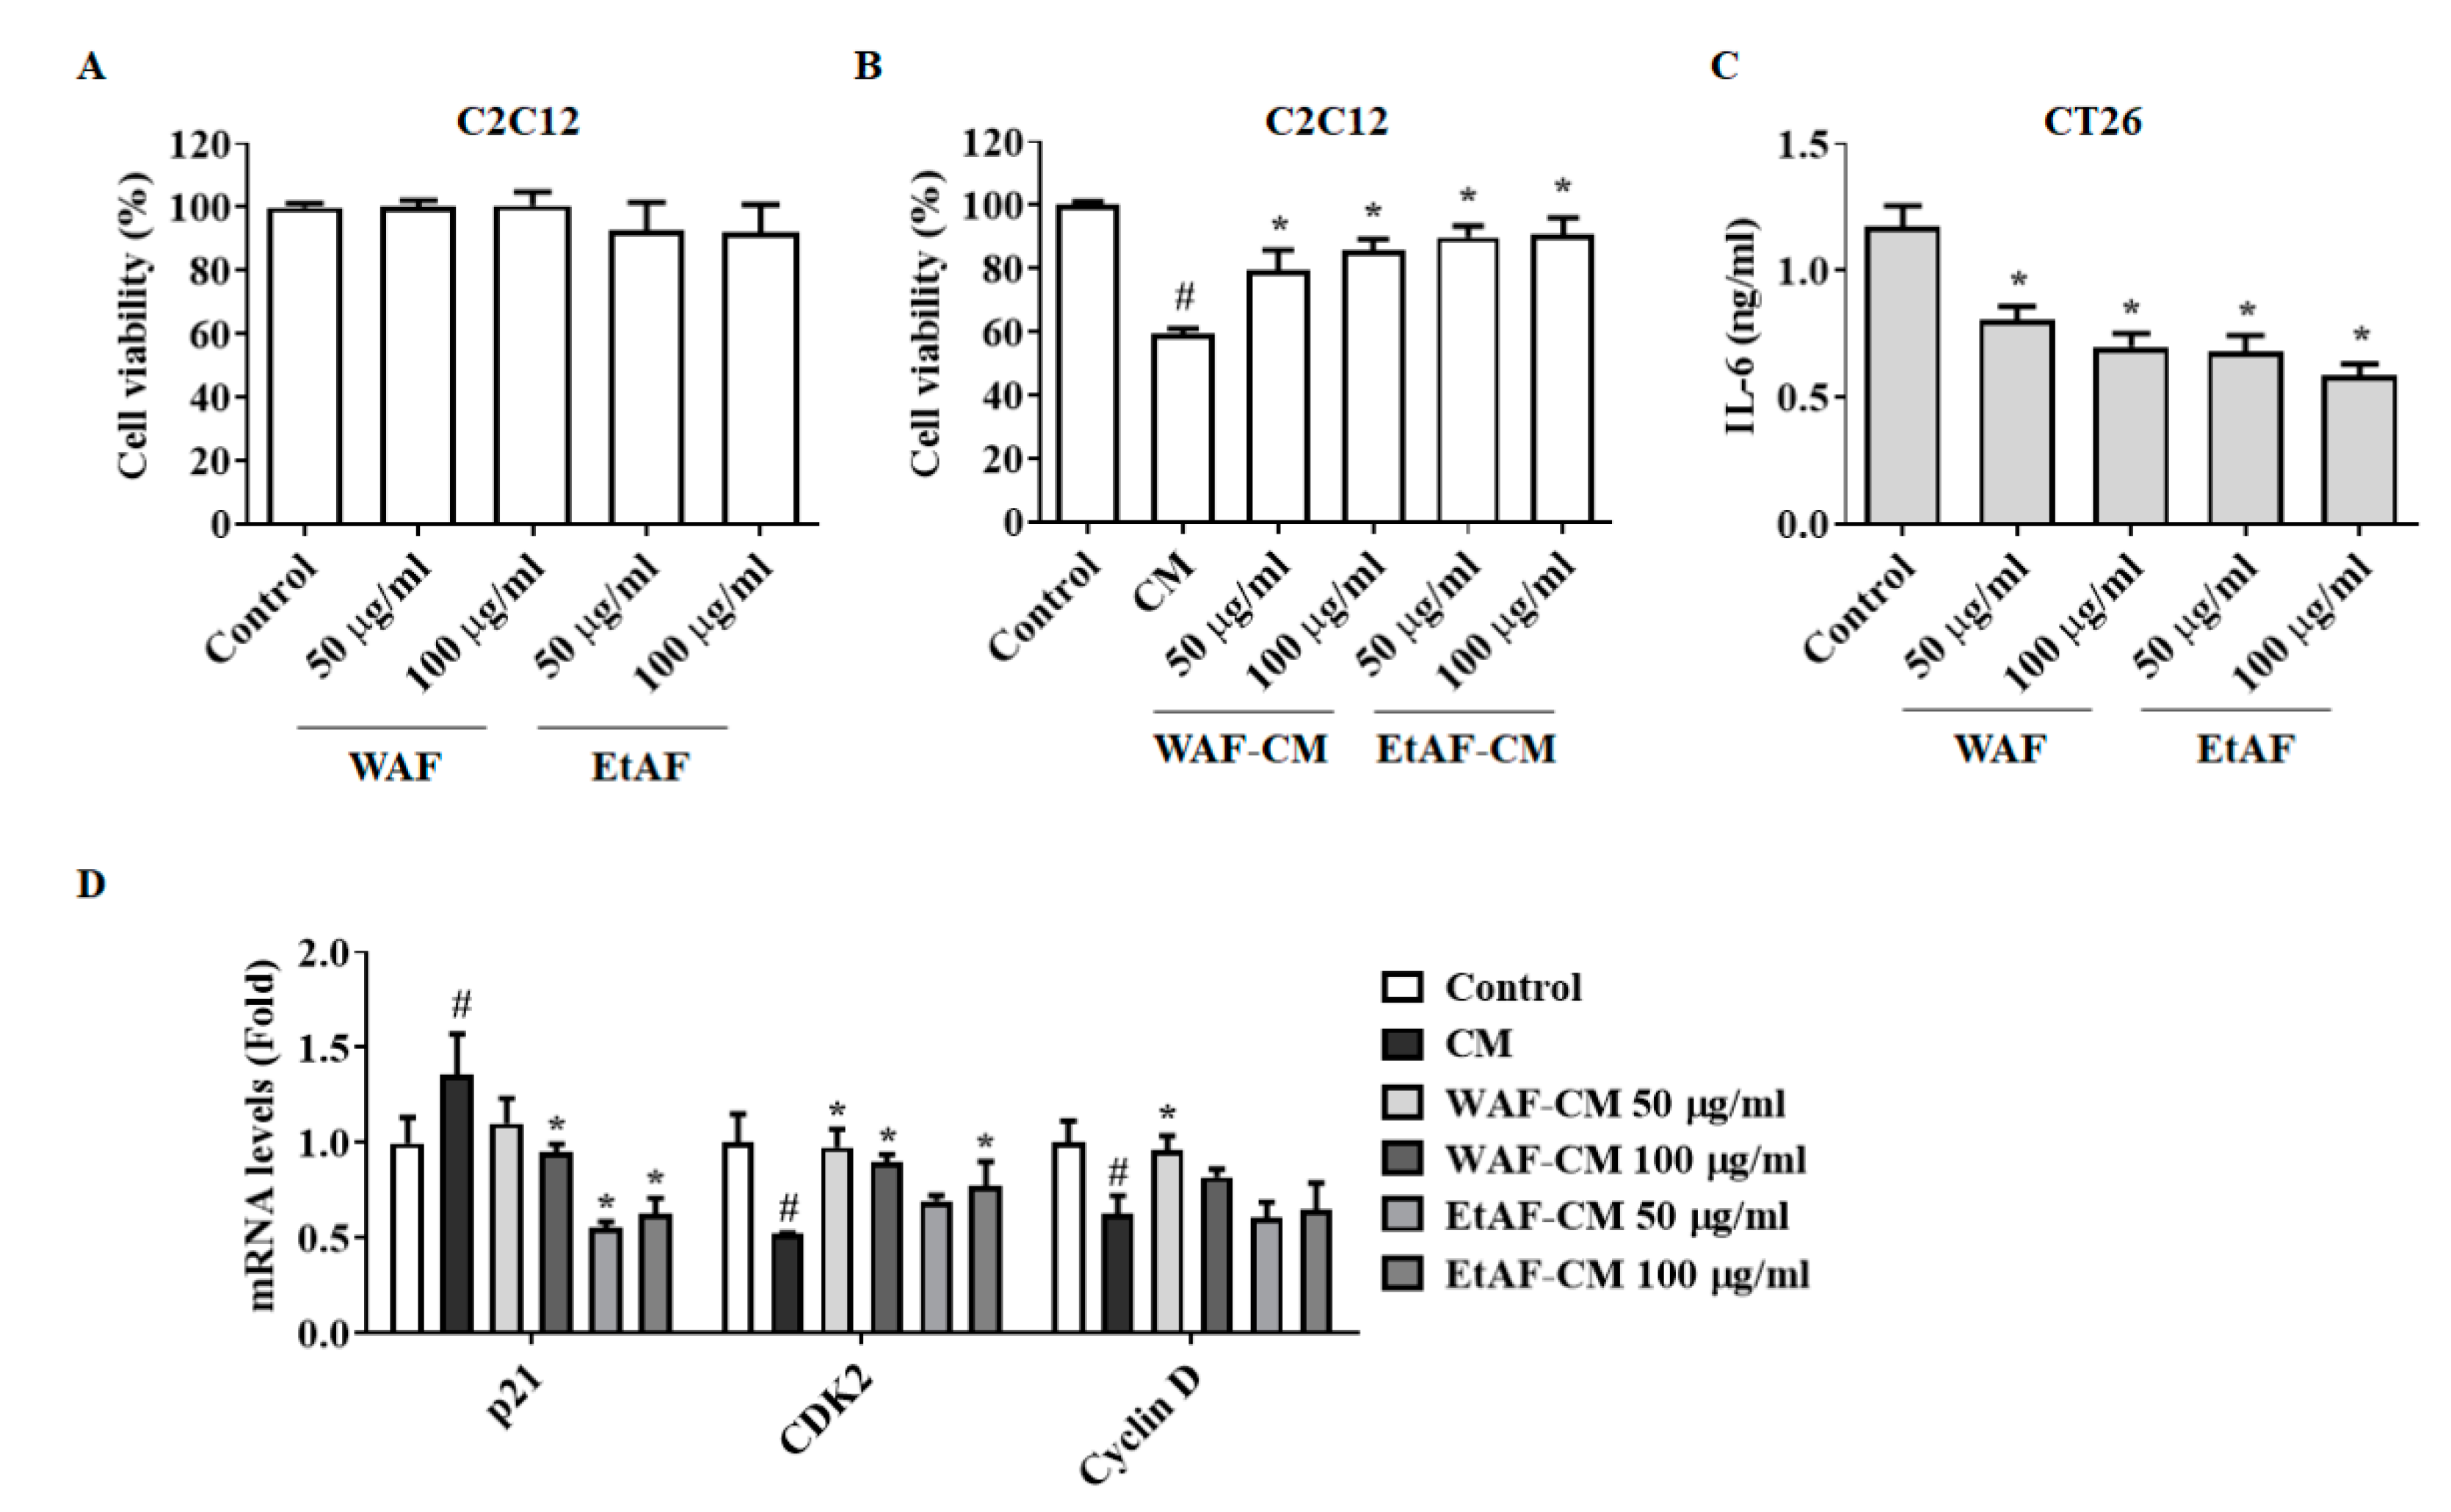
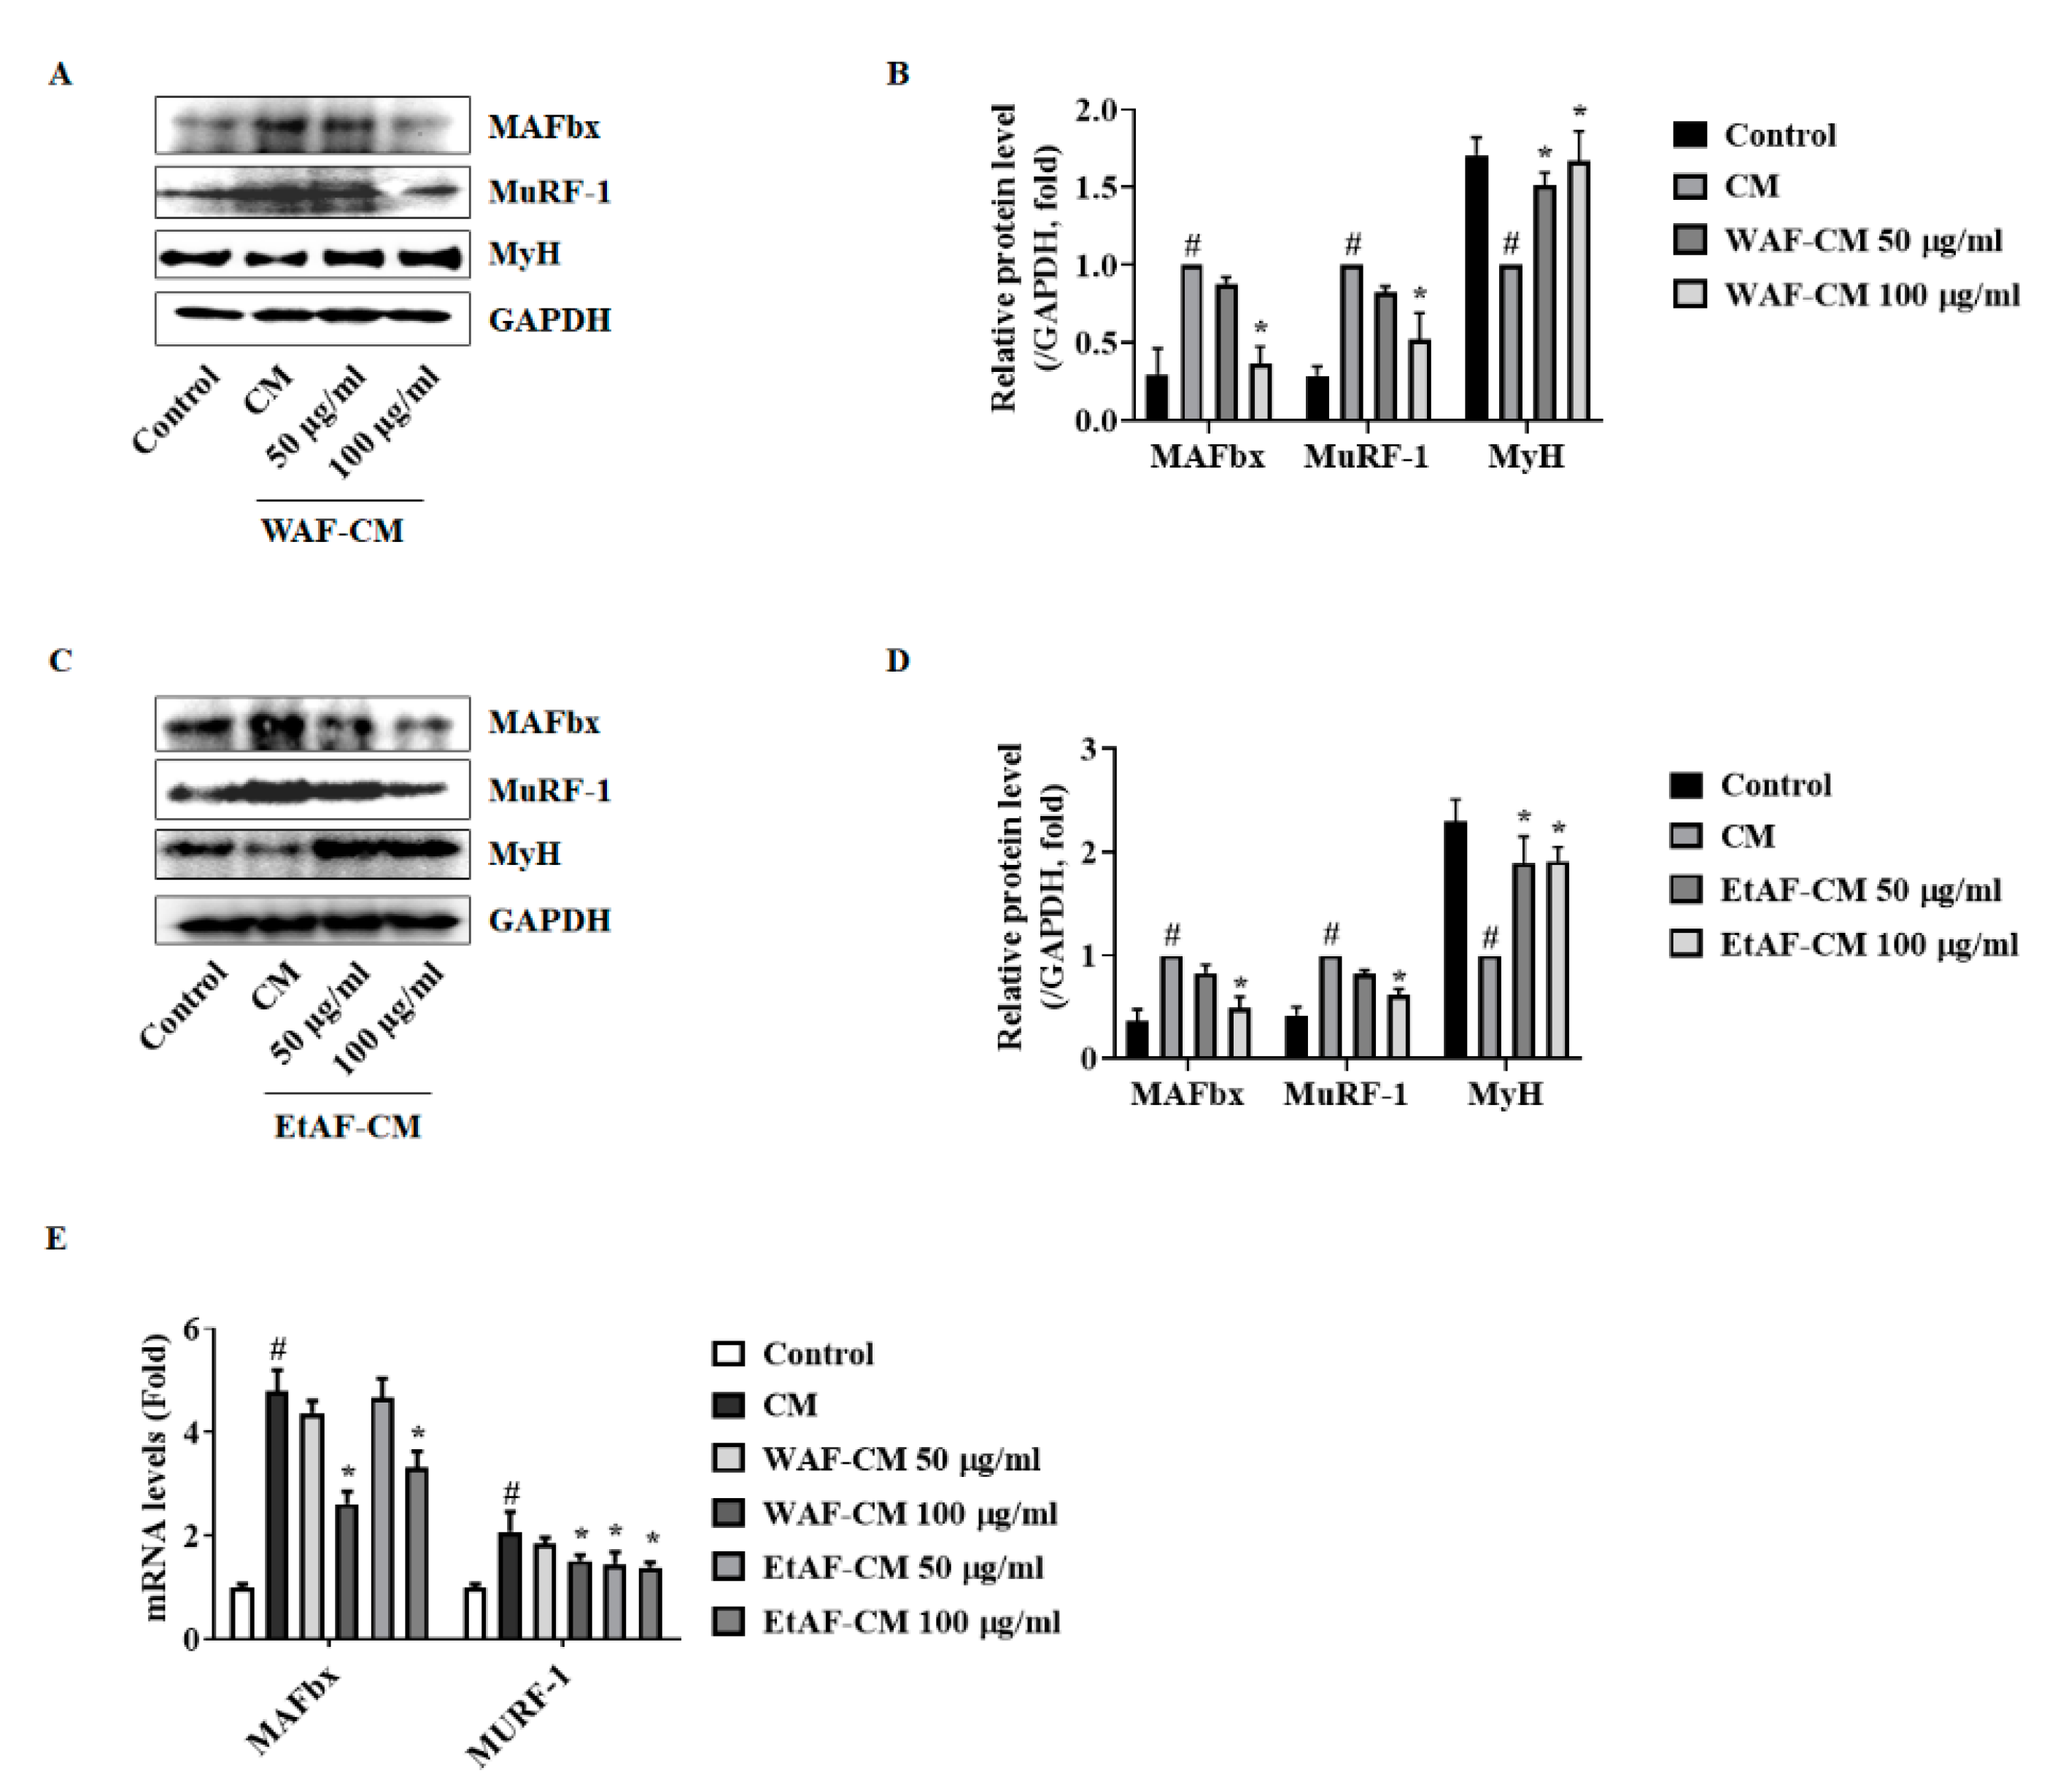
3.7. AF Regulated C2C12 Myoblast Proliferation and Degradation Factors in CT-26 CM-Treated Condition
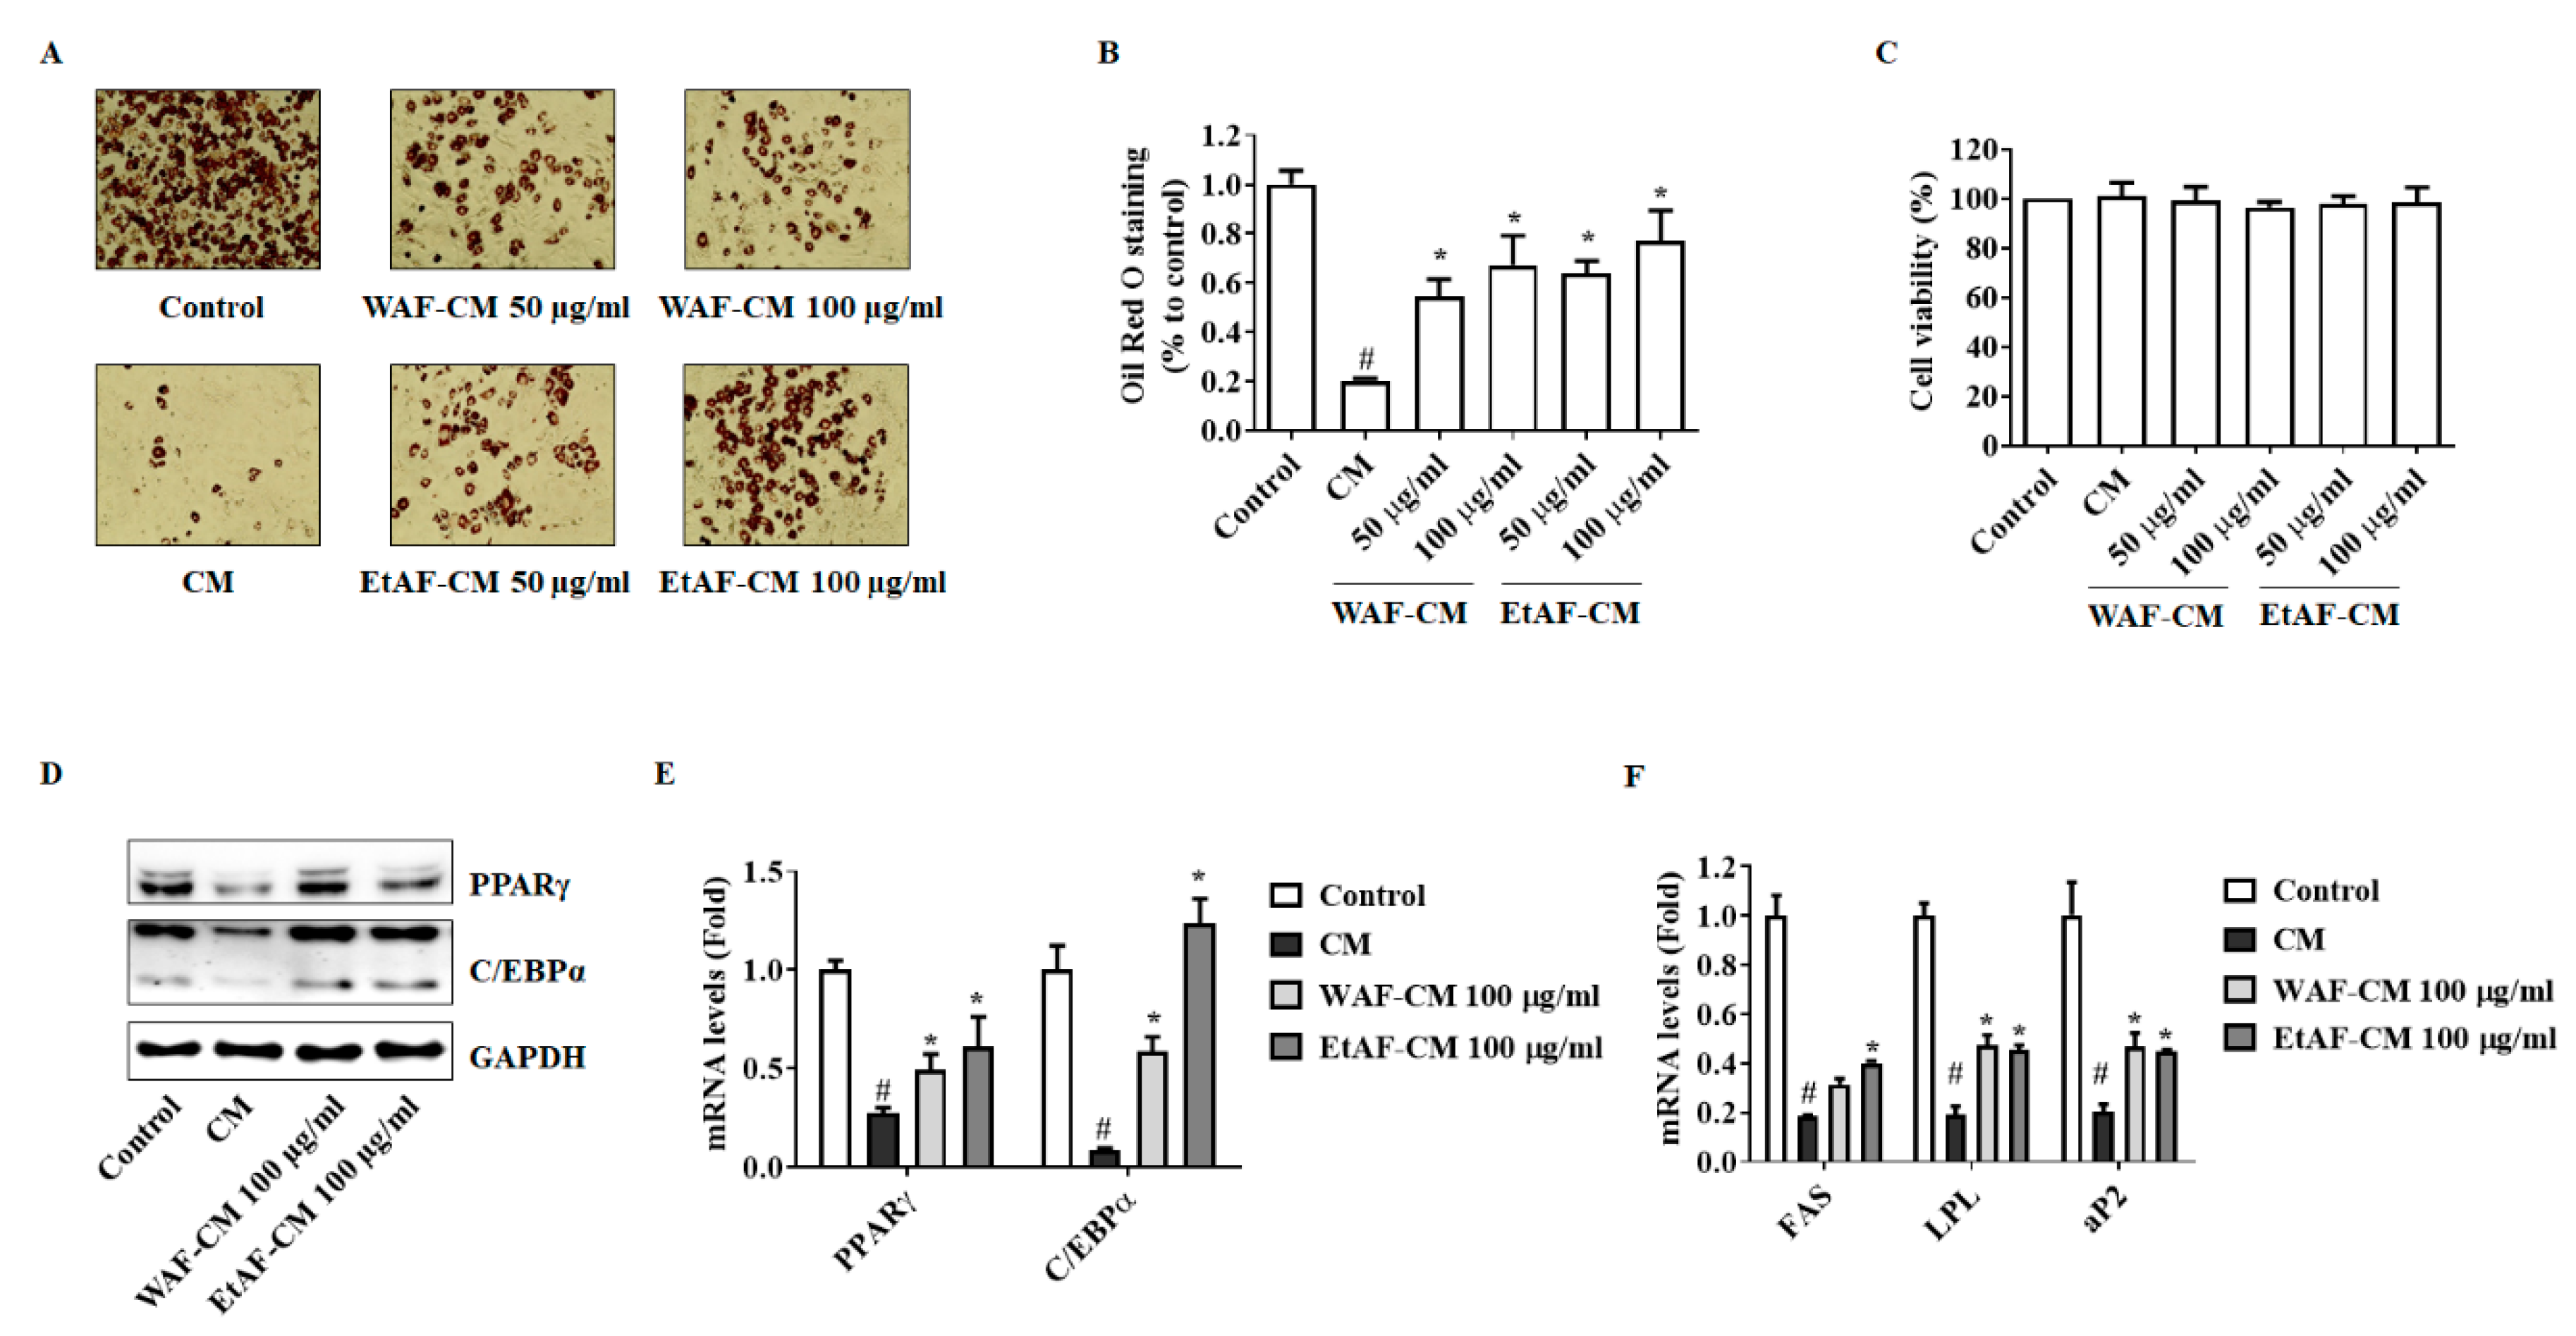
3.8. AF Increased 3T3-L1 Differentiation in CT-26 CM-Treated Condition
4. Discussion
5. Conclusions
Supplementary Materials
Author Contributions
Funding
Conflicts of Interest
References
- Baracos, V.E.; Martin, L.; Korc, M.; Guttridge, D.C.; Fearon, K.C.H. Cancer-associated cachexia. Nat. Rev. Dis. Primers 2018, 4, 17105. [Google Scholar] [CrossRef] [PubMed]
- Fearon, K.C. The Sir David Cuthbertson Medal Lecture 1991. The mechanisms and treatment of weight loss in cancer. Proc. Nutr. Soc. 1992, 51, 251–265. [Google Scholar] [CrossRef] [Green Version]
- Vaughan, V.C.; Martin, P.; Lewandowski, P.A. Cancer cachexia: Impact, mechanisms and emerging treatments. J. Cachexia Sarcopenia Muscle 2013, 4, 95–109. [Google Scholar] [CrossRef] [PubMed]
- Cole, C.L.; Kleckner, I.R.; Jatoi, A.; Schwarz, E.M.; Dunne, R.F. The Role of Systemic Inflammation in Cancer-Associated Muscle Wasting and Rationale for Exercise as a Therapeutic Intervention. JCSM Clin. Rep. 2018, 3, 1–19. [Google Scholar] [CrossRef] [Green Version]
- Sjoblom, B.; Gronberg, B.H.; Benth, J.S.; Baracos, V.E.; Flotten, O.; Hjermstad, M.J.; Aass, N.; Jordhoy, M. Low muscle mass is associated with chemotherapy-induced haematological toxicity in advanced non-small cell lung cancer. Lung Cancer 2015, 90, 85–91. [Google Scholar] [CrossRef] [PubMed]
- Degens, J.; Sanders, K.J.C.; de Jong, E.E.C.; Groen, H.J.M.; Smit, E.F.; Aerts, J.G.; Schols, A.; Dingemans, A.C. The prognostic value of early onset, CT derived loss of muscle and adipose tissue during chemotherapy in metastatic non-small cell lung cancer. Lung Cancer 2019, 133, 130–135. [Google Scholar] [CrossRef] [PubMed] [Green Version]
- Blum, D.; Stene, G.B.; Solheim, T.S.; Fayers, P.; Hjermstad, M.J.; Baracos, V.E.; Fearon, K.; Strasser, F.; Kaasa, S.; Euro, I. Validation of the Consensus-Definition for Cancer Cachexia and evaluation of a classification model—A study based on data from an international multicentre project (EPCRC-CSA). Ann. Oncol. 2014, 25, 1635–1642. [Google Scholar] [CrossRef]
- Edstrom, E.; Altun, M.; Hagglund, M.; Ulfhake, B. Atrogin-1/MAFbx and MuRF1 are downregulated in aging-related loss of skeletal muscle. J. Gerontol. A Biol. Sci. Med. Sci. 2006, 61, 663–674. [Google Scholar] [CrossRef]
- Yuan, L.; Han, J.; Meng, Q.; Xi, Q.; Zhuang, Q.; Jiang, Y.; Han, Y.; Zhang, B.; Fang, J.; Wu, G. Muscle-specific E3 ubiquitin ligases are involved in muscle atrophy of cancer cachexia: An in vitro and in vivo study. Oncol. Rep. 2015, 33, 2261–2268. [Google Scholar] [CrossRef] [Green Version]
- Bodine, S.C.; Baehr, L.M. Skeletal muscle atrophy and the E3 ubiquitin ligases MuRF1 and MAFbx/atrogin-1. Am. J. Physiol. Endocrinol. Metab. 2014, 307, E469–E484. [Google Scholar] [CrossRef] [Green Version]
- Belizario, J.E.; Fontes-Oliveira, C.C.; Borges, J.P.; Kashiabara, J.A.; Vannier, E. Skeletal muscle wasting and renewal: A pivotal role of myokine IL-6. Springerplus 2016, 5, 619. [Google Scholar] [CrossRef] [PubMed] [Green Version]
- Antoun, S.; Bayar, A.; Ileana, E.; Laplanche, A.; Fizazi, K.; di Palma, M.; Escudier, B.; Albiges, L.; Massard, C.; Loriot, Y. High subcutaneous adipose tissue predicts the prognosis in metastatic castration-resistant prostate cancer patients in post chemotherapy setting. Eur. J. Cancer 2015, 51, 2570–2577. [Google Scholar] [CrossRef] [PubMed]
- Petruzzelli, M.; Schweiger, M.; Schreiber, R.; Campos-Olivas, R.; Tsoli, M.; Allen, J.; Swarbrick, M.; Rose-John, S.; Rincon, M.; Robertson, G.; et al. A switch from white to brown fat increases energy expenditure in cancer-associated cachexia. Cell Metab. 2014, 20, 433–447. [Google Scholar] [CrossRef] [Green Version]
- Lefterova, M.I.; Zhang, Y.; Steger, D.J.; Schupp, M.; Schug, J.; Cristancho, A.; Feng, D.; Zhuo, D.; Stoeckert, C.J., Jr.; Liu, X.S.; et al. PPARgamma and C/EBP factors orchestrate adipocyte biology via adjacent binding on a genome-wide scale. Genes. Dev. 2008, 22, 2941–2952. [Google Scholar] [CrossRef] [Green Version]
- Ebadi, M.; Mazurak, V.C. Evidence and mechanisms of fat depletion in cancer. Nutrients 2014, 6, 5280–5297. [Google Scholar] [CrossRef] [PubMed] [Green Version]
- De van der Schueren, M.A.E.; Laviano, A.; Blanchard, H.; Jourdan, M.; Arends, J.; Baracos, V.E. Systematic review and meta-analysis of the evidence for oral nutritional intervention on nutritional and clinical outcomes during chemo(radio)therapy: Current evidence and guidance for design of future trials. Ann. Oncol. 2018, 29, 1141–1153. [Google Scholar] [CrossRef] [PubMed]
- Kir, S.; Spiegelman, B.M. Cachexia & Brown Fat: A Burning Issue in Cancer. Trends Cancer 2016, 2, 461–463. [Google Scholar] [CrossRef] [PubMed] [Green Version]
- Han, J.; Meng, Q.; Shen, L.; Wu, G. Interleukin-6 induces fat loss in cancer cachexia by promoting white adipose tissue lipolysis and browning. Lipids Health Dis. 2018, 17, 14. [Google Scholar] [CrossRef] [Green Version]
- Han, Y.H.; Kee, J.Y.; Kim, D.S.; Mun, J.G.; Park, S.H.; Kim, Y.J.; Um, J.Y.; Hong, S.H. Arctii Fructus Inhibits Colorectal Cancer Cell Proliferation and MMPs Mediated Invasion via AMPK. Am. J. Chin. Med. 2017, 45, 1309–1325. [Google Scholar] [CrossRef]
- Han, Y.H.; Kee, J.Y.; Kim, D.S.; Park, J.; Jeong, M.Y.; Mun, J.G.; Park, S.J.; Lee, J.H.; Um, J.Y.; Hong, S.H. Anti-obesity effects of Arctii Fructus (Arctium lappa) in white/brown adipocytes and high-fat diet-induced obese mice. Food Funct. 2016, 7, 5025–5033. [Google Scholar] [CrossRef]
- Kee, J.Y.; Hong, S.H. Inhibition of Mast Cell-Mediated Allergic Responses by Arctii Fructus Extracts and Its Main Compound Arctigenin. J. Agric. Food Chem. 2017, 65, 9443–9452. [Google Scholar] [CrossRef] [PubMed]
- Hall, D.T.; Griss, T.; Ma, J.F.; Sanchez, B.J.; Sadek, J.; Tremblay, A.M.K.; Mubaid, S.; Omer, A.; Ford, R.J.; Bedard, N.; et al. The AMPK agonist 5-aminoimidazole-4-carboxamide ribonucleotide (AICAR), but not metformin, prevents inflammation-associated cachectic muscle wasting. EMBO Mol. Med. 2018, 10. [Google Scholar] [CrossRef]
- Kim, A.; Im, M.; Gu, M.J.; Ma, J.Y. Citrus unshiu peel extract alleviates cancer-induced weight loss in mice bearing CT-26 adenocarcinoma. Sci. Rep. 2016, 6, 24214. [Google Scholar] [CrossRef] [Green Version]
- Han, Y.H.; Kee, J.Y.; Park, S.H.; Mun, J.G.; Jeon, H.D.; Park, J.; Zou, Q.P.; Liu, X.Q.; Hong, S.H. Rubrofusarin-6-beta-gentiobioside inhibits lipid accumulation and weight gain by regulating AMPK/mTOR signaling. Phytomedicine 2019, 62, 152952. [Google Scholar] [CrossRef]
- Qin, K.; Liu, Q.; Cai, H.; Cao, G.; Lu, T.; Shen, B.; Shu, Y.; Cai, B. Chemical analysis of raw and processed Fructus arctii by high-performance liquid chromatography/diode array detection-electrospray ionization-mass spectrometry. Pharmacogn. Mag. 2014, 10, 541–546. [Google Scholar] [CrossRef] [PubMed] [Green Version]
- Heinonen, S.; Nurmi, T.; Liukkonen, K.; Poutanen, K.; Wahala, K.; Deyama, T.; Nishibe, S.; Adlercreutz, H. In vitro metabolism of plant lignans: New precursors of mammalian lignans enterolactone and enterodiol. J. Agric. Food Chem. 2001, 49, 3178–3186. [Google Scholar] [CrossRef]
- Adlercreutz, H. Lignans and human health. Crit. Rev. Clin. Lab. Sci. 2007, 44, 483–525. [Google Scholar] [CrossRef]
- Peterson, J.; Dwyer, J.; Adlercreutz, H.; Scalbert, A.; Jacques, P.; McCullough, M.L. Dietary lignans: Physiology and potential for cardiovascular disease risk reduction. Nutr. Rev. 2010, 68, 571–603. [Google Scholar] [CrossRef] [Green Version]
- Gao, Q.; Yang, M.; Zuo, Z. Overview of the anti-inflammatory effects, pharmacokinetic properties and clinical efficacies of arctigenin and arctiin from Arctium lappa L. Acta Pharmacol. Sin. 2018, 39, 787–801. [Google Scholar] [CrossRef]
- Lee, S.; Shin, S.; Kim, H.; Han, S.; Kim, K.; Kwon, J.; Kwak, J.H.; Lee, C.K.; Ha, N.J.; Yim, D.; et al. Anti-inflammatory function of arctiin by inhibiting COX-2 expression via NF-kappaB pathways. J. Inflamm. 2011, 8, 16. [Google Scholar] [CrossRef] [PubMed] [Green Version]
- Zhao, F.; Wang, L.; Liu, K. In vitro anti-inflammatory effects of arctigenin, a lignan from Arctium lappa L., through inhibition on iNOS pathway. J. Ethnopharmacol. 2009, 122, 457–462. [Google Scholar] [CrossRef] [PubMed]
- Han, Y.H.; Kee, J.Y.; Kim, D.S.; Mun, J.G.; Jeong, M.Y.; Park, S.H.; Choi, B.M.; Park, S.J.; Kim, H.J.; Um, J.Y.; et al. Arctigenin Inhibits Lung Metastasis of Colorectal Cancer by Regulating Cell Viability and Metastatic Phenotypes. Molecules 2016, 21, 1135. [Google Scholar] [CrossRef] [PubMed] [Green Version]
- Davis, M.P.; Dickerson, D. Cachexia and anorexia: Cancer’s covert killer. Support. Care Cancer 2000, 8, 180–187. [Google Scholar] [CrossRef]
- Rehman, I.; Rehman, A. Anatomy, Thorax, Heart; StatPearls: Treasure Island, FL, USA, 2020. [Google Scholar]
- Petruzzelli, M.; Wagner, E.F. Mechanisms of metabolic dysfunction in cancer-associated cachexia. Genes. Dev. 2016, 30, 489–501. [Google Scholar] [CrossRef] [Green Version]
- Rohm, M.; Schafer, M.; Laurent, V.; Ustunel, B.E.; Niopek, K.; Algire, C.; Hautzinger, O.; Sijmonsma, T.P.; Zota, A.; Medrikova, D.; et al. An AMP-activated protein kinase-stabilizing peptide ameliorates adipose tissue wasting in cancer cachexia in mice. Nat. Med. 2016, 22, 1120–1130. [Google Scholar] [CrossRef]
- Marlatt, K.L.; Ravussin, E. Brown Adipose Tissue: An Update on Recent Findings. Curr. Obes. Rep. 2017, 6, 389–396. [Google Scholar] [CrossRef]
- Yoshida, T.; Delafontaine, P. Mechanisms of Cachexia in Chronic Disease States. Am. J. Med. Sci. 2015, 350, 250–256. [Google Scholar] [CrossRef] [Green Version]
- Hwang, S.Y.; Kang, Y.J.; Sung, B.; Kim, M.; Kim, D.H.; Lee, Y.; Yoo, M.A.; Kim, C.M.; Chung, H.Y.; Kim, N.D. Folic acid promotes the myogenic differentiation of C2C12 murine myoblasts through the Akt signaling pathway. Int. J. Mol. Med. 2015, 36, 1073–1080. [Google Scholar] [CrossRef] [Green Version]
- Xie, L.; Ortega, M.T.; Mora, S.; Chapes, S.K. Interactive changes between macrophages and adipocytes. Clin. Vaccine Immunol. 2010, 17, 651–659. [Google Scholar] [CrossRef] [Green Version]
- Wang, J.; Wang, Y.; Tong, M.; Pan, H.; Li, D. New Prospect for Cancer Cachexia: Medical Cannabinoid. J. Cancer 2019, 10, 716–720. [Google Scholar] [CrossRef] [PubMed]
- Advani, S.M.; Advani, P.G.; VonVille, H.M.; Jafri, S.H. Pharmacological management of cachexia in adult cancer patients: A systematic review of clinical trials. BMC Cancer 2018, 18, 1174. [Google Scholar] [CrossRef] [Green Version]
- Wen, H.S.; Li, X.; Cao, Y.Z.; Zhang, C.C.; Yang, F.; Shi, Y.M.; Peng, L.M. Clinical studies on the treatment of cancer cachexia with megestrol acetate plus thalidomide. Chemotherapy 2012, 58, 461–467. [Google Scholar] [CrossRef]
- Aoyagi, T.; Terracina, K.P.; Raza, A.; Matsubara, H.; Takabe, K. Cancer cachexia, mechanism and treatment. World J. Gastrointest. Oncol. 2015, 7, 17–29. [Google Scholar] [CrossRef] [PubMed]
- Yakabe, M.; Ogawa, S.; Ota, H.; Iijima, K.; Eto, M.; Ouchi, Y.; Akishita, M. Inhibition of interleukin-6 decreases atrogene expression and ameliorates tail suspension-induced skeletal muscle atrophy. PLoS ONE 2018, 13, e0191318. [Google Scholar] [CrossRef] [PubMed]
- Baltgalvis, K.A.; Berger, F.G.; Pena, M.M.; Davis, J.M.; White, J.P.; Carson, J.A. Muscle wasting and interleukin-6-induced atrogin-I expression in the cachectic Apc (Min/+) mouse. Pflug. Arch. 2009, 457, 989–1001. [Google Scholar] [CrossRef] [Green Version]
- Choi, Y.K.; Jung, K.Y.; Woo, S.M.; Yun, Y.J.; Jun, C.Y.; Park, J.H.; Shin, Y.C.; Cho, S.G.; Ko, S.G. Effect of Sipjeondaebo-tang on cancer-induced anorexia and cachexia in CT-26 tumor-bearing mice. Mediat. Inflamm. 2014, 2014, 736563. [Google Scholar] [CrossRef] [PubMed] [Green Version]
- Murphy, R.A.; Wilke, M.S.; Perrine, M.; Pawlowicz, M.; Mourtzakis, M.; Lieffers, J.R.; Maneshgar, M.; Bruera, E.; Clandinin, M.T.; Baracos, V.E.; et al. Loss of adipose tissue and plasma phospholipids: Relationship to survival in advanced cancer patients. Clin. Nutr. 2010, 29, 482–487. [Google Scholar] [CrossRef] [PubMed]
- Gregoire, F.M.; Smas, C.M.; Sul, H.S. Understanding adipocyte differentiation. Physiol. Rev. 1998, 78, 783–809. [Google Scholar] [CrossRef] [Green Version]
- Ahmadian, M.; Suh, J.M.; Hah, N.; Liddle, C.; Atkins, A.R.; Downes, M.; Evans, R.M. PPARgamma signaling and metabolism: The good, the bad and the future. Nat. Med. 2013, 19, 557–566. [Google Scholar] [CrossRef] [Green Version]
- Han, Y.H.; Kee, J.Y.; Park, J.; Kim, H.L.; Jeong, M.Y.; Kim, D.S.; Jeon, Y.D.; Jung, Y.; Youn, D.H.; Kang, J.; et al. Arctigenin Inhibits Adipogenesis by Inducing AMPK Activation and Reduces Weight Gain in High-Fat Diet-Induced Obese Mice. J. Cell Biochem. 2016, 117, 2067–2077. [Google Scholar] [CrossRef]
- Ranganathan, G.; Unal, R.; Pokrovskaya, I.; Yao-Borengasser, A.; Phanavanh, B.; Lecka-Czernik, B.; Rasouli, N.; Kern, P.A. The lipogenic enzymes DGAT1, FAS, and LPL in adipose tissue: Effects of obesity, insulin resistance, and TZD treatment. J. Lipid Res. 2006, 47, 2444–2450. [Google Scholar] [CrossRef] [Green Version]
- Varshney, S.; Shankar, K.; Beg, M.; Balaramnavar, V.M.; Mishra, S.K.; Jagdale, P.; Srivastava, S.; Chhonker, Y.S.; Lakshmi, V.; Chaudhari, B.P.; et al. Rohitukine inhibits in vitro adipogenesis arresting mitotic clonal expansion and improves dyslipidemia in vivo. J. Lipid Res. 2014, 55, 1019–1032. [Google Scholar] [CrossRef] [PubMed] [Green Version]
- Han, Y.H.; Li, Z.; Um, J.Y.; Liu, X.Q.; Hong, S.H. Anti-adipogenic effect of Glycoside St-E2 and Glycoside St-C1 isolated from the leaves of Acanthopanax henryi (Oliv.) Harms in 3T3-L1 cells. Biosci. Biotechnol. Biochem. 2016, 80, 2391–2400. [Google Scholar] [CrossRef] [Green Version]
- Han, Y.H.; Kee, J.Y.; Park, J.; Kim, D.S.; Shin, S.; Youn, D.H.; Kang, J.; Jung, Y.; Lee, Y.M.; Park, J.H.; et al. Lipin1-Mediated Repression of Adipogenesis by Rutin. Am. J. Chin. Med. 2016, 44, 565–578. [Google Scholar] [CrossRef] [PubMed]
- Chermesh, I.; Sobotka, L.; Hartman, C.; Meier, R. Malnutrition and nutrition-therapy: Our neglected responsibility. Gastroenterol. Res. Pr. 2011, 2011, 842085. [Google Scholar] [CrossRef] [PubMed]
- Vaitkus, J.A.; Celi, F.S. The role of adipose tissue in cancer-associated cachexia. Exp. Biol. Med. 2017, 242, 473–481. [Google Scholar] [CrossRef] [PubMed]
- Hu, H.H.; Yin, L.; Aggabao, P.C.; Perkins, T.G.; Chia, J.M.; Gilsanz, V. Comparison of brown and white adipose tissues in infants and children with chemical-shift-encoded water-fat MRI. J. Magn. Reson. Imaging 2013, 38, 885–896. [Google Scholar] [CrossRef] [PubMed] [Green Version]


| Target Gene | Primer Sequences |
|---|---|
| mPPAR | 5′-TTTCAAGGGTGCCAGTTTC-3′ (sense) |
| 5′-TTATTCATCAGGGAGGCCAG-3′ (antisense) | |
| mC/EBPα | 5′-GCCGAGATAAAGCCAAACAA-3′ (sense) |
| 5′-CGTAAATGGGGATTTGGTCA-3′ (antisense) | |
| mLPL | 5′-TGCCGCTGTTTTGTTTTACC-3′ (sense) |
| 5′-TCACAGTTTGCTGCTCCCAGC-3′ (antisense) | |
| mFAS | 5′-TGGTGGGTTTGGTGAATTGTC-3′ (sense) |
| 5′-GCTTGTCCTGCTCTAACTGGAAGT-3′ (antisense) | |
| maP2 | 5′-CGTAAATGGGGATTTGGTCA-3′ (sense) |
| 5′-TCGACTTTCCATCCCACTTC-3′ (antisense) | |
| mUCP1 | 5′-TCGACCTTAAAGGAATCCCC-3′ (sense) |
| 5′-CACAGGCTTTCCTTCTTTGC-3′ (antisense) | |
| mMAFbx | 5′-TCACAGCTCACATCCCTGAG-3′ (sense) |
| 5′-GACTTGCCGACTCTCTGGAC-3′ (antisense) | |
| mMuRF-1 | 5′-ATGGAGAACCTGGAGAAGCA-3′ (sense) |
| 5′-ACGGTCCATGATCACCTCAT-3′ (antisense) | |
| mGAPDH | 5′-AACTTTGGCATTGTGGAAGG-3′ (sense) |
| 5′-GGATGCAGGGATGATGTTCT-3′ (antisense) |
| AST (IU/L) | ALT (IU/L) | Creatinine (mg/dL) | BUN (mg/dL) | |
|---|---|---|---|---|
| Control | 94.60 ± 12.11 | 27.60 ± 6.65 | 0.14 ± 0.02 | 18.10 ± 2.42 |
| Tumor | 388.70 ± 81.43 # | 139.40 ± 16.15 # | 0.23 ± 0.03 # | 31.50 ± 4.09 # |
| Tumor + WAF | 157.90 ± 23.08 * | 72.00 ± 8.47 * | 0.17 ± 0.04 * | 23.20 ± 2.20 * |
| Tumor + EtAF | 166.20 ± 31.70 * | 71.50 ± 14.36 * | 0.18 ± 0.04 * | 23.10 ± 3.00 * |
Publisher’s Note: MDPI stays neutral with regard to jurisdictional claims in published maps and institutional affiliations. |
© 2020 by the authors. Licensee MDPI, Basel, Switzerland. This article is an open access article distributed under the terms and conditions of the Creative Commons Attribution (CC BY) license (http://creativecommons.org/licenses/by/4.0/).
Share and Cite
Han, Y.-H.; Mun, J.-G.; Jeon, H.D.; Yoon, D.H.; Choi, B.-M.; Kee, J.-Y.; Hong, S.-H. The Extract of Arctium lappa L. Fruit (Arctii Fructus) Improves Cancer-Induced Cachexia by Inhibiting Weight Loss of Skeletal Muscle and Adipose Tissue. Nutrients 2020, 12, 3195. https://0-doi-org.brum.beds.ac.uk/10.3390/nu12103195
Han Y-H, Mun J-G, Jeon HD, Yoon DH, Choi B-M, Kee J-Y, Hong S-H. The Extract of Arctium lappa L. Fruit (Arctii Fructus) Improves Cancer-Induced Cachexia by Inhibiting Weight Loss of Skeletal Muscle and Adipose Tissue. Nutrients. 2020; 12(10):3195. https://0-doi-org.brum.beds.ac.uk/10.3390/nu12103195
Chicago/Turabian StyleHan, Yo-Han, Jeong-Geon Mun, Hee Dong Jeon, Dae Hwan Yoon, Byung-Min Choi, Ji-Ye Kee, and Seung-Heon Hong. 2020. "The Extract of Arctium lappa L. Fruit (Arctii Fructus) Improves Cancer-Induced Cachexia by Inhibiting Weight Loss of Skeletal Muscle and Adipose Tissue" Nutrients 12, no. 10: 3195. https://0-doi-org.brum.beds.ac.uk/10.3390/nu12103195