Neutral Human Milk Oligosaccharides Are Associated with Multiple Fixed and Modifiable Maternal and Infant Characteristics

 , ,
, ,
Abstract
:1. Introduction
2. Materials and Methods
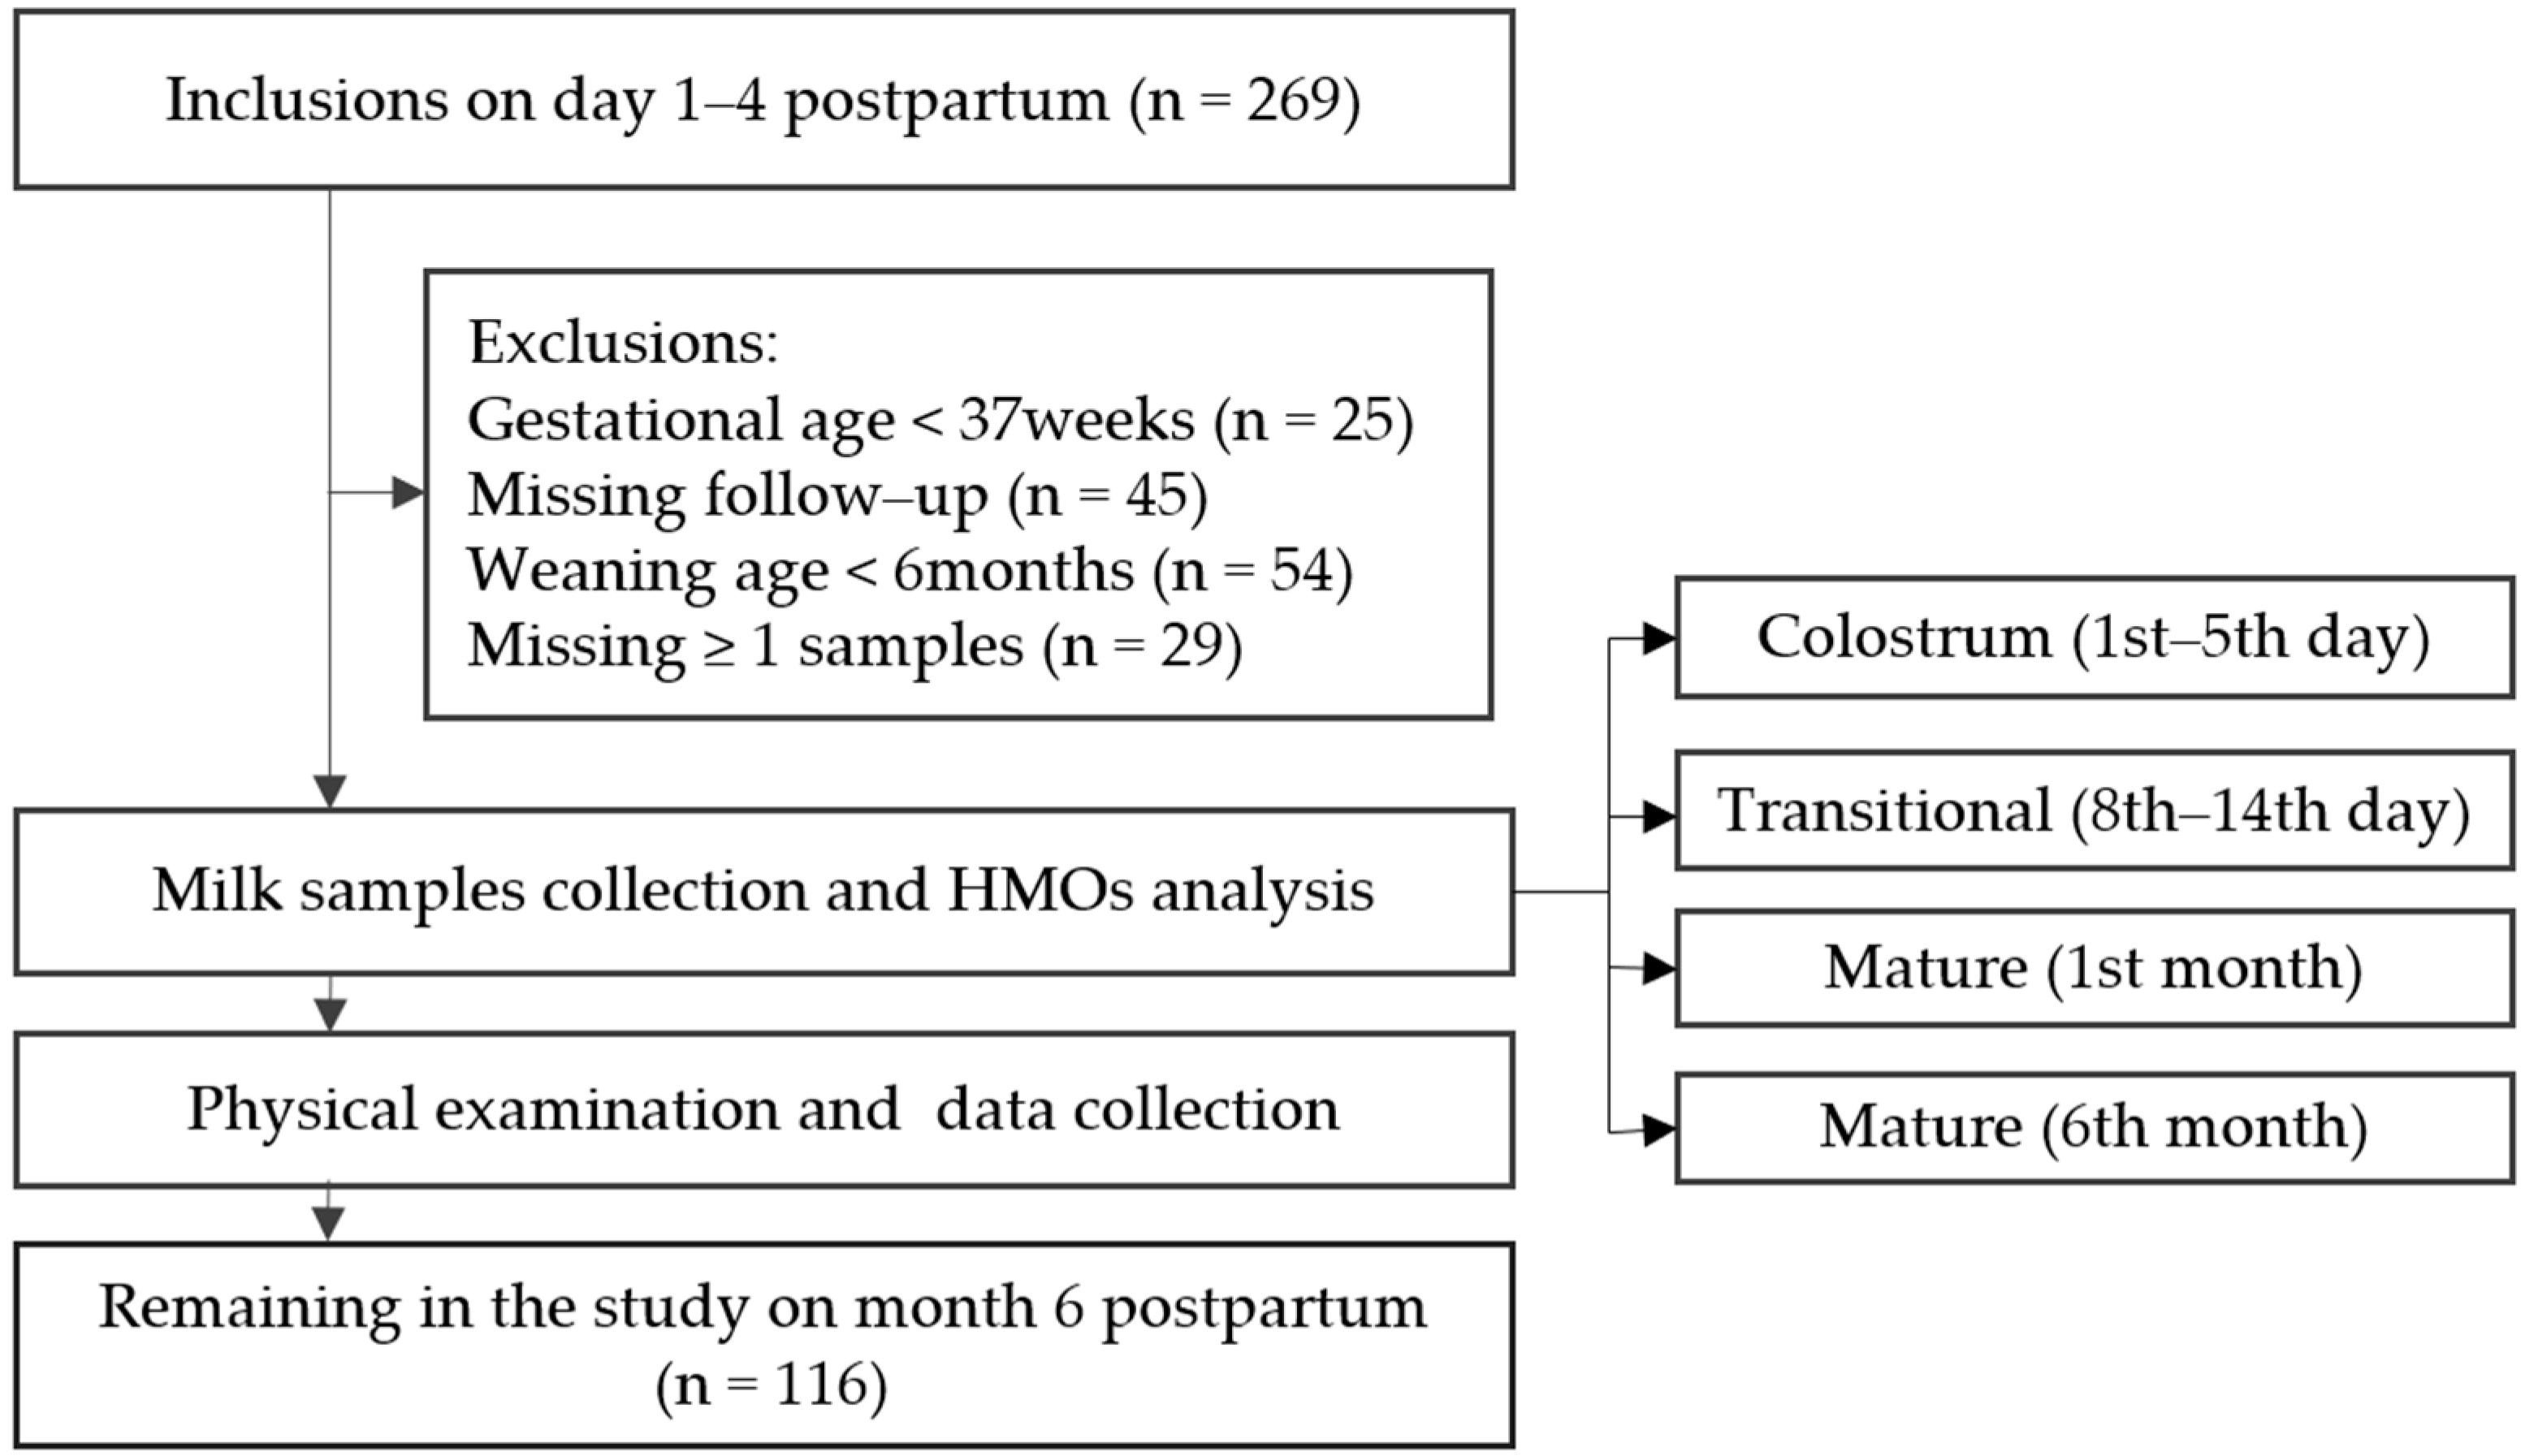
2.1. Design and Study Population
2.2. Data Collection and Variable Definitions
2.3. Milk Collection and Preservation
2.4. HMOs Analysis Based on HPLC-ESI-MS
2.4.1. HMOs Reduction and Purification
2.4.2. HMOs Identification and Quantification
2.5. Ethical Considerations
2.6. Secretor and Lewis Phenotype Determination
2.7. Statistical Analyses
3. Results
3.1. Characteristics of Studied Population
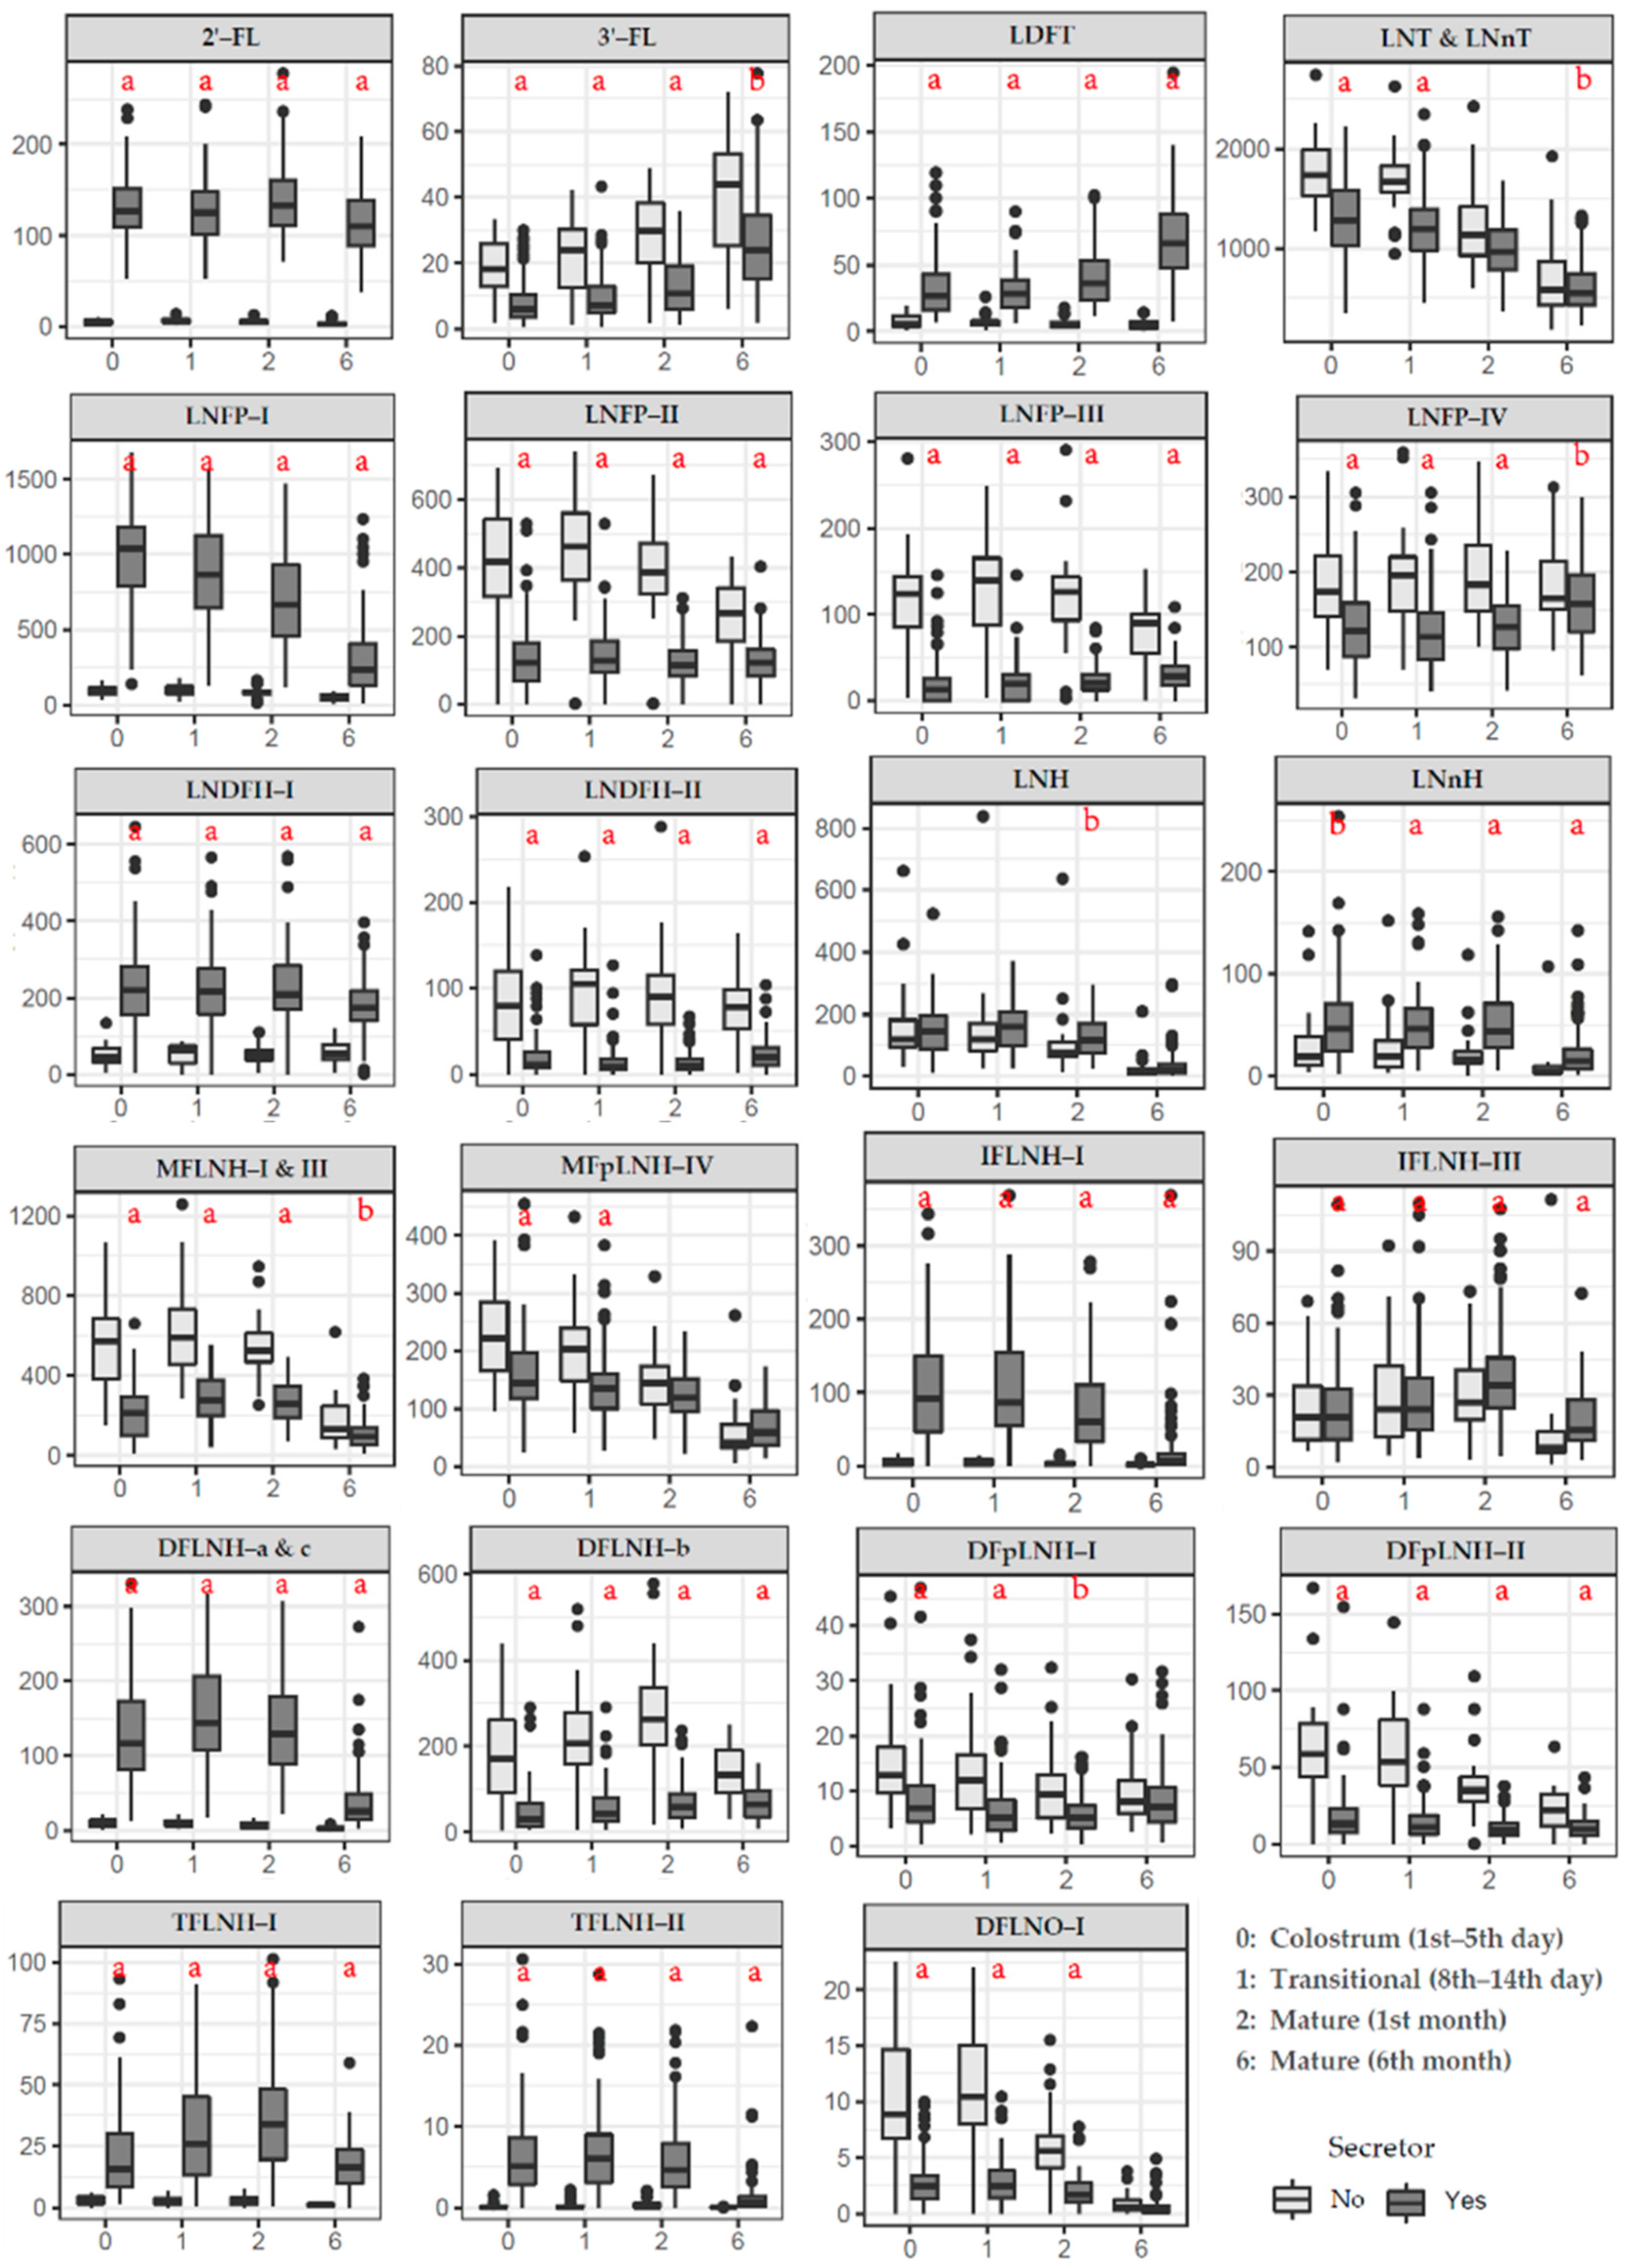
3.2. HMOs Concentration in Secretors versus Non-Secretors
3.3. Changes in Individual HMO Concentration During Lactation
3.4. Other Factors and Individual HMO Concentration
3.5. Associations of Individual HMO with Infant Growth Status and Disease Status
4. Discussion
4.1. Analysis Method of HMOs
4.2. Secretor and Lewis Phenotype
4.3. HMOs Concentration in Secretors versus Non-Secretors
4.4. HMOs Concentration During Lactation
4.5. Other Factors & HMOs
4.6. HMOs & Infant Growth and Disease Status
4.7. Strengths and Limitations of the Study
5. Conclusions
Author Contributions
Funding
Acknowledgments
Conflicts of Interest
Abbreviations
| HMOs | human milk oligosaccharides |
| HPLC | high performance liquid chromatography |
| MS | mass spectrometer |
| Glc | glucose |
| Gal | galactose |
| GlcNAc | N-acetyl-glucosamine |
| Fuc | fucose |
| Neu5Ac | sialic acid |
| LacNAc | N-acetyl-lactosamine |
| FUT | fucosyltransferase |
| ESI | electrospray ionization |
| QC | quality control |
| SPE | solid phase extraction |
| GCC | graphitized carbon cartridges |
| ACN | acetonitrile |
| TFA | trifluoroacetic acid |
| FA | formic acid |
| Se+ | Secretor positive phenotype |
| Se- | Secretor negative phenotype |
| Le+ | Lewis positive phenotype |
| Le- | Lewis negative phenotype |
| 2′-FL | 2′-Fucosyllactose |
| 3′-FL | 3′-Fucosyllactose |
| LDFT | Lactodifucotetraose |
| LNT | Lacto-N-tetraose |
| LNnT | Lacto-N-neotetraose |
| LNFP-I | Lacto-N-fucopentaose-I |
| LNFP-II | Lacto-N-fucopentaose-II |
| LNFP-III | Lacto-N-fucopentaose-III |
| LNFP-IV | Lacto-N-fucopentaose-IV |
| LNDFH-I | Lacto-N-difucohexaose-I |
| LNDFH-II | Lacto-N-difucohexaose-II |
| LNH | Lacto-N-hexaose |
| LNnH | Lacto-N-neohexaose |
| MFLNH-I | Monofucosyllacto-N-hexaose-I |
| MFLNH-III | Monofucosyllacto-N-hexaose-III |
| MFpLNH-IV | Monofucosyl-para-lacto-N-hexaose-IV |
| IFLNH-I | Isomer-fucosyl-lacto-N-hexaose-I |
| IFLNH-III | Isomer-fucosyl-lacto-N-hexaose-III |
| DFLNH-a | Difucosyllacto-N-hexaose-a |
| DFLNH-b | Difucosyllacto-N-hexaose-b |
| DFLNH-c | Difucosyllacto-N-hexaose-c |
| DFpLNH-I | Difucosyl-para-lacto-N-hexaose |
| DFpLNH-II | Difucosyl-para-lacto-N-hexaose |
| TFLNH-I | Trifucosyllacto-N-hexaose |
| TFLNH-II | Trifucosyllacto-N-hexaose |
| DFLNO-I | Difucosyllacto-N-octaose |
References
- Gura, T. Nature’s first functional food. Science 2014, 345, 747–749. [Google Scholar] [CrossRef]
- Andreas, N.J.; Kampmann, B.; Mehring Le-Doare, K. Human breast milk: A review on its composition and bioactivity. Early Hum. Dev. 2015, 91, 629–635. [Google Scholar] [CrossRef]
- Thomson, P.; Medina, D.A.; Garrido, D. Human milk oligosaccharides and infant gut bifidobacteria: Molecular strategies for their utilization. Food Microbiol. 2018, 75, 37–46. [Google Scholar] [CrossRef]
- Le Doare, K.; Holder, B.; Bassett, A.; Pannaraj, P.S. Mother’s Milk: A Purposeful Contribution to the Development of the Infant Microbiota and Immunity. Front. Immunol. 2018, 9, 361. [Google Scholar] [CrossRef] [Green Version]
- Lis-Kuberka, J.; Orczyk-Pawiłowicz, M. Sialylated Oligosaccharides and Glycoconjugates of Human Milk. The Impact on Infant and Newborn Protection, Development and Well-Being. Nutrients 2019, 11, 306. [Google Scholar] [CrossRef] [Green Version]
- Plaza-Díaz, J.; Fontana, L.; Gil, A. Human Milk Oligosaccharides and Immune System Development. Nutrients 2018, 10, 1038. [Google Scholar] [CrossRef] [Green Version]
- Bering, S.B. Human Milk Oligosaccharides to Prevent Gut Dysfunction and Necrotizing Enterocolitis in Preterm Neonates. Nutrients 2018, 10, 1461. [Google Scholar] [CrossRef] [Green Version]
- Ramani, S.; Stewart, C.J.; Laucirica, D.R.; Ajami, N.J.; Robertson, B.; Autran, C.A.; Shinge, D.; Rani, S.; Anandan, S.; Hu, L.; et al. Human milk oligosaccharides, milk microbiome and infant gut microbiome modulate neonatal rotavirus infection. Nat. Commun. 2018, 9, 5010. [Google Scholar] [CrossRef] [Green Version]
- Martin, C.R.; Ling, P.-R.; Blackburn, G.L. Review of Infant Feeding: Key Features of Breast Milk and Infant Formula. Nutrients 2016, 8, 279. [Google Scholar] [CrossRef] [Green Version]
- Triantis, V.; Bode, L.; van Neerven, R.J.J. Immunological Effects of Human Milk Oligosaccharides. Front. Pediatr. 2018, 6, 190. [Google Scholar] [CrossRef]
- Thurl, S.; Munzert, M.; Boehm, G.; Matthews, C.; Stahl, B. Systematic review of the concentrations of oligosaccharides in human milk. Nutr. Rev. 2017, 75, 920–933. [Google Scholar] [CrossRef] [Green Version]
- Manz, C.; Pagel, K. Glycan analysis by ion mobility-mass spectrometry and gas-phase spectroscopy. Curr. Opin. Chem. Biol. 2018, 42, 16–24. [Google Scholar] [CrossRef]
- Smilowitz, J.T.; Lebrilla, C.B.; Mills, D.A.; German, J.B.; Freeman, S.L. Breast milk oligosaccharides: Structure-function relationships in the neonate. Annu. Rev. Nutr. 2014, 34, 143–169. [Google Scholar] [CrossRef] [Green Version]
- Ayechu-Muruzabal, V.; van Stigt, A.H.; Mank, M.; Willemsen, L.E.M.; Stahl, B.; Garssen, J.; Van’t Land, B. Diversity of Human Milk Oligosaccharides and Effects on Early Life Immune Development. Front. Pediatrics 2018, 6, 239. [Google Scholar] [CrossRef] [Green Version]
- Elwakiel, M.; Hageman, J.A.; Wang, W.; Szeto, I.M.; van Goudoever, J.B.; Hettinga, K.A.; Schols, H.A. Human Milk Oligosaccharides in Colostrum and Mature Milk of Chinese Mothers: Lewis Positive Secretor Subgroups. J. Agric. Food Chem. 2018, 66, 7036–7043. [Google Scholar] [CrossRef]
- Cabrera-Rubio, R.; Kunz, C.; Rudloff, S.; García-Mantrana, I.; Crehuá-Gaudiza, E.; Martínez-Costa, C.; Collado, M.C. Association of Maternal Secretor Status and Human Milk Oligosaccharides With Milk Microbiota: An Observational Pilot Study. J. Pediatric Gastroenterol. Nutr. 2019, 68, 256–263. [Google Scholar] [CrossRef]
- Austin, S.; De Castro, C.A.; Sprenger, N.; Binia, A.; Affolter, M.; Garcia-Rodenas, C.L.; Beauport, L.; Tolsa, J.F.; Fischer Fumeaux, C.J. Human Milk Oligosaccharides in the Milk of Mothers Delivering Term versus Preterm Infants. Nutrients 2019, 11, 1282. [Google Scholar] [CrossRef] [Green Version]
- McGuire, M.K.; Meehan, C.L.; McGuire, M.A.; Williams, J.E.; Foster, J.; Sellen, D.W.; Kamau-Mbuthia, E.W.; Kamundia, E.W.; Mbugua, S.; Moore, S.E.; et al. What’s normal? Oligosaccharide concentrations and profiles in milk produced by healthy women vary geographically. Am. J. Clin. Nutr. 2017, 105, 1086–1100. [Google Scholar] [CrossRef]
- Castanys-Muñoz, E.; Martin, M.J.; Prieto, P.A. 2′-fucosyllactose: An abundant, genetically determined soluble glycan present in human milk. Nutr. Rev. 2013, 71, 773–789. [Google Scholar] [CrossRef]
- Sprenger, N.; Lee, L.Y.; De Castro, C.A.; Steenhout, P.; Thakkar, S.K. Longitudinal change of selected human milk oligosaccharides and association to infants’ growth, an observatory, single center, longitudinal cohort study. PLoS ONE 2017, 12, e0171814. [Google Scholar] [CrossRef] [Green Version]
- Xu, G.; Davis, J.C.; Goonatilleke, E.; Smilowitz, J.T.; German, J.B.; Lebrilla, C.B. Absolute Quantitation of Human Milk Oligosaccharides Reveals Phenotypic Variations during Lactation. J. Nutr. 2017, 147, 117–124. [Google Scholar] [CrossRef] [Green Version]
- Bao, Y.; Chen, C.; Newburg, D.S. Quantification of neutral human milk oligosaccharides by graphitic carbon high-performance liquid chromatography with tandem mass spectrometry. Anal. Biochem. 2013, 433, 28–35. [Google Scholar] [CrossRef] [Green Version]
- Sakaguchi, Y.; Hayama, T.; Yoshida, H.; Itoyama, M.; Todoroki, K.; Yamaguchi, M.; Nohta, H. Liquid chromatography/tandem mass spectrometry with fluorous derivatization method for selective analysis of sialyl oligosaccharides. Rapid Commun. Mass Spectrom. RCM 2014, 28, 2481–2489. [Google Scholar] [CrossRef]
- Tonon, M.K.; de Morais, B.M.; Abrão, F.V.; Cristina, A.; Miranda, A.; Morais, B.T. Maternal and Infant Factors Associated with Human Milk Oligosaccharides Concentrations According to Secretor and Lewis Phenotypes. Nutrients 2019, 11, 1358. [Google Scholar] [CrossRef] [Green Version]
- Thurl, S.; Munzert, M.; Henker, J.; Boehm, G.; Muller-Werner, B.; Jelinek, J.; Stahl, B. Variation of human milk oligosaccharides in relation to milk groups and lactational periods. Br. J. Nutr. 2010, 104, 1261–1271. [Google Scholar] [CrossRef] [Green Version]
- Austin, S.; De Castro, C.A.; Benet, T.; Hou, Y.; Sun, H.; Thakkar, S.K.; Vinyes-Pares, G.; Zhang, Y.; Wang, P. Temporal Change of the Content of 10 Oligosaccharides in the Milk of Chinese Urban Mothers. Nutrients 2016, 8, 346. [Google Scholar] [CrossRef] [Green Version]
- Bai, Y.; Tao, J.; Zhou, J.; Fan, Q.; Liu, M.; Hu, Y.; Xu, Y.; Zhang, L.; Yuan, J.; Li, W.; et al. Fucosylated Human Milk Oligosaccharides and N-Glycans in the Milk of Chinese Mothers Regulate the Gut Microbiome of Their Breast-Fed Infants during Different Lactation Stages. mSystems 2018, 3, e00206–e00218. [Google Scholar] [CrossRef] [Green Version]
- Azad, M.B.; Robertson, B.; Atakora, F.; Becker, A.B.; Subbarao, P.; Moraes, T.J.; Mandhane, P.J.; Turvey, S.E.; Lefebvre, D.L.; Sears, M.R.; et al. Human Milk Oligosaccharide Concentrations Are Associated with Multiple Fixed and Modifiable Maternal Characteristics, Environmental Factors, and Feeding Practices. J. Nutr. 2018, 148, 1733–1742. [Google Scholar] [CrossRef]
- Charbonneau, M.R.; O’Donnell, D.; Blanton, L.V.; Totten, S.M.; Davis, J.C.C.; Barratt, M.J.; Cheng, J.; Guruge, J.; Talcott, M.; Bain, J.R.; et al. Sialylated Milk Oligosaccharides Promote Microbiota-Dependent Growth in Models of Infant Undernutrition. Cell 2016, 164, 859–871. [Google Scholar] [CrossRef]
- Totten, S.M.; Zivkovic, A.M.; Wu, S.; Ngyuen, U.; Freeman, S.L.; Ruhaak, L.R.; Darboe, M.K.; German, J.B.; Prentice, A.M.; Lebrilla, C.B. Comprehensive profiles of human milk oligosaccharides yield highly sensitive and specific markers for determining secretor status in lactating mothers. J. Proteome. Res. 2012, 11, 6124–6133. [Google Scholar] [CrossRef]
- Wu, S.; Tao, N.; German, J.B.; Grimm, R.; Lebrilla, C.B. Development of an annotated library of neutral human milk oligosaccharides. J. Proteome. Res. 2010, 9, 4138–4151. [Google Scholar] [CrossRef] [PubMed] [Green Version]
- Remoroza, C.A.; Mak, T.D.; De Leoz, M.L.A.; Mirokhin, Y.A.; Stein, S.E. Creating a Mass Spectral Reference Library for Oligosaccharides in Human Milk. Anal. Chem. 2018, 90, 8977–8988. [Google Scholar] [CrossRef] [PubMed]
- Packer, N.H.; Lawson, M.A.; Jardine, D.R.; Redmond, J.W. A general approach to desalting oligosaccharides released from glycoproteins. Glycoconj. J. 1998, 15, 737–747. [Google Scholar] [CrossRef]
- Wu, S.; Grimm, R.; German, J.B.; Lebrilla, C.B. Annotation and structural analysis of sialylated human milk oligosaccharides. J. Proteome Res. 2011, 10, 856–868. [Google Scholar] [CrossRef] [Green Version]
- Kunz, C.; Meyer, C.; Collado, M.C.; Geiger, L.; Garcia-Mantrana, I.; Bertua-Rios, B.; Martinez-Costa, C.; Borsch, C.; Rudloff, S. Influence of Gestational Age, Secretor, and Lewis Blood Group Status on the Oligosaccharide Content of Human Milk. J. Pediatr. Gastroenterol. Nutr. 2017, 64, 789–798. [Google Scholar] [CrossRef]
- Kunz, C. Historical aspects of human milk oligosaccharides. Adv. Nutr. 2012, 3, 430S–439S. [Google Scholar] [CrossRef] [Green Version]
- Zhang, W.; Wang, T.; Chen, X.; Pang, X.; Zhang, S.; Obaroakpo, J.U.; Shilong, J.; Lu, J.; Lv, J. Absolute quantification of twelve oligosaccharides in human milk using a targeted mass spectrometry-based approach. Carbohydr. Polym. 2019, 219, 328–333. [Google Scholar] [CrossRef]
- Wang, C.; Lang, Y.; Li, Q.; Jin, X.; Li, G.; Yu, G. Glycosaminoglycanomic profiling of human milk in different stages of lactation by liquid chromatography-tandem mass spectrometry. Food Chem. 2018, 258, 231–236. [Google Scholar] [CrossRef]
- Galeotti, F.; Coppa, G.V.; Zampini, L.; Maccari, F.; Galeazzi, T.; Padella, L.; Santoro, L.; Gabrielli, O.; Volpi, N. Capillary electrophoresis separation of human milk neutral and acidic oligosaccharides derivatized with 2-aminoacridone. Electrophoresis 2014, 35, 811–818. [Google Scholar] [CrossRef]
- Gabrielli, O.; Zampini, L.; Galeazzi, T.; Padella, L.; Santoro, L.; Peila, C.; Giuliani, F.; Bertino, E.; Fabris, C.; Coppa, G.V. Preterm milk oligosaccharides during the first month of lactation. Pediatrics 2011, 128, e1520–e1531. [Google Scholar] [CrossRef]
- Guo, M.; Luo, G.; Lu, R.; Shi, W.; Cheng, H.; Lu, Y.; Jin, K.; Yang, C.; Wang, Z.; Long, J.; et al. Distribution of Lewis and Secretor polymorphisms and corresponding CA19-9 antigen expression in a Chinese population. FEBS Open Bio. 2017, 7, 1660–1671. [Google Scholar] [CrossRef]
- De Leoz, M.L.A.; Gaerlan, S.C.; Strum, J.S.; Dimapasoc, L.M.; Mirmiran, M.; Tancredi, D.J.; Smilowitz, J.T.; Kalanetra, K.M.; Mills, D.A.; German, J.B.; et al. Lacto-N-tetraose, fucosylation, and secretor status are highly variable in human milk oligosaccharides from women delivering preterm. J. Proteome Res. 2012, 11, 4662–4672. [Google Scholar] [CrossRef] [Green Version]
- Albrecht, S.; Schols, H.A.; van den Heuvel, E.G.; Voragen, A.G.; Gruppen, H. Occurrence of oligosaccharides in feces of breast-fed babies in their first six months of life and the corresponding breast milk. Carbohydr. Res. 2011, 346, 2540–2550. [Google Scholar] [CrossRef]
- Bode, L. Human Milk Oligosaccharides in the Prevention of Necrotizing Enterocolitis: A Journey From in vitro and in vivo Models to Mother-Infant Cohort Studies. Front. Pediatr. 2018, 6, 385. [Google Scholar] [CrossRef]
- Akkerman, R.; Faas, M.M.; de Vos, P. Non-digestible carbohydrates in infant formula as substitution for human milk oligosaccharide functions: Effects on microbiota and gut maturation. Crit. Rev. Food Sci. Nutr. 2018, 1–12. [Google Scholar] [CrossRef]
- Munblit, D.; Peroni, D.G.; Boix-Amorós, A.; Hsu, P.S.; Van’t Land, B.; Gay, M.C.L.; Kolotilina, A.; Skevaki, C.; Boyle, R.J.; Collado, M.C.; et al. Human Milk and Allergic Diseases: An Unsolved Puzzle. Nutrients 2017, 9, 894. [Google Scholar] [CrossRef]
- Fields, D.A.; George, B.; Williams, M.; Whitaker, K.; Allison, D.B.; Teague, A.; Demerath, E.W. Associations between human breast milk hormones and adipocytokines and infant growth and body composition in the first 6 months of life. Pediatr. Obes. 2017, 12 (Suppl. 1), 78–85. [Google Scholar] [CrossRef] [Green Version]
- Hahn, W.-H.; Song, J.-H.; Song, S.; Kang, N.M. Do gender and birth height of infant affect calorie of human milk? An association study between human milk macronutrient and various birth factors. J. Matern. Fetal. Neona 2017, 30, 1608–1612. [Google Scholar] [CrossRef]
- Galante, L.; Milan, A.M.; Reynolds, C.M.; Cameron-Smith, D.; Vickers, M.H.; Pundir, S. Sex-Specific Human Milk Composition: The Role of Infant Sex in Determining Early Life Nutrition. Nutrients 2018, 10, 1194. [Google Scholar] [CrossRef] [Green Version]
- Alderete, T.L.; Autran, C.; Brekke, B.E.; Knight, R.; Bode, L.; Goran, M.I.; Fields, D.A. Associations between human milk oligosaccharides and infant body composition in the first 6 mo of life. Am. J. Clin. Nutr. 2015, 102, 1381–1388. [Google Scholar] [CrossRef]
- Doherty, A.M.; Lodge, C.J.; Dharmage, S.C.; Dai, X.; Bode, L.; Lowe, A.J. Human Milk Oligosaccharides and Associations With Immune-Mediated Disease and Infection in Childhood: A Systematic Review. Front. Pediatrics 2018, 6, 91. [Google Scholar] [CrossRef] [Green Version]


| 2′-FL | LNFP-II | ||
|---|---|---|---|
| Se+ | ≥15 mg/L in ≥1 milk sample | Le+ | ≥30 mg/L in ≥1 milk sample |
| Se- | <15 mg/L in all milk samples | Le- | <30 mg/L in all milk samples |
| All Women (n = 116) | Secretors (n = 94) | Non-Secretors (n = 22) | p | |
|---|---|---|---|---|
| Mothers | ||||
| Age, years | 29.92 ± 5.18 | 29.76 ± 4.47 | 30.63 ± 7.6 | 0.479 |
| Area | 0.403 | |||
| Beijing | 59 (50.9%) | 47 (50%) | 12 (54.5%) | |
| Xuchang | 29 (25%) | 22 (23.4%) | 7 (31.8%) | |
| Suzhou | 28 (24.1%) | 25 (26.6%) | 3 (13.6%) | |
| Allergic history | 0.913 | |||
| Yes | 15 (12.9%) | 12 (12.8%) | 3 (13.6%) | |
| No | 101 (87.1%) | 82 (87.2%) | 19 (86.4%) | |
| Pre-pregnancy BMI, kg/m2 | 20.96 ± 3.16 | 20.97 ± 3.03 | 20.94 ± 3.74 | 0.964 |
| Parity | 0.397 | |||
| Primiparous | 92 (79.3%) | 76(80.9%) | 16 (72.7%) | |
| Multiparous | 24 (20.7%) | 18(19.1%) | 6 (27.3%) | |
| Delivery mode | 0.774 | |||
| Cesarean section | 34 (29.3%) | 27 (28.7%) | 7 (31.8%) | |
| Natural delivery | 82 (70.7%) | 67 (71.3%) | 15 (68.2%) | |
| Infants | ||||
| Gestational age, weeks | 39.56 ± 1.05 | 39.51 ± 1.01 | 39.79 ± 1.17 | 0.257 |
| Gender | 0.960 | |||
| Boys | 68 (58.6%) | 55 (58.5%) | 13 (59.1%) | |
| Girls | 48 (41.4%) | 39 (41.5%) | 9 (40.9%) | |
| Weight at birth, Kg | 3.46 ± 0.42 | 3.45 ± 0.43 | 3.47 ± 0.39 | 0.883 |
| Month 1 weight gain, Kg | 1.31 ± 0.64 | 1.33 ± 0.67 | 1.20 ± 0.51 | 0.397 |
| Month 6 weight gain, Kg | 4.67 ± 1.07 | 4.62 ± 1.13 | 4.86 ± 0.83 | 0.366 |
| Length at birth, cm | 50.47 ± 1.65 | 50.37 ± 1.59 | 50.91 ± 1.82 | 0.165 |
| Month 1 length gain, cm | 4.63 ± 2.10 | 4.63 ± 2.13 | 4.60 ± 2.01 | 0.958 |
| Month 6 length gain, cm | 17.72 ± 2.91 | 17.73 ± 2.77 | 17.66 ± 3.46 | 0.923 |
| Month 1 (sick/illness) | 0.503 | |||
| Yes | 92 (79.3%) | 74 (78.7%) | 18 (81.8%) | |
| No | 24 (20.7%) | 20 (21.3%) | 4 (18.2%) | |
| Month 6 (sick/illness) | 0.391 | |||
| Yes | 79 (77.5%) | 61 (75.3%) | 18 (85.7%) | |
| No | 23 (22.5%) | 20 (24.7%) | 3 (14.3%) |
| Maternal Age | Allergic History | Pre-Pregnancy BMI | Parity | |||||||||||||||||
| 0 | 1 | 2 | 6 | P a | 0 | 1 | 2 | 6 | P a | 0 | 1 | 2 | 6 | P a | 0 | 1 | 2 | 6 | P a | |
| Non-Secretors | ||||||||||||||||||||
| 3′-FL | 0.35 | 0.16 | 0.11 | 0.09 | 0.887 | 0.34 | 0.37 | 0.24 | 0.26 | 0.549 | −0.21 | −0.32 | −0.51 * | −0.35 | 0.109 | −0.11 | 0.05 | 0.08 | 0.03 | 0.766 |
| LNT&LNnT | 0.20 | 0.22 | 0.07 | −0.25 | 0.917 | 0.07 | −0.03 | 0.05 | −0.03 | 0.969 | 0.30 | 0.17 | 0.26 | 0.18 | 0.363 | 0.19 | 0.11 | 0.11 | 0.14 | 0.393 |
| LNFP-III | 0.22 | 0.00 | −0.01 | −0.40 | 0.515 | 0.24 | 0.11 | 0.05 | −0.14 | 0.912 | −0.23 | −0.08 | −0.09 | −0.25 | 0.195 | 0.26 | 0.19 | 0.06 | 0.13 | 0.110 |
| LNFP-II | 0.44 * | 0.30 | 0.27 | −0.20 | 0.327 | 0.43 * | 0.26 | 0.22 | 0.05 | 0.863 | −0.32 | −0.24 | −0.14 | −0.52 * | 0.125 | 0.11 | 0.06 | −0.02 | −0.06 | 0.162 |
| LNFP-IV | 0.57 ** | 0.29 | 0.33 | 0.08 | 0.284 | 0.22 | 0.03 | −0.20 | 0.20 | 0.089 | −0.08 | −0.16 | −0.18 | −0.26 | 0.200 | −0.10 | −0.21 | −0.23 | 0.19 | 0.925 |
| LNDFH-II | 0.34 | 0.25 | 0.13 | −0.05 | 0.755 | 0.43 * | 0.39 | 0.32 | 0.22 | 0.577 | −0.19 | −0.08 | −0.20 | −0.42 | 0.170 | 0.11 | 0.05 | −0.02 | 0.03 | 0.694 |
| LNH | 0.00 | 0.15 | 0.16 | −0.36 | 0.562 | −0.18 | −0.28 | −0.09 | 0.03 | 0.147 | 0.08 | 0.00 | 0.13 | 0.03 | 0.176 | 0.08 | 0.05 | 0.08 | 0.10 | 0.731 |
| LNnH | 0.15 | 0.26 | 0.26 | −0.16 | 0.627 | −0.14 | −0.20 | −0.11 | 0.11 | 0.577 | −0.12 | −0.22 | −0.11 | −0.12 | 0.475 | −0.08 | −0.21 | 0.11 | 0.13 | 0.538 |
| MFLNH-I & III | 0.38 | 0.40 | 0.31 | −0.41 | 0.070 | −0.24 | −0.30 | −0.05 | −0.01 | 0.697 | 0.04 | 0.08 | 0.30 | 0.16 | 0.172 | −0.18 | −0.10 | 0.08 | 0.02 | 0.688 |
| MFpLNH-IV | 0.23 | 0.24 | 0.34 | −0.20 | 0.850 | −0.05 | −0.11 | −0.11 | 0.05 | 0.917 | 0.00 | −0.21 | −0.01 | −0.04 | 0.544 | 0.19 | 0.00 | −0.02 | 0.18 | 0.322 |
| IFLNH-III | 0.35 | 0.32 | 0.34 | −0.30 | 0.803 | −0.18 | −0.18 | −0.09 | 0.11 | 0.985 | −0.12 | −0.25 | −0.25 | −0.15 | 0.932 | −0.06 | −0.18 | −0.06 | 0.11 | 0.798 |
| DFLNH-b | 0.36 | 0.39 | 0.15 | −0.09 | 0.670 | 0.01 | 0.09 | 0.26 | 0.26 | 0.044 | −0.38 | −0.35 | −0.30 | −0.36 | 0.005 | −0.05 | 0.11 | 0.05 | 0.10 | 0.755 |
| DFpLNH-I | 0.42 | 0.08 | 0.31 | 0.09 | 0.444 | 0.43 * | 0.24 | −0.05 | 0.34 | 0.040 | 0.01 | −0.27 | −0.21 | −0.51 * | 0.136 | 0.06 | −0.08 | −0.18 | 0.10 | 0.721 |
| DFpLNH-II | 0.27 | 0.12 | 0.18 | −0.20 | 0.485 | 0.45 * | 0.32 | 0.16 | 0.01 | 0.504 | −0.38 | −0.35 | −0.18 | −0.56 ** | 0.038 | 0.21 | 0.04 | 0.01 | 0.13 | 0.286 |
| DFLNO-I | 0.24 | 0.19 | 0.14 | −0.33 | 0.374 | 0.16 | 0.20 | 0.24 | −0.04 | 0.339 | −0.43 * | −0.35 | −0.21 | −0.42 | 0.197 | 0.27 | 0.32 | 0.20 | 0.07 | 0.504 |
| Secretors | ||||||||||||||||||||
| 2′-FL | 0.22 * | 0.10 | 0.23 * | 0.14 | 0.008 | 0.03 | −0.15 | 0.03 | 0.01 | 0.518 | 0.00 | 0.14 | 0.21 * | 0.00 | 0.186 | −0.15 | −0.11 | −0.13 | −0.02 | 0.178 |
| 3′-FL | −0.04 | −0.10 | −0.09 | −0.04 | 0.211 | −0.03 | −0.06 | −0.02 | −0.06 | 0.507 | −0.04 | 0.03 | 0.04 | 0.13 | 0.461 | −0.08 | −0.14 | −0.07 | −0.01 | 0.638 |
| LDFT | 0.12 | 0.07 | 0.14 | 0.05 | 0.830 | 0.20 * | −0.08 | −0.05 | −0.06 | 0.702 | −0.12 | 0.05 | 0.11 | 0.02 | 0.602 | −0.27 ** | −0.14 | −0.13 | 0.01 | 0.172 |
| LNT&LNnT | −0.29 ** | −0.42 ** | −0.45 ** | −0.36 ** | <0.001 | −0.05 | 0.04 | 0.03 | 0.12 | 0.433 | −0.08 | 0.01 | −0.05 | −0.01 | 0.995 | −0.15 | 0.01 | 0.10 | 0.11 | 0.978 |
| LNFP-III | 0.19 | 0.05 | −0.12 | −0.30 ** | <0.001 | −0.04 | 0.05 | −0.02 | −0.06 | 0.654 | −0.03 | −0.17 | −0.18 | −0.03 | 0.788 | −0.10 | −0.10 | −0.05 | 0.09 | 0.216 |
| LNFP-II | −0.10 | −0.20 | −0.12 | −0.20 | <0.001 | −0.03 | −0.01 | −0.02 | −0.02 | 0.509 | −0.15 | −0.14 | −0.10 | 0.03 | 0.768 | −0.14 | −0.05 | 0.00 | 0.07 | 0.906 |
| LNFP-I | −0.21 * | −0.29 ** | −0.30 ** | −0.21 * | 0.043 | −0.08 | −0.03 | 0.05 | 0.16 | 0.683 | −0.03 | 0.05 | 0.03 | −0.04 | 0.941 | −0.20 * | −0.03 | 0.04 | 0.13 | 0.290 |
| LNFP-IV | 0.07 | −0.13 | 0.01 | −0.08 | 0.679 | 0.01 | −0.06 | −0.07 | −0.18 | 0.225 | −0.02 | 0.00 | 0.06 | 0.11 | 0.608 | −0.26 ** | −0.19 | −0.13 | −0.13 | 0.027 |
| LNDFH-I | −0.03 | −0.26 * | −0.14 | −0.21 * | 0.021 | 0.05 | −0.12 | −0.10 | −0.01 | 0.281 | −0.13 | 0.04 | 0.06 | −0.01 | 0.546 | −0.24 * | −0.13 | −0.12 | 0.04 | 0.718 |
| LNDFH-II | −0.02 | 0.03 | −0.01 | −0.04 | 0.338 | 0.07 | −0.04 | −0.07 | −0.07 | 0.887 | −0.10 | −0.11 | −0.12 | 0.04 | 0.757 | −0.23 * | −0.12 | 0.00 | 0.08 | 0.621 |
| LNH | 0.09 | 0.07 | 0.10 | −0.08 | 0.680 | 0.04 | 0.06 | 0.11 | 0.20 | 0.269 | 0.13 | 0.24 * | 0.27 ** | 0.08 | 0.043 | 0.18 | 0.14 | 0.20 | 0.10 | 0.131 |
| LNnH | 0.16 | 0.08 | 0.23 * | −0.07 | 0.141 | 0.04 | 0.03 | 0.03 | 0.11 | 0.607 | 0.18 | 0.27 ** | 0.38 ** | 0.11 | 0.004 | 0.15 | 0.10 | 0.19 | 0.05 | 0.295 |
| MFLNH-I & III | 0.16 | 0.10 | 0.10 | −0.08 | 0.632 | −0.11 | −0.07 | −0.03 | 0.06 | 0.961 | 0.05 | 0.03 | 0.03 | 0.04 | 0.905 | 0.06 | −0.02 | −0.02 | −0.04 | 0.652 |
| MFpLNH-IV | 0.06 | −0.08 | 0.10 | −0.17 | 0.779 | 0.04 | 0.01 | −0.04 | 0.07 | 0.943 | 0.10 | 0.16 | 0.22 * | 0.10 | 0.047 | −0.10 | −0.06 | −0.02 | −0.01 | 0.552 |
| IFLNH-III | 0.24 * | 0.18 | 0.26 ** | −0.12 | 0.149 | −0.02 | −0.06 | −0.02 | 0.07 | 0.957 | 0.13 | 0.13 | 0.24 * | 0.12 | 0.072 | 0.06 | −0.04 | −0.02 | −0.04 | 0.540 |
| IFLNH-I | 0.23 * | 0.19 | 0.23 * | 0.18 | 0.056 | −0.08 | −0.06 | 0.01 | 0.14 | 0.387 | 0.26 * | 0.38 ** | 0.39 ** | 0.18 | 0.044 | 0.05 | 0.03 | 0.06 | 0.03 | 0.847 |
| TFLNH-I | 0.20 | 0.08 | 0.14 | −0.10 | 0.621 | −0.11 | −0.15 | −0.08 | 0.08 | 0.840 | 0.16 | 0.18 | 0.19 | 0.12 | 0.687 | −0.01 | −0.08 | −0.15 | −0.03 | 0.917 |
| TFLNH-II | 0.23 * | 0.12 | 0.15 | 0.06 | 0.237 | −0.10 | −0.19 | −0.07 | 0.08 | 0.891 | 0.23 * | 0.30 ** | 0.31 ** | 0.08 | 0.746 | −0.04 | −0.05 | −0.02 | −0.01 | 0.666 |
| DFLNH-a&c | 0.28 ** | 0.16 | 0.19 | 0.01 | 0.161 | −0.14 | −0.18 | −0.04 | 0.10 | 0.514 | 0.19 | 0.30 ** | 0.31 ** | 0.10 | 0.018 | −0.05 | −0.09 | −0.08 | −0.03 | 0.568 |
| DFLNH-b | 0.33 ** | 0.31 ** | 0.34 ** | 0.17 | 0.041 | −0.16 | −0.09 | −0.09 | −0.08 | 0.300 | 0.14 | 0.07 | 0.11 | 0.15 | 0.500 | −0.10 | −0.16 | −0.17 | −0.09 | 0.155 |
| DFpLNH-I | 0.01 | −0.12 | −0.04 | −0.07 | 0.642 | 0.05 | −0.06 | −0.12 | −0.16 | 0.198 | 0.00 | 0.06 | 0.11 | 0.11 | 0.294 | −0.26 * | −0.18 | −0.16 | −0.11 | 0.031 |
| DFpLNH-II | −0.16 | −0.25 * | −0.26 * | −0.24 * | 0.01 | −0.02 | −0.03 | −0.03 | −0.07 | 0.940 | −0.07 | −0.03 | −0.07 | 0.04 | 0.876 | −0.19 | −0.08 | −0.04 | 0.04 | 0.549 |
| DFLNO-I | −0.05 | −0.17 | −0.20 | −0.23 * | 0.003 | −0.12 | −0.10 | −0.08 | 0.07 | 0.666 | 0.03 | 0.03 | 0.07 | 0.05 | 0.752 | −0.11 | −0.15 | −0.04 | 0.13 | 0.654 |
| Delivery Mode | Gestational Age | Infant Gender | ||||||||||||||||||
| 0 | 1 | 2 | 6 | P a | 0 | 1 | 2 | 6 | P a | 0 | 1 | 2 | 6 | P a | ||||||
| Non-Secretors | ||||||||||||||||||||
| 3′-FL | 0.24 | 0.28 | 0.08 | 0.25 | 0.098 | −0.53 * | −0.46 * | −0.17 | −0.17 | 0.025 | 0.23 | 0.15 | 0.04 | 0.02 | 0.326 | |||||
| LNT&LNnT | −0.21 | 0.07 | −0.01 | −0.08 | 0.486 | −0.04 | −0.25 | −0.20 | 0.27 | 0.358 | −0.04 | 0.05 | 0.04 | −0.24 | 0.724 | |||||
| LNFP-III | 0.18 | 0.22 | 0.18 | 0.05 | 0.992 | −0.50 * | −0.42 | −0.46 * | −0.01 | 0.053 | 0.18 | 0.21 | 0.08 | −0.23 | 0.957 | |||||
| LNFP-II | 0.25 | 0.35 | 0.24 | 0.39 | 0.964 | −0.46 * | −0.43 * | −0.58 ** | 0.00 | 0.033 | 0.42 | 0.36 | 0.42 | −0.02 | 0.100 | |||||
| LNFP-IV | 0.12 | 0.24 | −0.05 | −0.10 | 0.449 | −0.68 ** | −.64 ** | −0.61 ** | 0.08 | 0.034 | 0.27 | 0.18 | 0.09 | −0.31 | 0.944 | |||||
| LNDFH-II | 0.24 | 0.41 | 0.18 | 0.27 | 0.070 | −0.32 | −0.36 | −0.27 | 0.09 | 0.804 | 0.31 | 0.49 * | 0.42 | 0.02 | 0.535 | |||||
| LNH | −0.52 * | −0.41 | −0.27 | −0.08 | 0.020 | 0.02 | −0.10 | −0.06 | 0.41 | 0.296 | −0.18 | −0.23 | 0.07 | −0.11 | 0.164 | |||||
| LNnH | −0.44 * | −0.32 | −0.55 ** | −0.15 | 0.016 | −0.11 | −0.21 | −0.14 | 0.28 | 0.586 | −0.28 | −0.24 | −0.18 | −0.15 | 0.152 | |||||
| MFLNH-I & III | −0.19 | −0.25 | −0.30 | −0.01 | 0.315 | −0.32 | −0.19 | −0.13 | 0.34 | 0.700 | 0.21 | 0.09 | 0.24 | 0.02 | 0.460 | |||||
| MFpLNH-IV | −0.41 | −0.10 | −0.33 | −0.16 | 0.036 | −0.25 | −0.43 * | −0.35 | 0.25 | 0.461 | −0.27 | −0.11 | 0.02 | −0.33 | 0.060 | |||||
| IFLNH− III | −0.39 | −0.35 | −0.44 * | −0.19 | 0.023 | −0.28 | −0.23 | −0.23 | 0.28 | 0.904 | −0.21 | −0.24 | −0.08 | −0.17 | 0.472 | |||||
| DFLNH-b | 0.15 | 0.12 | 0.07 | 0.12 | 0.258 | −0.49 * | −0.41 | −0.24 | 0.09 | 0.457 | 0.31 | 0.28 | 0.28 | 0.05 | 0.611 | |||||
| DFpLNH-I | 0.05 | 0.28 | 0.01 | −0.02 | 0.543 | −0.47 * | −0.53 * | −0.61 ** | −0.01 | 0.010 | 0.05 | 0.07 | 0.09 | −0.24 | 0.719 | |||||
| DFpLNH-II | 0.15 | 0.38 | 0.21 | 0.27 | 0.022 | −0.26 | −0.43 * | −0.59 ** | −0.06 | 0.026 | −0.01 | 0.12 | 0.20 | −0.17 | 0.191 | |||||
| DFLNO-I | 0.18 | 0.20 | 0.30 | 0.29 | 0.396 | −0.28 | −0.28 | −0.39 | 0.10 | 0.087 | 0.15 | 0.12 | 0.27 | −0.06 | 0.337 | |||||
| Secretors | ||||||||||||||||||||
| 2′-FL | −0.19 | −0.04 | −0.05 | −0.24 * | 0.084 | −0.08 | 0.14 | 0.01 | −0.13 | 0.887 | −0.13 | −0.13 | −0.21 * | −0.02 | 0.070 | |||||
| 3′-FL | −0.06 | 0.00 | −0.05 | −0.04 | 0.878 | 0.04 | 0.03 | 0.04 | 0.05 | 0.264 | 0.07 | 0.02 | −0.02 | −0.04 | 0.779 | |||||
| LDFT | −0.20 | −0.08 | −0.13 | 0.12 | 0.085 | 0.04 | 0.03 | 0.12 | 0.00 | 0.318 | 0.15 | −0.05 | −0.04 | 0.09 | 0.569 | |||||
| LNT&LNnT | 0.16 | 0.21 * | 0.20 | 0.29 ** | 0.029 | 0.07 | 0.10 | −0.09 | −0.01 | 0.738 | −0.16 | −0.08 | −0.09 | −0.14 | 0.054 | |||||
| LNFP-III | −0.05 | −0.03 | −0.02 | 0.19 | 0.791 | 0.12 | 0.03 | 0.01 | 0.09 | 0.596 | 0.13 | 0.08 | 0.06 | −0.01 | 0.729 | |||||
| LNFP-II | 0.02 | 0.05 | 0.08 | −0.10 | 0.495 | 0.10 | 0.08 | 0.10 | 0.12 | 0.912 | 0.03 | 0.06 | 0.03 | −0.01 | 0.709 | |||||
| LNFP-I | 0.12 | 0.11 | 0.15 | −0.21 * | 0.131 | 0.02 | 0.04 | −0.13 | −0.05 | 0.436 | −0.15 | −0.11 | −0.12 | −0.05 | 0.044 | |||||
| LNFP-IV | −0.05 | 0.06 | 0.08 | 0.07 | 0.625 | −0.04 | 0.03 | 0.04 | −0.06 | 0.963 | −0.03 | −0.08 | −0.20 | 0.02 | 0.287 | |||||
| LNDFH-I | −0.05 | 0.05 | 0.05 | −0.03 | 0.041 | 0.07 | 0.14 | 0.02 | 0.05 | 0.235 | 0.03 | −0.02 | 0.02 | 0.11 | 0.138 | |||||
| LNDFH-II | 0.09 | 0.08 | 0.00 | −0.02 | 0.980 | 0.03 | 0.02 | 0.06 | 0.08 | 0.314 | 0.13 | 0.05 | 0.10 | 0.00 | 0.094 | |||||
| LNH | 0.21 * | 0.20 | 0.24 * | 0.09 | 0.013 | −0.12 | −0.09 | −0.15 | −0.16 | 0.097 | −0.27 ** | −0.21 * | −0.21 * | −0.21 * | 0.004 | |||||
| LNnH | 0.06 | 0.12 | 0.13 | 0.16 | 0.110 | −0.15 | −0.06 | −0.09 | −0.17 | 0.106 | −0.22 * | −0.18 | −0.22 * | −0.16 | 0.023 | |||||
| MFLNH-I & III | 0.12 | 0.11 | 0.17 | 0.16 | 0.133 | 0.03 | −0.02 | −0.06 | −0.09 | 0.285 | −0.13 | −0.06 | −0.12 | −0.15 | 0.284 | |||||
| MFpLNH-IV | 0.09 | 0.15 | 0.18 | 0.06 | 0.039 | −0.14 | −0.06 | −0.11 | −0.14 | 0.086 | −0.15 | −0.11 | −0.19 | −0.12 | 0.063 | |||||
| IFLNH-III | −0.01 | 0.09 | 0.12 | 0.24 * | 0.233 | −0.10 | −0.06 | 0.00 | −0.20 | 0.218 | −0.18 | −0.17 | −0.26 * | −0.18 | 0.028 | |||||
| IFLNH-I | 0.17 | 0.17 | 0.22 * | 0.23 * | 0.274 | −0.21 * | −0.12 | −0.24 * | −0.25 * | 0.008 | −0.34 ** | −0.27 ** | −0.26 * | −0.19 | < 0.001 | |||||
| TFLNH-I | 0.02 | 0.06 | 0.09 | 0.20 | 0.484 | −0.06 | −0.01 | 0.05 | −0.02 | 0.301 | −0.12 | −0.08 | −0.04 | −0.07 | 0.326 | |||||
| TFLNH-II | 0.18 | 0.23 * | 0.25 * | 0.23 * | 0.451 | −0.20 | −0.07 | −0.20 * | −0.19 | 0.009 | −0.25 * | −0.19 | −0.20 * | −0.13 | 0.206 | |||||
| DFLNH-a&c | 0.18 | 0.22 * | 0.31 ** | 0.28 ** | 0.009 | −0.09 | 0.00 | −0.08 | −0.13 | 0.072 | −0.21 * | −0.15 | −0.18 | −0.11 | 0.023 | |||||
| DFLNH-b | 0.04 | 0.08 | 0.10 | 0.33 ** | 0.483 | 0.00 | −0.04 | 0.04 | −0.02 | 0.889 | −0.05 | 0.01 | −0.10 | −0.09 | 0.497 | |||||
| DFpLNH-I | 0.07 | 0.18 | 0.15 | 0.01 | 0.081 | −0.11 | −0.03 | −0.06 | −0.09 | 0.410 | 0.06 | −0.09 | −0.14 | 0.02 | 0.507 | |||||
| DFpLNH-II | 0.13 | 0.12 | 0.11 | −0.16 | 0.713 | 0.00 | 0.04 | −0.03 | 0.02 | 0.841 | 0.09 | 0.04 | 0.02 | 0.04 | 0.383 | |||||
| DFLNO-I | 0.25 * | 0.23 * | 0.28 ** | −0.05 | 0.013 | −0.04 | 0.04 | −0.07 | −0.15 | 0.263 | −0.08 | 0.06 | −0.08 | −0.14 | 0.304 | |||||
| Month1 WG | Month6 WG | Month1 LG | Month6 LG | Month1 DS | Month6 DS | |||||||
|---|---|---|---|---|---|---|---|---|---|---|---|---|
| 0 | 1 | 2 | 6 | 0 | 1 | 2 | 6 | 0 | 1 | 2 | 6 | |
| Non-Secretors | ||||||||||||
| 3′-FL | −0.34 | −0.08 | 0.08 | −0.44 * | −0.19 | −0.13 | −0.11 | −0.39 | −0.39 | −0.26 | −0.28 | 0.04 |
| LNT&LNnT | 0.24 | 0.02 | 0.02 | 0.33 | 0.47 * | 0.47 * | 0.34 | 0.37 | −0.07 | −0.06 | 0 | 0.20 |
| LNFP-III | 0.06 | 0.07 | 0.09 | −0.27 | 0.15 | 0.01 | 0 | −0.01 | −0.04 | 0.09 | −0.20 | 0.02 |
| LNFP-II | −0.32 | −0.27 | −0.28 | −0.43 | −0.11 | −0.16 | −0.19 | −0.03 | −0.32 | −0.19 | −0.45 * | −0.22 |
| LNFP-IV | −0.42 | −0.28 | −0.31 | 0.15 | 0.09 | 0.06 | 0.04 | 0.19 | −0.32 | −0.07 | −0.11 | 0.07 |
| LNDFH-II | −0.31 | −0.39 | −0.25 | −0.57 ** | −0.25 | −0.20 | −0.30 | −0.10 | −0.35 | −0.19 | −0.37 | −0.22 |
| LNH | 0.20 | 0.05 | −0.11 | 0.26 | 0.33 | 0.37 | 0.38 | 0.39 | −0.09 | −0.15 | 0.11 | 0.04 |
| LNnH | 0.06 | −0.02 | 0.01 | 0.28 | 0.27 | 0.20 | 0.46 * | 0.48 * | −0.26 | −0.28 | 0.00 | 0.02 |
| MFLNH-I & III | −0.28 | −0.24 | −0.20 | 0.25 | 0.07 | −0.01 | 0.26 | 0.27 | −0.07 | 0.07 | 0.02 | 0.02 |
| MFpLNH-IV | 0.19 | 0.01 | −0.20 | 0.32 | 0.50 * | 0.40 | 0.36 | 0.40 | −0.32 | −0.26 | −0.15 | 0.11 |
| IFLNH-III | −0.06 | −0.07 | −0.08 | 0.26 | 0.24 | 0.23 | 0.35 | 0.41 | −0.28 | −0.15 | 0 | 0.07 |
| DFLNH-b | −0.37 | −0.36 | −0.30 | −0.23 | −0.11 | −0.20 | −0.19 | −0.04 | −0.15 | −0.06 | −0.15 | −0.22 |
| DFpLNH-I | −0.20 | −0.04 | −0.21 | 0.03 | 0.18 | 0.26 | 0.17 | 0.24 | −0.35 | −0.04 | −0.19 | −0.16 |
| DFpLNH-II | −0.02 | 0.07 | −0.14 | −0.43 | 0.09 | 0.23 | 0.09 | −0.06 | −0.20 | −0.11 | −0.33 | −0.09 |
| DFLNO-I | 0.03 | 0.13 | 0.02 | −0.26 | 0.09 | 0.12 | 0.06 | 0.04 | 0.17 | 0.10 | −0.02 | −0.17 |
| Secretors | ||||||||||||
| 2′-FL | 0.02 | −0.05 | −0.13 | 0.08 | −0.08 | −0.10 | −0.08 | 0.10 | −0.20 | −0.12 | −0.17 | 0.09 |
| 3′-FL | −0.05 | 0.06 | 0.09 | 0.27 * | −0.02 | 0.07 | 0.04 | 0.19 | −0.06 | −0.04 | −0.17 | −0.07 |
| LDFT | −0.06 | −0.01 | 0 | 0.28 * | −0.07 | 0.03 | 0.14 | 0.12 | −0.06 | −0.03 | −0.17 | −0.02 |
| LNT&LNnT | 0.13 | 0.04 | 0.07 | −0.24 * | 0.10 | −0.05 | −0.10 | −0.14 | 0.15 | 0.12 | 0.17 | 0.00 |
| LNFP-III | −0.21 * | −0.12 | −0.02 | −0.08 | 0.17 | 0.14 | 0.05 | −0.13 | 0.10 | 0.08 | −0.06 | −0.09 |
| LNFP-II | −0.07 | −0.09 | −0.04 | −0.04 | 0.10 | 0.02 | 0.06 | 0.01 | 0.08 | 0.08 | −0.06 | −0.17 |
| LNFP-I | 0.09 | 0.03 | 0.01 | −0.28 * | −0.16 | −0.19 | −0.23 * | −0.18 | 0.14 | 0.16 | 0.10 | 0.17 |
| LNFP-IV | 0.01 | −0.02 | −0.02 | 0.29 ** | 0.08 | 0.07 | 0.02 | 0.14 | −0.11 | −0.06 | −0.13 | −0.15 |
| LNDFH-I | 0.00 | −0.03 | −0.03 | 0.06 | 0.10 | 0 | 0.07 | 0.08 | 0.08 | 0.11 | −0.04 | −0.04 |
| LNDFH-II | −0.19 | −0.16 | −0.03 | 0.04 | −0.09 | 0.04 | 0.06 | 0.04 | 0.03 | −0.01 | −0.08 | −0.15 |
| LNH | 0.02 | −0.06 | −0.12 | −0.25 * | 0.24 * | 0.14 | 0.16 | −0.06 | −0.11 | −0.12 | 0.02 | −0.05 |
| LNnH | 0.09 | −0.02 | −0.09 | −0.14 | 0.23 * | 0.10 | 0.24 * | 0.02 | −0.16 | −0.24 * | −0.07 | −0.07 |
| MFLNH-I & III | −0.04 | −0.02 | −0.04 | −0.09 | 0.09 | 0.15 | 0.08 | −0.09 | −0.05 | −0.01 | 0.07 | −0.01 |
| MFpLNH-IV | 0.03 | −0.01 | −0.06 | 0 | 0.30 ** | 0.16 | 0.26 * | 0.02 | −0.06 | −0.09 | −0.05 | −0.11 |
| IFLNH-III | 0.01 | −0.02 | −0.06 | 0 | 0.10 | 0.13 | 0.22 * | 0.02 | −0.22 * | −0.27 ** | −0.12 | −0.06 |
| IFLNH-I | −0.02 | −0.12 | −0.19 | −0.04 | 0.24 * | 0.06 | 0.13 | −0.02 | −0.20 | −0.22 * | −0.15 | −0.01 |
| TFLNH-I | −0.02 | 0.01 | −0.04 | 0.13 | 0.18 | 0.22 * | 0.24 * | 0.11 | −0.15 | −0.16 | −0.08 | −0.08 |
| TFLNH-II | −0.01 | −0.04 | −0.14 | −0.06 | 0.15 | 0.03 | 0.04 | −0.03 | −0.17 | −0.12 | −0.08 | 0.11 |
| DFLNH-a&c | −0.04 | −0.08 | −0.20 | −0.08 | 0.21 * | 0.14 | 0.12 | −0.01 | −0.16 | −0.15 | −0.10 | 0.06 |
| DFLNH-b | −0.18 | −0.15 | −0.13 | 0.26 * | 0.14 | 0.25 * | 0.24 * | 0.16 | −0.14 | −0.14 | −0.16 | −0.25 * |
| DFpLNH-I | −0.03 | −0.04 | 0.01 | 0.27 * | 0.15 | 0.07 | 0.15 | 0.11 | −0.05 | −0.09 | −0.14 | −0.17 |
| DFpLNH-II | −0.05 | −0.09 | 0.03 | −0.01 | 0.18 | 0.07 | 0.14 | −0.03 | 0.12 | 0.07 | −0.02 | −0.16 |
| DFLNO-I | −0.04 | −0.07 | 0 | −0.10 | 0.16 | 0.12 | 0.18 | −0.12 | 0.14 | 0.08 | 0.07 | 0.04 |
© 2020 by the authors. Licensee MDPI, Basel, Switzerland. This article is an open access article distributed under the terms and conditions of the Creative Commons Attribution (CC BY) license (http://creativecommons.org/licenses/by/4.0/).
Share and Cite
Wang, M.; Zhao, Z.; Zhao, A.; Zhang, J.; Wu, W.; Ren, Z.; Wang, P.; Zhang, Y. Neutral Human Milk Oligosaccharides Are Associated with Multiple Fixed and Modifiable Maternal and Infant Characteristics. Nutrients 2020, 12, 826. https://0-doi-org.brum.beds.ac.uk/10.3390/nu12030826
Wang M, Zhao Z, Zhao A, Zhang J, Wu W, Ren Z, Wang P, Zhang Y. Neutral Human Milk Oligosaccharides Are Associated with Multiple Fixed and Modifiable Maternal and Infant Characteristics. Nutrients. 2020; 12(3):826. https://0-doi-org.brum.beds.ac.uk/10.3390/nu12030826
Chicago/Turabian StyleWang, Meichen, Zhenwen Zhao, Ai Zhao, Jian Zhang, Wei Wu, Zhongxia Ren, Peiyu Wang, and Yumei Zhang. 2020. "Neutral Human Milk Oligosaccharides Are Associated with Multiple Fixed and Modifiable Maternal and Infant Characteristics" Nutrients 12, no. 3: 826. https://0-doi-org.brum.beds.ac.uk/10.3390/nu12030826