Food Agency in the United States: Associations with Cooking Behavior and Dietary Intake
by
 , ,
, ,
Julia A. Wolfson
1,2,*, 
Jacob Lahne
3,
Minakshi Raj
1,
Noura Insolera
4,
Fiona Lavelle
5 and
Moira Dean
5,6 1
Department of Health Management and Policy, University of Michigan School of Public Health, Ann Arbor, MI 48109, USA
2
Department of Nutritional Sciences, University of Michigan School of Public Health, Ann Arbor, MI 48109, USA
3
Virginia Tech, Blacksburg, VA 24061, USA
4
Institute for Social Research, University of Michigan, Ann Arbor, MI 48104, USA
5
Institute for Global Food Security, School of Biological Sciences, Queen’s University Belfast, Belfast BT9 5DL, UK
6
School of Health Sciences, Faculty of Health and Medicine, The University of Newcastle, Callaghan, NSW 2308, Australia
*
Author to whom correspondence should be addressed.
Nutrients 2020, 12(3), 877; https://0-doi-org.brum.beds.ac.uk/10.3390/nu12030877
Submission received: 5 March 2020
/
Revised: 19 March 2020
/
Accepted: 20 March 2020
/
Published: 24 March 2020
(This article belongs to the Special Issue Food Preparation Behaviours, Diet and Health)
Abstract
:“Food agency” is one’s ability to procure and prepare food within the contexts of one’s social, physical, and economic environment. In 2018, we used Amazon TurkPrime to field two large national surveys in the United States (US) to examine food agency and several food- and cooking-related factors. The first survey (n = 1,457) was fielded in a national sample of US adults. The second survey (n = 1,399) comprised of parents of 2–9-year-old children. Analyses included hierarchical linear regression to examine factors that explained variation in food agency and used Poisson and generalized linear models to examine the association between food agency and between cooking behavior and dietary intake, respectively. Cooking skills; food skills; and cooking confidence, attitudes, and perceptions explained a high degree of food agency variance. Higher food agency was associated with more frequent cooking of all meals, more frequent scratch cooking, and less frequent cooking with packaged ingredients among both adults and parents. Higher food agency was also associated with higher consumption of vegetables among both adults and children. Food agency encompasses a number of the interrelated factors important for home cooking and is a useful construct for understanding and promoting home cooking behavior.
1. Introduction
Cooking meals at home is a key recommendation for consumption of a healthy diet [1], and evidence shows cooking frequently is associated with better diet quality and higher fruit and vegetable consumption [2,3,4,5,6]. The public health focus on cooking as an important health behavior has emerged in response to high rates of diet-related diseases such as obesity, diabetes, and hypertension and strong evidence about the effects of fast foods and ultra-processed foods on those outcomes [7,8,9,10]. Numerous interventions focus on promoting cooking skills and healthy cooking at home in the United States (US), where cooking skills are perceived to have declined [11]. However, evidence regarding the effectiveness of cooking interventions on improving skills, cooking behavior, and diet and health outcomes is limited [11]. “Food agency” is a construct that positions the act of cooking within the myriad factors that influence one’s ability (a) to obtain cooking skills and (b) to translate those skills into action within the contexts of one’s social, physical, and economic environments [12,13]. Food agency is, therefore, a useful lens for capturing and understanding cooking skills and behavior and how interventions can best promote healthy cooking behavior that reflects the reality of the constraints of daily life.
Cooking—assembling and transforming ingredients in order to produce a meal—is a complex behavior that requires numerous skills and competencies that relate to the technical act of preparing food and to the ability to plan to cook and provision food within one’s food environment, time constraints, budget constraints, and so on [13,14,15]. Cooking also has neither clear definition nor one “correct” set of actions, and the understanding of what it means “to cook” is complicated by the wide range of processed and packaged ingredients and food products available in stores [16,17,18,19]. The complicated reality of what is required to cook within one’s daily life challenges prescriptive conceptualizations of how cooking skills have been previously understood and measured [16,20]. Cooking skills have sometimes been measured as the ability to prepare certain sauces or dishes or the ability to use certain cooking techniques [21]. More recently, scales to measure cooking skills as well as related food skills have been developed [22]. These scales have expanded the number and types of skills considered important for home cooking and have shown that both cooking and food skills are critical for shaping dietary intake [23]. Other measures of cooking confidence and attitudes as well as how people perceive what it means to cook (related to the role of convenience foods vs. scratch ingredients and whether heat is required for cooking) have also been shown to be important predictors of cooking behavior [24,25,26,27].
The Cooking and Food Provisioning Action Scale (CAFPAS) is a 28-item scale developed to measure food agency [28]. However, to our knowledge, it has neither been tested in a large national sample nor been fielded among a sample of parents specifically. Cooking skills and practices can change throughout the life course with parenthood being a particularly pivotal point due to the importance of a providing a healthy diet for child dependents [29,30,31,32]. Numerous cooking and nutrition interventions are aimed at parents and at parents of young children specifically, as evidence suggests that parental cooking skills and confidence are associated with better diet quality for children [33]. However, parenthood is also an especially busy and stressful time with many demands placed on parents that make preparing healthy, home-cooked meals difficult. It is therefore unknown whether food agency might be higher or lower among parents of young children compared to adults more generally. More detailed knowledge about food agency across the life course would be helpful in the development of targeted cooking and nutrition interventions.
In this study, we sought to better understand how food agency is related to other measures of cooking skills; food skills; and cooking-related confidence, attitudes, and perceptions among parents of 2–9-year-old children and among a general sample of US adults. Food agency is not based on how competent a person is at a predetermined set of skills or actions; rather, having food agency means being “empowered to act” to achieve food-related goals in the contexts of the organizing structures of one’s life [12]. A deeper discussion of the theoretical underpinnings of food agency is available elsewhere [12,13,28]. Despite this intentionally broad conceptualization, it is likely that food agency is closely related to self-perceived cooking and food skills, confidence, attitudes, and perceptions about cooking. We hypothesized that cooking and food skills would explain a high degree of variation in food agency. A second aim of this research was to examine how food agency is associated with differences in cooking behavior and dietary intake. We hypothesized that, for both adults and parents, higher food agency would be associated with more frequent cooking, particularly cooking from scratch, and would also be associated with better diet quality.
2. Materials and Methods
A web-based survey to measure cooking skills, food skills, food agency, cooking attitudes, perceptions about the meaning of cooking, cooking confidence, cooking behavior, and dietary intake was designed. All cooking-related scales and measures were taken from previously validated surveys [22,24,28]. Because the cooking skills and food skills measures had not been validated in a US sample, we conducted “think aloud” cognitive interviews (n = 10) to ensure they were understood as intended and adjusted any wording for a US audience. Two versions of the same survey were drafted: Version 1 to be fielded in a sample of US adults (hereafter referred to as the “general adult” survey) and Version 2 (hereafter referred to as the “parent” survey) to be fielded in a sample of parents of at least one 2–9-year-old child in the US. The only difference between the two surveys was that the dietary intake module asked about the adults’ own dietary intake in the general adult survey, and in the parent survey dietary intake, questions referred to the intake of a reference child between the ages of 2–9 years old.
The surveys were fielded in April 2018 using TurkPrime, an online crowdsourcing platform associated with Amazon Mechanical Turk that is designed to be used for academic research [34]. Amazon Mechanical Turk and TurkPrime have been used in numerous academic studies from a variety of disciplines published in the peer-reviewed literature [35,36,37]. TurkPrime is a panel service that allows researchers to use quotas to recruit a sample that matches their specific needs. In the case of the present study, we used a census-matched panel that generated a final sample proportionally matched to the US adult population based on prespecified characteristics. For the general adult survey, the sample proportionally matched the US adult population based on age, sex, race/ethnicity, education, and income. For the parent survey, the sample proportionally matched the US adult population based on race/ethnicity, education, and income.
A pool of 1731 TurkPrime panel members (aged ≥ 18 years) began the general adult survey. Individuals were excluded if they did not finish the survey (n = 180), completed the survey in <7 minutes (n = 61) as it was not reasonable to complete the survey having read all the questions in that time, or if they did not live in the US (n = 33). In total, 274 respondents were excluded, resulting in a final sample size of 1457 and a survey completion rate of 84.2%. A pool of 1756 TurkPrime panel members (aged ≥ 18 years) began the parent survey. Individuals were excluded if they did not finish the survey (n = 270), completed the survey in <7 minutes (n = 53), did not live in the US (n = 4), did not have a child aged 2–9 years (n = 13), or had >6 children (n = 17). In total, 357 individuals were excluded, resulting in a final sample size of 1399 and a survey completion rate of 79.7%.
2.1. Measures
Food agency [12,13] was measured using the Cooking and Food Provisioning Action Scale (CAFPAS) [28]. The CAFPAS is a 28-item scale that asks participants how strongly they agree, on a 7-point Likert scale from “strongly agree” to “strongly disagree”, with statements about food and cooking self-efficacy, attitudes, and structural barriers to cooking. The CAFPAS has three subscales: food and cooking self-efficacy, food and cooking related attitudes, and structural barriers. Item scores within each subscale are standardized, and then, the standardized subscale scores are summed to generate an overall CAFPAS score. We used the continuous CAFPAS scores and also divided scores into quartiles for some analyses.
Cooking skills were measured using a 14-item scale that asked participants “On a scale of 1 to 7, where 1 means very poor and 7 means very good, please say how good you are at …” with response items focusing on specific cooking skills such as steaming, blending, and roasting foods. Food skills were measured using 19 items measured on the same 7-point Likert scale; however, in this case, skills focused on skills such as meal planning, shopping with a grocery list, and comparing prices when food shopping. More details about the cooking and food skills measures are published elsewhere [22,23].
Cooking confidence was assessed by asking participants to rate how confident they were on a 7-point Likert scale from 1 (“not at all confident”) to 7 (“extremely confident”) cooking from scratch using fresh ingredients, following a recipe, cooking a healthy meal, and preparing a meal using a vegetable they have never used before. Cooking attitudes were assessed using 12 questions that asked participants to rate how strongly they agreed (on a 7-point Likert scale) with statements such as “I enjoy cooking” and “cooking takes too much time” [24].
Perceptions about what counts as cooking were based on responses to 14 items that asked respondents to rate how strongly they agreed or disagreed (on a 7-point Likert scale) with statements that parsed how strongly they thought that packaged, convenience foods, scratch ingredients, and with or without heat counted as cooking. The cooking perception scale is described in detail elsewhere [24].
The order in which participants viewed items for the CAFPAS, cooking skills, food skills, cooking confidence, cooking attitudes, and cooking perceptions scales were randomized. The order in which participant viewed each scale did not differ between participants.
Cooking behavior was measured using seven questions about cooking frequency of breakfast, lunch, and dinner; making a meal from scratch ingredients; making a meal from packaged products; making a meal from frozen products; and using a recipe to make a meal. Participants were asked to “indicate how many times during the past 7 days you or someone in your household did the following…” Response categories ranged from 1 to 7. This question stem was based on the cooking frequency question in the National Health and Nutrition Examination Survey [38]. The full set of cooking behavior questions have also been fielded previously [24].
Dietary intake was measured based on eight questions from the Behavioral Risk Factor Surveillance System [39]. Questions asked about frequency of eating/drinking each food/beverage in the past 30 days, and participants were asked to report frequency as either times per day, times per week, or times per month. All responses were converted into daily intake by multiplying “per week” responses by 7 and “per month” responses by 30. The full question text for the dietary intake measures are available in the Supplementary Materials. Dietary intake was measured for the surveyed adult in the general adult survey. In the parent survey, the respondent answered the dietary intake questions about the intake of a reference child in their family between the ages of 2 and 9 years old.
Sociodemographic measures included in both surveys were sex, age (18–29, 30–44, 45–64, and ≥ 65), race/ethnicity (non-Hispanic White, non-Hispanic Black, Hispanic, and other), household size (1–4 and ≥5), parent status, number of children in the household, ages of children (0–5, 6–11, and 12–19), marital status (married, living with a partner, divorced/separated/widowed, and never married), annual household income (<$50,000, $50,000–$100,000, and >$100,000), education (≤ high school diploma, some college, college, or graduate degree), employment status (working full time, working part time, not working but looking for work, not working and not looking for work, and stay at home parent), Supplemental Nutrition Assistance Program (SNAP) participation, Special Supplemental Program for Women, Infants and Children Program (WIC) participation, household food insecurity status, and weight status (healthy, overweight, and obese). Adult weight status was calculated based on Body Mass Index (BMI) score calculated based on self-reported height and weight. Healthy weight status = 18.5 < BMI < 24.99, overweight = 25.00 ≤ BMI < 30.00, and obese weight status = BMI ≥ 30. Food insecurity was based on a single question asking “which of the following statements best describes the situation in your household in the last month.” Response categories included the following: we have enough of the foods we want to eat, we have enough but not always the kinds of food we want to eat, sometimes we do not have enough to eat, and we often do not have enough to eat. In the parent survey, the age and sex of a reference child was also recorded.
2.2. Analysis
All analyses were conducted separately for the general adult sample, the parent sample, and the combined sample from the two surveys (except for those examining dietary intake outcomes, which did not combine the adult and parent samples). First, we used descriptive statistics to examine demographic differences in the study samples and the mean scores and distribution of the food agency and cooking skills, attitudes, confidence, and perception measures for each of the study samples. Next, we conducted simple linear regressions with post-estimation margins to examine the unadjusted differences in food agency based on key sociodemographic characteristics. We then conducted hierarchical linear regressions adjusted for the covariates described above to examine the factors that contribute to variation in food agency. Then, differences in cooking behavior and dietary intake based on quartiles of CAFPAS score were examined. Cooking behavior outcomes used Poisson models adjusted for sex, age, race/ethnicity, number of children, income, education, food security, and cooking perceptions. Dietary intake outcomes used generalized linear models with a gamma family and log link to account for the skewed distribution of the dietary intake variables. These models were adjusted for sex, age, race/ethnicity, number of children, income, education, and food security. Models for the parent sample were additionally adjusted for reference child age and sex. Post-estimation margins were used to generate predicted cooking behavior and dietary intake based on quartile of CAFPAS score. All tests were two-sided, and significance was considered at p < 0.05. Analyses were conducted with Stata, Version 15 in 2019 and 2020.
3. Results
The characteristics of the two study samples as well as the combined sample are described in Table 1. The general adult sample was evenly divided between males (49.3%) and females (50.7%), whereas the parent sample had a higher proportion of female respondents (65.5%). The mean age of the general adult sample (46.5 (±15.8) years) was older than the parent sample (35.5 years (SD 8.5)). In the general adult sample, 56.2% of the sample were parents, though the mean number of children in the household was lower (1.3 children (SD 1.5)) compared to the mean number of children in the household in the parent sample (2.3 children (SD 1.1)). There were some differences between the distributions of the two samples based on marital status, household size, employment, and SNAP and WIC participation. The samples were similar in terms of race/ethnicity, household income, education, household food security, and weight status.
Table 2 displays the mean scores and standard deviations for the food agency and the cooking skills, confidence, attitudes, and perceptions measures used in the study. Across all measures, mean scores were similar between the general adult and parent samples. Within each sample, however, there were significant differences in food agency based on key sociodemographic characteristics (Table 3). In the general adult sample, food agency was higher among females (compared to males, p < 0.001), with increasing age (p < 0.001), among nonparents (p < 0.001), and among individuals not working and not looking for work or among stay at home parents (compared to individuals working full time, p < 0.001). Among the parent sample, food agency was higher among females (compared to males, p = 0.002), individuals aged 45–65 years old (compared to 18–29 years old, p = 0.03), individuals with a college or graduate degree (compared to individuals with a high school diploma or less, p < 0.001), and individuals not working and not looking for work or stay at home parents (compared to individuals working full time, p < 0.001). In both groups, lower food security was associated with significantly lower food agency.
Table 4 presents results from the hierarchical linear regression models testing the relative explanatory contribution of various factors to differences in food agency in the combined sample. Parallel results from the general adult sample and parent sample are shown in Supplementary Materials Table S1 and S2. Model 1, controlling for demographic characteristics sex, age, race, and number of children in the household, explained 4.4% of the variation in food agency. The magnitude, direction, and significance of these variables remained with the addition of socioeconomic measures for household income, education, and household food security in Model 2. These additional variables increased the model R2 by 2.1%. Higher income and education were both associated with lower food agency, and this relationship persisted in the next two models. Cooking skills and food skills were added in Model 3 which significantly increased the R2 to 41.5% (p < 0.001). Both cooking skills and food skills were associated with higher food agency (β = 0.04, p < 0.001). Cooking confidence, positive and negative attitudes, and cooking perceptions were added in Model 4. Model 4 explained 71.3% of the variation in food agency (additional variance explained according to R2 from Model 3: 29.8%, p < 0.001). Cooking skills and food skills remained significant at p < 0.001 in Model 4, but the magnitude of their association was attenuated. Cooking confidence (β = 0.15), positive (β = 0.65) and negative (β = -0.73) attitudes, and the three cooking perception factors (convenience foods (β = −0.12), scratch ingredients (β = 0.19), and heat (β = −0.11)) were all significantly associated with food agency at p < 0.001. In the final model, sex, age, income, education, and food security remained significant whereas race/ethnicity and number of children in the home were no longer significantly associated with food agency.
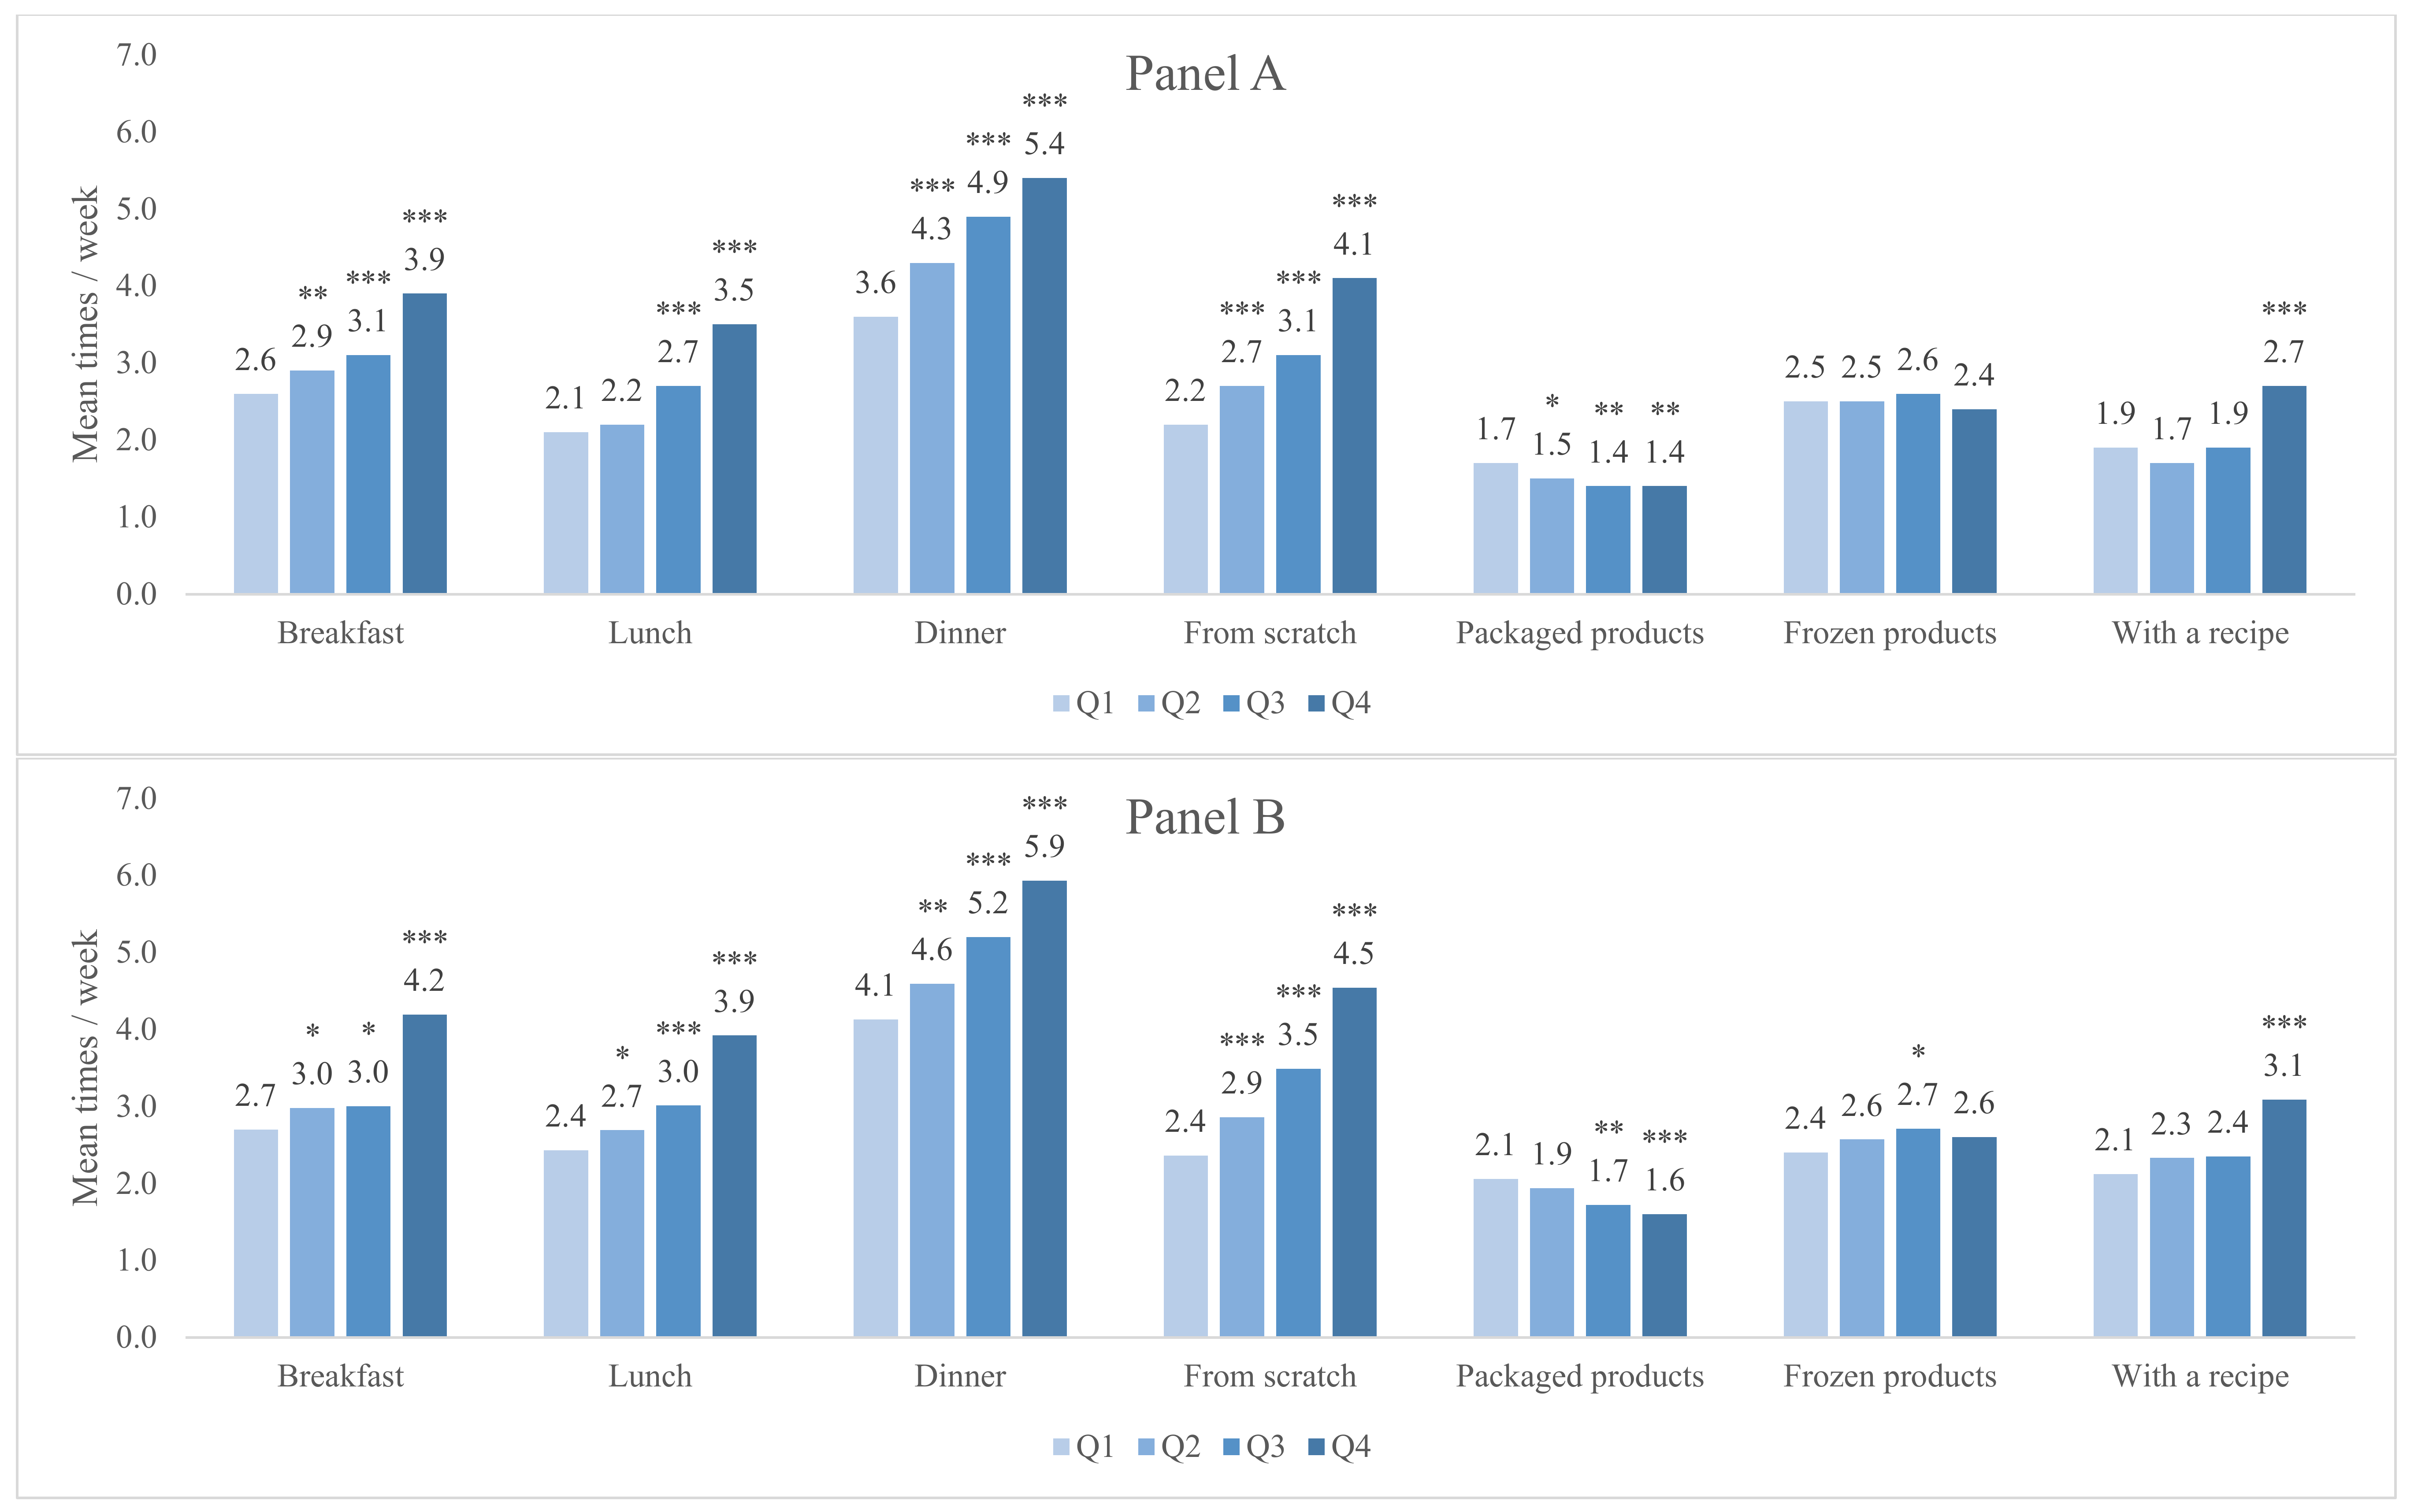
Associations between quartiles of food agency and cooking behavior among the general adult population (Figure 1A) and among parents specifically (Figure 1B) are shown in Figure 1. Among both adults and parents, higher food agency was associated with greater frequency of cooking breakfast, lunch, and dinner (p < 0.001 for Q4 vs. Q1 for each meal in both samples). Higher food agency was also associated with more frequent cooking from scratch (p < 0.001 for Q4 vs. Q1 for both samples) and less frequent cooking with packaged products (p < 0.001 for Q4 vs. Q1 for both samples). Supplementary Figure 1 shows the associations between food agency and cooking behavior in the combined sample.
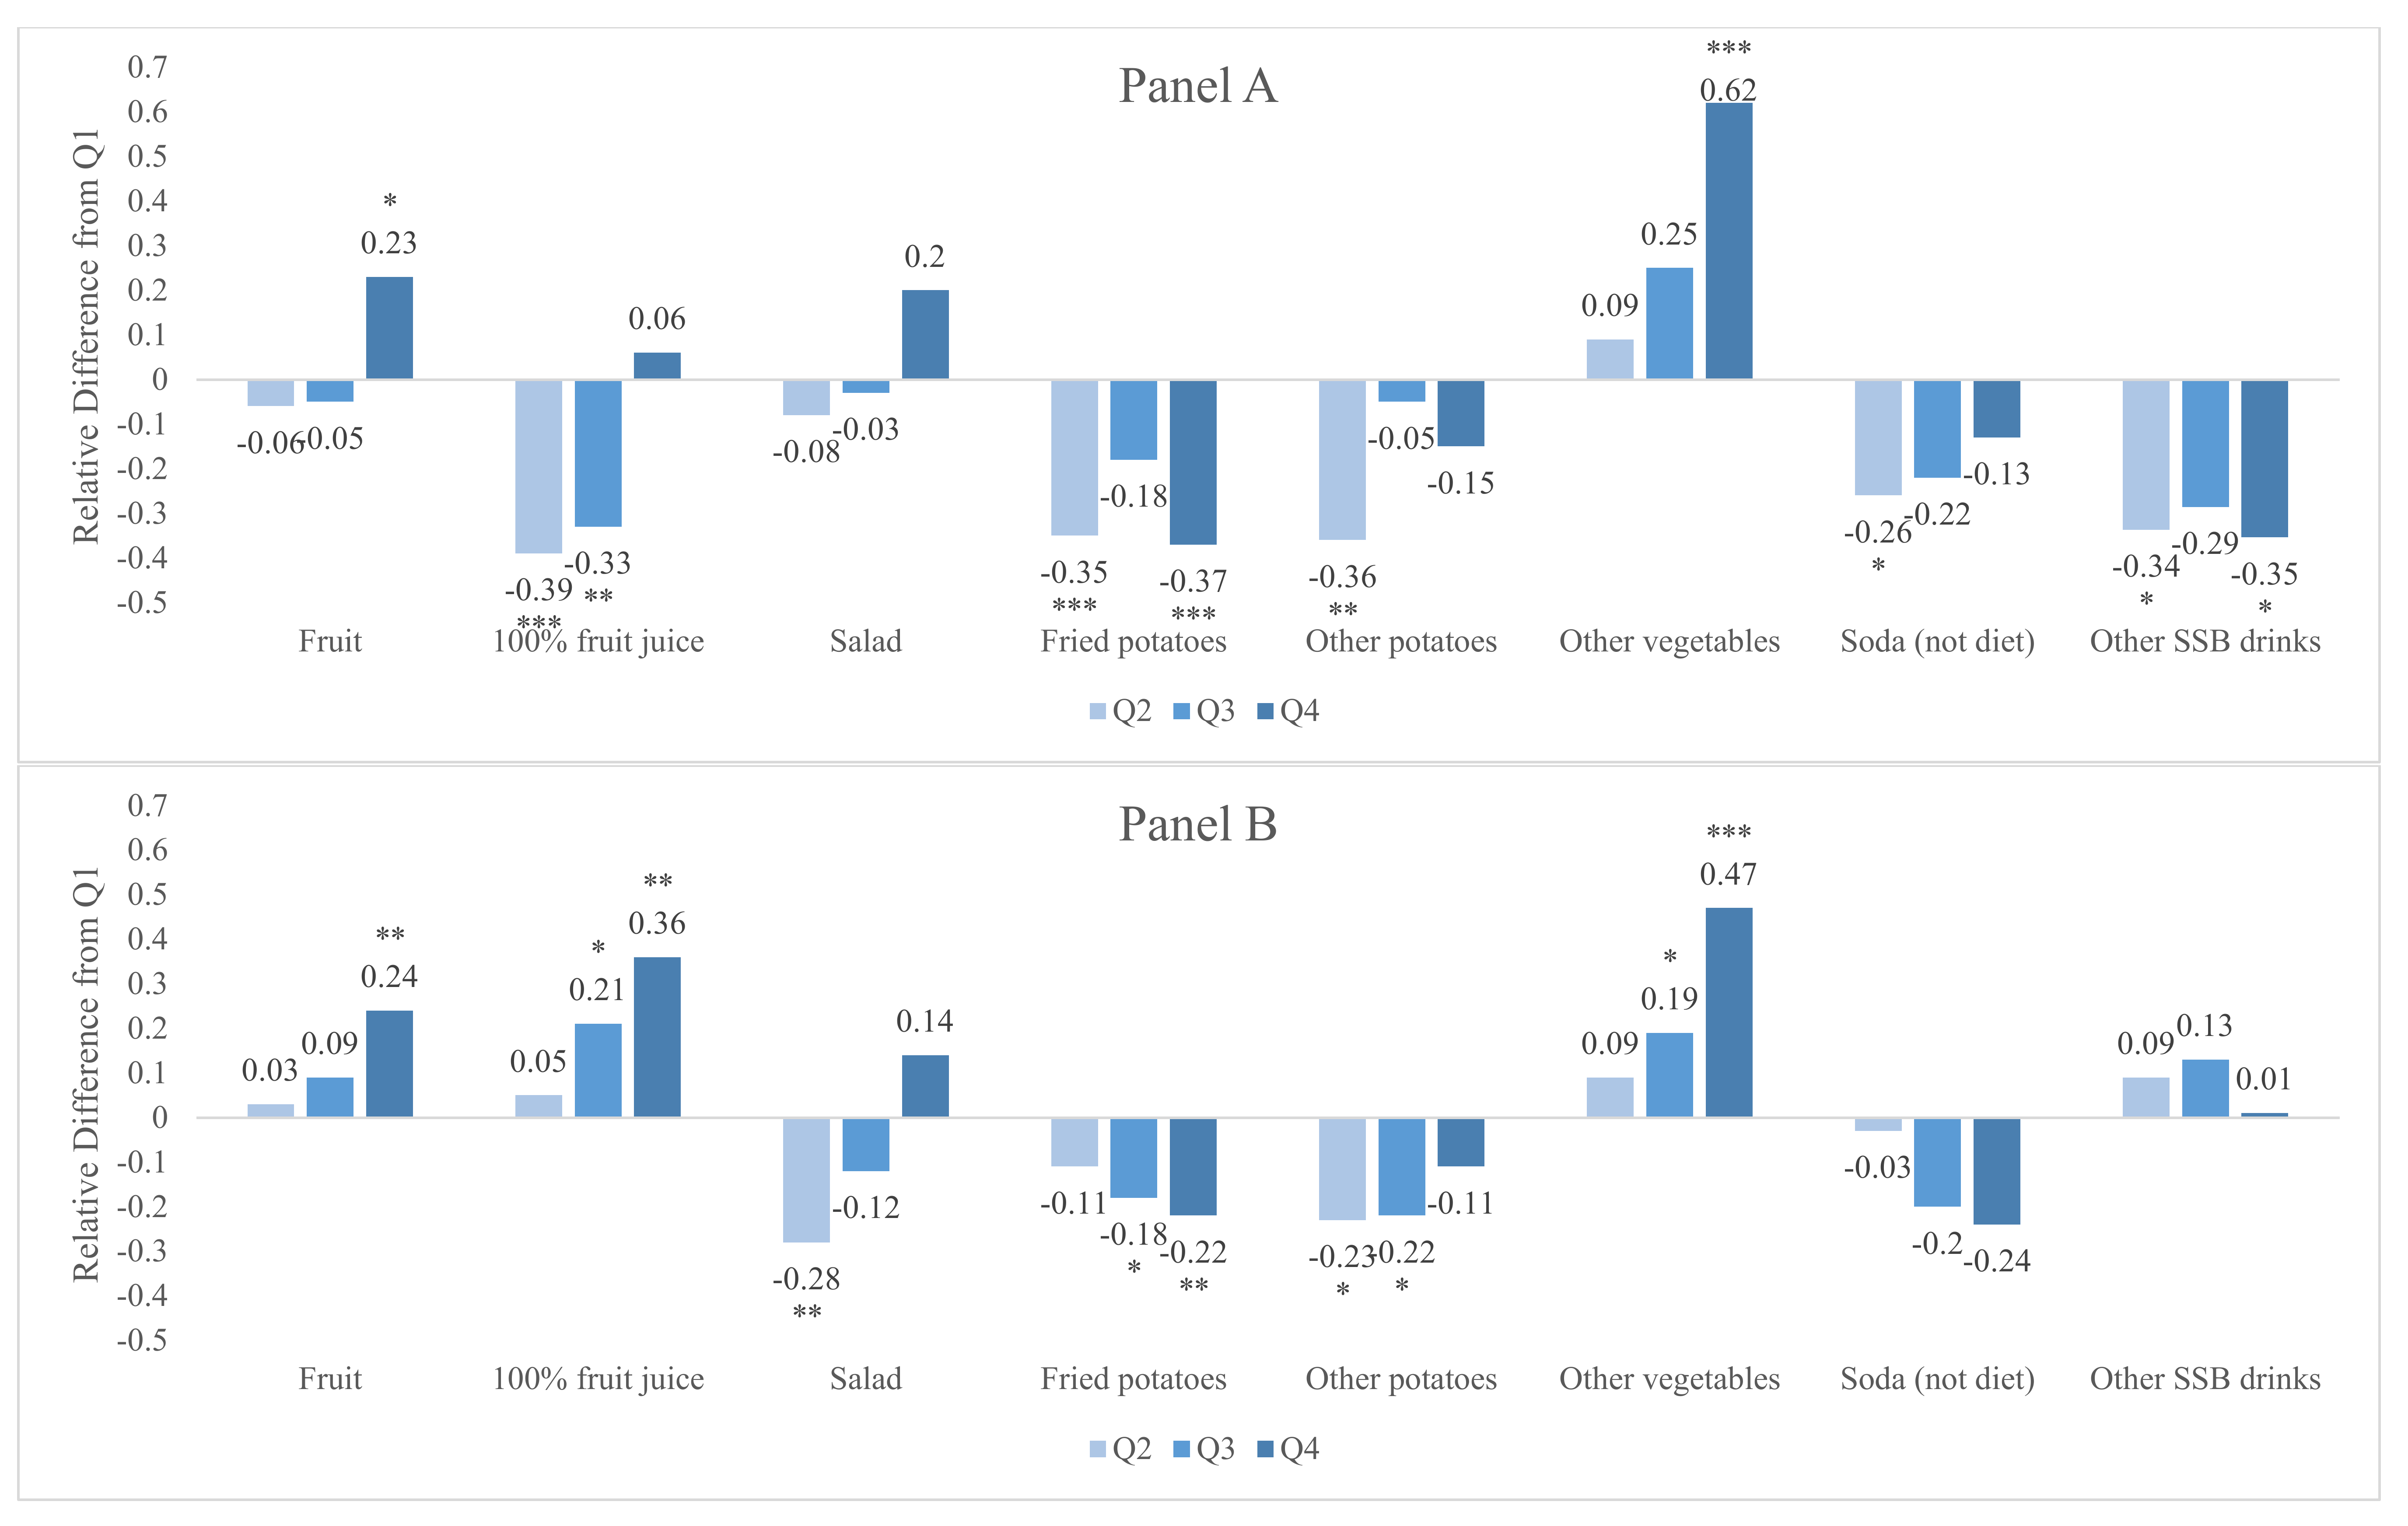
Figure 2 shows the associations between food agency and dietary intake among adults (Figure 2A) and the associations between parental food agency and child dietary intake (Figure 2B). Among the general adult population, higher food agency was associated with higher fruit and other vegetables daily intake (Q4 vs. Q1: fruit, p = 0.02; other vegetables, p < 0.001). Higher food agency was also associated with lower consumption of 100% fruit juice (Q2 vs. Q1: p < 0.001), fried potatoes (Q4 vs. Q1: p < 0.001), other potatoes (Q2 vs: Q1: p = 0.001), soda (Q2 vs. Q1: p = 0.04), and other sugar sweetened beverages (Q4 vs. Q1: p = 0.02). Higher food agency among parents was associated with high fruit (Q4 vs. Q1: p = 0.02), 100% fruit juice (Q4 vs. Q1: p < 0.001), and other vegetable intake (Q4 vs. Q1: p < 0.001) among their 2–9-year-old children. Higher parental food agency was also associated with less consumption of salad (Q2 vs. Q1: p = 0.002), fried potatoes (Q4 vs. Q1: p = 0.007), and other potatoes (Q2 vs. Q1: p = 0.02) among 2–9-year-old children.
4. Discussion
To our knowledge, this is the first study to examine food agency and the complex factors associated with it in a large, national sample in the US. We find that differences in cooking skills, food skills, cooking confidence, and attitudes and perceptions about cooking rather than demographic or socioeconomic factors explain most of the variation in food agency among US adults. We also find that higher food agency is associated with clear differences in cooking behavior and dietary intake in ways that may be important for improving diet quality and diet-related health outcomes among both adults and children. One reason for this may be that cooking is a complex activity that must take place within the parameters of one’s daily life. Put another way, simply having cooking skills is not sufficient; one must be able to use them and to use them frequently. Therefore, food agency (and the CAFPAS scale to measure it) may be a valuable construct that effectively and succinctly summarizes disparate and nonoverlapping cooking and food constructs and skills in the prediction of cooking related outcomes.
The present findings regarding food agency are generally consistent with prior literature examining demographic differences in cooking and food skills, particularly our findings regarding higher food agency among females as compared to males, and differences based on age, education, and employment status [21,23,40,41]. We did not observe notable differences in food agency based on race/ethnicity. Interestingly, in this study, we also observed higher food agency scores among parents compared to adults more generally. Among parents of 2–9-year-old children, univariate analyses indicate that food agency was lower among parents with a college or graduate degree compared to those with a high school diploma or less. In both the parent and adult samples, food agency was lower among those working full time compared to stay at home parents or those not working and looking for work. These differences were driven by significantly lower scores in all three subscales with the largest difference found in the structure subscale. This is a notable finding as it speaks to the fact that cooking skills and behavior do not occur in a vacuum and that one’s ability to put them into practice in daily life—in other words to have agency—is dependent on other contextual factors including having time available to cook, work schedules, and responsibilities [12,13,15,20].
Results from the multivariable hierarchical regression models add further complexity to current understanding of the factors that influence food agency [12,13,28]. As we would predict, demographic and socioeconomic factors alone explained very little of the variation in food agency, whereas the addition of cooking skills and food skills measures to the model increased the R2 from 6.4% to 41.5%. The addition of cooking confidence, attitude, and perception measures also resulted in a significant increase in the amount of variance explained (final model R2 = 0.713). The fact that, in the final model, sex, age, income, education, and food security also remain significant indicates the food agency is a comprehensive measure that not only is a proxy for cooking and food skills but also captures differences in attitudes, confidence, perceptions, and structural factors as well as the effect of other socioeconomic factors that influence approaches to food and cooking. The construct of food agency and the CAFPAS measurement tool are therefore a useful lens to understand cooking as a health behavior. In addition, these results provide support for a focus not only on skills but also on self-efficacy/confidence, attitudes, and perceptions of different needs based on structural and economic factors in cooking and diet behavior change interventions.
The relationship between specific cooking and food skills and dietary intake has not always been entirely clear and consistent, with some studies finding a positive correlation between higher cooking/ food skills and improved dietary intake [6,41] and others painting a more complex picture [11,23]. Cooking and food skills have recently been measured by focusing on a list of specific skills or tasks (e.g., boiling, mixing, sautéing, or microwaving food; reading labels; using grocery lists; etc.) determined a priori by the research team [22,42]. Such skills may not always be applicable to everyone in all contexts and may not always be associated with healthier eating (e.g., baking a cake or preparing a gratin) [41]. An additional complicating factor for this approach is the fact that cooking is a highly complex and contextually dependent behavior [14,43], with no set definition [16,44] and no one “right way” to achieve one’s food-related goals, particularly as the act of cooking evolves as the food system and food supply changes [45]. In some contexts, some skills or actions will be relevant, and in other contexts, different strategies may be needed. In addition, self-rated cooking- and food-skill abilities do not measure how often one uses those skills, which also perhaps explains some of the complexity of measuring the relationship between cooking skills and diet quality [42]. The results from the present study demonstrate that, although the CAFPAS does not directly measure predetermined specific skills, food agency is highly correlated with both self-perceived cooking and food skills and with dietary-quality outcomes, while also providing a multidimensional measure of how one approaches food and cooking. This type of more flexible and transferable scale should be examined in other populations and with more comprehensive measures of diet quality to fully understand how food agency functions in different contexts.
In this study, we find that, among both parents and adults, higher food agency is associated with more frequent cooking of breakfast, lunch, and dinner; more frequent cooking from scratch; and less frequent cooking with packaged products. We also find that higher adult food agency is associated with more frequent consumption of fruit and other vegetables and less frequent consumption of fried and other potatoes. Higher parental food agency is associated with less frequent consumption of fried and other potatoes and more frequent consumption of fruit, 100% fruit juice, and other vegetables among 2–9-year-old children. These findings indicate that interventions focusing on increasing food agency may be helpful for increasing cooking frequency, particularly scratch ingredient cooking, and may help improve diet quality and diet-related health outcomes—potentially both for parents as well as for children.
Cooking frequency is associated with a healthier diet [2,3,4,5,6,46], and strong causal evidence links consumption of packaged, ultra-processed foods with numerous poor health outcomes [8]. Ultra-processed, packaged products [47] are ubiquitous in the food environment in high-income (and increasingly middle- and low-income countries), and recently, cooking at home is recommended by national dietary guidelines and public health practitioners as a means of consuming a healthier and less-processed diet [1,48]. The present findings suggest that policies and interventions to increase food agency may be a key strategy to helping the public cooking more and to cook more from scratch ingredients. In the US, incorporating a food agency approach in SNAP-Ed (the education component of the Supplemental Nutrition Assistant Program (SNAP)) and in the WIC nutrition assistance program and increasing funding for and availability of a modern home economics curriculum (focused on food agency) in K–12 schools, universities, and community colleges are possible policy approaches to increasing food agency. Numerous community cooking interventions already exist that could also incorporate a food agency approach.
Limitations
Our findings should be considered in light of several limitations. First, though we did use an online census-matched panel and quotas to achieve a sample that closely reflects the US population, our samples are not truly nationally representative. However, the fact that the demographics of the parent and adult samples do align with the quotas we specified and the fact that, in both samples, estimates of cooking frequency closely mirror estimates from other nationally representative surveys mitigates some of this concern. Second, due to concerns about making the survey too lengthy, we did not use a full food frequency questionnaire or 24-hour dietary recall to measure dietary intake. Therefore, the present results do not shed light on the relationship between food agency and overall diet quality. This is an important area for future research. Third, all measures included in this study are self-reported and may be subject to self-report bias, social-desirability bias, and recall bias. Finally, these data are cross-sectional and we therefore cannot make any causal inferences about the relationship between food agency and cooking skills, food skills, cooking confidence, attitudes, perceptions, cooking behavior, or dietary intake. Future longitudinal or intervention studies will be useful to elucidate the causal nature of some of these relationships.
5. Conclusions
In this study consisting of two large national samples of US adults, we examined factors associated with food agency including various socioeconomic factors; cooking skills; food skills; and cooking related confidence, attitudes, and perceptions. Cooking skills; food skills; and cooking confidence, attitudes, and perceptions explain a large proportion of the variance associated with differences in food agency. We find that food agency is associated with more frequent cooking, more frequent scratch cooking, and less frequent use of packaged products and with healthier dietary intake among both adults and children. The CAFPAS may, therefore, be a useful and concise summary measure to capture the complex behavior of food preparation and procurement. Food agency is an effective lens for understanding cooking and food skills and behaviors and may be useful for policy approaches and interventions to increase cooking frequency and to encourage healthy diets. These findings add to the emerging literature about the role of cooking skills and food skills and the broader construct of food agency for shaping cooking behavior, food choices, and diet quality.
Supplementary Materials
The following are available online at https://0-www-mdpi-com.brum.beds.ac.uk/2072-6643/12/3/877/s1, Table S1: Hierarchical regression results predicting food agency among the general adult population, Table S2: Hierarchical regression results predicting food agency among parents of 2–9-year-old children, Figure S1: Associations between food agency and cooking behavior among the combined sample (n = 2856).
Author Contributions
Conceptualization, J.A.W.; methodology, J.A.W., J.L., and N.I.; formal analysis, J.A.W. and M.R.; investigation, J.A.W, J.L., and M.R.; resources, J.A.W.; data curation, J.A.W. and M.R.; writing—original draft preparation, J.A.W.; writing—review and editing, J.A.W., J.L., M.R., N.I., F.L., and M.D.; visualization, J.A.W., J.L., and N.I.; supervision, J.A.W.; project administration, J.A.W.; funding acquisition, J.A.W. All authors have read and agreed to the published version of the manuscript.
Funding
This study was funded by a University of Michigan Momentum Center Pilot and Feasibility study grant (no grant number). The funder played no role in the design of the study or interpretation of the results.
Conflicts of Interest
The authors declare no conflict of interest.
References
- US Department of Health and Human Services; US Department of Agriculture. 2015–2020 Dietary Guidelines for Americans; US Department of Health and Human Services: Washington, DC, USA, 2015. [Google Scholar]
- Wolfson, J.A.; Leung, C.W.; Richardson, C.R. More frequent cooking at home is associated with higher Healthy Eating Index-2015 score. Public Health Nutr. 2020, 1–11. [Google Scholar] [CrossRef]
- Wolfson, J.A.; Bleich, S.N. Fruit and vegetable consumption and food values: National patterns in the United States by Supplemental Nutrition Assistance Program eligibility and cooking frequency. Prev. Med. 2015, 76, 1–7. [Google Scholar] [CrossRef] [PubMed] [Green Version]
- Wolfson, J.A.; Bleich, S.N. Is cooking at home associated with better diet quality or weight-loss intention? Public Health Nutr. 2014, 18, 1397–1406. [Google Scholar] [CrossRef] [PubMed] [Green Version]
- Mills, S.D.; White, M.; Brown, H.; Wrieden, W.L.; Kwasnicka, D.; Halligan, J.; Robalino, S.; Adams, J. Health and social determinants and outcomes of home cooking: A systematic review of observational studies. Appetite 2017, 111, 116–134. [Google Scholar] [CrossRef] [PubMed]
- Mills, S.D.; Brown, H.; Wrieden, W.L.; White, M.; Adams, J. Frequency of eating home cooked meals and potential benefits for diet and health: cross-sectional analysis of a population-based cohort study. Int. J. Behav. Nutr. Phys. Act. 2017, 14, 109. [Google Scholar] [CrossRef] [PubMed]
- Poti, J.M.; Mendez, M.A.; Ng, S.W.; Popkin, B.M. Is the degree of food processing and convenience linked with the nutritional quality of foods purchased by US households? Am. J. Clin. Nutr. 2015, 101, 1251–1262. [Google Scholar] [CrossRef] [Green Version]
- Hall, K.D.; Ayuketah, A.; Brychta, R.; Cai, H.; Cassimatis, T.; Chen, K.Y.; Chung, S.T.; Costa, E.; Courville, A.; Darcey, V.; et al. Ultra-Processed Diets Cause Excess Calorie Intake and Weight Gain: An Inpatient Randomized Controlled Trial of Ad Libitum Food Intake. Cell Metab. 2019, 30, 67–77. [Google Scholar] [CrossRef] [Green Version]
- Bowman, S.A.; Vinyard, B.T. Fast food consumption of U.S. adults: impact on energy and nutrient intakes and overweight status. J. Am. Coll. Nutr. 2004, 23, 163–168. [Google Scholar] [CrossRef]
- An, R. Fast-food and full-service restaurant consumption and daily energy and nutrient intakes in US adults. Eur. J. Clin. Nutr. 2015, 70, 97–103. [Google Scholar] [CrossRef]
- Reicks, M.; Kocher, M.; Reeder, J. Impact of Cooking and Home Food Preparation Interventions Among Adults: A Systematic Review (2011–2016). J. Nutr. Educ. Behav. 2018, 50, 148–172. [Google Scholar] [CrossRef]
- Trubek, A.B.; Carabello, M.; Morgan, C.; Lahne, J. Empowered to cook: The crucial role of ‘food agency’ in making meals. Appetite 2017, 116, 297–305. [Google Scholar] [CrossRef] [PubMed]
- Wolfson, J.A.; Bostic, S.; Lahne, J.; Morgan, C.; Henley, S.C.; Harvey, J.; Trubek, A. A comprehensive approach to understanding cooking behavior. Br. Food J. 2017, 119, 1147–1158. [Google Scholar] [CrossRef]
- Short, F. Kitchen Secrets: The meaning of Cooking in Everyday Life. Berg: Oxford, UK, 2006. [Google Scholar]
- Bowen, S.; Brenton, J.; Elliott, S. Pressure Cooker: Why Home Cooking Won’t Solve Our Problems and What We Can Do About It; Oxford University Press: Oxford, UK, 2019. [Google Scholar]
- Wolfson, J.A.; Bleich, S.N.; Smith, K.C.; Frattaroli, S. What does cooking mean to you?: Perceptions of cooking and factors related to cooking behavior. Appetite 2016, 97, 146–154. [Google Scholar] [CrossRef] [PubMed]
- Okrent, A.M.; Kumcu, A. Households’ Demand for Convenience Foods ERR-211; United States Department of Agriculture Economic Reserach Service: Washington, WA, USA, 2016. [Google Scholar]
- Daniels, S.; Glorieux, I. Convenience, food and family lives. A socio-typological study of household food expenditures in 21st-century Belgium. Appetite 2015, 94, 54–61. [Google Scholar] [CrossRef] [PubMed]
- Brunner, T.A.; Van Der Horst, K.; Siegrist, M. Convenience food products. Drivers for consumption. Appetite 2010, 55, 498–506. [Google Scholar] [CrossRef] [PubMed]
- Trubek, A.B. Making Modern Meals: How Americans Cook Today; University of California Press: California, CA, USA, 2017; Volume 66. [Google Scholar]
- Hartmann, C.; Dohle, S.; Siegrist, M. Importance of cooking skills for balanced food choices. Appetite 2013, 65, 125–131. [Google Scholar] [CrossRef]
- Lavelle, F.; McGowan, L.; Hollywood, L.; Surgenor, D.; McCloat, A.; Mooney, E.; Caraher, M.; Raats, M.; Dean, M. The development and validation of measures to assess cooking skills and food skills. Int. J. Behav. Nutr. Phys. Act. 2017, 14, 118. [Google Scholar] [CrossRef] [Green Version]
- McGowan, L.; Pot, G.K.; Stephen, A.M.; Lavelle, F.; Spence, M.; Raats, M.; Hollywood, L.; Surgenor, D.; McCloat, A.; Mooney, E.; et al. The influence of socio-demographic, psychological and knowledge-related variables alongside perceived cooking and food skills abilities in the prediction of diet quality in adults: a nationally representative cross-sectional study. Int. J. Behav. Nutr. Phys. Act. 2016, 13, 111. [Google Scholar] [CrossRef] [Green Version]
- Wolfson, J.A.; Smith, K.C.; Frattaroli, S.; Bleich, S.N. Public perceptions of cooking and the implications for cooking behaviour in the USA. Public Health Nutr. 2016, 19, 1606–1615. [Google Scholar] [CrossRef] [Green Version]
- Byrd-Bredbenner, C. Food Preparation Knowledge and Confidence of Young Adults. J. Nutr. Recipe Menu Dev. 2005, 3, 37–50. [Google Scholar] [CrossRef]
- Murray, D.W.; Mahadevan, M.; Gatto, K.; O’Connor, K.; Fissinger, A.; Bailey, D.; Cassara, E. Culinary efficacy: An exploratory study of skills, confidence, and healthy cooking competencies among university students. Perspect. Public Health 2015, 136, 143–151. [Google Scholar] [CrossRef] [PubMed]
- Pooler, J.A.; Morgan, R.E.; Wong, K.; Wilkin, M.K.; Blitstein, J.L. Cooking Matters for Adults Improves Food Resource Management Skills and Self-confidence Among Low-Income Participants. J. Nutr. Educ. Behav. 2017, 49, 545–553. [Google Scholar] [CrossRef] [PubMed] [Green Version]
- Lahne, J.; Wolfson, J.A.; Trubek, A. Development of the Cooking and Food Provisioning Action Scale (CAFPAS): A new measurement tool for individual cooking practice. Food Qual. Prefer. 2017, 62, 96–105. [Google Scholar] [CrossRef]
- Savage, J.S.; Fisher, J.O.; Birch, L.L. Parental influence on eating behavior: conception to adolescence. J. Law Med. Ethics 2007, 35, 22–34. [Google Scholar] [CrossRef] [Green Version]
- Fulkerson, J.A.; Story, M.; Neumark-Sztainer, D.; Rydell, S. Family Meals: Perceptions of Benefits and Challenges among Parents of 8- to 10-Year-Old Children. J. Am. Diet. Assoc. 2008, 108, 706–709. [Google Scholar] [CrossRef]
- Anzman, S.L.; Rollins, B.Y.; Birch, L.L. Parental influence on children’s early eating environments and obesity risk: implications for prevention. Int. J. Obes. 2010, 34, 1116–1124. [Google Scholar] [CrossRef] [Green Version]
- Ohly, H.; Pealing, J.; Hayter, A.K.; Pettinger, C.; Pikhart, H.; Watt, R.G.; Rees, G. Parental food involvement predicts parent and child intakes of fruits and vegetables. Appetite 2013, 69, 8–14. [Google Scholar] [CrossRef]
- Martins, C.A.; Machado, P.P.; da Costa Louzada, M.L.; Levy, R.B.; Monteiro, C.A. Parents’ cooking skills confidence reduce children’s consumption of ultra-processed foods. Appetite 2020, 144, 104452. [Google Scholar] [CrossRef]
- Litman, L.; Robinson, J.; Abberbock, T. TurkPrime.com: A versatile crowdsourcing data acquisition platform for the behavioral sciences. Behav. Res. Methods 2016, 49, 433–442. [Google Scholar] [CrossRef] [Green Version]
- Zimmerman, M.; Kerr, S. How should the severity of depression be rated on self-report depression scales? Psychiatry Res. Neuroimaging 2019, 280, 112512. [Google Scholar] [CrossRef]
- Yap, K.; Grisham, J.R. Unpacking the construct of emotional attachment to objects and its association with hoarding symptoms. J. Behav. Addict. 2019, 8, 249–258. [Google Scholar] [CrossRef] [PubMed] [Green Version]
- Skrzynski, C.; Creswell, K.G.; Bachrach, R.L.; Chung, T. Social discomfort moderates the relationship between drinking in response to negative affect and solitary drinking in underage drinkers. Addict. Behav. 2018, 78, 124–130. [Google Scholar] [CrossRef] [PubMed]
- National Health and Nutrition Examination Survey 2009–2010 Data Documentation, Codebook, and Frequencies. 2013. Available online: https://wwwn.cdc.gov/Nchs/Nhanes/2009-2010/CBQ_F.htm#CBD160 (accessed on 13 February 2020).
- Centers for Disease Control and Prevention. Behavioral Risk Factor Surveillance System. Available online: http://www.cdc.gov/brfss/ (accessed on 22 November 2016).
- Lavelle, F.; Spence, M.; Hollywood, L.; McGowan, L.; Surgenor, D.; McCloat, A.; Mooney, E.; Caraher, M.; Raats, M.; Dean, M. Learning cooking skills at different ages: A cross-sectional study. Int. J. Behav. Nutr. Phys. Act. 2016, 13, 119. [Google Scholar] [CrossRef] [PubMed] [Green Version]
- Hagmann, D.; Siegrist, M.; Hartmann, C. Acquisition of Cooking Skills and Associations With Healthy Eating in Swiss Adults. J. Nutr. Educ. Behav. 2020. [Google Scholar] [CrossRef]
- Adams, J.; Goffe, L.; Adamson, A.J.; Halligan, J.; O’Brien, J.T.; Purves, R.; Stead, M.; Stocken, D.D.; White, M. Prevalence and socio-demographic correlates of cooking skills in UK adults: cross-sectional analysis of data from the UK National Diet and Nutrition Survey. Int. J. Behav. Nutr. Phys. Act. 2015, 12, 99. [Google Scholar] [CrossRef] [Green Version]
- Short, F. Domestic cooking skills–what are they. J. HEIA 2003, 10, 13–22. [Google Scholar]
- Mills, S.D.; Wolfson, J.A.; Wrieden, W.L.; Brown, H.; White, M.; Adams, J. Perceptions of ‘Home Cooking’: A Qualitative Analysis from the United Kingdom and United States. Nutrients 2020, 12, 198. [Google Scholar] [CrossRef] [Green Version]
- Lang, T.; Caraher, M. Is there a culinary skills transition? Data and debate from the UK about changes in cooking culture. J. Home Econ. Inst. Aust. 2001, 8, 2–14. [Google Scholar]
- Taillie, L.S.; Poti, J. Associations of Cooking With Dietary Intake and Obesity Among Supplemental Nutrition Assistance Program Participants. Am. J. Prev. Med. 2017, 52, S151–S160. [Google Scholar] [CrossRef] [Green Version]
- Monteiro, C.A.; Levy, R.B.; Claro, R.M.; De Castro, I.R.R.; Cannon, G. Increasing consumption of ultra-processed foods and likely impact on human health: Evidence from Brazil. Public Health Nutr. 2010, 14, 5–13. [Google Scholar] [CrossRef]
- Ministry of Health of Brazil. Dietary Guidelines for the Brazilian Population; Carlos Augusto, Monteiro, Secretariat of Health Care-Primary Health Care Department, Eds.; Ministry of Health of Brazil: Brasilia, Brazil, 2015. [Google Scholar]
Figure 1.
Associations between food agency and cooking behavior among the general adult population (A) and among parents of 2–9-year-old children (B). Note: Based on poisson regressions adjusted for sex, age, race/ethnicity, number of children, ages of children, income, education, food security status, and cooking perceptions. Parent sample models were further adjusted for the reference child age and sex. Frequency of cooking behaviors is measured over the past 7 days. Difference from Q1 significant at *** p < 0.001, ** p < 0.01, and * p < 0.05.

Figure 2.
Associations between food agency and dietary intake among the general adult population (A) and parental food agency and dietary intake of 2–9-year-old children (B). Note: Based on generalized linear models with log link and gamma family adjusted for age, sex, race/ethnicity, number of children, ages of children, income, education, and food security status. Difference from Q1 significant at *** p < 0.001, ** p < 0.01, and * p < 0.05.


Table 1.
Characteristics of the study samples.
| Combined Sample | General Adult Sample | Parent Sample | |
|---|---|---|---|
| Total (n) | 2856 | 1457 | 1399 |
| Sex (n (%)) | |||
| Male | 1200 (42.1) | 718 (49.3) | 482 (34.5) |
| Female | 1654 (58.0) | 738 (50.7) | 916 (65.5) |
| Age (mean (SD)) | 41.1 (13.9) | 46.5 (15.8) | 35.5 (8.5) |
| Age (n (%)) | |||
| 18–29 | 598 (21.0) | 251 (17.3) | 347 (24.8) |
| 30–44 | 1308 (45.9) | 448 (30.8) | 860 (61.5) |
| 45–64 | 708 (24.9) | 527 (36.2) | 181 (12.9) |
| ≥65 | 236 (8.3) | 228 (15.7) | 8 (0.6) |
| Race/ethnicity (n (%)) | |||
| Non-Hispanic White | 1327 (46.7) | 684 (47.1) | 643 (46.2) |
| Non-Hispanic Black | 437 (15.4) | 197 (13.6) | 240 (17.3) |
| Hispanic | 781 (27.5) | 407 (28.1) | 374 (26.9) |
| Other | 297 (10.5) | 163 (11.2) | 134 (9.6) |
| Household size (n (%)) | |||
| 1–4 people | 2206 (77.2) | 1295 (88.9) | 911 (65.1) |
| 5 or more people | 650 (22.8) | 162 (11.1) | 488 (34.9) |
| Children < 18 years old in the home (n (%)) | |||
| Yes | 2218 (77.7) | 819 (56.2) | 1399 (100) |
| No | 638 (22.3) | 638 (43.8) | 0 (0) |
| Number of children (mean (SD) ) | 1.78 (1.43) | 1.28 (1.49) | 2.30 (1.14) |
| Ages of children (n (%)) | |||
| ≥1 child aged 0–5 years | 1058 (37.0) | 161 (11.1) | 897 (64.1) |
| ≥1 child aged 6–11 years | 1103 (38.6) | 196 (13.5) | 907 (64.8) |
| ≥1 child aged 12–19 years | 1053 (36.9) | 635 (43.6) | 418 (29.9) |
| Reference child age (mean (SD) ) | N/A | N/A | 6.4 (2.3) |
| Reference child sex (n (%)) | |||
| Male | N/A | N/A | 769 (55.0) |
| Female | N/A | N/A | 630 (45.0) |
| Marital status (n (%)) | |||
| Married | 1598 (56.2) | 693 (47.8) | 905 (64.9) |
| Living with a partner | 301 (10.6) | 108 (7.5) | 193 (13.9) |
| Divorced/separated/Widowed | 313 (11.0) | 213 (14.7) | 100 (7.2) |
| Never married | 632 (22.2) | 436 (30.1) | 196 (14.1) |
| Household income (n (%)) | |||
| Less than $50,000 | 1277 (45.4) | 610 (42.5) | 667 (48.3) |
| $50,000–$100,000 | 932 (33.1) | 487 (34.0) | 445 (32.3) |
| More than $100,000 | 605 (21.5) | 337 (23.5) | 268 (19.4) |
| Education (n (%)) | |||
| High school diploma or less | 962 (33.8) | 485 (33.3) | 477 (34.3) |
| Some college | 687 (24.1) | 326 (22.4) | 361 (25.9) |
| College or graduate degree | 1199 (42.1) | 645 (44.3) | 554 (39.8) |
| Employment status (n (%)) | |||
| Working full time | 1334 (47.3) | 612 (42.7) | 722 (52.0) |
| Working part time | 315 (11.2) | 168 (11.7) | 147 (10.6) |
| Not working but looking for work | 222 (7.9) | 144 (10.0) | 78 (5.6) |
| Not working and not looking for work | 412 (14.6) | 379 (26.4) | 33 (2.4) |
| Stay at home parent | 540 (19.1) | 131 (9.1) | 409 (29.5) |
| SNAP b participation (n (%)) | |||
| Yes | 491 (17.4) | 175 (12.1) | 316 (23.0) |
| No | 2331 (82.6) | 1,270 (87.9) | 1061 (77.1) |
| WIC c participation (n (%)) | |||
| Yes | 259 (9.1) | 36 (2.5) | 223 (16.1) |
| No | 2582 (90.9) | 1417 (97.5) | 1165 (83.9) |
| Household food insecurity (n (%)) | |||
| We have enough of the foods we want to eat | 1911 (67.4) | 1043 (72.2) | 868 (62.4) |
| We have enough but not always the kinds of food we want to eat | 722 (25.5) | 319 (22.1) | 403 (29.0) |
| Sometimes we do not have enough to eat | 171 (6.0) | 70 (4.8) | 101 (7.3) |
| We often do not have enough to eat | 32 (1.1) | 13 (0.9) | 19 (1.4) |
| Weight status a (n (%)) | |||
| Healthy | 495 (35.2) | 495 (35.2) | 440 (32.8) |
| Overweight | 489 (34.8) | 489 (34.8) | 415 (30.9) |
| Obese | 422 (30.0) | 422 (30.0) | 487 (36.3) |
a Based on Body Mass Index (BMI) score. Healthy weight status = 18.5 < BMI < 24.99. Overweight = 25.00 ≤ BMI < 30.00. Obese = BMI ≥ 30. BMI scores were calculated based on self-reported height and weight information. b Supplemental Nutrition Assistance Program. c Special Supplemental Nutrition Program for Women, Infants, and Children. Note: Some variables do not sum to the full sample size due to missing data. Some percentages sum to >100 due to rounding.
Table 2.
Description of the cooking related study variables.
| Combined Sample | General Adult Sample | Parent Sample | ||||||
|---|---|---|---|---|---|---|---|---|
| n = 2856 | n = 1457 | n = 1399 | ||||||
| Variable | No. Items | Mean score | SD | Mean score | SD | Mean Score | SD | |
| Food Agency | ||||||||
| Full Food Agency scale a | 28 | 13.07 | 2.41 | 12.70 | 2.37 | 14.31 | 2.61 | |
| Subscale 1: Food Self-efficacy (e.g., (How much do you agree or disagree with…) Before I start cooking, I usually have a mental plan of all the steps I will need to complete) | 13 | 5.49 | 1.00 | 5.27 | 1.00 | 5.75 | 1.00 | |
| Subscale 2: Food attitudes (e.g., (How much do you agree or disagree with…) For me, cooking is just something to get through as quickly as possible) | 10 | 4.27 | 1.00 | 4.03 | 1.00 | 5.31 | 1.16 | |
| Subscale 3: Structural barriers (e.g., (How much do you agree or disagree with…) My job responsibilities prevent me from having the time to prepare meals) | 5 | 3.31 | 1.00 | 3.39 | 1.00 | 3.25 | 1.00 | |
| Skills | ||||||||
| Cooking skills b (e.g., (Do you/ how good you are at…) blending foods to make them smooth) | 14 | 67.44 | 21.19 | 64.65 | 22.95 | 70.34 | 18.80 | |
| Food skills b (e.g., (How good you are at…) planning how much food to buy) | 19 | 102.90 | 19.82 | 102.68 | 19.94 | 103.12 | 19.91 | |
| Confidence and Attitudes | ||||||||
| Cooking confidencec (e.g., (How confident are you…) cooking from scratch using fresh ingredients) | 4 | 5.42 | 1.23 | 5.37 | 1.28 | 5.47 | 1.17 | |
| Positive cooking attitudes c (e.g., (How much do you agree or disagree with…) Cooking is important to me) | 7 | 5.51 | 1.18 | 5.39 | 1.25 | 5.64 | 1.01 | |
| Negative cooking attitudes c (e.g., (How much do you agree or disagree with…) Cooking is stressful) | 5 | 3.25 | 1.32 | 3.27 | 1.34 | 3.24 | 1.30 | |
| Perceptions | ||||||||
| Convenience foods c (Factor 1) (e.g., (I would say I have cooked if I…) used the oven to heat up store-bought frozen or packaged items such as chicken nuggets, French fries, or fish) | 6 | 4.05 | 1.55 | 4.03 | 1.56 | 4.08 | 1.55 | |
| Scratch ingredients c (Factor 2) (e.g., (I would say I have cooked if I…) made something on the stove or oven using mostly scratch or fresh ingredients) | 4 | 5.89 | 0.91 | 5.82 | 0.92 | 6.00 | 0.88 | |
| Role of heat c (Factor 3) (e.g., (I would say I have cooked if I…) chopped vegetables to make a salad and used a store-bought salad dressing) | 4 | 4.58 | 1.38 | 4.56 | 1.38 | 4.61 | 1.37 | |
a Standardized scale: Each subscale is divided by the standard deviation, and then, subscales scores are summed to create the overall score. b Additive scale: Responses to each of the items in the set are summed. c Mean scale: The mean of all items in the set are taken to create an overall mean score.
Table 3.
Univariate associations with food agency among the general adult population and parents of 2–9-year-old children.
Table 3.
Univariate associations with food agency among the general adult population and parents of 2–9-year-old children.
| Combined Sample | General Sample | Parent Sample | ||||
|---|---|---|---|---|---|---|
| n = 2856 | n = 1457 | n = 1399 | ||||
| Mean (SE) | p-value | Mean (SE) | p-value | Mean (SE) | p-value | |
| Sex | ||||||
| Male | 12.79 (0.06) | (ref) | 12.44 (0.09) | (ref) | 14.01 (0.12) | (ref) |
| Female | 13.28 (0.06) | <0.001 | 12.94 (0.09) | <0.001 | 14.47 (0.09) | 0.002 |
| Age | ||||||
| 18–29 | 12.73 (0.10) | (ref) | 11.77 (0.15) | (ref) | 14.43 (0.14) | (ref) |
| 30–45 | 12.89 (0.07) | 0.20 | 12.46 (0.11) | <0.001 | 14.12 (0.09) | 0.06 |
| 45–64 | 13.57 (0.09) | <0.001 | 13.17 (0.10) | <0.001 | 14.95 (0.19) | 0.03 |
| ≥65 | 13.42 (0.16) | <0.001 | 13.05 (0.15) | <0.001 | 15.44 (0.92) | 0.28 |
| Race/ethnicity | ||||||
| NH White | 13.02 (0.07) | (ref) | 12.76 (0.09) | (ref) | 14.12 (0.10) | (ref) |
| NH Black | 13.45 (0.12) | 0.001 | 12.87 (0.16) | 0.56 | 14.88 (0.17) | <0.001 |
| Hispanic | 13.05 (0.09) | 0.822 | 12.59 (0.12) | 0.23 | 14.39 (0.13) | 0.11 |
| Other | 12.83 (0.14) | 0.203 | 12.47 (0.19) | 0.16 | 14.03 (0.22) | 0.72 |
| Parents of children 0–18 in the home | ||||||
| Yes | 13.17 (0.05) | (ref) | 12.94 (0.08) | (ref) | n/a | n/a |
| No | 12.73 (0.10) | <0.001 | 12.38 (0.09) | <0.001 | n/a | n/a |
| Household income | ||||||
| Less than $50,000 | 13.11 (0.07) | (ref) | 12.73 (0.10) | (ref) | 14.35 (0.10) | (ref) |
| $50,000–$100,000 | 13.08 (0.08) | 0.763 | 12.66 (0.11) | 0.65 | 14.37 (0.12) | 0.90 |
| More than $100,000 | 13.00 (0.10) | 0.261 | 12.69 (0.13) | 0.80 | 14.09 (0.16) | 0.16 |
| Education | ||||||
| High school diploma or less | 13.17 (0.08) | (ref) | 12.65 (0.11) | (ref) | 14.58 (0.12) | (ref) |
| Some college | 13.23 (0.09) | 0.602 | 12.94 (0.13) | 0.09 | 14.39 (0.14) | 0.31 |
| College or graduate degree | 12.90 (0.07) | 0.012 | 12.61 (0.09) | 0.77 | 14.04 (0.11) | 0.001 |
| Employment status | ||||||
| Working full time | 12.72 (0.06) | (ref) | 12.42 (0.10) | (ref) | 13.88 (0.09) | (ref) |
| Working part time | 12.85 (0.13) | 0.404 | 12.48 (0.18) | 0.78 | 14.07 (0.21) | 0.43 |
| Not working but looking for work | 12.91 (0.16) | 0.269 | 12.52 (0.20) | 0.65 | 14.22 (0.29) | 0.26 |
| Not working and not looking for work | 13.53 (0.12) | <0.001 | 13.11 (0.12) | <0.001 | 15.55 (0.44) | <0.001 |
| Stay at home parent | 13.79 (0.10) | <0.001 | 13.27 (0.21) | <0.001 | 15.09 (0.13) | <0.001 |
| Household food insecurity | ||||||
| We have enough of the foods we want to eat | 13.28 (0.05) | (ref) | 12.87 (0.07) | (ref) | 14.58 (0.09) | (ref) |
| We have enough but not always the kinds of food we want to eat | 12.67 (0.09) | <0.001 | 12.26 (0.13) | <0.001 | 13.91 (0.13) | <0.001 |
| Sometimes we do not have enough to eat | 12.67 (0.18) | 0.002 | 12.56 (0.28) | 0.28 | 13.69 (0.26) | 0.001 |
| We often do not have enough to eat | 12.45 (0.42) | 0.052 | 11.11 (0.65) | 0.01 | 14.34 (0.59) | 0.69 |
Note: “Ref” stands for reference group.
Table 4.
Hierarchical regression results predicting food agency among the combined sample of the general adult population and parents of 2–9-year-old children (n = 2856).
Table 4.
Hierarchical regression results predicting food agency among the combined sample of the general adult population and parents of 2–9-year-old children (n = 2856).
| Model 1 β (SE) | Model 2 β (SE) | Model 3 β (SE) | Model 4 β (SE) | |||||
|---|---|---|---|---|---|---|---|---|
| Sex | ||||||||
| Male | (ref) | (ref) | (ref) | (ref) | ||||
| Female | 0.55 *** | (0.09) | 0.55 *** | (0.09) | 0.07 | (0.07) | 0.18 *** | (0.05) |
| Age | 0.03 *** | (0.00) | 0.03 *** | (0.00) | 0.03 *** | (0.00) | 0.03 *** | (0.00) |
| Race/ethnicity | ||||||||
| NH White | (ref) | (ref) | (ref) | (ref) | ||||
| NH Black | 0.43 ** | (0.13) | 0.39 ** | (0.13) | 0.26 * | (0.11) | 0.12 | (0.07) |
| Hispanic | 0.13 | (0.11) | 0.12 | (0.11) | 0.07 | (0.09) | −0.03 | (0.06) |
| Other | −0.14 | (0.15) | −0.10 | (0.16) | −0.09 | (0.12) | −0.14 | (0.09) |
| Number of children in household | 0.12 *** | (0.03) | 0.13 *** | (0.03) | 0.04 | (0.03) | 0.02 | (0.02) |
| Household income | ||||||||
| Less than $50,000 | (ref) | (ref) | (ref) | |||||
| $50,000–$100,000 | −0.16 | (0.11) | −0.22 * | (0.08) | −0.18 ** | (0.06) | ||
| More than $100,000 | −0.38 ** | (0.13) | −0.40 *** | (0.10) | −0.33 *** | (0.07) | ||
| Education | ||||||||
| High school diploma or less | (ref) | (ref) | (ref) | |||||
| Some college | −0.03 | (0.12) | −0.25 ** | (0.10) | −0.16 * | (0.07) | ||
| College or graduate degree | −0.34 ** | (0.11) | −0.46 *** | (0.09) | −0.23 *** | (0.06) | ||
| Household food insecurity | ||||||||
| We have enough of the foods we want to eat | (ref) | (ref) | (ref) | |||||
| We have enough but not always the kinds of food we want to eat | −0.68 *** | (0.11) | −0.36 *** | (0.09) | −0.17 ** | (0.06) | ||
| Sometimes we do not have enough to eat | −0.83 *** | (0.20) | −0.49 ** | (0.16) | −0.08 | (0.11) | ||
| We often do not have enough to eat | −1.06 * | (0.42) | −0.60 | (0.33) | 0.09 | (0.23) | ||
| Cooking Skills | 0.04 *** | (0.00) | 0.01 *** | (0.00) | ||||
| Food skills | 0.04 *** | (0.00) | 0.01 *** | (0.00) | ||||
| Cooking confidence | 0.15 *** | (0.04) | ||||||
| Positive attitudes | 0.65 *** | (0.04) | ||||||
| Negative Attitudes | −0.73 *** | (0.02) | ||||||
| Cooking Perceptions | ||||||||
| F1: Convenience foods | −0.12 *** | (0.02) | ||||||
| F2: Scratch ingredients | 0.19 *** | (0.03) | ||||||
| F3: Heat | −0.11 *** | (0.02) | ||||||
| Model R2 | 0.044 | 0.064 | 0.415 | 0.713 | ||||
| Change in R2 from prior model | n/a | 0.021, p < 0.001 | 0.351, p < 0.001 | 0.298, p < 0.001 | ||||
Note: *** p < 0.001, ** p < 0.01, * p < 0.05. “Ref” stands for reference group.
© 2020 by the authors. Licensee MDPI, Basel, Switzerland. This article is an open access article distributed under the terms and conditions of the Creative Commons Attribution (CC BY) license (http://creativecommons.org/licenses/by/4.0/).
Share and Cite
MDPI and ACS Style
Wolfson, J.A.; Lahne, J.; Raj, M.; Insolera, N.; Lavelle, F.; Dean, M. Food Agency in the United States: Associations with Cooking Behavior and Dietary Intake. Nutrients 2020, 12, 877. https://0-doi-org.brum.beds.ac.uk/10.3390/nu12030877
AMA Style
Wolfson JA, Lahne J, Raj M, Insolera N, Lavelle F, Dean M. Food Agency in the United States: Associations with Cooking Behavior and Dietary Intake. Nutrients. 2020; 12(3):877. https://0-doi-org.brum.beds.ac.uk/10.3390/nu12030877
Chicago/Turabian StyleWolfson, Julia A., Jacob Lahne, Minakshi Raj, Noura Insolera, Fiona Lavelle, and Moira Dean. 2020. "Food Agency in the United States: Associations with Cooking Behavior and Dietary Intake" Nutrients 12, no. 3: 877. https://0-doi-org.brum.beds.ac.uk/10.3390/nu12030877
Note that from the first issue of 2016, this journal uses article numbers instead of page numbers. See further details here.