Stable Iodine Nutrition During Two Decades of Continuous Universal Salt Iodisation in Sri Lanka


Abstract
:1. Introduction
History of Iodine Deficiency and Its Management in Sri Lanka
2. Methods
2.1. Available Data Sources for Analysis
2.2. Indicators of Population Iodine Status
3. Data Analysis
4. Results
5. Discussion
6. Conclusions
Author Contributions
Acknowledgments
Conflicts of Interest
References
- Stanbury, J.B.; Hetzel, B.S. Endemic Goitre and Endemic Cretinism, Iodine Nutrition in Health and Disease; John Wiley and Sons: New York, NY, USA, 1980. [Google Scholar]
- World Health Organization. Iodine and Health—Eliminating Iodine Deficiency Disorders Safely through Salt Iodisation; A statement by the WHO; WHO: Geneva, Switzerland, 1994. [Google Scholar]
- World Health Organization. Assessment of Iodine Deficiency Disorders and Monitoring Their Elimination: A Guide for Programme Managers, 3rd ed.; WHO: Geneva, Switzerland, 2007. [Google Scholar]
- Iodine Global Network (IGN). Global Scorecard of Iodine Nutrition in 2019. Available online: https://www.ign.org/cm_data/Global_Scorecard_2019_SAC.pdf (accessed on 14 March 2020).
- World Health Organization. Recommended Iodine Levels in Salt and Guidelines for Monitoring their Adequacy and Effectiveness. Based on a Joint WHO/UNICEF/ICCIDD Consultation. World Health Organization: Geneva, Switzerland, 8–9 July 1996. Available online: https://apps.who.int/iris/bitstream/handle/10665/63322/WHO_NUT_96.13.pdf (accessed on 14 March 2020).
- Greenwald, I. Some notes on the history of goitre in Ceylon. Ceylon Med J. 1953, 2, 140. [Google Scholar] [PubMed]
- Wilson, D.C. Goitre in Ceylon and Nigeria. Br. J. Nutr. 1954, 8, 90–99. [Google Scholar] [CrossRef] [PubMed] [Green Version]
- Mahadeva, K.; Seneviratne, D.A.; Jayatilleke, D.B.; Shanmuganathan, S.S.; Premachandra, P.; Nagarajah, M. Further studies on the problem of goitre in Ceylon. Br. J. Nutr. 1968, 22, 527–534. [Google Scholar] [CrossRef] [PubMed] [Green Version]
- Deo, M.G.; Subramanian, T.A.V. Iodine metabolism in children and women with goitre in Ceylon. Br. J. Nutr. 1971, 25, 97–105. [Google Scholar] [CrossRef] [PubMed] [Green Version]
- Fernando, M.A.; Balsuriya, S.; Herath, K.B.; Katugampola, S. Endemic Goitre in Sri Lanka. Asia Pac. J. Public Health 1989, 3, 11–18. [Google Scholar] [CrossRef] [PubMed]
- Government of Sri Lanka. Food (Iodization of Salt) Regulations under Section 32 of the Food Act, No. 26 of 1980; Department of Government Printing: Colombo, Sri Lanka, 1995.
- Centers for Diseases Control and Prevention (CDC). The Challenge of Iodine Deficiency Disorders. EQIP 10 Years Anniversary. Atlanta, USA. 2011. Available online: https://www.cdc.gov/labstandards/pdf/equip/EQUIP_Booklet.pdf (accessed on 14 March 2020).
- Jayatissa, R.; Gunathilaka, M.; Fernando, D. Iodine nutrition status among schoolchildren after salt iodisation. Ceylon Med. J. 2005, 50, 144–148. [Google Scholar] [CrossRef] [PubMed] [Green Version]
- Jayatissa, R.; Gunathilaka, M.; Fernando, D. Second National Iodine Survey; Medical Research Institute: Colombo, Sri Lanka, 2006. Available online: http://www.mri.gov.lk/assets/Nutrition/2005-Second-National-IDD-Survey-.pdf (accessed on 21 March 2020).
- Jayatissa, R.; Gunathilaka, M.; Fernando, D. Third National Iodine Survey; Medical Research Institute: Colombo, Sri Lanka, 2010; Available online: https://www.ign.org/cm_data/2017_Sri_Lanka.pdf (accessed on 21 March 2020).
- Jayatissa, R.; Fernando, D.; De Silva, H. Fourth National Iodine Survey; Medical Research Institute: Colombo, Sri Lanka, 2016. Available online: http://www.mri.gov.lk/assets/Nutrition/2016-Fourth-National-IDD-survey-.pdf (accessed on 21 March 2020).
- Gorstein, J.S.K.; Parvanta, I.; Begin, I. Indicators and Methods for Cross-Sectional Surveys of Vitamin and Mineral Status of Populations; The Micronutrient Initiative: Ottawa, ON, Canada; Center of Disease Surveillance: Atlanta, GA, USA, 2007. [Google Scholar]
- World Health Organisation. Indicators for Assessing Iodine Deficiency Disorders and their Control through Salt Iodizaton; WHO/NUT/94.6; WHO; UNICEF; ICCIDD: Geneva, Switzerland, 1994; pp. 1–55. [Google Scholar]
- Jayatissa, R.; Fernando, D.; De Silva, H. National Nutrition and Micronutrient Survey of Pregnant Women in Sri Lanka: 2015; Medical Research Institute/UNICEF/WFP: Colombo, Sri Lanka, 2017; Available online: https://www.wfp.org/publications/national-nutrition-and-micronutrient-survey-pregnant-women-sri-lanka (accessed on 21 March 2020).
- Ohashi, T.; Yamaki, M.; Pandav, C.S.; Karmarkar, M.G.; Irie, M. Simple microplate method for determination of urinary iodine. Clin. Chem. 2000, 46, 529–536. [Google Scholar] [CrossRef] [PubMed] [Green Version]
- Delange, F.; de Benoist, B.; Burgi, H.; ICCIDD Working Group. At what median urinary iodine concentration is a population iodine suffcient? IDD News Lett. 2001, 17, 10–11. [Google Scholar]
- United Nation of Independent Children’s Fund (UNICEF). Guidance on the Monitoring of Salt Iodization Programmes and Determination of Population Iodine Status; UNICEF: New York, NY, USA, 2019. [Google Scholar]
- World Health Organization. Iodine in Drinking Water; WHO: Geneva, Switzerland, 2003. [Google Scholar]
- Lv, S.; Wang, Y.; Xu, D.; Rutherford, S.; Chong, Z.; Du, Y.; Jia, L.; Zhao, J. Drinking water contributes to excessive iodine intake among children in Hebei, China. Eur. J. Clin. Nutr. 2013, 67, 961–965. [Google Scholar] [CrossRef] [PubMed]
- Markou, K.B.; Georgopoulos, A.; Makri, M.; Anastasiou, E.; Vlasopoulou, B.; Lazarou, N.; Veizis, A.; Sakellaropoulos, G.; Vagenakis, A.G. Iodine deficiency in Azerbaijan after the discontinuation of an iodine prophylaxis program: Reassessment of iodine intake and goiter prevalence in schoolchildren. Thyroid 2001, 11, 1141–1146. [Google Scholar] [CrossRef] [PubMed]
- Li, M.; Ma, G.; Boyages, S.C.; Eastman, C.J. Re-emergence of iodine deficiency in Australia. Asia Pac. J. Clin. Nutr. 2001, 10, 200–203. [Google Scholar] [CrossRef] [PubMed] [Green Version]
- Zimmermann, M.B.; Wegmüller, R.; Zeder, C.; Torresani, T.; Chaouki, N. Rapid relapse of thyroid dysfunction and goiter in school age children after withdrawal of salt iodization. Am. J. Clin. Nutr. 2004, 79, 642–645. [Google Scholar] [CrossRef] [PubMed]
- Zimmermann, M.B. Assessing iodine status and monitoring progress of iodised salt programs. J. Nutr. 2004, 134, 1673–1677. [Google Scholar] [CrossRef] [PubMed]
- Lazarus, J.H.; Bestwick, J.P.; Channon, S.; Paradice, R.; Maina, A.; Rees, R.; Chiusano, E.; John, R.; Guaraldo, V.; George, L.M. Antenatal thyroid screening and childhood cognitive function. N. Engl. J. Med. 2012, 366, 493–501. [Google Scholar] [CrossRef] [Green Version]
- Jayatissa, R.; Gunathilaka, M.M.; Ranbanda, J.M.; Peiris, P.; Jayasingha, J.; Ekanayaka, P.; Kulathunga, H. Iodine status of pregnant women in Sri Lanka. Sri Lanka J. Diabetes Endocrinol. Metab. 2013, 3, 4–7. [Google Scholar] [CrossRef] [Green Version]
- Zimmermann, M.B.; Ito, Y.; Hess, S.Y.; Fujieda, K.; Molinari, L. High thyroid volume in children with excess dietary iodine intakes. Am. J. Clin. Nutr. 2005, 81, 840–844. [Google Scholar] [CrossRef]
- Shen, H.; Liu, S.; Sun, D.; Zhang, S.; Su, X.; Shen, Y.; Han, H. Geographical distribution of drinking water with high iodine level and association between high iodine level in drinking water and goitre: A Chines national investigation. Br. J. Nutr. 2011, 106, 243–247. [Google Scholar] [CrossRef] [PubMed] [Green Version]
- Jayatissa, R.; Fernando, D.N. Supplementation of micronutrients in children and food fortification initiatives in Sri Lanka: Benefits versus risks. Ann. N. Y. Acad. Sci. 2018, 1–14. [Google Scholar] [CrossRef] [PubMed] [Green Version]
- Jayatissa, R.; Yamori, Y.; De Silva, A.H.; Mori, M.; De Silva, P.C. Estimation of salt intake, potassium intake and sodium-to-potassium ratio by 24-hour urinary excretion: An urban rural study in Sri Lanka. 2012, in press. [Google Scholar] [CrossRef]


| Surveys | UIC (µg/L) | TGR 3 | HHIS (%) 4 | ||||
|---|---|---|---|---|---|---|---|
| % < 50 1 | Median (IQR) 2 | % | <5 | 5–14.9 | 15–30 | >30 | |
| NIS–2016 (n = 5000) | 1.6 | 232.5 (159.3–315.8) | 1.9 | 3.1 | 18.4 | 63.5 | 15.0 |
| NIS–2010 (n = 7401) | 6.7 | 163.4 (99.1–245.1) | 4.4 | 4.6 | 27.1 | 52.5 | 16.1 |
| NIS–2005 (n = 1879) | 7.4 | 154.4 (90.3–252.6) | 3.8 | 0.0 | 8.7 | 47.7 | 43.5 |
| NIS–2000 (n = 2628) | 2.7 | 145.3 (84.6–315.8) | 18.0 | – | – | – | – |
| Trimesters | UIC (µg/L) | No | |
|---|---|---|---|
| Period of Amenorrhea (POA) | % <50 1 | Median (IQR) 2 | |
| First trimester (≤12 weeks of POA) | 17.0 | 102.3 (61.7–147.1) | 447 |
| Second trimester (13–28 weeks of POA) | 6.2 | 217.5 (115.6–313.0) | 339 |
| Third trimester (>28 weeks of POA) | 0.0 | 273.1 (228.9–337.6) | 176 |
| Overall | 10.1 | 157.7 (91.2–256.4) | 962 |
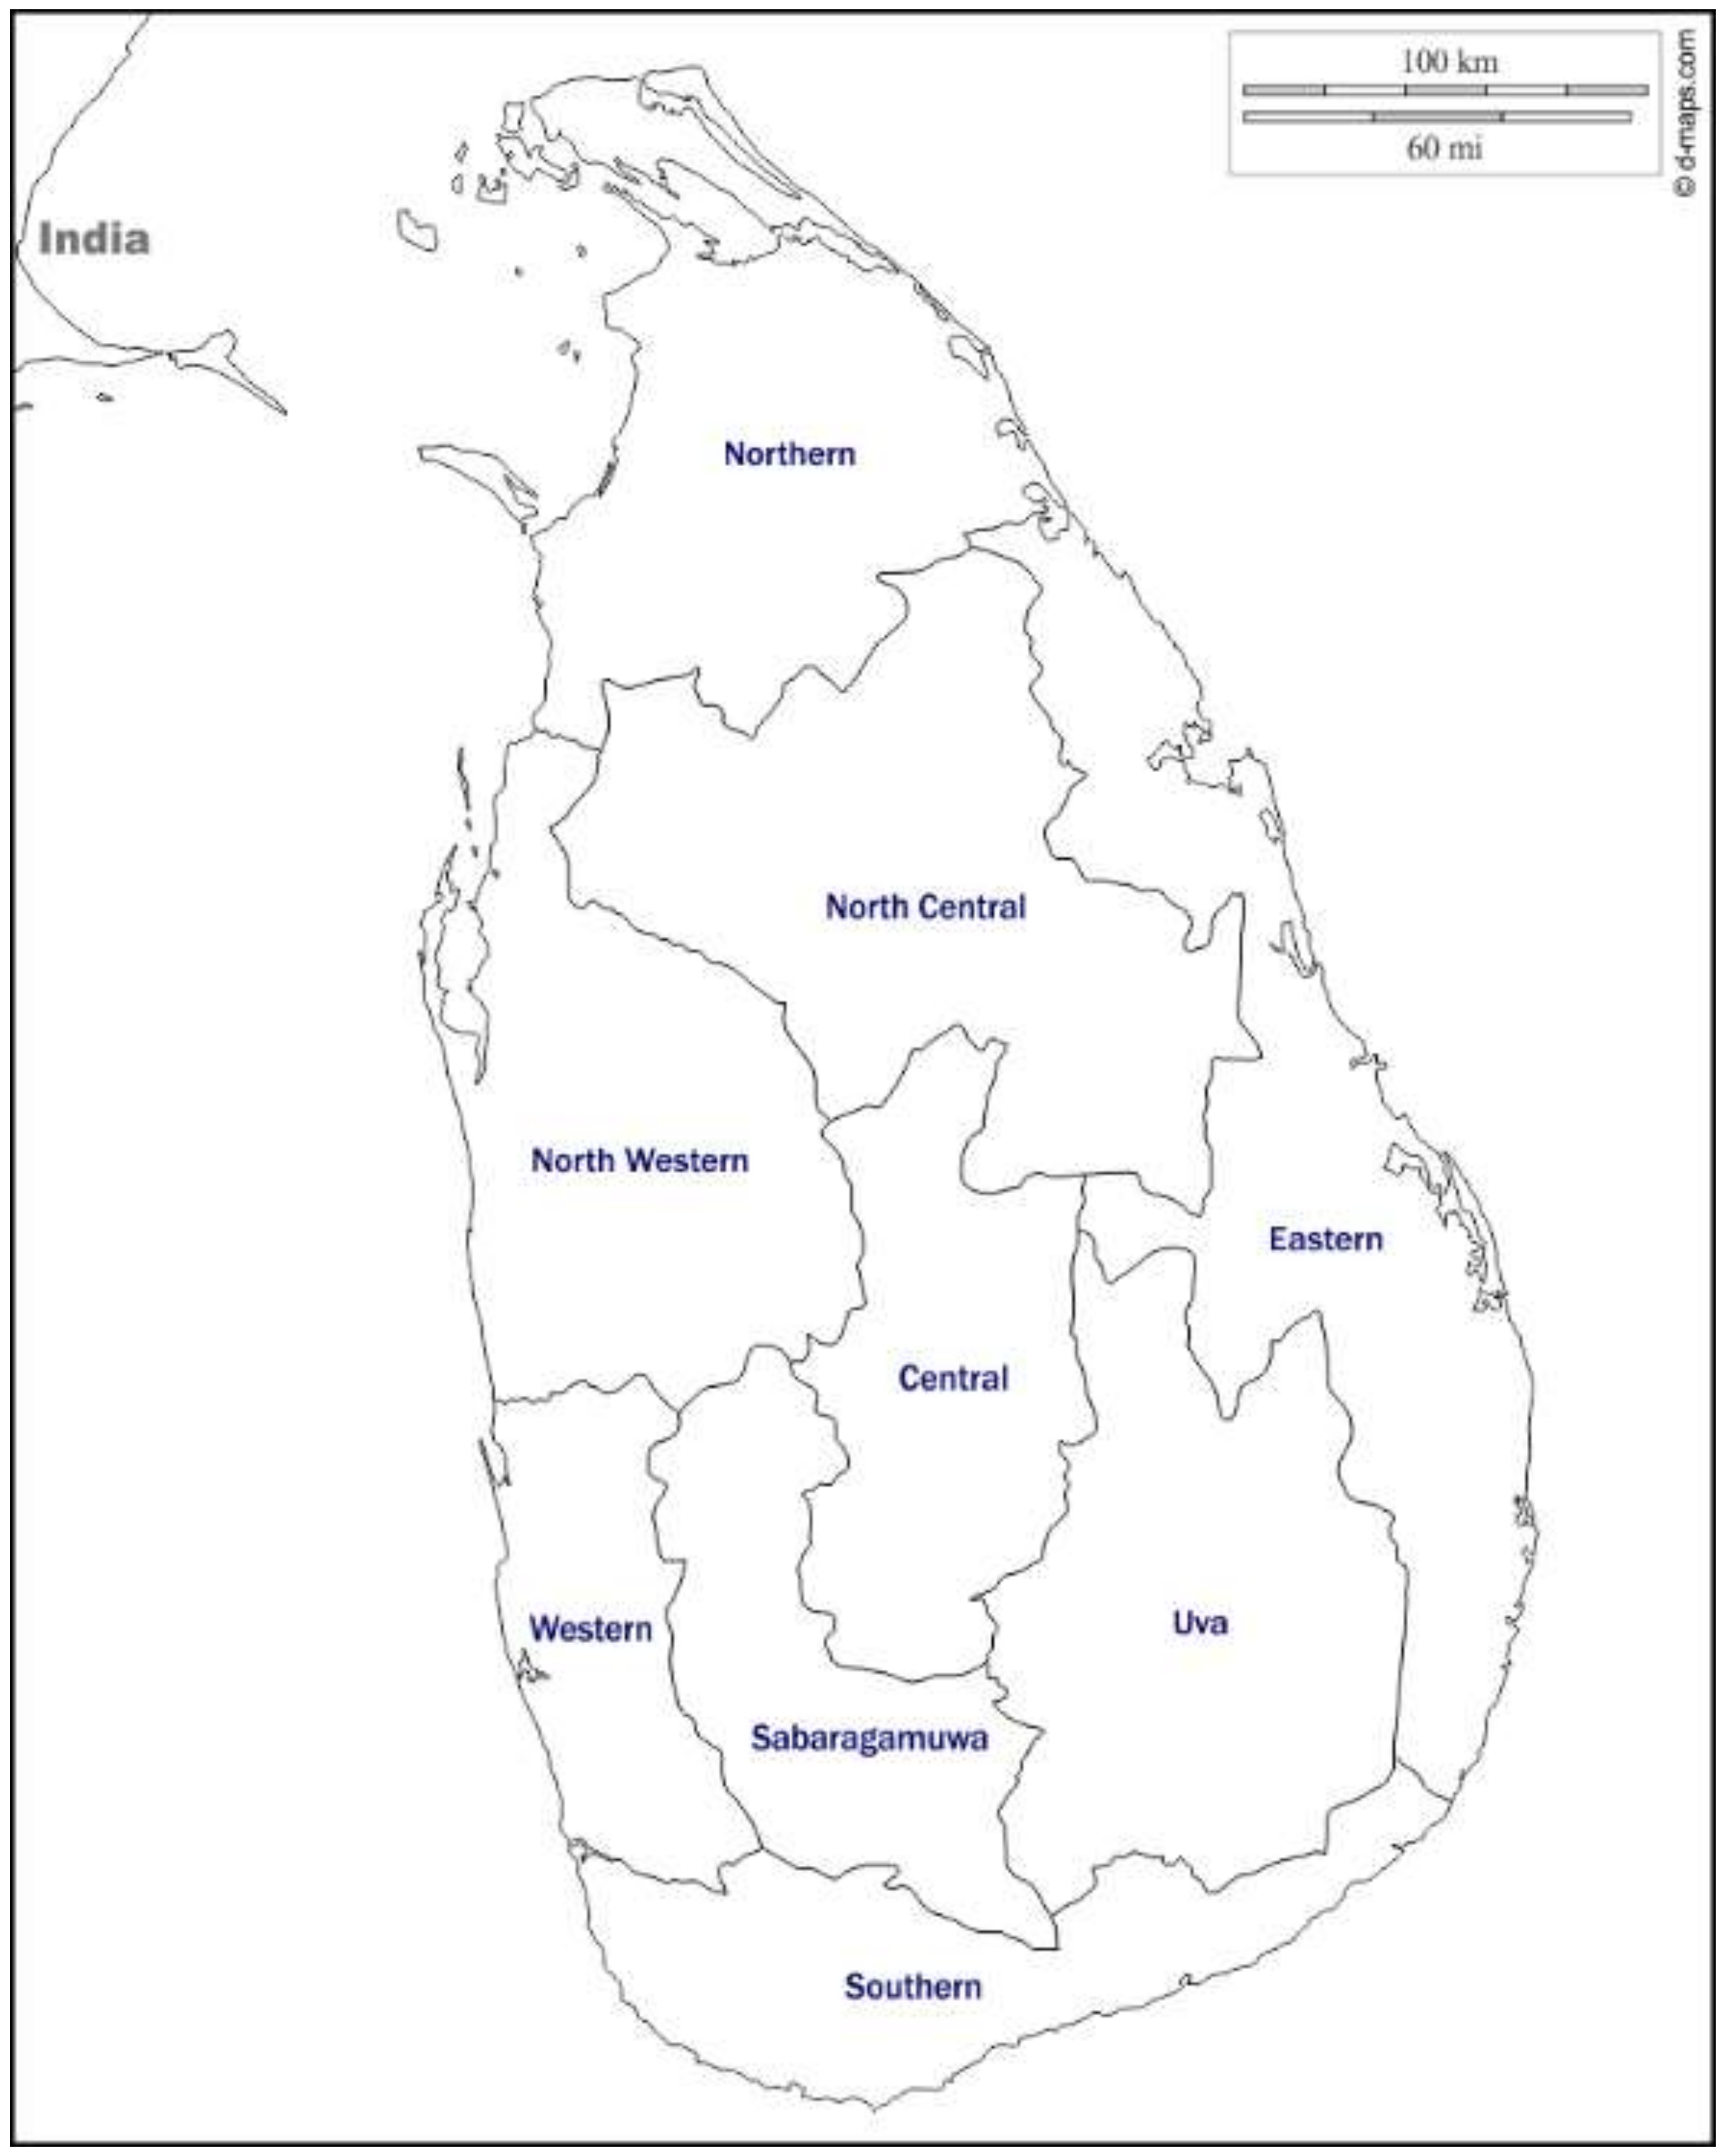
| Province | Median Iodine Content in Salt (IQR; mg/kg) | Adequately Iodised HHIS (%) | Median UIC (IQR) (µg/dL) | |||||||
|---|---|---|---|---|---|---|---|---|---|---|
| 2005 1 | 2010 2 | 2016 3 | 2005 4 | 2010 5 | 2016 6 | 2000 7 | 2005 8 | 2010 9 | 2016 10 | |
| Western | 28.5 (22.3–37.9) | 21.2 (13.2–27.5) | 19.0 (14.8–25.4) | 96.1 | 70.0 | 71.6 | 151.4 (92.8–238.1) | 142.2 (96.7–197.7) | 168.4 (11.7–231.5) | 233.1 (166.7–313.3) |
| Southern | 32.7 (23.2–41.7) | 21.2 (11.6–27.5) | 21.2 (13.8–25.4) | 94.4 | 66.7 | 70.2 | 122.4 (74.2–178.9) | 111.0 (69.9–189.5) | 123.3 (74.3–203.0) | 201.3 (121.5–289.9) |
| Central | 27.5 (20.6–34.9) | 22.2 (14.8–27.5) | 27.5 (21.2–34.9) | 97.4 | 74.0 | 91.0 | 96.2 (61.6–149.1) | 144.7 (83.8–211.9) | 168.2 (104.1–247.4) | 220.7 (168.3–286.4) |
| Northern | 19.0 (14.8–26.9) | 14.8 (7.4–23.3) | 22.2 (18.0–26.5) | 74.3 | 48.3 | 83.6 | 139.5 (74.1–247.4) | 283.4 (182.8–403.1) | 203.8 (124.6–292.1) | 297.3 (230.4–355.4) |
| Eastern | 29.0 (21.6–45.9) | 23.3 (16.9–28.6) | 23.3 (20.1–26.5) | 90.6 | 78.5 | 91.2 | 231.3 (152.9–328.3) | 160.4 (94.5–250.9) | 173.2 (110.9–241.7) | 233.8 (159.5–323.5) |
| North Western | 28.0 (22.7–35.8) | 19.0 (9.4–25.4) | 19.3 (12.7–24.3) | 93.6 | 60.6 | 68.1 | 122.5 (76.6–190.9) | 152.8 (98.7–221.3) | 151.7 (93.4–228.1) | 229.4 (155.9–318.6) |
| North Central | 28.6 (20.4–40.7) | 21.2 (12.7–27.5) | 18.0 (12.2–24.3) | 90.1 | 67.7 | 64.1 | 135.9 (76.9–204.9) | 229.9 (135.2–332.0) | 237.9 (164.6–328.7) | 278.0 (186.3–327.2) |
| Uva | 28.5 (23.8–30.1) | 23.3 (13.8–28.6) | 21.2 (16.9–25.4) | 94.6 | 72.9 | 81.5 | 181.1 (106.0–320.1) | 108.5 (68.4–186.4) | 129.3 (78.9–198.1) | 178.8 (126.5–259.1) |
| Sabaragamuwa | 32.0 (22.7–41.2) | 22.2 (12.7–29.6) | 22.2 (18.0–27.5) | 92.4 | 70.7 | 82.0 | 194.4 (117.6–304.0) | 109.0 (69.3–205.8) | 121.1 (69.7–187.0) | 217.5 (148.7–305.0) |
| Sri Lanka | 28.0 (20.6–38.6) | 21.2 (11.6–27.5) | 21.2 (15.9–26.5) | 91.4 | 67.6 | 78.0 | 145.3 (84.6–240.4) | 154.4 (90.3–252.6) | 163.5 (99.1–245.1) | 232.5 (159.3–315.8) |
| Province | No | Median (IQR) µg/L |
|---|---|---|
| Western | 67 | 15.6 (4.1–29.1) |
| Southern | 70 | 19.1 (15.3–29.9) |
| Central | 68 | 18.0 (5.7–44.6) |
| Northern | 78 | 53.4 (28.9–79.4) |
| Eastern | 189 | 33.3 (17.0–69.6) |
| North Western | 122 | 39.9 (9.4–61.4) |
| North Central | 170 | 75.5 (48.4–102.5) |
| Uva | 62 | 8.3 (4.6–50.4) |
| Sabaragamuwa | 108 | 31.3 (15.1–50.4) |
| Sri Lanka | 934 | 33.4 (12.3–66.8) |
© 2020 by the authors. Licensee MDPI, Basel, Switzerland. This article is an open access article distributed under the terms and conditions of the Creative Commons Attribution (CC BY) license (http://creativecommons.org/licenses/by/4.0/).
Share and Cite
Jayatissa, R.; Gorstein, J.; Okosieme, O.E.; Lazarus, J.H.; Premawardhana, L.D. Stable Iodine Nutrition During Two Decades of Continuous Universal Salt Iodisation in Sri Lanka. Nutrients 2020, 12, 1109. https://0-doi-org.brum.beds.ac.uk/10.3390/nu12041109
Jayatissa R, Gorstein J, Okosieme OE, Lazarus JH, Premawardhana LD. Stable Iodine Nutrition During Two Decades of Continuous Universal Salt Iodisation in Sri Lanka. Nutrients. 2020; 12(4):1109. https://0-doi-org.brum.beds.ac.uk/10.3390/nu12041109
Chicago/Turabian StyleJayatissa, Renuka, Jonathan Gorstein, Onyebuchi E. Okosieme, John H. Lazarus, and Lakdasa D. Premawardhana. 2020. "Stable Iodine Nutrition During Two Decades of Continuous Universal Salt Iodisation in Sri Lanka" Nutrients 12, no. 4: 1109. https://0-doi-org.brum.beds.ac.uk/10.3390/nu12041109