Interplay of Dietary Fatty Acids and Cholesterol Impacts Brain Mitochondria and Insulin Action

 and
and 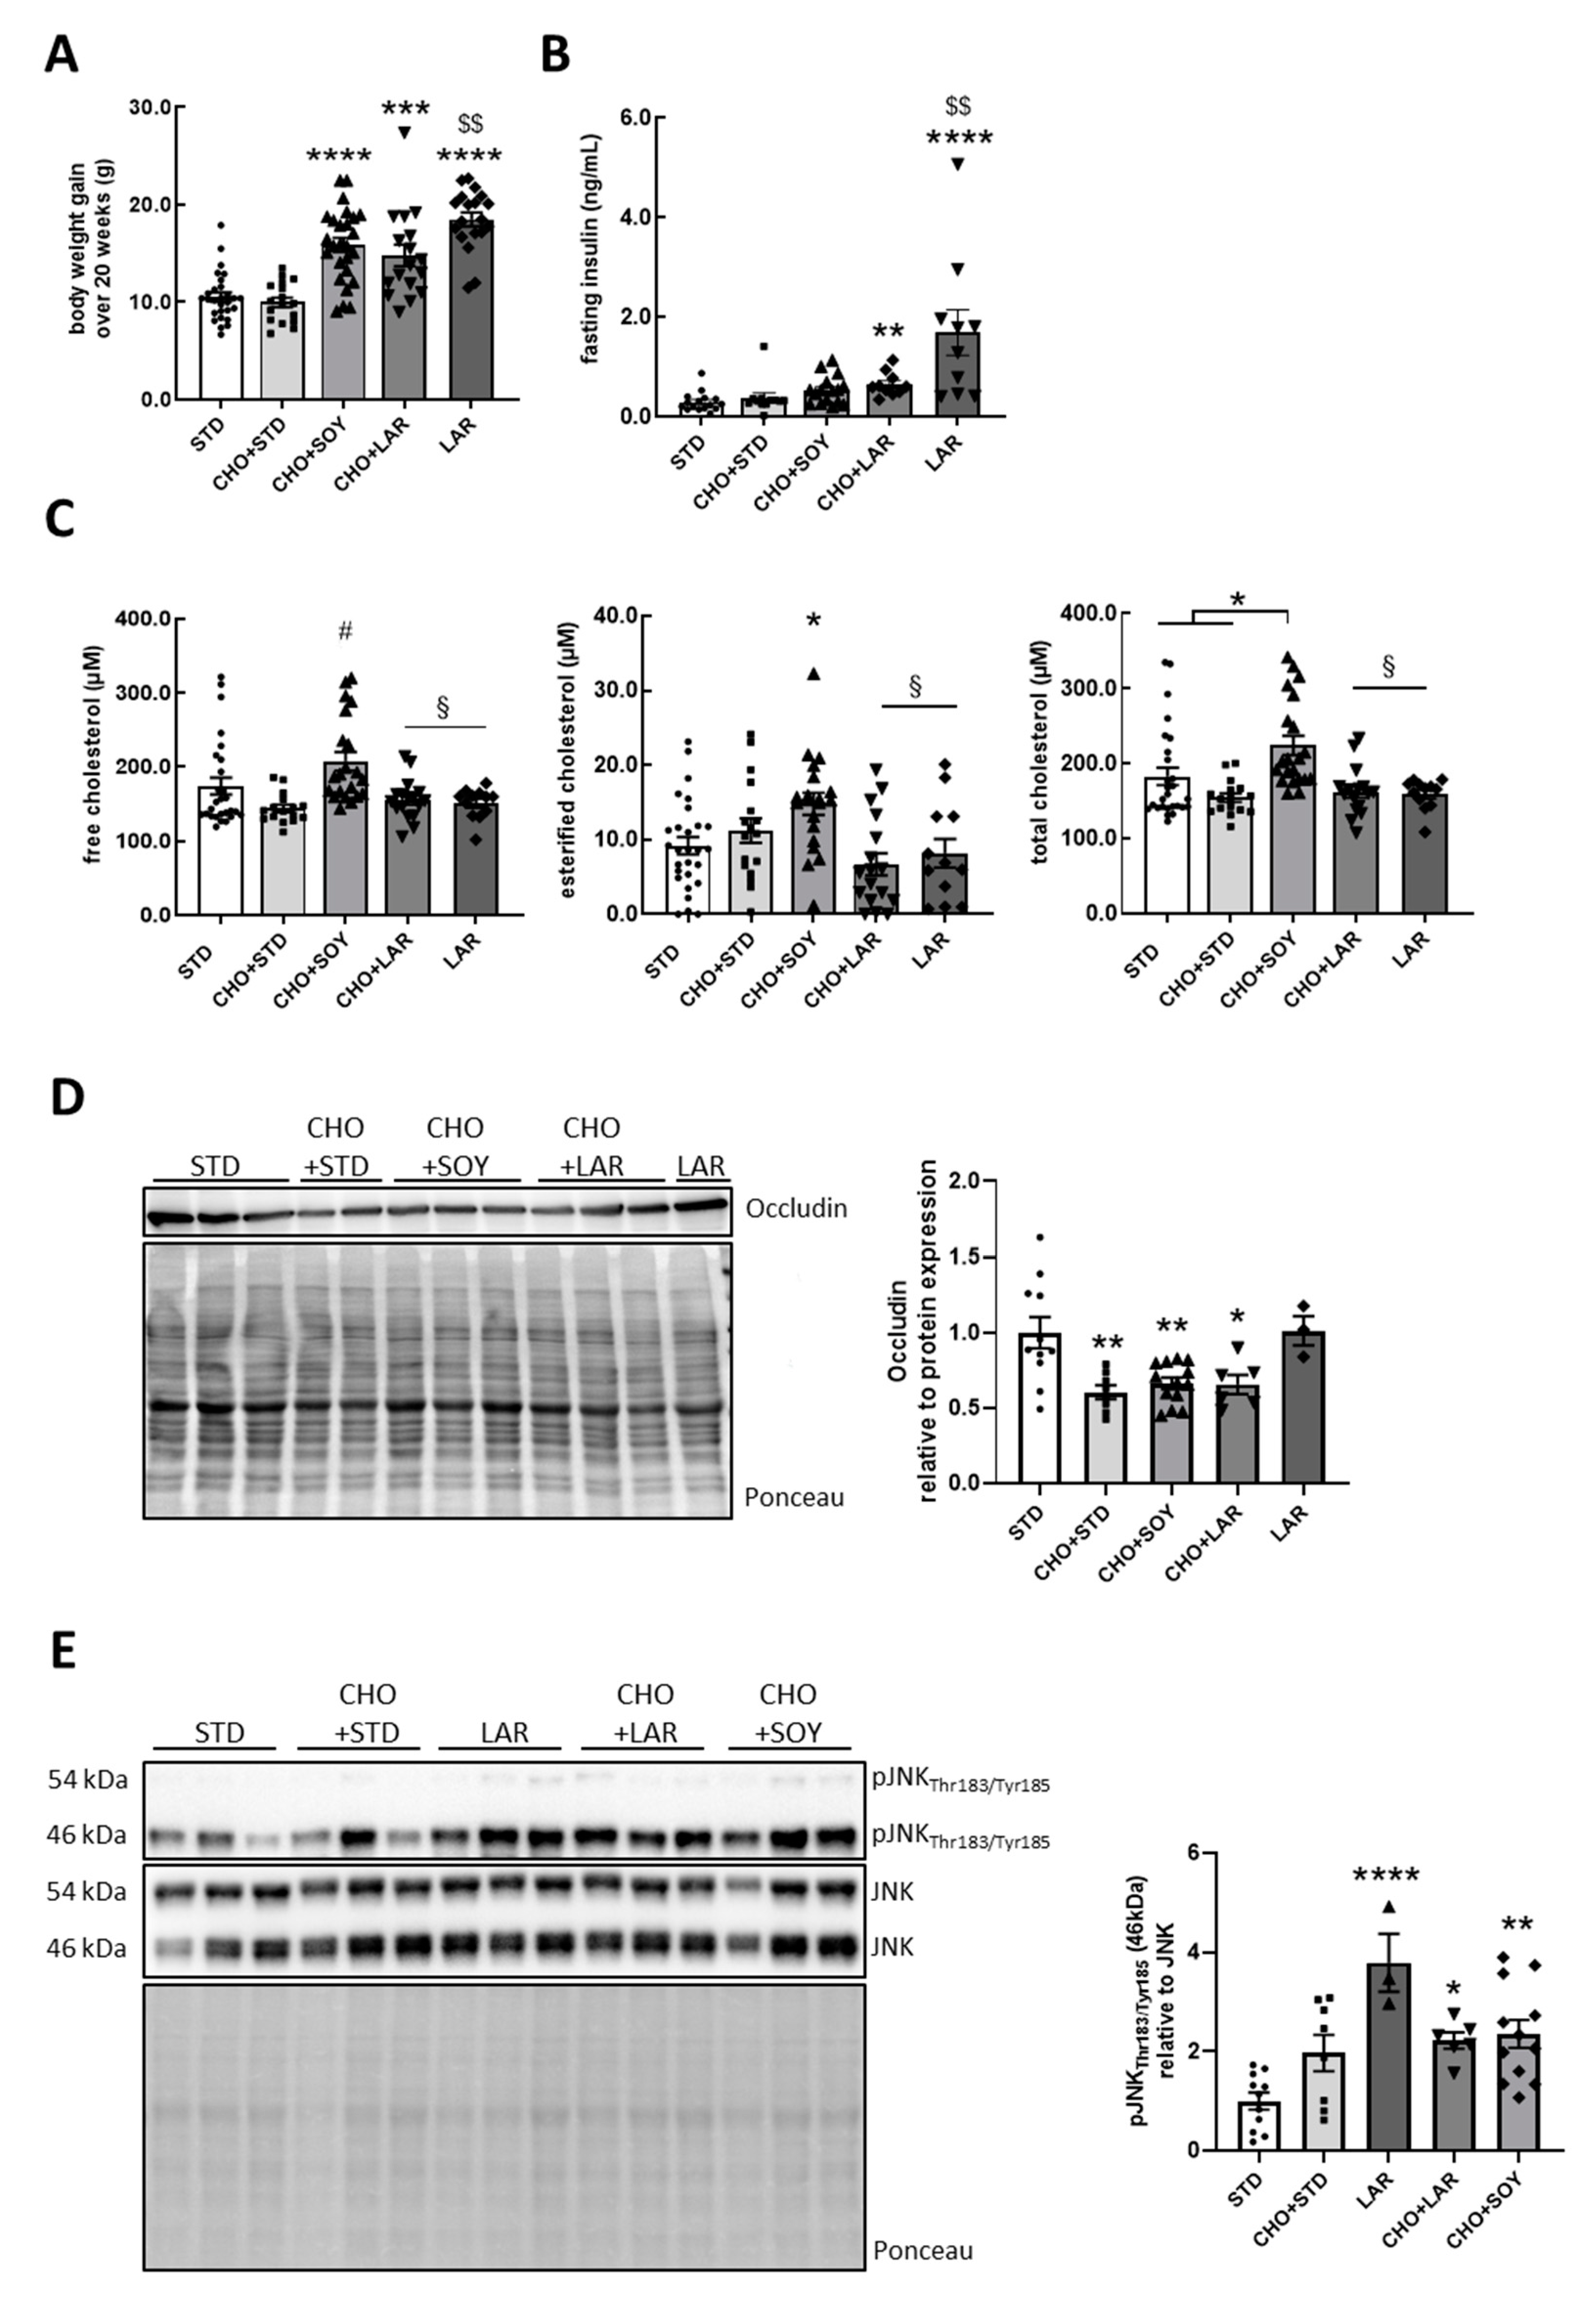
Abstract
:1. Introduction
2. Materials and Methods
2.1. Animals and Experimental Design
2.2. In Vitro Stimulations
2.3. Ex Vivo Stimulations
2.4. Serum Analysis
2.5. Cholesterol Assay
2.6. Western Blot and Protein Carbonylation Assay
2.7. Gene Expression Analysis
2.8. Genomic DNA Isolation
2.9. Mitochondrial Respiration
2.10. Statistical Analysis
3. Results
3.1. Cholesterol/PUFA Diet Increases Both Cholesterol and Metabolic Stress in the Brain
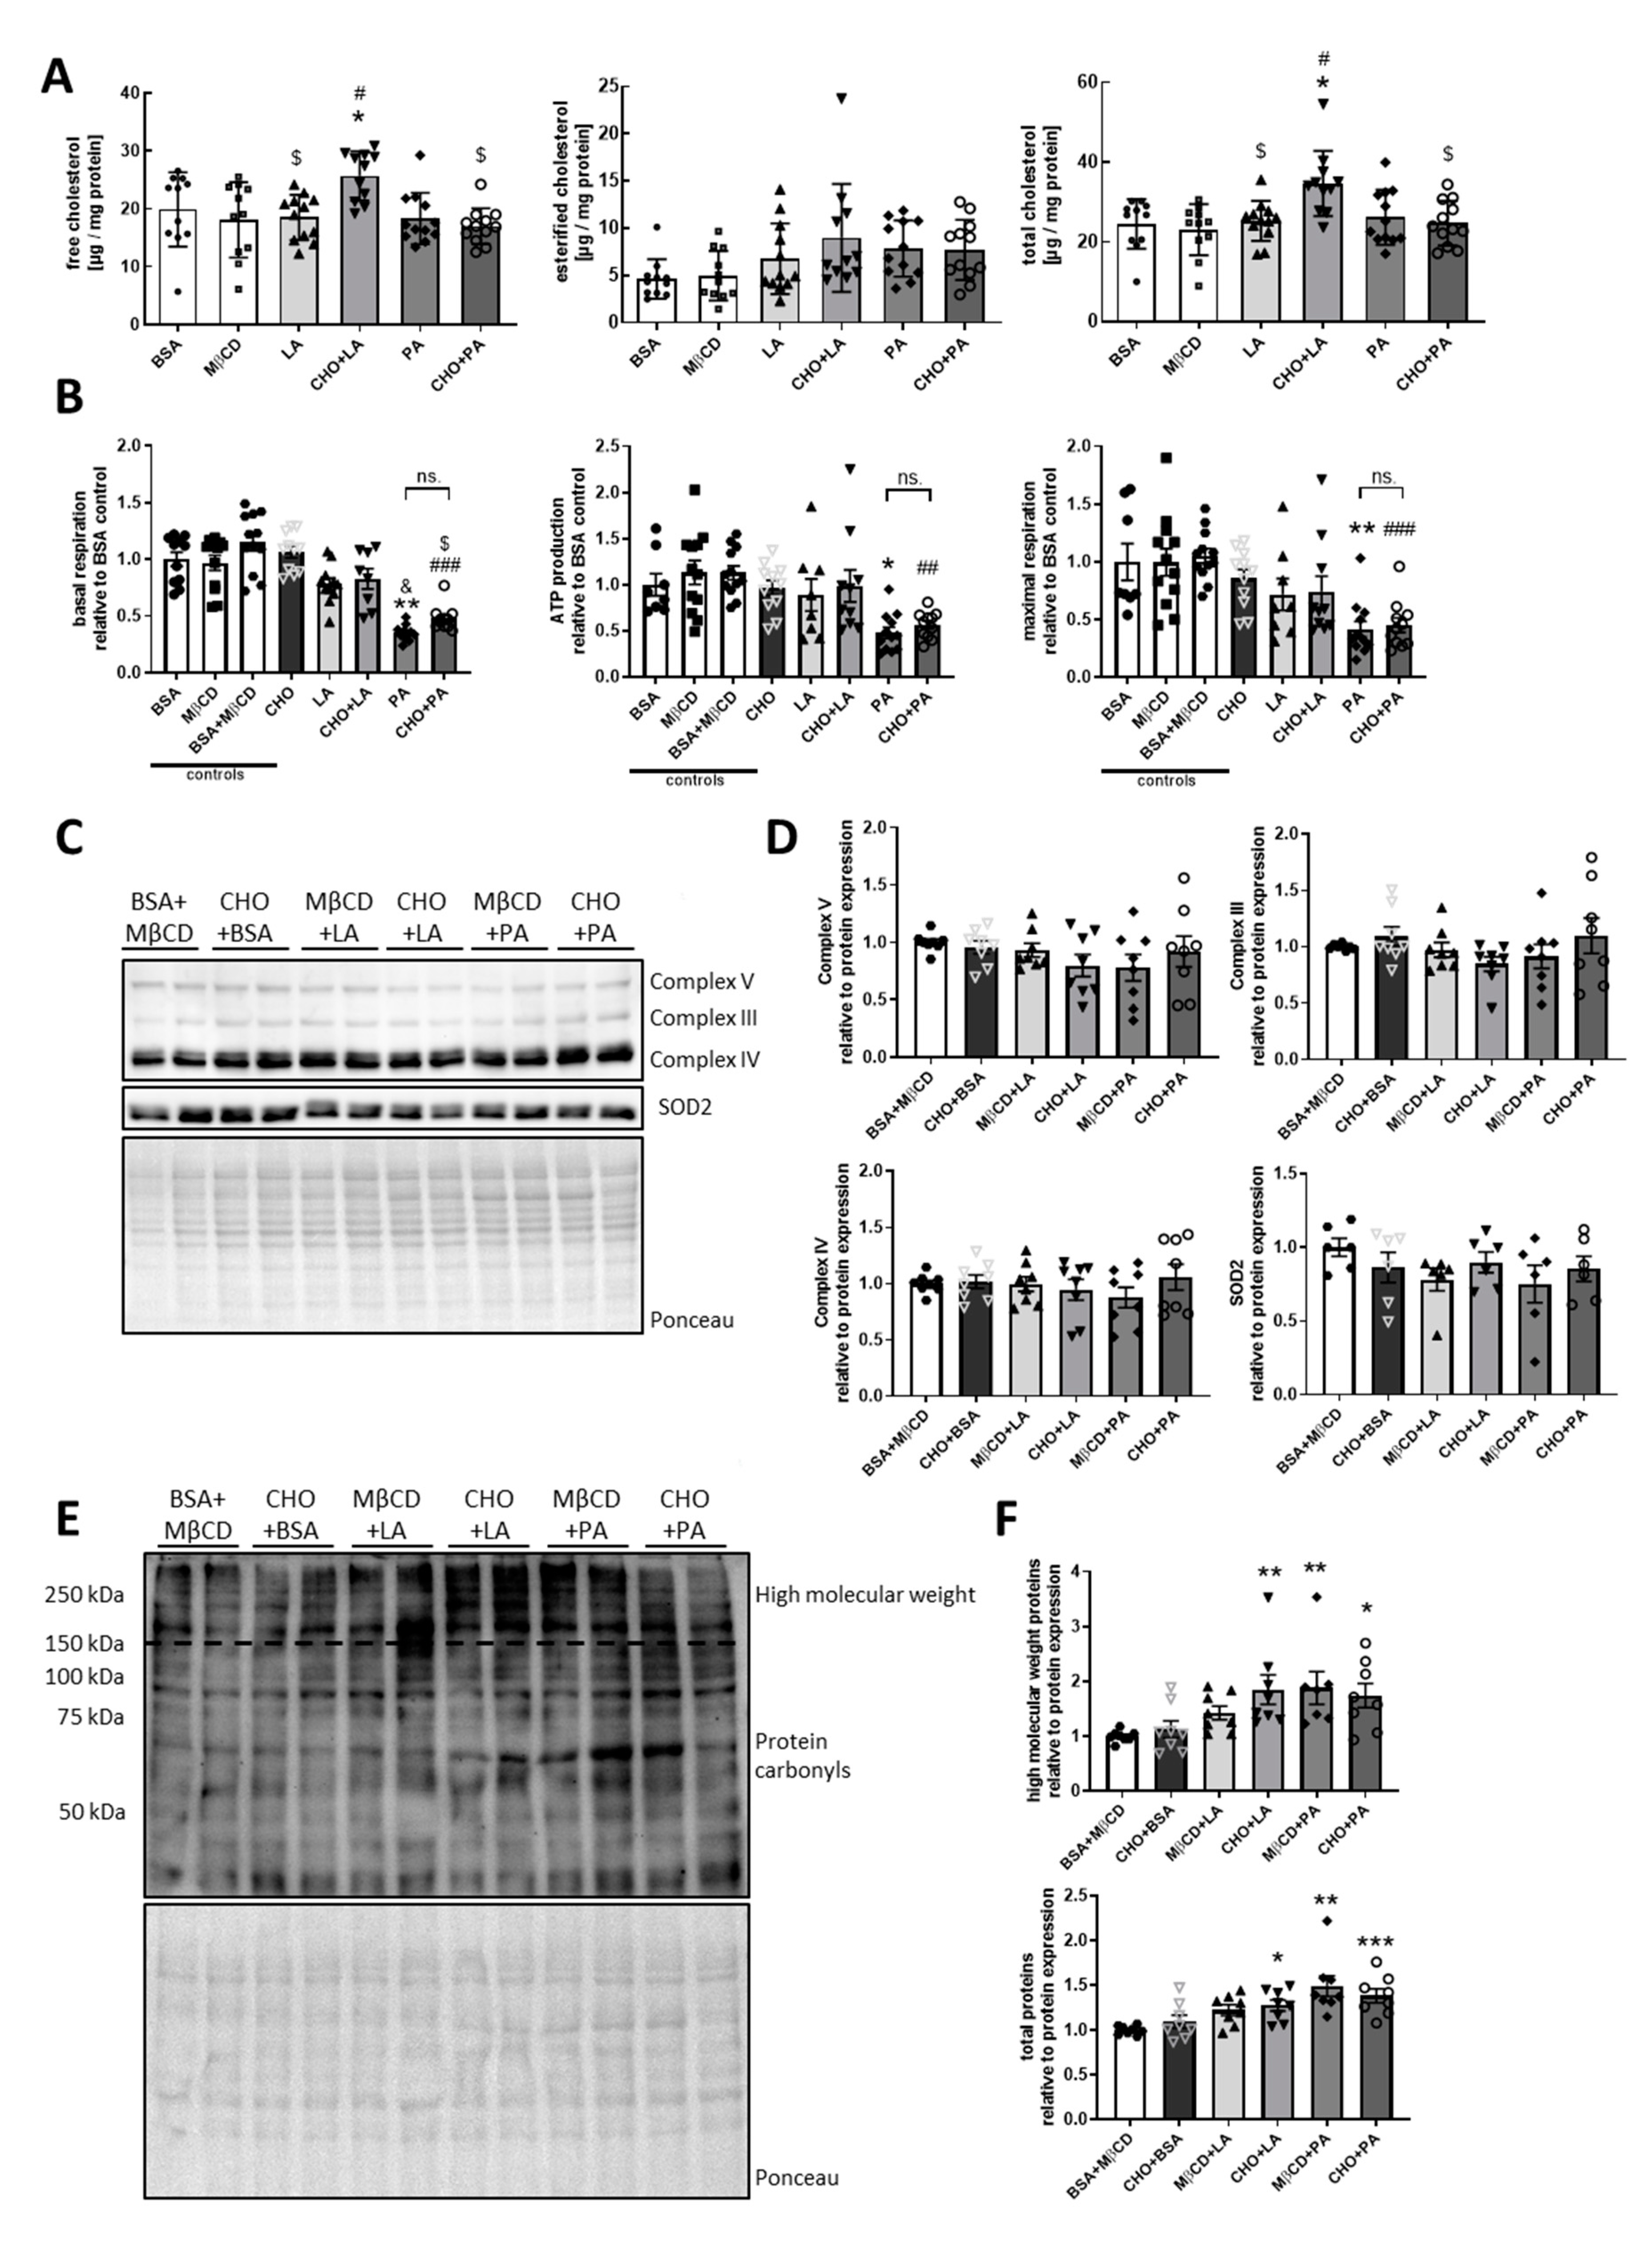
3.2. Specific Alterations of Mitochondrial Protein Expression Due to Cholesterol-Containing Diets
3.3. Palmitate but not Cholesterol or Linoleate Decreases Mitochondrial Function
3.4. Palmitate, but not Cholesterol or Linoleic Acid, Induces Insulin and IGF-1 Resistance with Increased Inflammation in Hypothalamic Neurons
3.5. Palmitate- and Palmitate/Cholesterol-Induced Insulin Resistance is Independent of JNK Activation
3.6. Only Palmitate Induces Insulin Resistance on Hypothalamic Brain Slices
4. Discussion
4.1. Impact of Cholesterol on Brain Insulin Resistance and Mitochondrial Function
4.2. Impact of Fatty Acids on Brain Insulin Resistance
4.3. Interplay of Cholesterol and Fatty Acids in the Brain and the Periphery
Supplementary Materials
Author Contributions
Funding
Acknowledgments
Conflicts of Interest
References
- Fabbrini, E.; Sullivan, S.; Klein, S. Obesity and nonalcoholic fatty liver disease: Biochemical, metabolic, and clinical implications. Hepatology 2010, 51, 679–689. [Google Scholar] [CrossRef]
- Kleinert, M.; Clemmensen, C.; Hofmann, S.M.; Moore, M.C.; Renner, S.; Woods, S.C.; Huypens, P.; Beckers, J.; de Angelis, M.H.; Schürmann, A.; et al. Animal models of obesity and diabetes mellitus. Nat. Rev. Endocrinol. 2018, 14, 140–162. [Google Scholar] [CrossRef] [Green Version]
- Steenhuis, I.; Poelman, M. Portion Size: Latest Developments and Interventions. Curr. Obes. Rep. 2017, 6, 10–17. [Google Scholar] [CrossRef] [Green Version]
- Pinel, A.; Pitois, E.; Rigaudiere, J.-P.; Jouve, C.; de Saint-Vincent, S.; Laillet, B.; Montaurier, C.; Huertas, A.; Morio, B.; Capel, F. EPA prevents fat mass expansion and metabolic disturbances in mice fed with a Western diet. J. Lipid Res. 2016, 57, 1382–1397. [Google Scholar] [CrossRef] [Green Version]
- Henkel, J.; Alfine, E.; Saín, J.; Jöhrens, K.; Weber, D.; Castro, J.P.; König, J.; Stuhlmann, C.; Vahrenbrink, M.; Jonas, W.; et al. Soybean Oil-Derived Poly-Unsaturated Fatty Acids Enhance Liver Damage in Nafld Induced by Dietary Cholesterol. Nutrients 2018, 10, 1326. [Google Scholar] [CrossRef] [Green Version]
- Wardelmann, K.; Blümel, S.; Rath, M.; Alfine, E.; Chudoba, C.; Schell, M.; Cai, W.; Hauffe, R.; Warnke, K.; Flore, T.; et al. Insulin action in the brain regulates mitochondrial stress responses and reduces diet-induced weight gain. Mol. Metab. 2019, 21, 68–81. [Google Scholar] [CrossRef]
- Mayer, C.M.; Belsham, D.D. Palmitate Attenuates Insulin Signaling and Induces Endoplasmic Reticulum Stress and Apoptosis in Hypothalamic Neurons: Rescue of Resistance and Apoptosis through Adenosine 5? Monophosphate-Activated Protein Kinase Activation. Endocrinology 2010, 151, 576–585. [Google Scholar] [CrossRef] [PubMed]
- Posey, K.A.; Clegg, D.J.; Printz, R.L.; Byun, J.; Morton, G.J.; Vivekanandan-Giri, A.; Pennathur, S.; Baskin, D.G.; Heinecke, J.W.; Woods, S.C.; et al. Hypothalamic proinflammatory lipid accumulation, inflammation, and insulin resistance in rats fed a high-fat diet. Am. J. Physiol. Metab. 2008, 296, 1003–1012. [Google Scholar] [CrossRef] [PubMed]
- Benoit, S.C.; Kemp, C.J.; Elias, C.F.; Abplanalp, W.; Herman, J.P.; Migrenne, S.; Lefevre, A.-L.; Cruciani-Guglielmacci, C.; Magnan, C.; Yu, F.; et al. Palmitic acid mediates hypothalamic insulin resistance by altering PKC-theta subcellular localization in rodents. J. Clin. Investig. 2009, 119, 2577–2589. [Google Scholar] [CrossRef] [PubMed] [Green Version]
- Boucher, J.; Kleinridders, A.; Kahn, C.R. Insulin Receptor Signaling in Normal and Insulin-Resistant States. Cold Spring Harb. Perspect. Boil. 2014, 6, a009191. [Google Scholar] [CrossRef] [PubMed] [Green Version]
- Coll, T.; Eyre, E.; Rodriguez-Calvo, R.; Palomer, X.; Sánchez, R.M.; Merlos, M.; Laguna, J.C.; Vázquez-Carrera, M. Oleate Reverses Palmitate-induced Insulin Resistance and Inflammation in Skeletal Muscle Cells. J. Boil. Chem. 2008, 283, 11107–11116. [Google Scholar] [CrossRef] [PubMed] [Green Version]
- Benzler, M.; Benzler, J.; Stoehr, S.; Hempp, C.; Rizwan, M.Z.; Heyward, P.; Tups, A. “Insulin-like” effects of palmitate compromise insulin signalling in hypothalamic neurons. J. Comp. Physiol. B 2019, 189, 413–424. [Google Scholar] [CrossRef] [PubMed]
- Lang, P.; Hasselwander, S.; Li, H.; Xia, N. Effects of different diets used in diet-induced obesity models on insulin resistance and vascular dysfunction in C57BL/6 mice. Sci. Rep. 2019, 9, 19556–19614. [Google Scholar] [CrossRef] [PubMed] [Green Version]
- Püschel, G.P.; Henkel, J. Dietary cholesterol does not break your heart but kills your liver. Porto Biomed. J. 2018, 3, e12. [Google Scholar] [CrossRef] [PubMed]
- Martín-Segura, A.; Ahmed, T.; Casadomé-Perales, Á.; Palomares-Perez, I.; Palomer, E.; Kerstens, A.; Munck, S.; Balschun, D.; Dotti, C.G. Age-associated cholesterol reduction triggers brain insulin resistance by facilitating ligand-independent receptor activation and pathway desensitization. Aging Cell 2019, 18, e12932. [Google Scholar] [CrossRef] [PubMed]
- Freeman, L.R.; E Granholm, A.-C. Vascular Changes in Rat Hippocampus following a High Saturated Fat and Cholesterol Diet. Br. J. Pharmacol. 2011, 32, 643–653. [Google Scholar] [CrossRef] [PubMed] [Green Version]
- Hsu, T.M.; Kanoski, S.E. Blood-brain barrier disruption: Mechanistic links between Western diet consumption and dementia. Front. Aging Neurosci. 2014, 6, 88. [Google Scholar] [CrossRef] [Green Version]
- Ziolkowski, W.; Szkatuła, M.; Nurczyk, A.; Wakabayashi, T.; Kaczor, J.J.; Olek, R.A.; Knap, N.; Antosiewicz, J.; Wieckowski, M.R.; Woźniak, M. Methyl-beta-cyclodextrin induces mitochondrial cholesterol depletion and alters the mitochondrial structure and bioenergetics. FEBS Lett. 2010, 584, 4606–4610. [Google Scholar] [CrossRef] [Green Version]
- Yu, W.; Gong, J.-S.; Ko, M.; Garver, W.S.; Yanagisawa, K.; Michikawa, M. Altered Cholesterol Metabolism in Niemann-Pick Type C1 Mouse Brains Affects Mitochondrial Function. J. Boil. Chem. 2005, 280, 11731–11739. [Google Scholar] [CrossRef] [Green Version]
- Fernandez, A.; Llacuna, L.; Fernándezcheca, J.C.; Colell, A. Mitochondrial cholesterol loading exacerbates amyloid beta peptide-induced inflammation and neurotoxicity. J. Neurosci. 2009, 29, 6394–6405. [Google Scholar] [CrossRef] [Green Version]
- Suzuki, R.; Lee, K.; Jing, E.; Biddinger, S.B.; McDonald, J.G.; Montine, T.J.; Craft, S.; Kahn, C.R. Diabetes and Insulin in Regulation of Brain Cholesterol Metabolism. Cell Metab. 2010, 12, 567–579. [Google Scholar] [CrossRef] [PubMed] [Green Version]
- Fukui, K.; Ferris, H.A.; Kahn, C.R. Effect of Cholesterol Reduction on Receptor Signaling in Neurons. J. Boil. Chem. 2015, 290, 26383–26392. [Google Scholar] [CrossRef] [PubMed] [Green Version]
- Kleinridders, A.; Lauritzen, H.P.; Ussar, S.; Christensen, J.H.; Mori, M.A.; Bross, P.; Kahn, C.R. Leptin regulation of Hsp60 impacts hypothalamic insulin signaling. J. Clin. Investig. 2013, 123, 4667–4680. [Google Scholar] [CrossRef] [PubMed] [Green Version]
- Linn, T.; Noke, M.; Woehrle, M.; Kloer, H.U.; Hammes, H.P.; Litzlbauer, D.; Bretzel, R.G.; Federlin, K. Fish oil-enriched diet and reduction of low-dose streptozocin-induced hyperglycemia. Inhibition of macrophage activation. Diabetes 1989, 38, 1402–1411. [Google Scholar] [CrossRef]
- Simopoulos, A.P. An increase in the omega-6/omega-3 fatty acid ratio increases the risk for obesity. Nutrients 2016, 8, 128. [Google Scholar] [CrossRef] [Green Version]
- Henkel, J.; Coleman, C.D.; Schraplau, A.; Jöhrens, K.; Weber, D.; Castro, J.P.; Hugo, M.; Schulz, T.; Krämer, S.; Schürmann, A.; et al. Induction of Steatohepatitis (NASH) with Insulin Resistance in Wild-type B6 Mice by a Western-type Diet Containing Soybean Oil and Cholesterol. Mol. Med. 2017, 23, 70–82. [Google Scholar] [CrossRef]
- Listenberger, L.L.; Ory, D.S.; Schaffer, J.E. Palmitate-induced Apoptosis Can Occur through a Ceramide-independent Pathway. J. Boil. Chem. 2001, 276, 14890–14895. [Google Scholar] [CrossRef] [Green Version]
- Mielke, J.G.; Taghibiglou, C.; Liu, L.; Zhang, Y.; Jia, Z.; Adeli, K.; Wang, Y.T. A biochemical and functional characterization of diet-induced brain insulin resistance. J. Neurochem. 2005, 93, 1568–1578. [Google Scholar] [CrossRef]
- Baylin, A.; Kim, M.K.; Donovan-Palmer, A.; Siles, X.; Dougherty, L.; Tocco, P.; Campos, H. Fasting Whole Blood as a Biomarker of Essential Fatty Acid Intake in Epidemiologic Studies: Comparison with Adipose Tissue and Plasma. Am. J. Epidemiol. 2005, 162, 373–381. [Google Scholar] [CrossRef] [Green Version]
- A Kaluzny, M.; Duncan, L.; Merritt, M.V.; Epps, D. Rapid separation of lipid classes in high yield and purity using bonded phase columns. J. Lipid Res. 1985, 26, 135–140. [Google Scholar]
- Metges, C.C.; Lehmann, L.; Boeuf, S.; Jetzke, K.J.; Müller, A.; Rickert, R.; Franke, W.; Steinhart, H.; Nürnberg, G.; Klaus, S. Cis-9, trans-11 and trans-10, cis-12 Cla affect lipid metabolism differently in primary white and brown adipocytes of djungarian hamsters. Lipids 2003, 38, 1133–1142. [Google Scholar] [CrossRef] [PubMed]
- Gohlke, S.; Zagoriy, V.; Inostroza, A.C.; Méret, M.; Mancini, C.; Japtok, L.; Schumacher, F.; Kuhlow, R.; Graja, A.; Stephanowitz, H.; et al. Identification of functional lipid metabolism biomarkers of brown adipose tissue aging. Mol. Metab. 2019, 24, 1–17. [Google Scholar] [CrossRef] [PubMed]
- Castro, J.P.; Ott, C.; Jung, T.; Grune, T.; Almeida, H. Carbonylation of the cytoskeletal protein actin leads to aggregate formation. Free. Radic. Boil. Med. 2012, 53, 916–925. [Google Scholar] [CrossRef]
- Pitas, R.; Boyles, J.K.; Lee, S.H.; Hui, D.; Weisgraber, K.H. Lipoproteins and their receptors in the central nervous system. Characterization of the lipoproteins in cerebrospinal fluid and identification of apolipoprotein B,E(LDL) receptors in the brain. J. Boil. Chem. 1987, 262, 14352–14360. [Google Scholar]
- Kleiner, S.; Mepani, R.J.; Laznik, D.; Ye, L.; Jurczak, M.J.; Jornayvaz, F.R.; Estall, J.L.; Bhowmick, D.C.; Shulman, G.I.; Spiegelman, B.M. Development of insulin resistance in mice lacking PGC-1α in adipose tissues. Proc. Natl. Acad. Sci. USA 2012, 109, 9635–9640. [Google Scholar] [CrossRef] [PubMed] [Green Version]
- Lantier, L.; Williams, A.S.; Williams, I.M.; Yang, K.K.; Bracy, D.P.; Goelzer, M.; James, F.D.; Gius, D.; Wasserman, D.H. Sirt3 Is Crucial for Maintaining Skeletal Muscle Insulin Action and Protects Against Severe Insulin Resistance in High-Fat–Fed Mice. Diabetes 2015, 64, 3081–3092. [Google Scholar] [CrossRef] [PubMed] [Green Version]
- Castro, J.P.; Wardelmann, K.; Grune, T.; Kleinridders, A. Mitochondrial Chaperones in the Brain: Safeguarding Brain Health and Metabolism? Front. Endocrinol. 2018, 9. [Google Scholar] [CrossRef] [Green Version]
- Christian, A.; Haynes, M.P.; Phillips, M.C.; Rothblat, G.H. Use of cyclodextrins for manipulating cellular cholesterol content. J. Lipid Res. 1997, 38, 2264–2272. [Google Scholar]
- Widenmaier, S.; Snyder, N.A.; Nguyen, T.B.; Arduini, A.; Lee, G.Y.; Arruda, A.P.; Saksi, J.; Bartelt, A.; Hotamisligil, G.S. Nrf1 Is an ER Membrane Sensor that Is Central to Cholesterol Homeostasis. Cell 2017, 171, 1094–1109.e15. [Google Scholar] [CrossRef]
- Kleinridders, A. Deciphering Brain Insulin Receptor and Insulin-Like Growth Factor 1 Receptor Signalling. J. Neuroendocr. 2016, 28. [Google Scholar] [CrossRef]
- Knudsen, L.; Hansen, B.F.; Jensen, P.; Pedersen, T.A.; Vestergaard, K.; Schäffer, L.; Blagoev, B.; Oleksiewicz, M.B.; Kiselyov, V.V.; de Meyts, P. Agonism and Antagonism at the Insulin Receptor. PLoS ONE 2012, 7, e51972. [Google Scholar] [CrossRef] [PubMed]
- Schäffer, L.; Brand, C.L.; Hansen, B.F.; Ribel, U.; Shaw, A.C.; Slaaby, R.; Sturis, J. A novel high-affinity peptide antagonist to the insulin receptor. Biochem. Biophys. Res. Commun. 2008, 376, 380–383. [Google Scholar] [CrossRef] [PubMed]
- Ballabh, P.; Braun, A.; Nedergaard, M. The blood-brain barrier: An overview: Structure, regulation, and clinical implications. Neurobiol. Dis. 2004, 16, 1–13. [Google Scholar] [CrossRef] [PubMed]
- Dietschy, J.M.; Turley, S.D. Cholesterol metabolism in the brain. Curr. Opin. Lipidol. 2001, 12, 105–112. [Google Scholar] [CrossRef] [PubMed]
- Dietschy, J.M.; Turley, S.D. Thematic review series: Brain Lipids.Cholesterol metabolism in the central nervous system during early development and in the mature animal. J. Lipid Res. 2004, 45, 1375–1397. [Google Scholar] [CrossRef] [Green Version]
- Kim, S.Y.; Buckwalter, M.S.; Soreq, H.; Vezzani, A.; Kaufer, D. Blood-brain barrier dysfunction-induced inflammatory signaling in brain pathology and epileptogenesis. Epilepsia 2012, 53, 37–44. [Google Scholar] [CrossRef] [Green Version]
- Vance, J.E. Dysregulation of cholesterol balance in the brain: Contribution to neurodegenerative diseases. Dis. Model. Mech. 2012, 5, 746–755. [Google Scholar] [CrossRef] [Green Version]
- De Groot, J.C.; de Leeuw, F.-E.; Oudkerk, M.; Hofman, A.; Jolles, J.; Breteler, M. Cerebral white matter lesions and subjective cognitive dysfunction: The Rotterdam Scan Study. Neurology 2001, 56, 1539–1545. [Google Scholar] [CrossRef] [Green Version]
- Ryu, S.Y.; Coutu, J.-P.; Rosas, H.D.; Salat, D.H. Effects of insulin resistance on white matter microstructure in middle-aged and older adults. Neurology 2014, 82, 1862–1870. [Google Scholar] [CrossRef] [Green Version]
- Kappeler, L.; Filho, C.D.M.; Dupont, J.; Leneuve, P.; Cervera, P.; Perin, L.; Loudes, C.; Blaise, A.; Klein, R.; Epelbaum, J.; et al. Brain igf-1 Receptors Control Mammalian Growth and Lifespan through a Neuroendocrine Mechanism. PLoS Boil. 2008, 6, e254. [Google Scholar] [CrossRef]
- Puche, J.; Muñoz, U.; García-Magariño, M.; Sádaba, M.C.; Castilla-Cortázar, I. Partial igf-1 deficiency induces brain oxidative damage and edema, which are ameliorated by replacement therapy. BioFactors 2016, 42, 60–79. [Google Scholar] [PubMed]
- Aguirre, V.; Uchida, T.; Yenush, L.; Davis, R.; White, M.F. The c-Jun NH(2)-terminal kinase promotes insulin resistance during association with insulin receptor substrate-1 and phosphorylation of Ser(307). J. Boil. Chem. 2000, 275, 9047–9054. [Google Scholar] [CrossRef] [PubMed] [Green Version]
- Belgardt, B.F.; Mauer, J.; Wunderlich, F.T.; Ernst, M.B.; Pal, M.; Spohn, G.; Brönneke, H.S.; Brodesser, S.; Hampel, B.; Schauss, A.C.; et al. Hypothalamic and pituitary c-Jun N-terminal kinase 1 signaling coordinately regulates glucose metabolism. Proc. Natl. Acad. Sci. USA 2010, 107, 6028–6033. [Google Scholar] [CrossRef] [PubMed] [Green Version]
- Dandona, P.; Aljada, A.; Mohanty, P.; Ghanim, H.; Hamouda, W.; Assian, E.; Ahmad, S. Insulin inhibits intranuclear nuclear factor kappab and stimulates ikappab in mononuclear cells in obese subjects: Evidence for an anti-inflammatory effect? J. Clin. Endocrinol. Metab. 2001, 86, 3257–3265. [Google Scholar]
- Dandona, P.; Chaudhuri, A.; Mohanty, P.; Ghanim, H. Anti-inflammatory effects of insulin. Curr. Opin. Clin. Nutr. Metab. Care 2007, 10, 511–517. [Google Scholar] [CrossRef]
- Wang, Z.-H.; Liu, Y.; Chaitankar, V.; Pirooznia, M.; Xu, H. Electron transport chain biogenesis activated by a Jnk-insulin-Myc relay primes mitochondrial inheritance in Drosophila. eLife 2019, 8. [Google Scholar] [CrossRef]
- Copps, K.D.; Hancer, N.J.; Opare-Ado, L.; Qiu, W.; Walsh, C.; White, M.F. Irs1 Serine 307 Promotes Insulin Sensitivity in Mice. Cell Metab. 2010, 11, 84–92. [Google Scholar] [CrossRef] [Green Version]
- Tsaousidou, E.; Paeger, L.; Belgardt, B.F.; Pál, M.; Wunderlich, C.M.; Brönneke, H.; Collienne, U.; Hampel, B.; Wunderlich, F.T.; Schmidt-Supprian, M.; et al. Distinct Roles for Jnk and Ikk Activation in Agouti-Related Peptide Neurons in the Development of Obesity and Insulin Resistance. Cell Rep. 2014, 9, 1495–1506. [Google Scholar] [CrossRef] [Green Version]
- Taha, A.Y. Linoleic acid–good or bad for the brain? NPJ Sci. Food 2020, 4, 1–6. [Google Scholar] [CrossRef] [Green Version]
- Wang, D.D.; Li, Y.; Chiuve, S.E.; Stampfer, M.J.; Manson, J.E.; Rimm, E.B.; Willett, W.C.; Hu, F.B. Association of specific dietary fats with total and cause-specific mortality. JAMA Intern. Med. 2016, 176, 1134–1145. [Google Scholar] [CrossRef]
- Chicco, A.J.; Sparagna, G.C. Role of cardiolipin alterations in mitochondrial dysfunction and disease. Am. J. Physiol. Physiol. 2007, 292, 33–44. [Google Scholar] [CrossRef] [PubMed] [Green Version]
- Dudek, J.; Cheng, I.-F.; Balleininger, M.; Vaz, F.M.; Streckfuss-Bömeke, K.; Hübscher, D.; Vukotic, M.; Wanders, R.; Rehling, P.; Guan, K. Cardiolipin deficiency affects respiratory chain function and organization in an induced pluripotent stem cell model of Barth syndrome. Stem Cell Res. 2013, 11, 806–819. [Google Scholar] [CrossRef] [PubMed] [Green Version]
- Gohil, V.M.; Hayes, P.; Matsuyama, S.; Schägger, H.; Schlame, M.; Greenberg, M.L. Cardiolipin Biosynthesis and Mitochondrial Respiratory Chain Function Are Interdependent. J. Boil. Chem. 2004, 279, 42612–42618. [Google Scholar] [CrossRef] [PubMed] [Green Version]
- Penzo, D.; Tagliapietra, C.; Colonna, R.; Petronilli, V.; Bernardi, P. Effects of fatty acids on mitochondria: Implications for cell death. Biochim. Biophys. Acta Bioenerg. 2002, 1555, 160–165. [Google Scholar] [CrossRef] [Green Version]
- Brandt, T.; Mourier, A.; Tain, L.S.; Partridge, L.; Larsson, N.-G.; Brandt, T. Changes of mitochondrial ultrastructure and function during ageing in mice and Drosophila. eLife 2017, 6. [Google Scholar] [CrossRef]
- Henkel, J.; Buchheim-Dieckow, K.; Castro, J.; Laeger, T.; Wardelmann, K.; Kleinridders, A.; Jöhrens, K.; Püschel, G. Reduced Oxidative Stress and Enhanced Fgf21 Formation in Livers of Endurance-Exercised Rats with Diet-Induced NASH. Nutrients 2019, 11, 2709. [Google Scholar] [CrossRef] [Green Version]
- Dushay, J.; Chui, P.C.; Gopalakrishnan, G.S.; Varela–Rey, M.; Crawley, M.; Fisher, F.M.; Badman, M.K.; Martínez-Chantar, M.L.; Maratos-Flier, E. Increased fibroblast growth factor 21 in obesity and nonalcoholic fatty liver disease. Gastroenterology 2010, 139, 456–463. [Google Scholar] [CrossRef] [Green Version]
- Liang, Q.; Zhong, L.; Zhang, J.; Wang, Y.; Bornstein, S.R.; Triggle, C.R.; Ding, H.; Lam, K.S.L.; Xu, A. FGF21 Maintains Glucose Homeostasis by Mediating the Cross Talk Between Liver and Brain During Prolonged Fasting. Diabetes 2014, 63, 4064–4075. [Google Scholar] [CrossRef] [Green Version]


© 2020 by the authors. Licensee MDPI, Basel, Switzerland. This article is an open access article distributed under the terms and conditions of the Creative Commons Attribution (CC BY) license (http://creativecommons.org/licenses/by/4.0/).
Share and Cite
Schell, M.; Chudoba, C.; Leboucher, A.; Alfine, E.; Flore, T.; Ritter, K.; Weiper, K.; Wernitz, A.; Henkel, J.; Kleinridders, A. Interplay of Dietary Fatty Acids and Cholesterol Impacts Brain Mitochondria and Insulin Action. Nutrients 2020, 12, 1518. https://0-doi-org.brum.beds.ac.uk/10.3390/nu12051518
Schell M, Chudoba C, Leboucher A, Alfine E, Flore T, Ritter K, Weiper K, Wernitz A, Henkel J, Kleinridders A. Interplay of Dietary Fatty Acids and Cholesterol Impacts Brain Mitochondria and Insulin Action. Nutrients. 2020; 12(5):1518. https://0-doi-org.brum.beds.ac.uk/10.3390/nu12051518
Chicago/Turabian StyleSchell, Mareike, Chantal Chudoba, Antoine Leboucher, Eugenia Alfine, Tanina Flore, Katrin Ritter, Katharina Weiper, Andreas Wernitz, Janin Henkel, and André Kleinridders. 2020. "Interplay of Dietary Fatty Acids and Cholesterol Impacts Brain Mitochondria and Insulin Action" Nutrients 12, no. 5: 1518. https://0-doi-org.brum.beds.ac.uk/10.3390/nu12051518