Intermittent Fasting and High-Intensity Exercise Elicit Sexual-Dimorphic and Tissue-Specific Adaptations in Diet-Induced Obese Mice


Abstract
:1. Introduction
2. Materials and Methods
2.1. Previous Published Materials and Methods
2.2. Animals
2.3. mRNA and miRNA Expression
2.4. Statistical Analysis
3. Results
3.1. Previously Published Results
3.2. The Effect of the HF/S Diet on Hypothalamic mRNA Expression
3.3. The Effect of IF and/or HIIT on Hypothalamic mRNA Expression
3.4. The Effect of the HF/S Diet on White Adipose Tissue mRNA Expression
3.5. The Effects of IF and/or HIIT on White Adipose Tissue mRNA Expression
3.6. The Effects of the HF/S Diet on White Adipose Tissue microRNA Expression
3.7. The Effects of IF and/or HIIT on White Adipose Tissue microRNA Expression
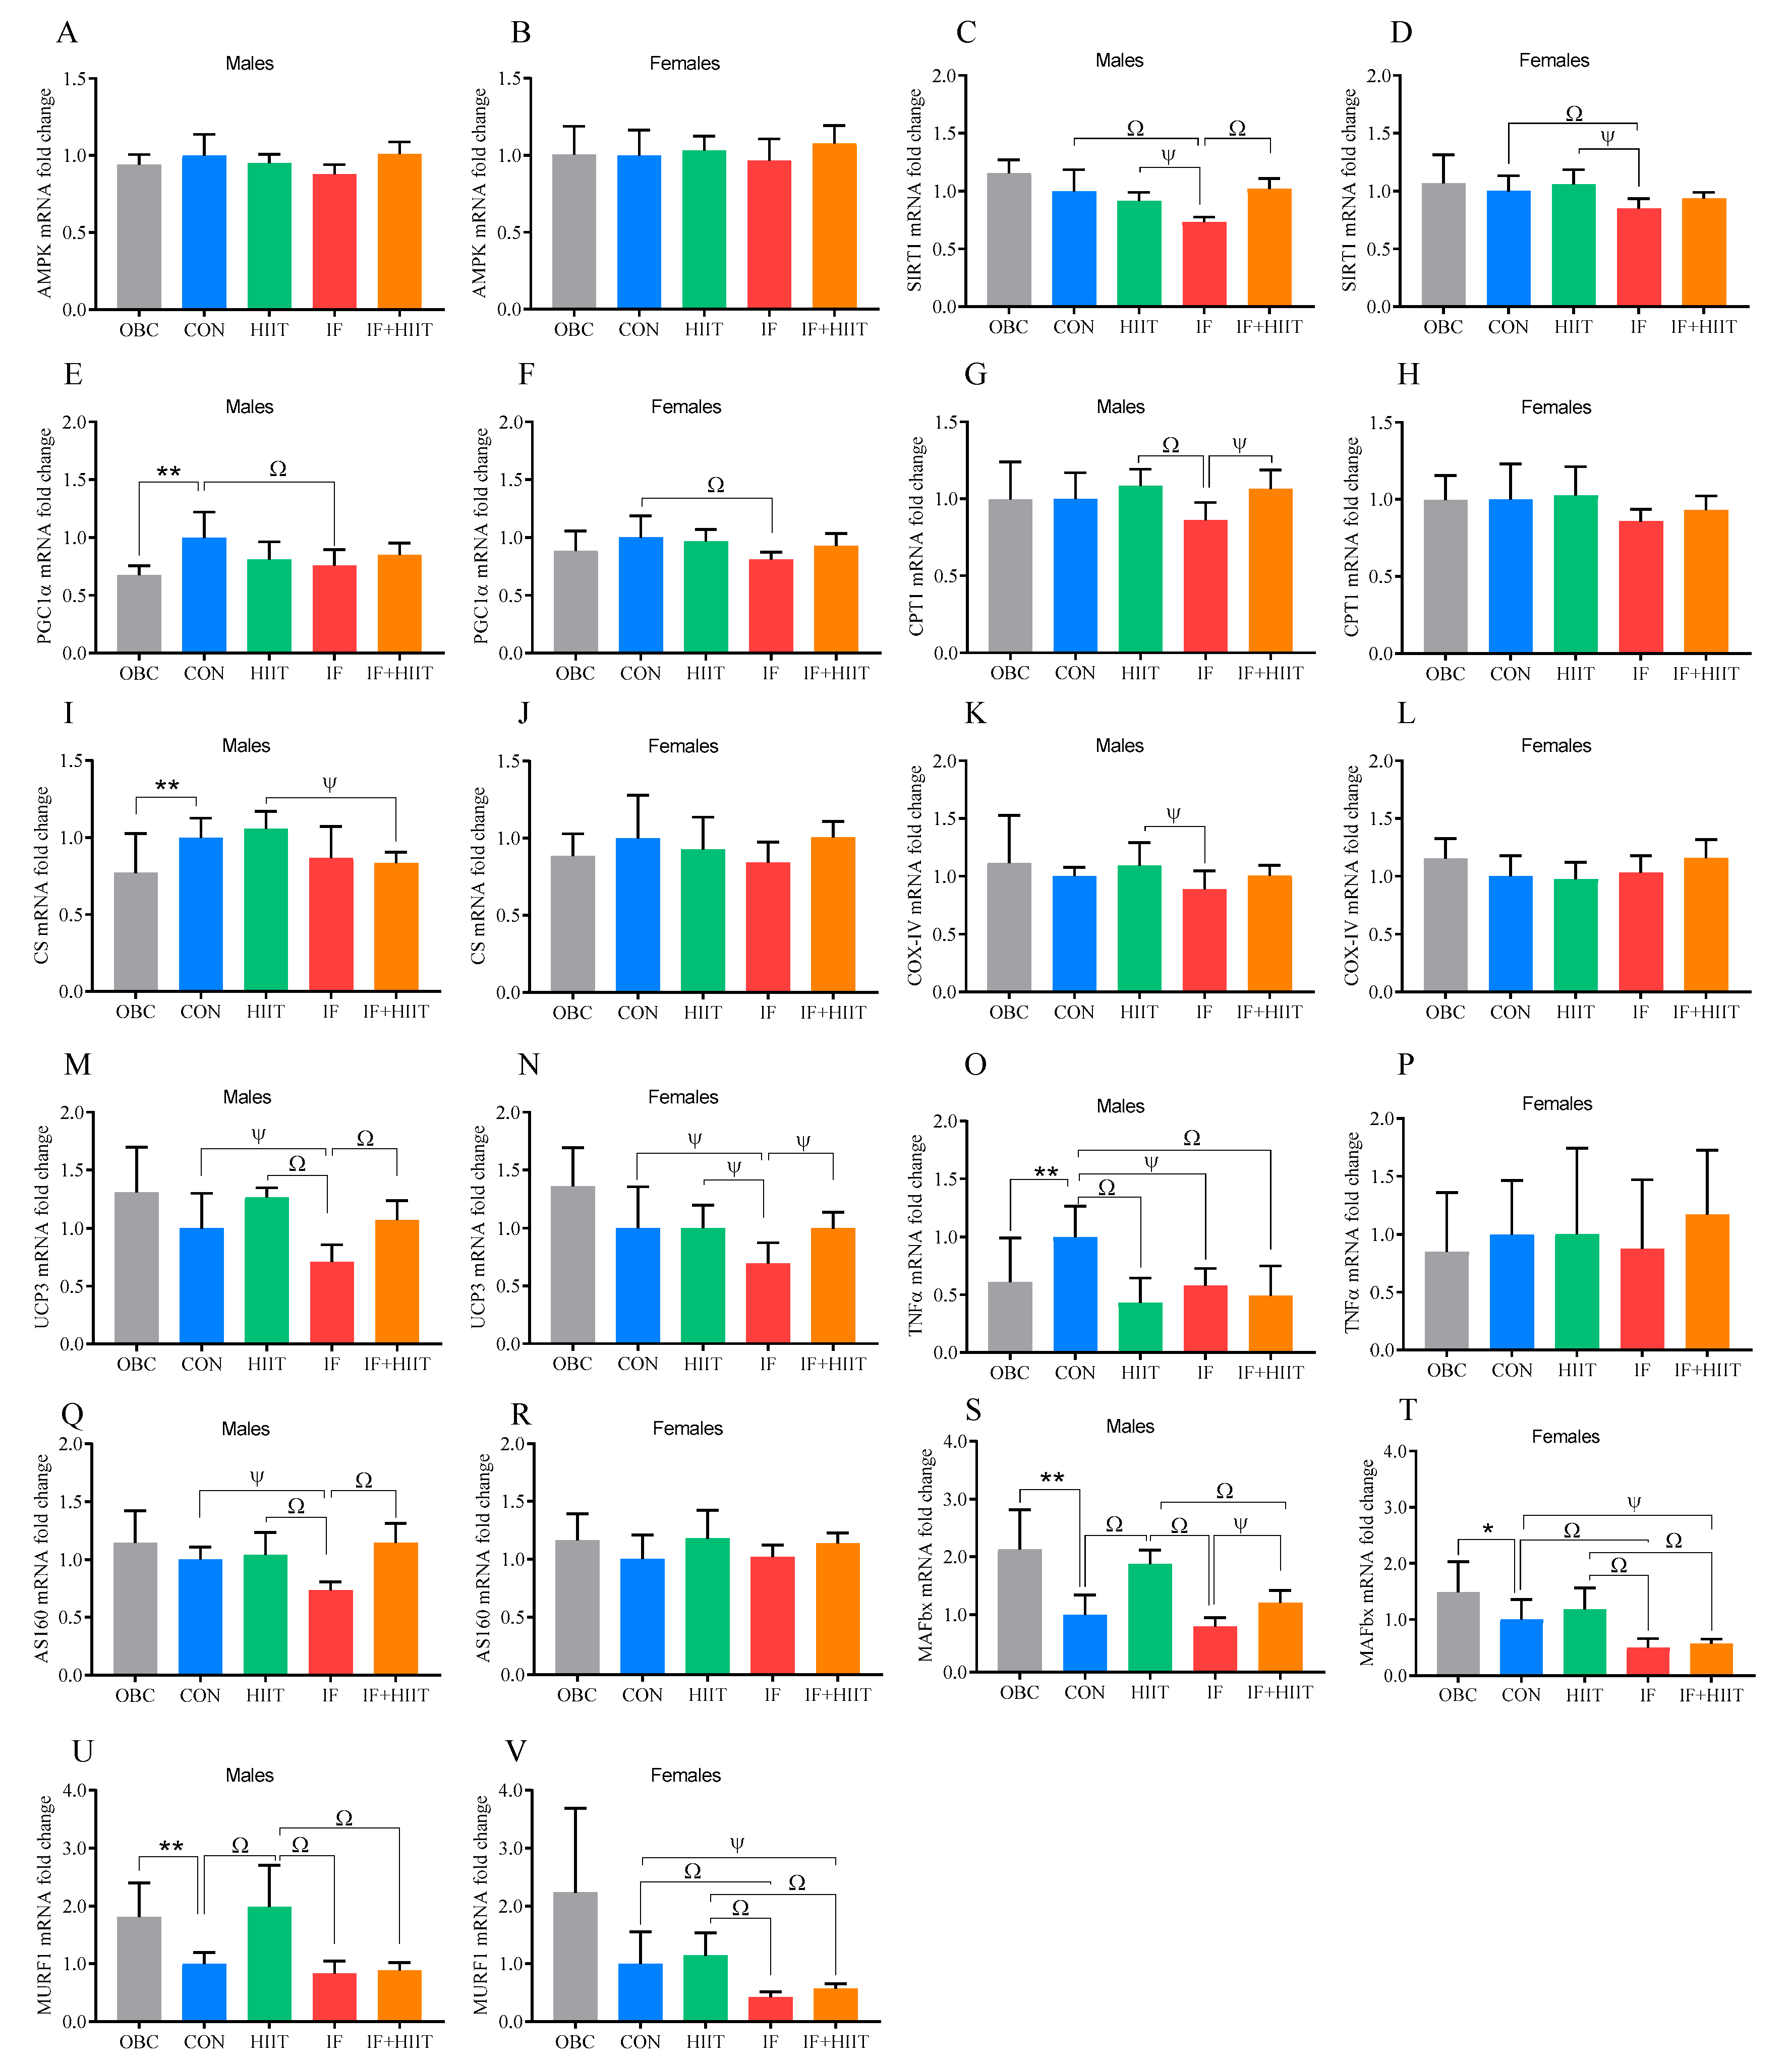
3.8. The Effect of the HF/S Diet on EDL Muscle mRNA Expression
3.9. The Effects of IF and/or HIIT on EDL Muscle mRNA Expression
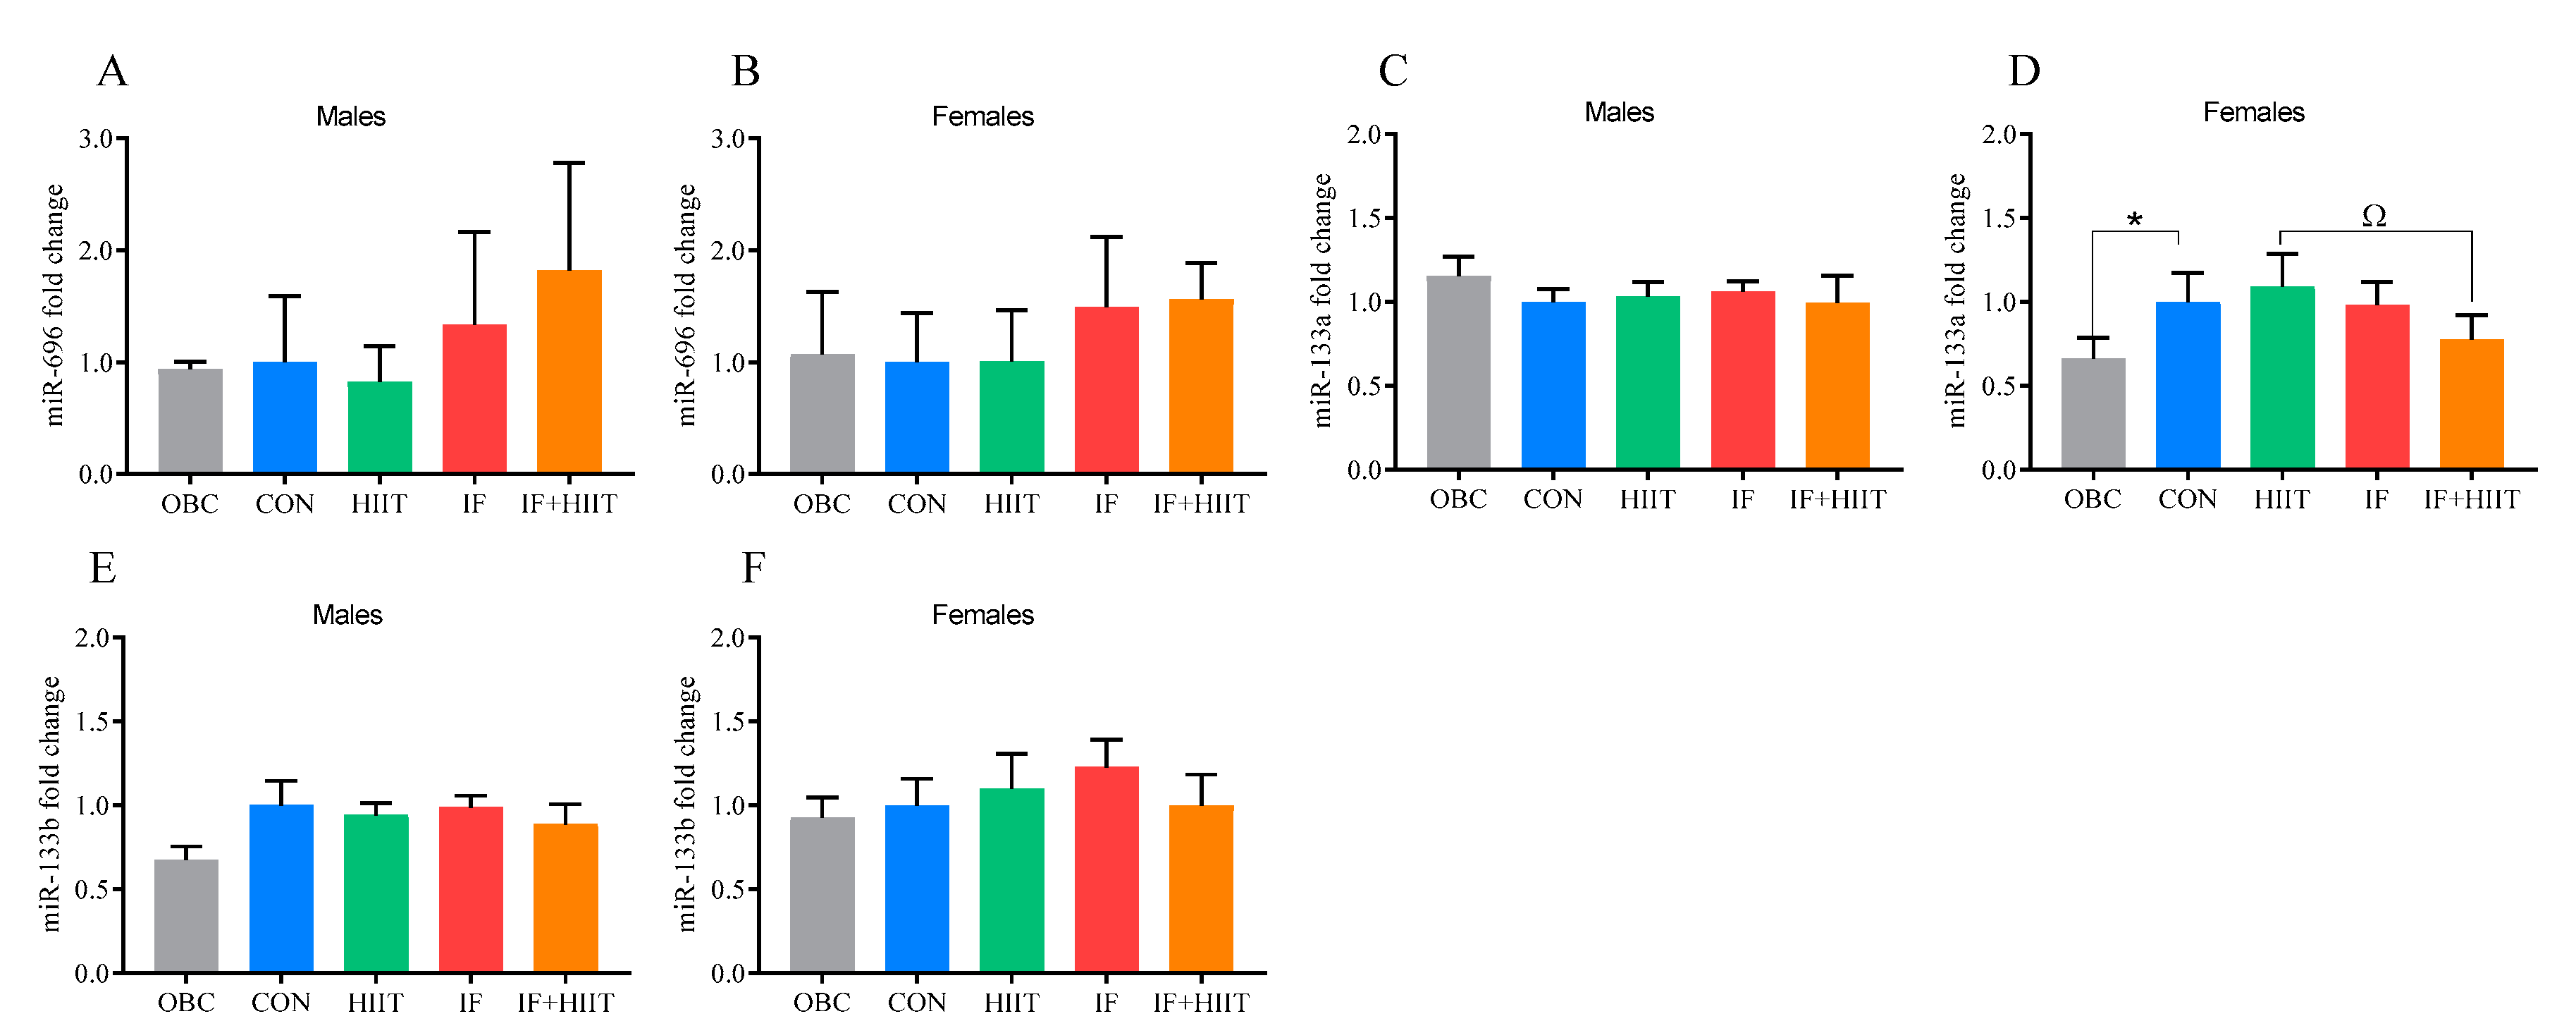
3.10. The Effects of the HF/S Diet on EDL Muscle microRNA Expression
3.11. The Effects of IF and/or HIIT on EDL Muscle microRNA Expression
4. Discussion
5. Limitations
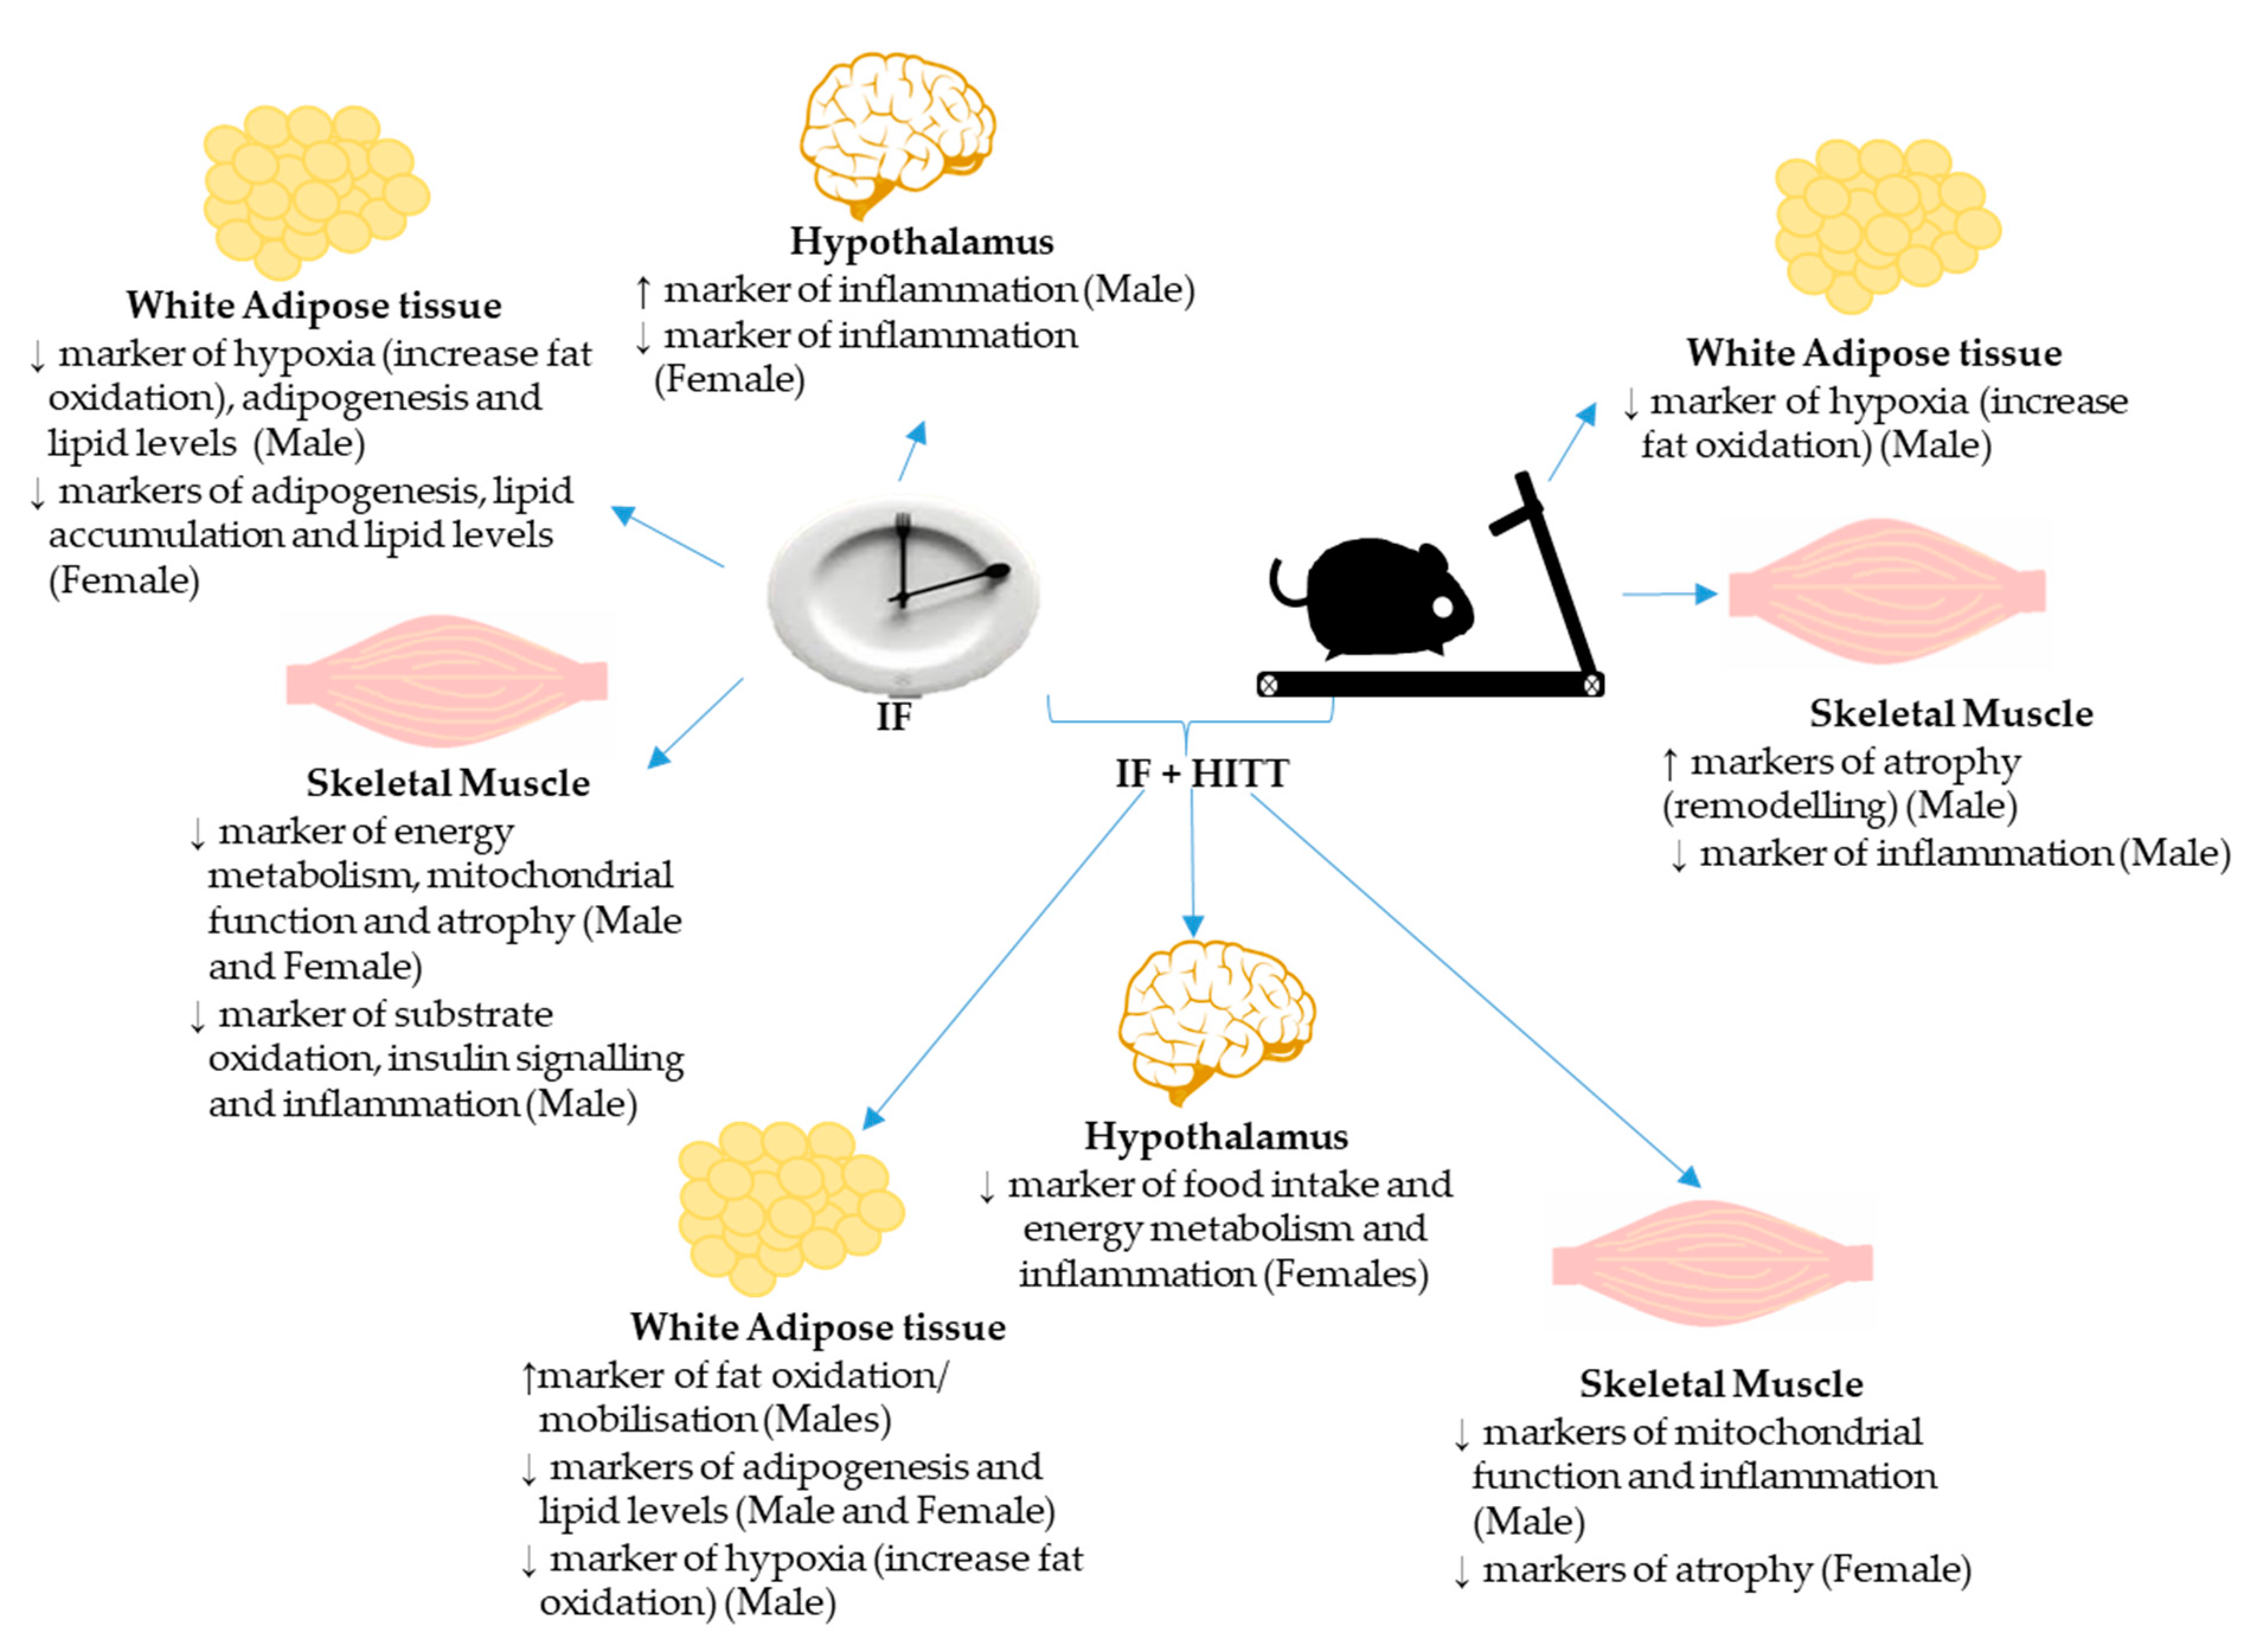
6. Conclusions
Supplementary Materials
Author Contributions
Funding
Acknowledgments
Conflicts of Interest
Abbreviations
| ACTB | βActin |
| AGRP | Agouti-related protein |
| AMPK | Protein kinase |
| AMP | Activated catalytic subunit alpha 2 |
| AS160 | Akt substrate of 160kDa |
| B2M | β2 microglobulin |
| BDNF | Brain-derived neurotrophic factor |
| BiP | Binding immunoglobulin protein |
| CIDEC | Cell death-inducing DFFA-like effector c |
| COX-IV | Cytochrome c oxidase subunit 4 isoform 2 |
| CPT1 | Carnitine palmitoyltransferase Ib |
| CS | Citrate synthase |
| FABP4 | Fatty acid-binding protein 4 |
| FOXO1 | Forkhead box O 1 |
| FTO | Fat mass and obesity associated |
| GAPDH | Glyceraldehyde-3-phosphate dehydrogenase |
| HADH | Hydroxyacyl-coenzyme A dehydrogenase |
| HIF1α | Hypoxia-inducible factor 1α |
| IL1β | Interleukin 1β |
| LEP | Leptin |
| MAFbx | F-box protein 32 |
| MuRF1 | Muscle RING finger 1 |
| NPY | Neuropeptide Y |
| PGC1α | Peroxisome proliferator-activated receptor gamma coactivator 1α |
| POMC | Pro-opiomelanocortinα |
| PPARγ | Peroxisome proliferator-activated receptor γ |
| PPIA | Peptidylprolyl isomerase A |
| SIRT1 | Sirtuin 1 |
| TNFα | Tumor necrosis factor α |
| TRPV4 | Transient receptor potential cation channel, subfamily V, member 4 |
| UCP1 | Uncoupling protein 1 |
| UCP3 | Uncoupling protein 3 |
| XBP1us | X box binding protein 1 (unspliced) |
| XBP1s | X box binding protein 1 (spliced) |
References
- Wang, T.; Heianza, Y.; Sun, D.; Zheng, Y.; Huang, T.; Ma, W.; Rimm, E.B.; Manson, J.E.; Hu, F.B.; Willett, W.C.; et al. Improving fruit and vegetable intake attenuates the genetic association with long-term weight gain. Am. J. Clin. Nutr. 2019, 110, 759–768. [Google Scholar] [CrossRef] [PubMed]
- Wang, Y.; Beydoun, M.A. Meat consumption is associated with obesity and central obesity among US adults. Int. J. Obes. (2005) 2009, 33, 621–628. [Google Scholar] [CrossRef] [PubMed] [Green Version]
- Melo, H.M.; Santos, L.E.; Ferreira, S.T. Diet-Derived Fatty Acids, Brain Inflammation, and Mental Health. Front. Neurosci. 2019, 13, 265. [Google Scholar] [CrossRef] [PubMed] [Green Version]
- Jais, A.; Brüning, J.C. Hypothalamic inflammation in obesity and metabolic disease. J. Clin. Investig. 2017, 127, 24–32. [Google Scholar] [CrossRef] [PubMed]
- Gotthardt, J.D.; Verpeut, J.L.; Yeomans, B.L.; Yang, J.A.; Yasrebi, A.; Roepke, T.A.; Bello, N.T. Intermittent Fasting Promotes Fat Loss With Lean Mass Retention, Increased Hypothalamic Norepinephrine Content, and Increased Neuropeptide Y Gene Expression in Diet-Induced Obese Male Mice. Endocrinology 2016, 157, 679–691. [Google Scholar] [CrossRef] [PubMed]
- McLean, F.H.; Campbell, F.M.; Langston, R.F.; Sergi, D.; Resch, C.; Grant, C.; Morris, A.C.; Mayer, C.D.; Williams, L.M. A high-fat diet induces rapid changes in the mouse hypothalamic proteome. Nutr. Metab. 2019, 16, 26. [Google Scholar] [CrossRef] [PubMed]
- Hammarstedt, A.; Gogg, S.; Hedjazifar, S.; Nerstedt, A.; Smith, U. Impaired Adipogenesis and Dysfunctional Adipose Tissue in Human Hypertrophic Obesity. Physiol. Rev. 2018, 98, 1911–1941. [Google Scholar] [CrossRef] [PubMed]
- Templeman, I.; Thompson, D.; Gonzalez, J.; Walhin, J.-P.; Reeves, S.; Rogers, P.J.; Brunstrom, J.M.; Karagounis, L.G.; Tsintzas, K.; Betts, J.A. Intermittent fasting, energy balance and associated health outcomes in adults: Study protocol for a randomised controlled trial. Trials 2018, 19, 86. [Google Scholar] [CrossRef] [Green Version]
- Wewege, M.; van den Berg, R.; Ward, R.E.; Keech, A. The effects of high-intensity interval training vs. moderate-intensity continuous training on body composition in overweight and obese adults: A systematic review and meta-analysis. Obes. Rev. 2017, 18, 635–646. [Google Scholar] [CrossRef] [PubMed]
- Wilson, R.A.; Deasy, W.; Stathis, C.G.; Hayes, A.; Cooke, M.B. Intermittent Fasting with or without Exercise Prevents Weight Gain and Improves Lipids in Diet-Induced Obese Mice. Nutrients 2018, 10, 346. [Google Scholar] [CrossRef] [PubMed] [Green Version]
- Dweep, H.; Sticht, C.; Pandey, P.; Gretz, N. miRWalk—Database: Prediction of possible miRNA binding sites by “walking” the genes of three genomes. J. Biomed. Inform. 2011, 44, 839–847. [Google Scholar] [CrossRef] [PubMed] [Green Version]
- Valdearcos, M.; Robblee, M.M.; Benjamin, D.I.; Nomura, D.K.; Xu, A.W.; Koliwad, S.K. Microglia dictate the impact of saturated fat consumption on hypothalamic inflammation and neuronal function. Cell Rep. 2014, 9, 2124–2138. [Google Scholar] [CrossRef] [PubMed] [Green Version]
- la Fleur, S.E.; van Rozen, A.J.; Luijendijk, M.C.M.; Groeneweg, F.; Adan, R.A.H. A free-choice high-fat high-sugar diet induces changes in arcuate neuropeptide expression that support hyperphagia. Int. J. Obes. (2005) 2010, 34, 537–546. [Google Scholar] [CrossRef] [PubMed] [Green Version]
- Shamsi, B.H.; Ma, C.; Naqvi, S.; Xiao, Y. Effects of pioglitazone mediated activation of PPAR-gamma on CIDEC and obesity related changes in mice. PLoS ONE 2014, 9, e106992. [Google Scholar] [CrossRef] [PubMed]
- Rappou, E.; Jukarainen, S.; Rinnankoski-Tuikka, R.; Kaye, S.; Heinonen, S.; Hakkarainen, A.; Lundbom, J.; Lundbom, N.; Saunavaara, V.; Rissanen, A.; et al. Weight Loss Is Associated With Increased NAD(+)/SIRT1 Expression But Reduced PARP Activity in White Adipose Tissue. Int. J. Clin. Endocrinol. Metab. 2016, 101, 1263–1273. [Google Scholar] [CrossRef]
- Lim, W.C.; Ho, J.N.; Lee, H.S.; Cho, H.Y. Germinated Waxy Black Rice Suppresses Weight Gain in High-Fat Diet-Induced Obese Mice. J. Med. Food 2016, 19, 410–417. [Google Scholar] [CrossRef]
- Priego, T.; Sánchez, J.; Palou, A.; Picó, C. Effect of high-fat diet feeding on leptin receptor expression in white adipose tissue in rats: Depot- and sex-related differential response. Genes Nutr. 2009, 4, 151–156. [Google Scholar] [CrossRef] [Green Version]
- Sparks, L.M.; Xie, H.; Koza, R.A.; Mynatt, R.; Hulver, M.W.; Bray, G.A.; Smith, S.R. A high-fat diet coordinately downregulates genes required for mitochondrial oxidative phosphorylation in skeletal muscle. Diabetes 2005, 54, 1926–1933. [Google Scholar] [CrossRef] [Green Version]
- Koves, T.R.; Li, P.; An, J.; Akimoto, T.; Slentz, D.; Ilkayeva, O.; Dohm, G.L.; Yan, Z.; Newgard, C.B.; Muoio, D.M. Peroxisome proliferator-activated receptor-gamma co-activator 1alpha-mediated metabolic remodeling of skeletal myocytes mimics exercise training and reverses lipid-induced mitochondrial inefficiency. J. Biol. Chem. 2005, 280, 33588–33598. [Google Scholar] [CrossRef] [Green Version]
- Iossa, S.; Mollica, M.P.; Lionetti, L.; Crescenzo, R.; Botta, M.; Liverini, G. Skeletal muscle oxidative capacity in rats fed high-fat diet. Int. J. Obes. Relat. Metab. Disord. 2002, 26, 65–72. [Google Scholar] [CrossRef] [Green Version]
- Turner, N.; Bruce, C.R.; Beale, S.M.; Hoehn, K.L.; So, T.; Rolph, M.S.; Cooney, G.J. Excess lipid availability increases mitochondrial fatty acid oxidative capacity in muscle: Evidence against a role for reduced fatty acid oxidation in lipid-induced insulin resistance in rodents. Diabetes 2007, 56, 2085–2092. [Google Scholar] [CrossRef] [Green Version]
- Hancock, C.R.; Han, D.H.; Chen, M.; Terada, S.; Yasuda, T.; Wright, D.C.; Holloszy, J.O. High-fat diets cause insulin resistance despite an increase in muscle mitochondria. Proc. Natl. Acad. Sci. USA 2008, 105, 7815–7820. [Google Scholar] [CrossRef] [Green Version]
- Yang, Y.; Smith, D.L., Jr.; Keating, K.D.; Allison, D.B.; Nagy, T.R. Variations in body weight, food intake and body composition after long-term high-fat diet feeding in C57BL/6J mice. Obesity (Silver Spring) 2014, 22, 2147–2155. [Google Scholar] [CrossRef] [PubMed]
- Priego, T.; Sanchez, J.; Pico, C.; Palou, A. Sex-differential expression of metabolism-related genes in response to a high-fat diet. Obesity (Silver Spring) 2008, 16, 819–826. [Google Scholar] [CrossRef] [PubMed]
- Xie, H.; Lim, B.; Lodish, H.F. MicroRNAs induced during adipogenesis that accelerate fat cell development are downregulated in obesity. Diabetes 2009, 58, 1050–1057. [Google Scholar] [CrossRef] [PubMed] [Green Version]
- Seimon, R.V.; Shi, Y.C.; Slack, K.; Lee, K.; Fernando, H.A.; Nguyen, A.D.; Zhang, L.; Lin, S.; Enriquez, R.F.; Lau, J.; et al. Intermittent Moderate Energy Restriction Improves Weight Loss Efficiency in Diet-Induced Obese Mice. PLoS ONE 2016, 11, e0145157. [Google Scholar] [CrossRef] [PubMed]
- Chausse, B.; Solon, C.; Caldeira da Silva, C.C.; Masselli Dos Reis, I.G.; Manchado-Gobatto, F.B.; Gobatto, C.A.; Velloso, L.A.; Kowaltowski, A.J. Intermittent fasting induces hypothalamic modifications resulting in low feeding efficiency, low body mass and overeating. Endocrinology 2014, 155, 2456–2466. [Google Scholar] [CrossRef] [PubMed] [Green Version]
- He, Z.; Gao, Y.; Alhadeff, A.L.; Castorena, C.M.; Huang, Y.; Lieu, L.; Afrin, S.; Sun, J.; Betley, J.N.; Guo, H.; et al. Cellular and synaptic reorganization of arcuate NPY/AgRP and POMC neurons after exercise. Mol. Metab. 2018, 18, 107–119. [Google Scholar] [CrossRef]
- Khajehnasiri, N.; Khazali, H.; Sheikhzadeh, F.; Ghowsi, M. One-month of high-intensity exercise did not change the food intake and the hypothalamic arcuate nucleus proopiomelanocortin and neuropeptide Y expression levels in male Wistar rats. Endocr. Regul. 2019, 53, 8–13. [Google Scholar] [CrossRef] [Green Version]
- Arner, P.; Bernard, S.; Salehpour, M.; Possnert, G.; Liebl, J.; Steier, P.; Buchholz, B.A.; Eriksson, M.; Arner, E.; Hauner, H.; et al. Dynamics of human adipose lipid turnover in health and metabolic disease. Nature 2011, 478, 110–113. [Google Scholar] [CrossRef] [Green Version]
- Friedman, J.M. Leptin and the regulation of body weigh. Keio J. Med. 2011, 60, 1–9. [Google Scholar] [CrossRef] [PubMed] [Green Version]
- Kersten, S.B.W. Roles of PPARs in health and disease. Nature 2000, 405, 421–424. [Google Scholar] [CrossRef] [PubMed]
- Hotamisligil, G.S.; Bernlohr, D.A. Metabolic functions of FABPs—Mechanisms and therapeutic implications. Nat. Rev. Endocrinol. 2015, 11, 592–605. [Google Scholar] [CrossRef] [PubMed] [Green Version]
- Krskova, K.; Eckertova, M.; Kukan, M.; Kuba, D.; Kebis, A.; Olszanecki, R.; Suski, M.; Gajdosechova, L.; Zorad, S. Aerobic training lasting for 10 weeks elevates the adipose tissue FABP4, Gialpha, and adiponectin expression associated by a reduced protein oxidation. Endocr. Regul. 2012, 46, 137–146. [Google Scholar] [CrossRef] [PubMed]
- He, Q.; Gao, Z.; Yin, J.; Zhang, J.; Yun, Z.; Ye, J. Regulation of HIF-1α activity in adipose tissue by obesity-associated factors: Adipogenesis, insulin, and hypoxia. Am. J. Physiol. Endocrinol. Metab. 2011, 300, E877–E885. [Google Scholar] [CrossRef] [PubMed] [Green Version]
- Krishnan, J.; Danzer, C.; Simka, T.; Ukropec, J.; Walter, K.M.; Kumpf, S.; Mirtschink, P.; Ukropcova, B.; Gasperikova, D.; Pedrazzini, T.; et al. Dietary obesity-associated Hif1alpha activation in adipocytes restricts fatty acid oxidation and energy expenditure via suppression of the Sirt2-NAD+ system. Genes Dev. 2012, 26, 259–270. [Google Scholar] [CrossRef] [Green Version]
- Verhoef, S.P.M.; Camps, S.G.J.A.; Bouwman, F.G.; Mariman, E.C.M.; Westerterp, K.R. Physiological response of adipocytes to weight loss and maintenance. PLoS ONE 2013, 8, e58011. [Google Scholar] [CrossRef] [PubMed] [Green Version]
- Morrison, R.F.; Farmer, S.R. Role of PPARγ in Regulating a Cascade Expression of Cyclin-dependent Kinase Inhibitors, p18(INK4c) and p21(Waf1/Cip1), during Adipogenesis. J. Biol. Chem. 1999, 274, 17088–17097. [Google Scholar] [CrossRef] [Green Version]
- O’Conor, C.J.; Griffin, T.M.; Liedtke, W.; Guilak, F. Increased susceptibility of Trpv4-deficient mice to obesity and obesity-induced osteoarthritis with very high-fat diet. Ann. Rheum. Dis. 2013, 72, 300–304. [Google Scholar] [CrossRef] [Green Version]
- Ye, L.; Kleiner, S.; Wu, J.; Sah, R.; Gupta, R.K.; Banks, A.S.; Cohen, P.; Khandekar, M.J.; Boström, P.; Mepani, R.J.; et al. TRPV4 is a regulator of adipose oxidative metabolism, inflammation, and energy homeostasis. Cell 2012, 151, 96–110. [Google Scholar] [CrossRef] [Green Version]
- Liang, H.; Ward, W.F. PGC-1alpha: A key regulator of energy metabolism. Adv. Physiol. Educ. 2006, 30, 145–151. [Google Scholar] [CrossRef] [PubMed]
- Heilbronn, L.K.; Civitarese, A.E.; Bogacka, I.; Smith, S.R.; Hulver, M.; Ravussin, E. Glucose tolerance and skeletal muscle gene expression in response to alternate day fasting. Obes. Res. 2005, 13, 574–581. [Google Scholar] [CrossRef] [PubMed]
- Bostrom, P.; Wu, J.; Jedrychowski, M.P.; Korde, A.; Ye, L.; Lo, J.C.; Rasbach, K.A.; Bostrom, E.A.; Choi, J.H.; Long, J.Z.; et al. A PGC1-alpha-dependent myokine that drives brown-fat-like development of white fat and thermogenesis. Nature 2012, 481, 463–468. [Google Scholar] [CrossRef] [PubMed]
- Martinez-Huenchullan, S.F.; Maharjan, B.R.; Williams, P.F.; Tam, C.S.; McLennan, S.V.; Twigg, S.M. Differential metabolic effects of constant moderate versus high intensity interval training in high-fat fed mice: Possible role of muscle adiponectin. Physiol. Rep. 2018, 6. [Google Scholar] [CrossRef] [Green Version]
- Bowen, T.S.; Adams, V.; Werner, S.; Fischer, T.; Vinke, P.; Brogger, M.N.; Mangner, N.; Linke, A.; Sehr, P.; Lewis, J.; et al. Small-molecule inhibition of MuRF1 attenuates skeletal muscle atrophy and dysfunction in cardiac cachexia. J. Cachexia Sarcopenia Muscle 2017, 8, 939–953. [Google Scholar] [CrossRef]
- Mascher, H.; Tannerstedt, J.; Brink-Elfegoun, T.; Ekblom, B.; Gustafsson, T.; Blomstrand, E. Repeated resistance exercise training induces different changes in mRNA expression of MAFbx and MuRF-1 in human skeletal muscle. Am. J. Physiol.-Endocrinol. Metab. 2008, 294, E43–E51. [Google Scholar] [CrossRef] [Green Version]
- Cunha, T.F.; Moreira, J.B.; Paixao, N.A.; Campos, J.C.; Monteiro, A.W.; Bacurau, A.V.; Bueno, C.R., Jr.; Ferreira, J.C.; Brum, P.C. Aerobic exercise training upregulates skeletal muscle calpain and ubiquitin-proteasome systems in healthy mice. J. Appl. Physiol. (1985) 2012, 112, 1839–1846. [Google Scholar] [CrossRef] [Green Version]
- Greiwe, J.S.; Cheng, B.; Rubin, D.C.; Yarasheski, K.E.; Semenkovich, C.F. Resistance exercise decreases skeletal muscle tumor necrosis factor alpha in frail elderly humans. FASEB J. 2001, 15, 475–482. [Google Scholar] [CrossRef]
- Phillips, T.; Leeuwenburgh, C. Muscle fiber specific apoptosis and TNF-alpha signaling in sarcopenia are attenuated by life-long calorie restriction. FASEB J. 2005, 19, 668–670. [Google Scholar] [CrossRef]


© 2020 by the authors. Licensee MDPI, Basel, Switzerland. This article is an open access article distributed under the terms and conditions of the Creative Commons Attribution (CC BY) license (http://creativecommons.org/licenses/by/4.0/).
Share and Cite
Wilson, R.A.; Stathis, C.G.; Hayes, A.; Cooke, M.B. Intermittent Fasting and High-Intensity Exercise Elicit Sexual-Dimorphic and Tissue-Specific Adaptations in Diet-Induced Obese Mice. Nutrients 2020, 12, 1764. https://0-doi-org.brum.beds.ac.uk/10.3390/nu12061764
Wilson RA, Stathis CG, Hayes A, Cooke MB. Intermittent Fasting and High-Intensity Exercise Elicit Sexual-Dimorphic and Tissue-Specific Adaptations in Diet-Induced Obese Mice. Nutrients. 2020; 12(6):1764. https://0-doi-org.brum.beds.ac.uk/10.3390/nu12061764
Chicago/Turabian StyleWilson, Robin A., Christos G. Stathis, Alan Hayes, and Matthew B. Cooke. 2020. "Intermittent Fasting and High-Intensity Exercise Elicit Sexual-Dimorphic and Tissue-Specific Adaptations in Diet-Induced Obese Mice" Nutrients 12, no. 6: 1764. https://0-doi-org.brum.beds.ac.uk/10.3390/nu12061764