Are Sugar-Reduced and Whole Grain Infant Cereals Sensorially Accepted at Weaning? A Randomized Controlled Cross-Over Trial

 ,
,  ,
,  ,
,  ,
, 
 and
and
Abstract
:
1. Introduction
- 1.
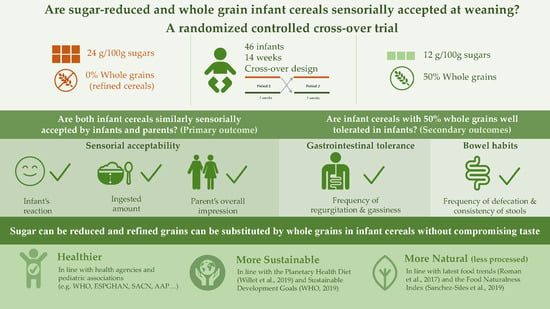
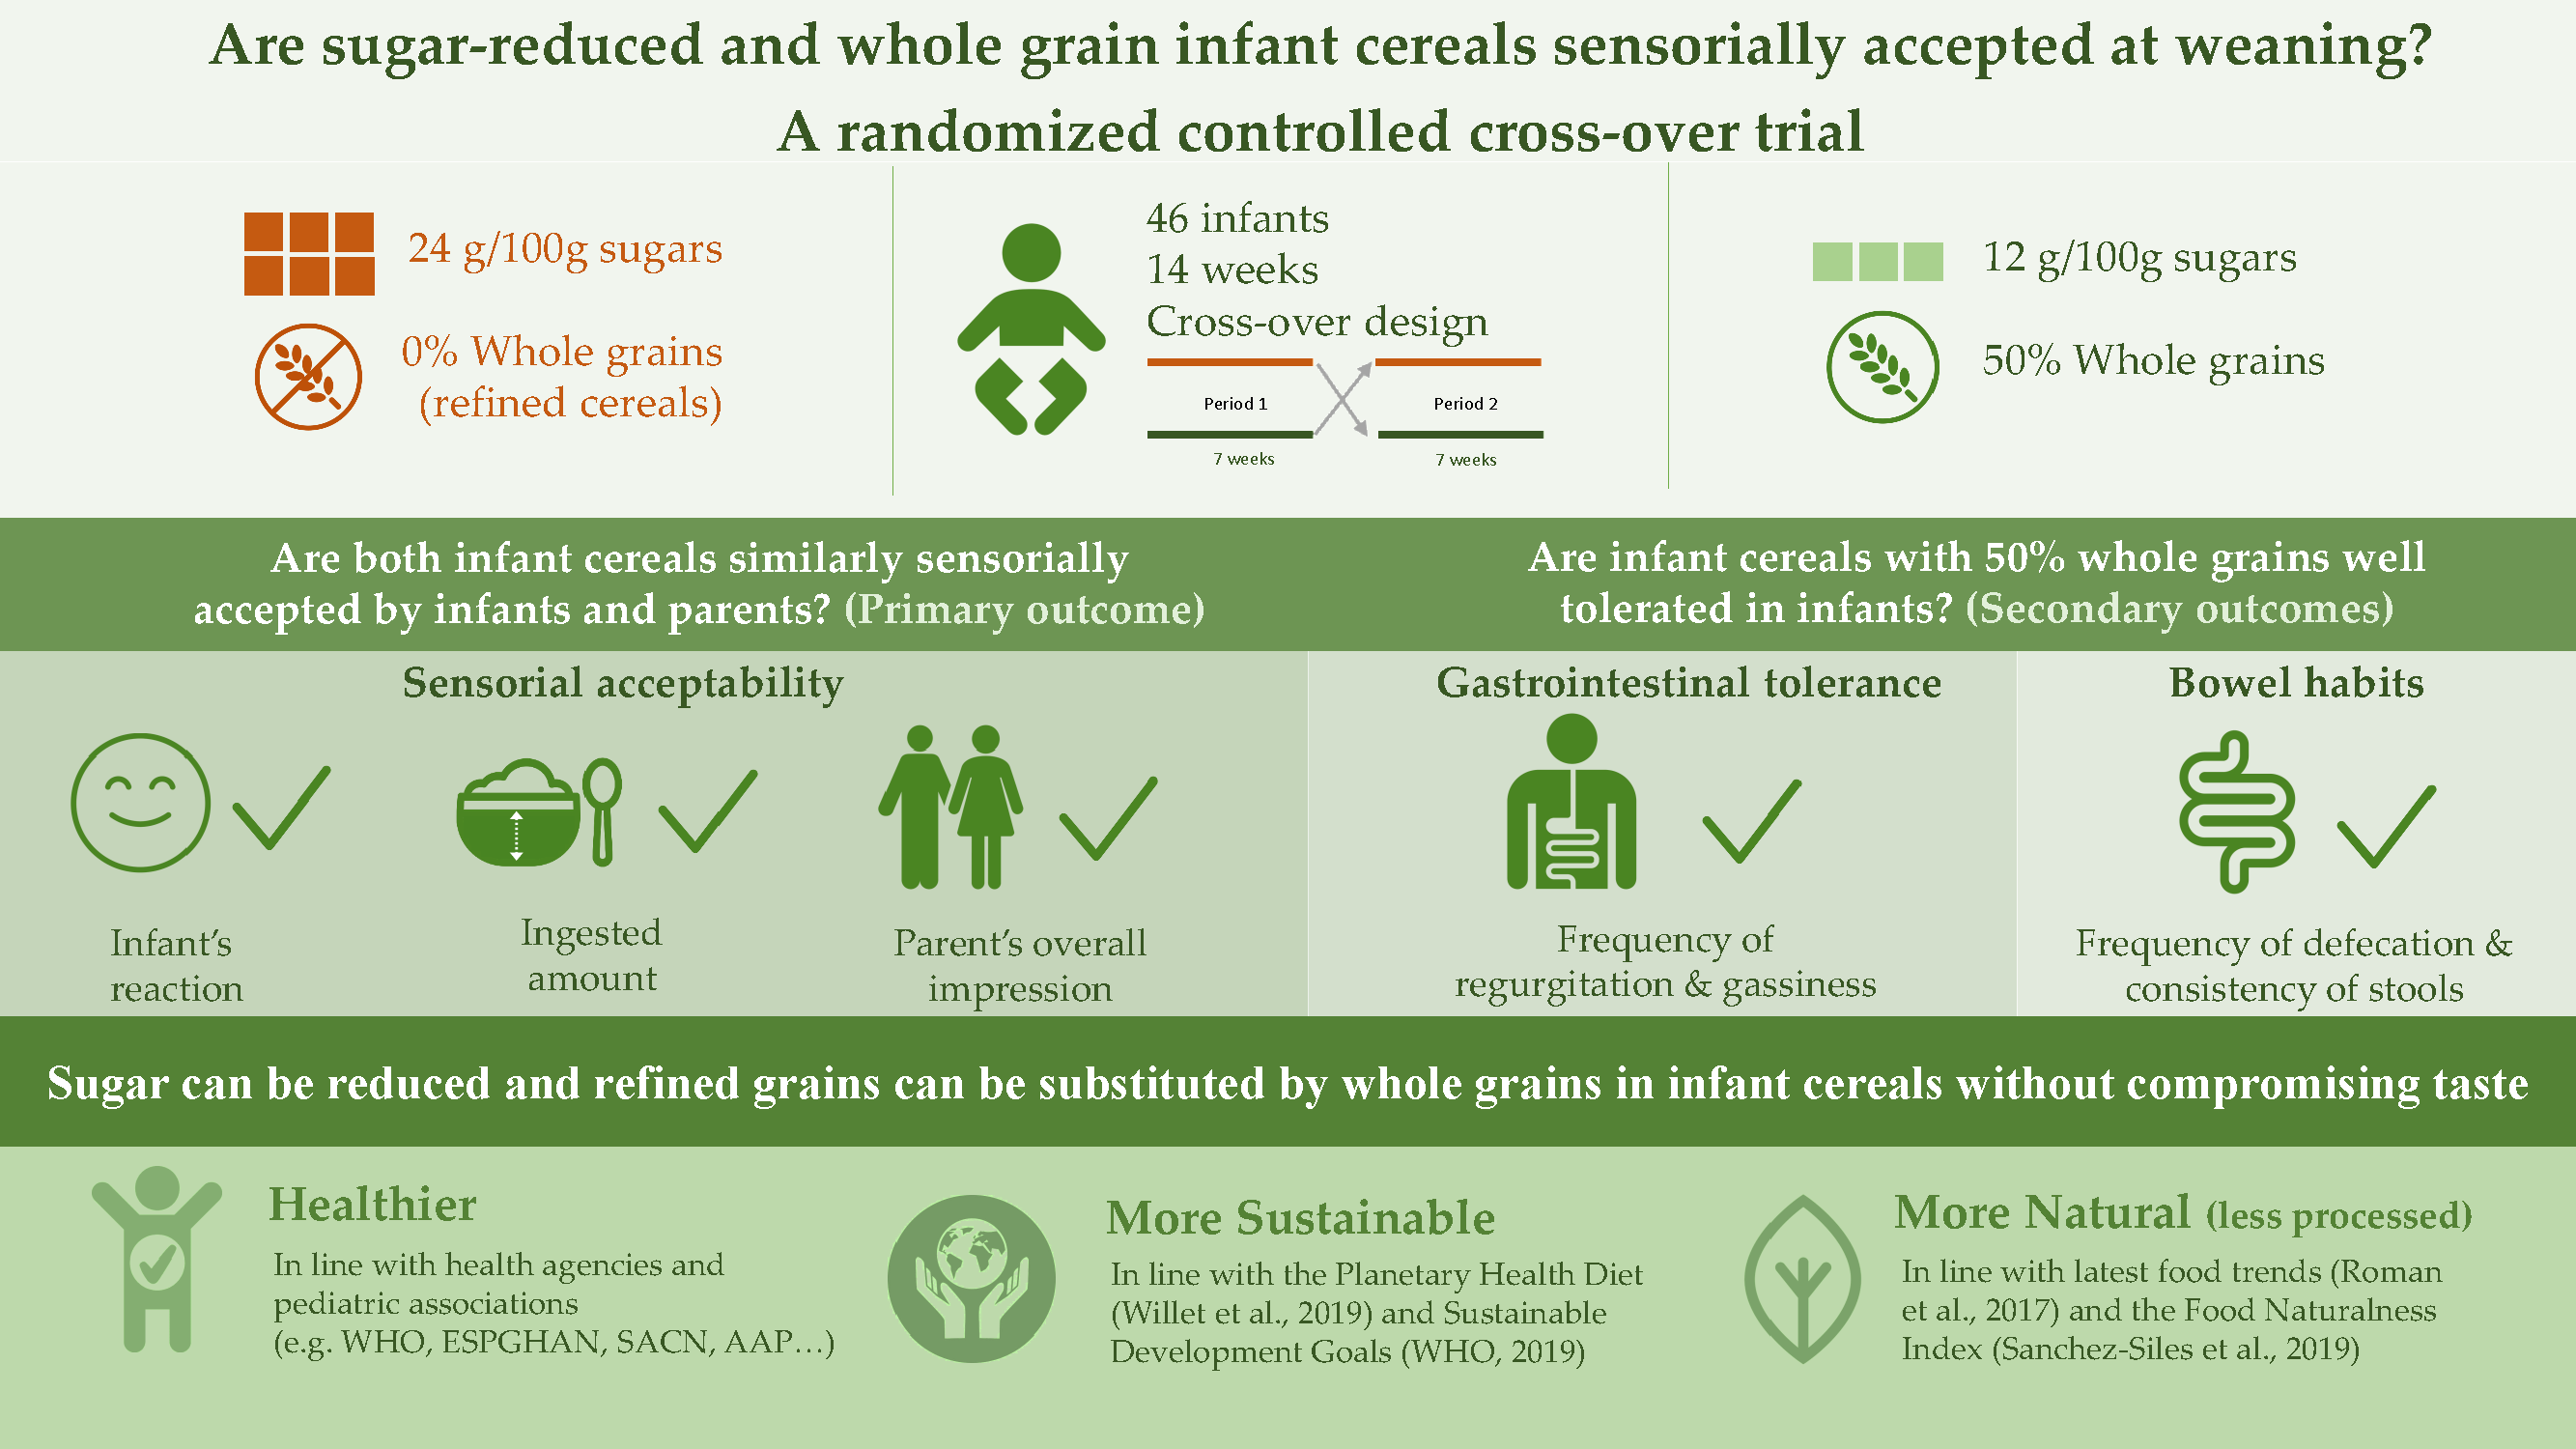
- Is an infant cereal with 50% whole grains and medium-sugar content (12 g/100 g) similarly accepted by infants and parents in comparison to a higher sugar (24 g/100 g) infant cereal without whole grains?
- 2.
- Is an infant cereal with 50% whole grains well tolerated in infants?
2. Materials and Methods
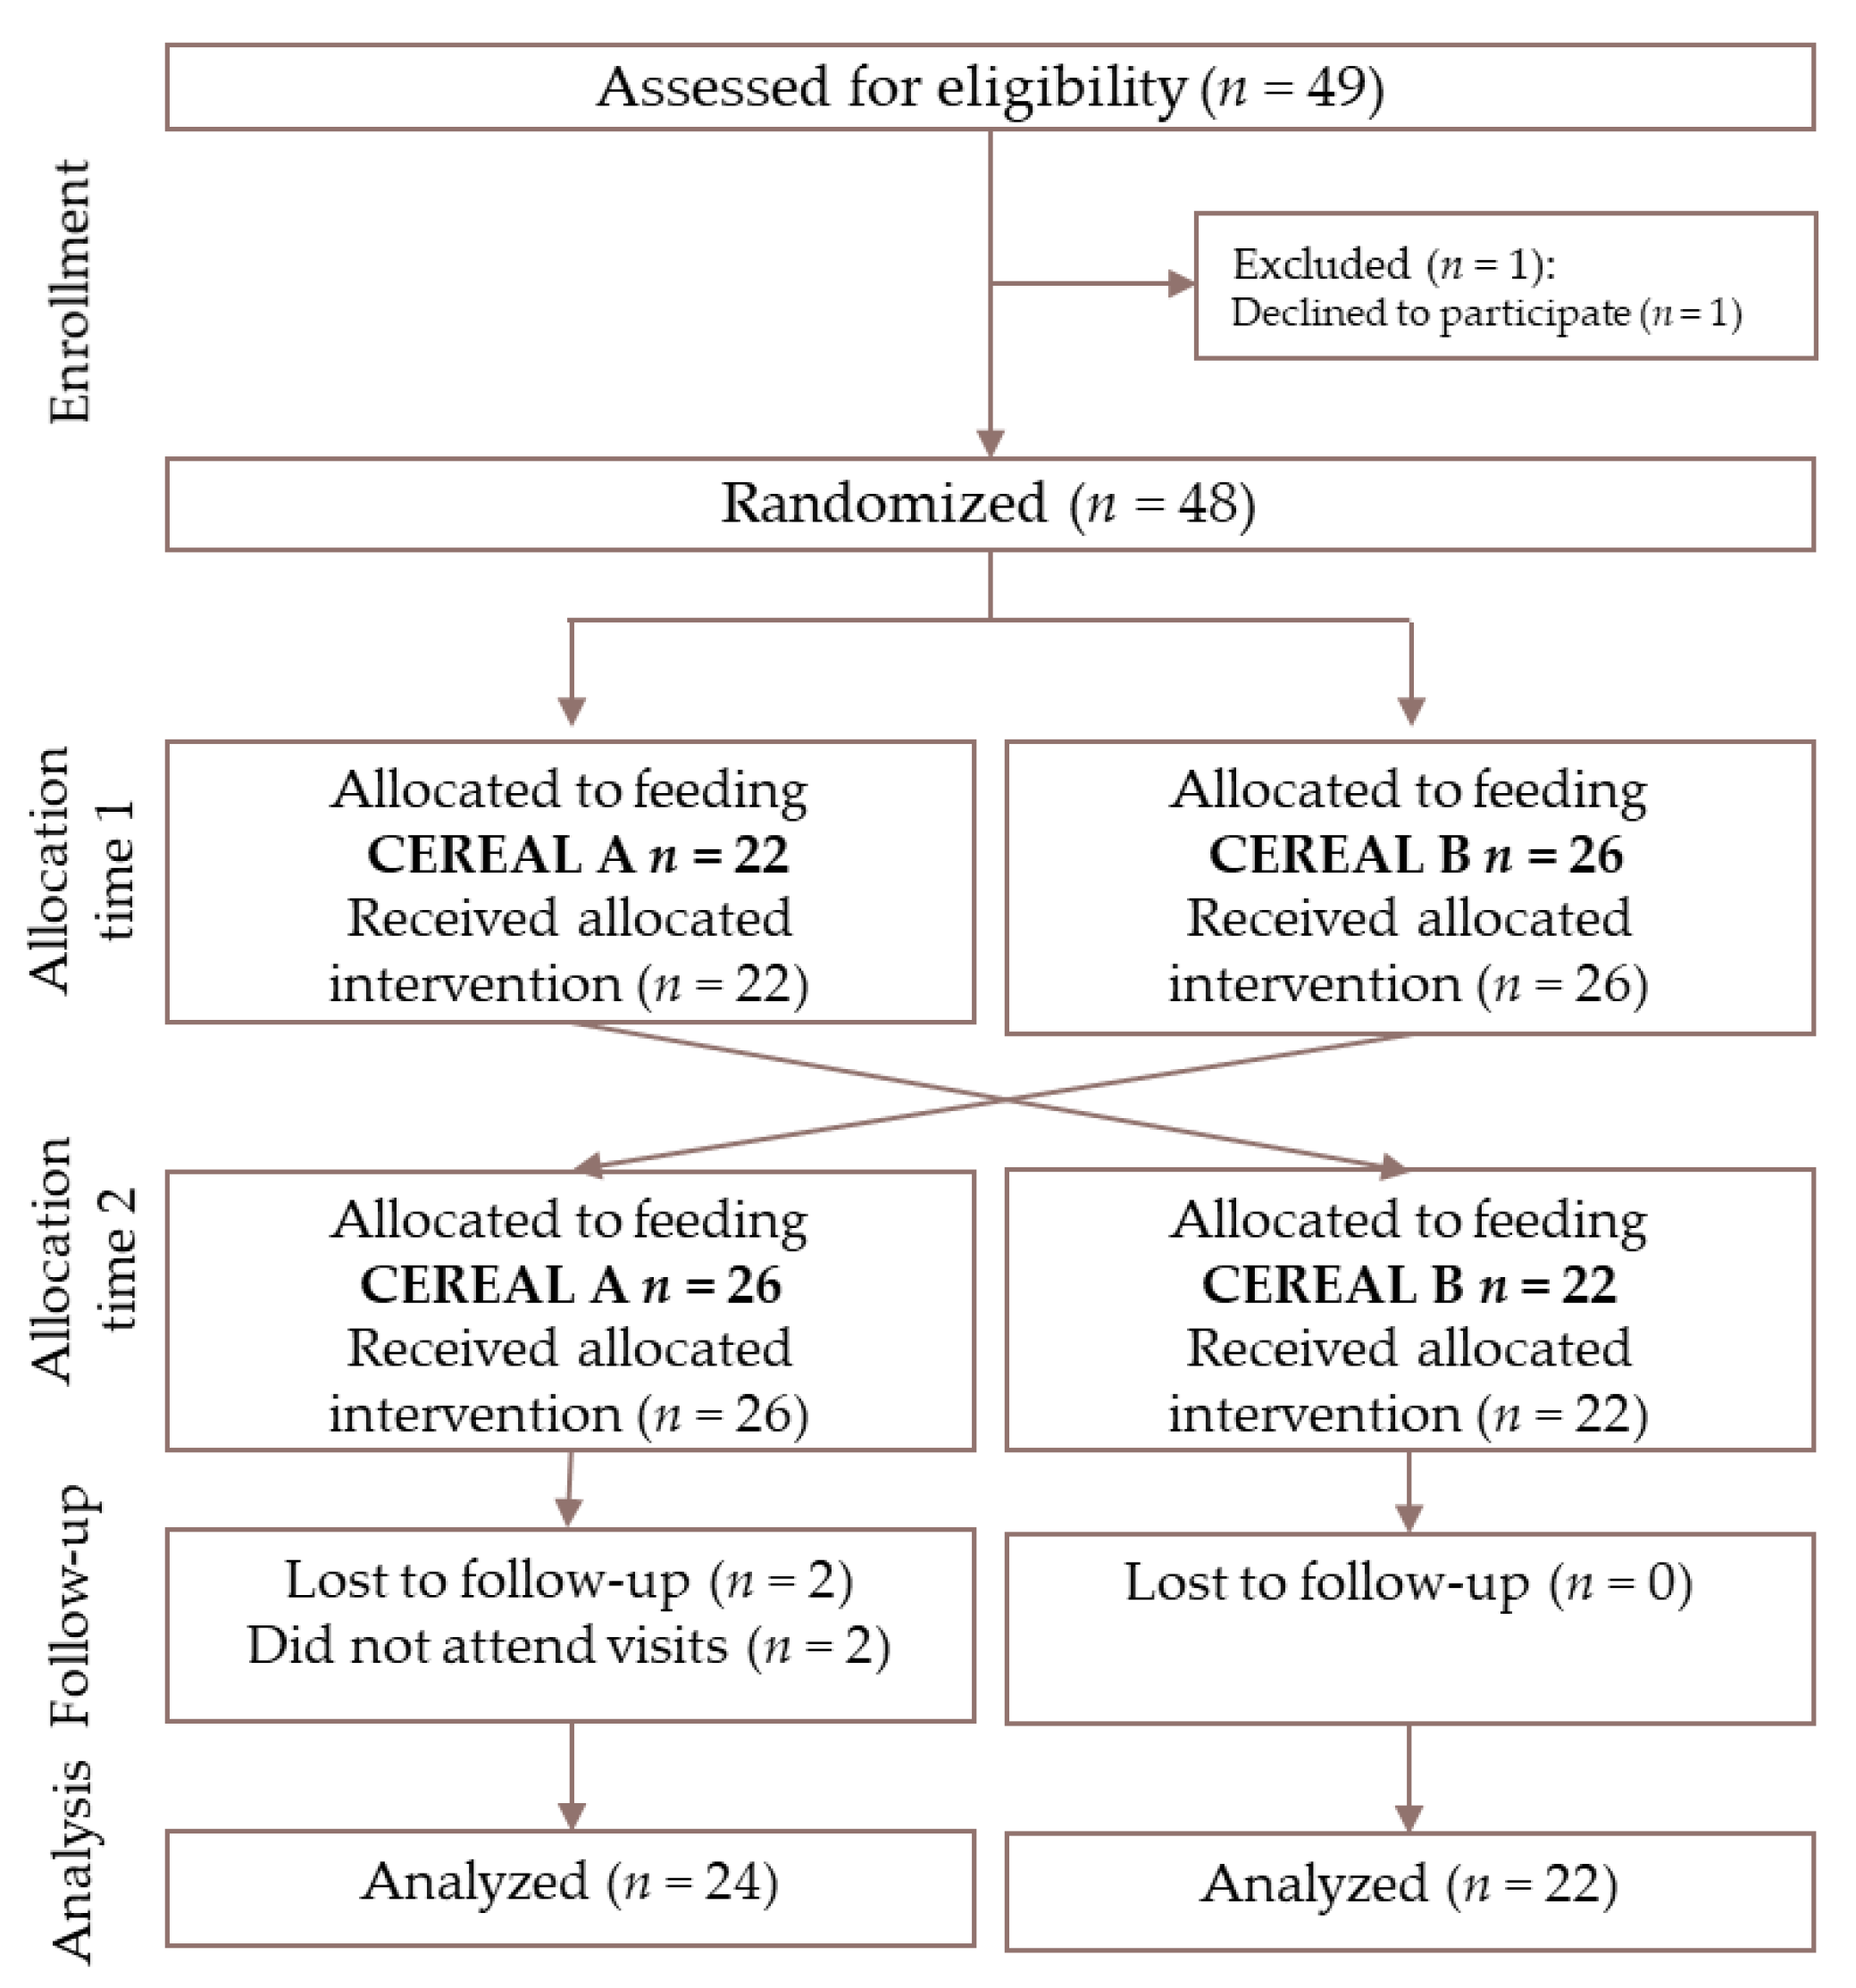
2.1. Subjects
2.2. Products
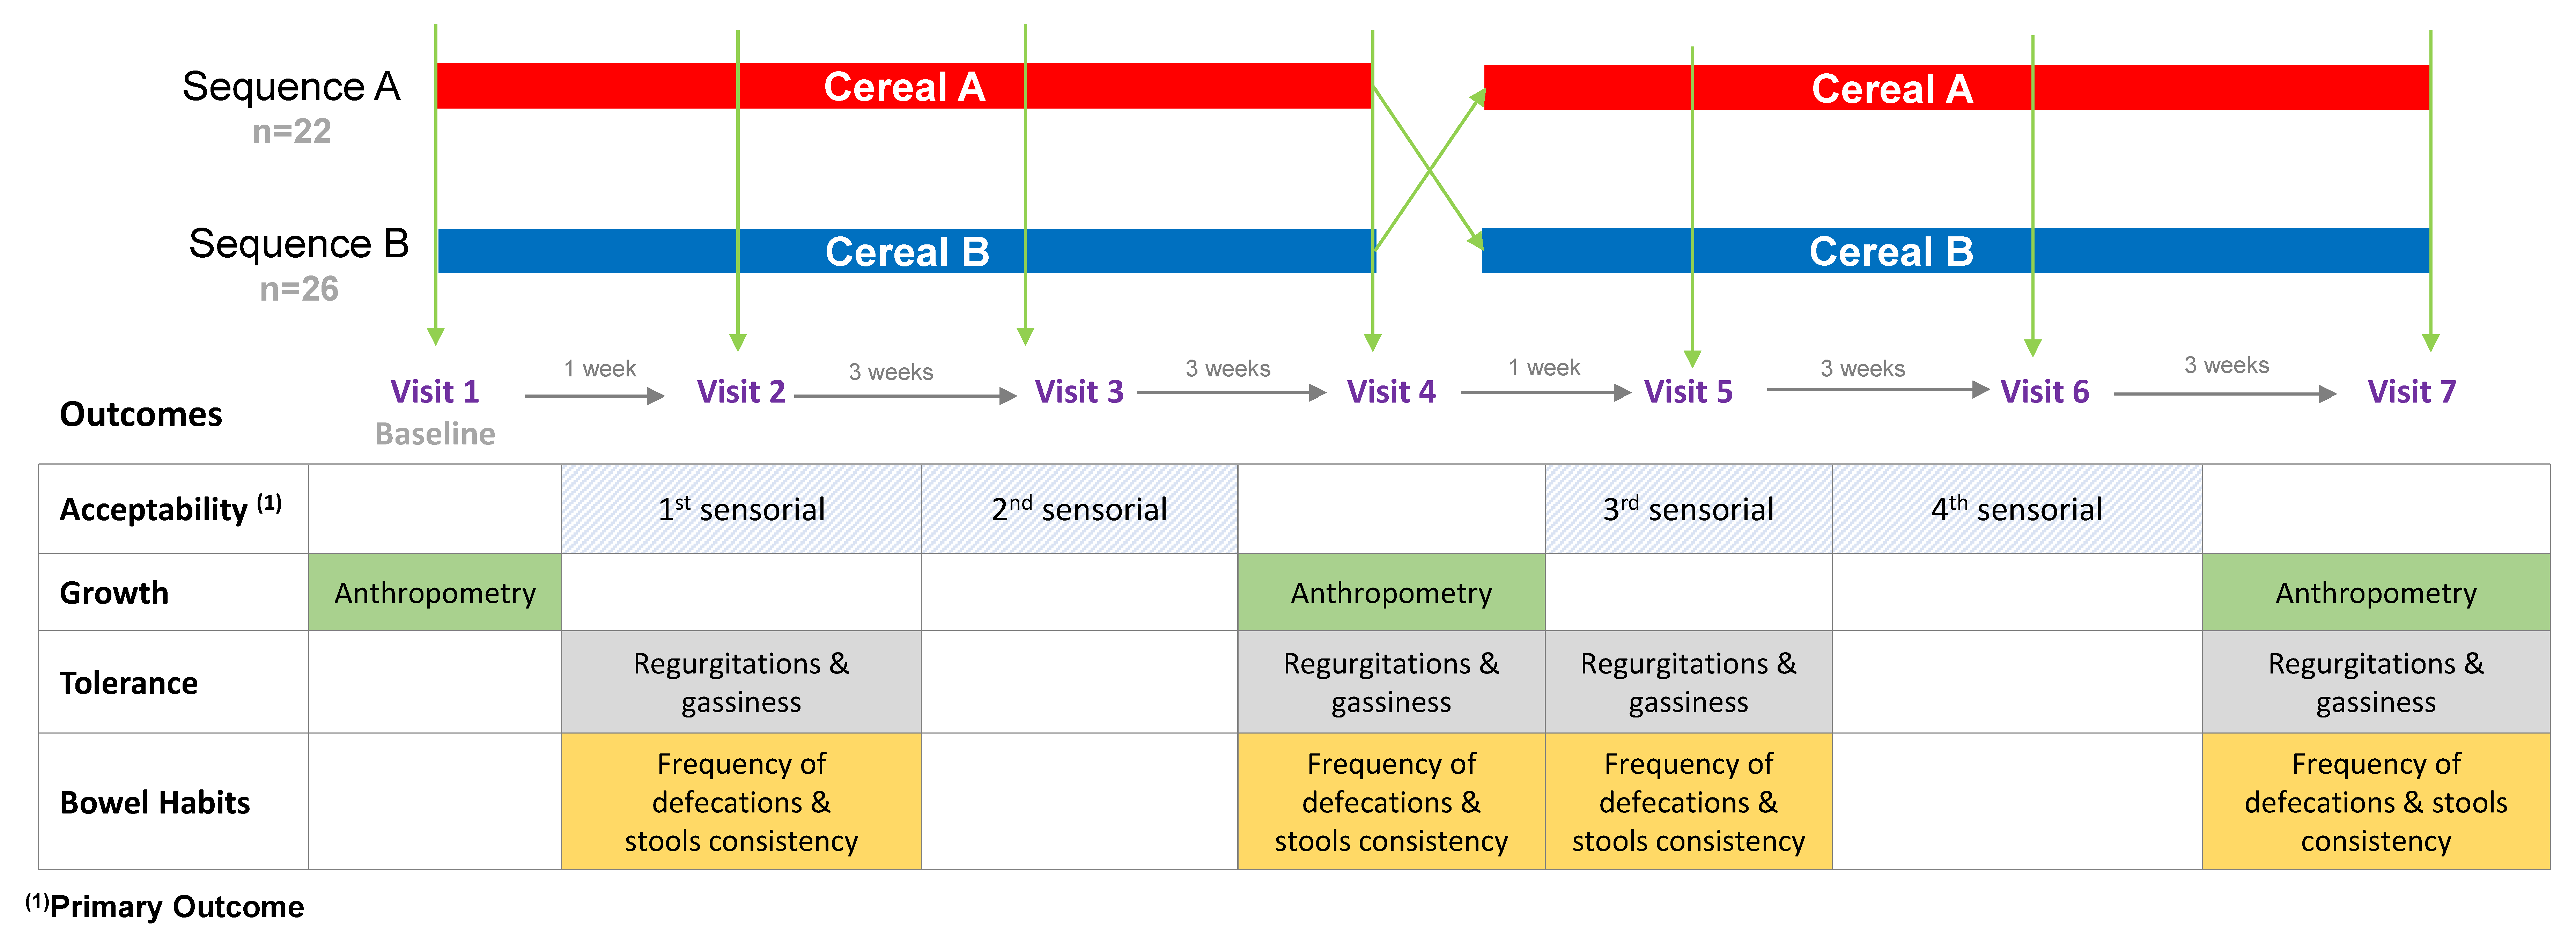
2.3. Study Design
2.4. Data Collection and Study Outcomes
2.4.1. Sensory Acceptability
2.4.2. Other Secondary Outcomes
Anthropometric Measurements
Gastrointestinal Tolerance
Bowel Habits
Adverse Events
2.5. Data Analysis
3. Results
3.1. Subjects Characteristics or Characteristics of Study Population
3.2. Sensory Acceptability
3.3. Other Secondary Outcomes
3.3.1. Anthropometric Measurements
3.3.2. Gastrointestinal Tolerance
3.3.3. Bowel Habits
3.3.4. Adverse Events
4. Discussion
5. Conclusions
Author Contributions
Funding
Acknowledgments
Conflicts of Interest
References
- Agostoni, C.; Decsi, T.; Fewtrell, M.; Goulet, O.; Kolacek, S.; Koletzko, B.; Michaelsen, K.F.; Moreno, L.; Puntis, J.; Rigo, J.; et al. Complementary feeding: A commentary by the ESPGHAN Committee on Nutrition. J. Pediatr. Gastroenterol. Nutr. 2008, 46, 99–110. [Google Scholar] [CrossRef] [PubMed] [Green Version]
- De Cosmi, V.; Scaglioni, S.; Agostoni, C. Early taste experiences and later food choices. Nutrients 2017, 9, 107. [Google Scholar] [CrossRef] [PubMed] [Green Version]
- Maier-Noth, A.; Schaal, B.; Leathwood, P.; Issanchou, S. The lasting influences of early food-related variety experience: A longitudinal study of vegetable acceptance from 5 months to 6 years in two populations. PLoS ONE 2016, 11, e0151356. [Google Scholar] [CrossRef] [PubMed] [Green Version]
- Nicklaus, S. The role of food experiences during early childhood in food pleasure learning. Appetite 2016, 104, 3–9. [Google Scholar] [CrossRef] [PubMed]
- Willett, W.; Rockstrom, J.; Loken, B.; Springmann, M.; Lang, T.; Vermeulen, S.; Garnett, T.; Tilman, D.; DeClerck, F.; Wood, A.; et al. Food in the Anthropocene: The EAT-Lancet Commission on healthy diets from sustainable food systems. Lancet 2019, 393, 447–492. [Google Scholar] [CrossRef]
- World Health Organization; Food and Agriculture Organization of the United Nations. Sustainable Healthy Diets: Guiding Principles; Food & Agriculture Organization: Rome, Italy, 2019. [Google Scholar]
- World Health Organization. Guideline: Sugars Intake for Adults and Children; World Health Organization: Geneva, Switzerland, 2015. [Google Scholar]
- Fewtrell, M.; Bronsky, J.; Campoy, C.; Domellof, M.; Embleton, N.; Mis, N.F.; Hojsak, I.; Hulst, J.M.; Indrio, F.; Lapillonne, A.; et al. Complementary feeding: A position paper by the European Society for Paediatric Gastroenterology, Hepatology, and Nutrition (ESPGHAN) Committee on Nutrition. J. Pediatr. Gastroenterol. Nutr. 2017, 64, 119–132. [Google Scholar] [CrossRef]
- Fidler Mis, N.; Braegger, C.; Bronsky, J.; Campoy, C.; Domellof, M.; Embleton, N.D.; Hojsak, I.; Hulst, J.; Indrio, F.; Lapillonne, A.; et al. Sugar in infants, children and adolescents: A position paper of the European Society for Paediatric Gastroenterology, Hepatology and Nutrition Committee on Nutrition. J. Pediatr. Gastroenterol. Nutr. 2017, 65, 681–696. [Google Scholar] [CrossRef] [Green Version]
- Vos, M.B.; Kaar, J.L.; Welsh, J.A.; Van Horn, L.V.; Feig, D.I.; Anderson, C.A.M.; Patel, M.J.; Cruz Munos, J.; Krebs, N.F.; Xanthakos, S.A.; et al. Added Sugars and cardiovascular disease risk in children: A scientific statement from the American Heart Association. Circulation 2017, 135, e1017–e1034. [Google Scholar] [CrossRef] [Green Version]
- Klerks, M.; Bernal, M.J.; Roman, S.; Bodenstab, S.; Gil, A.; Sanchez-Siles, L.M. Infant cereals: Current status, challenges, and future opportunities for whole grains. Nutrients 2019, 11, 473. [Google Scholar] [CrossRef] [Green Version]
- National Health and Medical Research Council. A Modelling System to Inform the Revision of the Australian Guide to Healthy Eating. Natl. Health Med. Res. Counc. Dep. Health Ageing Aust. Gov. 2011. Available online: https://www.eatforhealth.gov.au/sites/default/files/files/public_consultation/n55a_dietary_guidelines_food_modelling_111216.pdf (accessed on 21 March 2020).
- Varea Calderón, V.; Dalmau Serra, J.; Lama More, R.; Leis Trabazo, R. Papel de los cereales en la alimentación infantil. Acta Pediátr. Esp. 2013, 71, 91–98. [Google Scholar]
- USDA. Child and Adult Care Food Program: Meal pattern revisions related to the Healthy, Hunger-Free Kids Act of 2010. Final Rule. Fed. Regist. 2016, 81, 24348–24383. [Google Scholar]
- Thielecke, F.; Nugent, A.P. Contaminants in grain—A major risk for whole grain safety? Nutrients 2018, 10, 1213. [Google Scholar] [CrossRef] [PubMed] [Green Version]
- Caroli, M.; Mele, R.M.; Tomaselli, M.A.; Cammisa, M.; Longo, F.; Attolini, E. Complementary feeding patterns in Europe with a special focus on Italy. Nutr. Metab. Cardiovasc. Dis. 2012, 22, 813–818. [Google Scholar] [CrossRef]
- Freeman, V.; van’t Hof, M.; Haschke, F.; Euro-Growth Study Group. Patterns of milk and food intake in infants from birth to age 36 months: The Euro-growth study. J. Pediatr. Gastroenterol. Nutr. 2000, 31, S76–S85. [Google Scholar] [CrossRef]
- Siega-Riz, A.M.; Deming, D.M.; Reidy, K.C.; Fox, M.K.; Condon, E.; Briefel, R.R. Food consumption patterns of infants and toddlers: Where are we now? J. Am. Diet. Assoc. 2010, 110, S38–S51. [Google Scholar] [CrossRef]
- Roos, N.; Sorensen, J.C.; Sorensen, H.; Rasmussen, S.K.; Briend, A.; Yang, Z.; Huffman, S.L. Screening for anti-nutritional compounds in complementary foods and food aid products for infants and young children. Matern Child Nutr. 2013, 9 (Suppl. S1), 47–71. [Google Scholar] [CrossRef]
- Swanepoel, E.; Havemann-Nel, L.; Rothman, M.; Laubscher, R.; Matsungo, T.M.; Smuts, C.M.; Faber, M. Contribution of commercial infant products and fortified staple foods to nutrient intake at ages 6, 12, and 18 months in a cohort of children from a low socio-economic community in South Africa. Matern Child Nutr. 2019, 15, e12674. [Google Scholar] [CrossRef] [Green Version]
- Rito, A.I.; Dinis, A.; Rascoa, C.; Maia, A.; de Carvalho Martins, I.; Santos, M.; Lima, J.; Mendes, S.; Padrao, J.; Stein-Novais, C. Improving breakfast patterns of portuguese children-an evaluation of ready-to-eat cereals according to the European nutrient profile model. Eur. J. Clin. Nutr. 2019, 73, 465–473. [Google Scholar] [CrossRef]
- Bernal, M.J.; Haro, F.J.; Roman, S.; Bodenstab, S.; Sanchez-Siles, L.M. Simple sugars intake from infant cereals in Spain. A web-based cereals dietary questionnaire. In Proceedings of the 48th Annual Meeting of the European Society for Paediatric Gastroenterology, Hepatology and Nutrition, Amsterdam, The Netherlands, 6–9 May 2015. [Google Scholar]
- U.S. Department of Agriculture (USDA), Agricultural Research Service. FoodData Central 2020. Available online: https://fdc.nal.usda.gov/ (accessed on 4 June 2020).
- Reynolds, A.; Mann, J.; Cummings, J.; Winter, N.; Mete, E.; Te Morenga, L. Carbohydrate quality and human health: A series of systematic reviews and meta-analyses. Lancet 2019, 393, 434–445. [Google Scholar] [CrossRef] [Green Version]
- World Medical Association. World Medical Association declaration of Helsinki: Ethical principles for medical research involving human subjects. JAMA 2013, 310, 2191–2194. [Google Scholar] [CrossRef] [PubMed] [Green Version]
- Commission Directive 2006/125/EC of 5 December 2006 on Processed Cereal-Based Foods and Baby Foods for Infants and Young Children; OJ L 339, 6.12.2006; European Union: Brussels, Belgium; pp. 16–35. Available online: https://eur-lex.europa.eu/legal-content/EN/TXT/PDF/?uri=CELEX:32006L0125&from=EN (accessed on 12 January 2020).
- Commission Regulation (EC) No 1881/2006 of 19 December 2006 Setting Maximum Levels for Certain Contaminants in Foodstuffs; OJ L 364, 20.12.2006; European Union: Brussels, Belgium, pp. 5–24 and further modifications; Available online: https://eur-lex.europa.eu/legal-content/EN/TXT/PDF/?uri=CELEX:32006R1881&from=EN (accessed on 12 January 2020).
- Frontela, C. Efecto de la Adición de Fitasa Sobre la Biodisponibilidad Mineral In Vitro en Papillas Infantiles. Ph.D. Thesis, Facultad de Veterinaria, Universidad de Murcia, Murcia, Spain, 2007. [Google Scholar]
- Haro-Vicente, J.F.; Bernal-Cava, M.J.; Lopez-Fernandez, A.; Ros-Berruezo, G.; Bodenstab, S.; Sanchez-Siles, L.M. Sensory acceptability of infant cereals with whole grain in infants and young children. Nutrients 2017, 9, 65. [Google Scholar] [CrossRef] [PubMed] [Green Version]
- Lange, C.; Visalli, M.; Jacob, S.; Chabanet, C.; Schlich, P.; Nicklaus, S. Maternal feeding practices during the first year and their impact on infants’ acceptance of complementary food. Food Qual. Prefer. 2013, 29, 89–98. [Google Scholar] [CrossRef]
- Schwartz, C.; Chabanet, C.; Lange, C.; Issanchou, S.; Nicklaus, S. The role of taste in food acceptance at the beginning of complementary feeding. Physiol. Behav. 2011, 104, 646–652. [Google Scholar] [CrossRef] [PubMed]
- Veereman-Wauters, G.; Staelens, S.; Van de Broek, H.; Plaskie, K.; Wesling, F.; Roger, L.C.; McCartney, A.L.; Assam, P. Physiological and bifidogenic effects of prebiotic supplements in infant formulae. J. Pediatr. Gastroenterol. Nutr. 2011, 52, 763–771. [Google Scholar] [CrossRef]
- Ashley, C.; Johnston, W.H.; Harris, C.L.; Stolz, S.I.; Wampler, J.L.; Berseth, C.L. Growth and tolerance of infants fed formula supplemented with polydextrose (PDX) and/or galactooligosaccharides (GOS): Double-blind, randomized, controlled trial. Nutr. J. 2012, 11. [Google Scholar] [CrossRef] [Green Version]
- Piemontese, P.; Gianni, M.L.; Braegger, C.P.; Chirico, G.; Gruber, C.; Riedler, J.; Arslanoglu, S.; van Stuijvenberg, M.; Boehm, G.; Jelinek, J.; et al. Tolerance and safety evaluation in a large cohort of healthy infants fed an innovative prebiotic formula: A randomized controlled trial. PLoS ONE 2011, 6, e28010. [Google Scholar] [CrossRef] [Green Version]
- Guideline, I.H. Integrated addendum to ICH E6 (R1): Guideline for good clinical practice E6 (R2). Curr. Step 2015, 2, 1–60. [Google Scholar]
- Senn, S.S. Cross-Over Trials in Clinical Research; John Wiley & Sons: Hoboken, NJ, USA, 2002; Volume 5. [Google Scholar]
- Mura Paroche, M.; Caton, S.J.; Vereijken, C.; Weenen, H.; Houston-Price, C. How Infants and young children learn about food: A Systematic review. Front Psychol. 2017, 8, 1046. [Google Scholar] [CrossRef] [Green Version]
- Ventura, A.K.; Worobey, J. Early influences on the development of food preferences. Curr. Biol. 2013, 23, R401–R408. [Google Scholar] [CrossRef] [Green Version]
- Mennella, J.A. Ontogeny of taste preferences: Basic biology and implications for health. Am. J. Clin. Nutr. 2014, 99, 704S–711S. [Google Scholar] [CrossRef] [Green Version]
- Martin, C.R.; Ling, P.R.; Blackburn, G.L. Review of infant feeding: Key features of breast milk and infant formula. Nutrients 2016, 8, 279. [Google Scholar] [CrossRef] [PubMed] [Green Version]
- Mastorakou, D.; Ruark, A.; Weenen, H.; Stahl, B.; Stieger, M. Sensory characteristics of human milk: Association between mothers’ diet and milk for bitter taste. J. Dairy Sci. 2019, 102, 1116–1130. [Google Scholar] [CrossRef] [PubMed] [Green Version]
- Forestell, C.A. Flavor perception and preference development in human infants. Ann. Nutr. Metab. 2017, 70 (Suppl. S3), 17–25. [Google Scholar] [CrossRef] [PubMed] [Green Version]
- Rosenstein, D.; Oster, H. Differential facial responses to four basic tastes in newborns. Child Dev. 1988, 59, 1555–1568. [Google Scholar] [CrossRef]
- Ventura, A.K.; Mennella, J.A. Innate and learned preferences for sweet taste during childhood. Curr. Opin. Clin. Nutr. Metab. Care 2011, 14, 379–384. [Google Scholar] [CrossRef] [Green Version]
- van de Velde, F.; de Hoog, E.H.; Oosterveld, A.; Tromp, R.H. Protein-polysaccharide interactions to alter texture. Annu. Rev. Food Sci. Technol. 2015, 6, 371–388. [Google Scholar] [CrossRef]
- Azais-Braesco, V.; Sluik, D.; Maillot, M.; Kok, F.; Moreno, L.A. A review of total & added sugar intakes and dietary sources in Europe. Nutr. J. 2017, 16, 6. [Google Scholar] [CrossRef] [Green Version]
- Slavin, J. Whole grains and digestive health. Cereal Chem. 2010, 87, 292–296. [Google Scholar] [CrossRef]
- Stewart, M.L.; Schroeder, N.M. Dietary treatments for childhood constipation: Efficacy of dietary fiber and whole grains. Nutr. Rev. 2013, 71, 98–109. [Google Scholar] [CrossRef]
- Tunc, V.T.; Camurdan, A.D.; Ilhan, M.N.; Sahin, F.; Beyazova, U. Factors associated with defecation patterns in 0-24-month-old children. Eur. J. Pediatr. 2008, 167, 1357–1362. [Google Scholar] [CrossRef] [PubMed]
- Grasten, S.M.; Juntunen, K.S.; Poutanen, K.S.; Gylling, H.K.; Miettinen, T.A.; Mykkanen, H.M. Rye bread improves bowel function and decreases the concentrations of some compounds that are putative colon cancer risk markers in middle-aged women and men. J. Nutr. 2000, 130, 2215–2221. [Google Scholar] [CrossRef] [PubMed]
- Ma, G.; Jin, Y.; Piao, J.; Kok, F.; Guusje, B.; Jacobsen, E. Phytate, calcium, iron, and zinc contents and their molar ratios in foods commonly consumed in China. J. Agric. Food Chem. 2005, 53, 10285–10290. [Google Scholar] [CrossRef] [PubMed]
- Hurrell, R.F. Phytic acid degradation as a means of improving iron absorption. Int. J. Vitam. Nutr. Res. 2004, 74, 445–452. [Google Scholar] [CrossRef] [PubMed]
- Perlas, L.A.; Gibson, R.S. Household dietary strategies to enhance the content and bioavailability of iron, zinc and calcium of selected rice- and maize-based Philippine complementary foods. Matern. Child Nutr. 2005, 1, 263–273. [Google Scholar] [CrossRef] [PubMed]
- Frontela, C.; Haro, J.F.; Ros, G.; Martinez, C. Effect of dephytinization and follow-on formula addition on in vitro iron, calcium, and zinc availability from infant cereals. J. Agric. Food Chem. 2008, 56, 3805–3811. [Google Scholar] [CrossRef] [PubMed]
- Lind, T.; Lonnerdal, B.; Persson, L.A.; Stenlund, H.; Tennefors, C.; Hernell, O. Effects of weaning cereals with different phytate contents on hemoglobin, iron stores, and serum zinc: A randomized intervention in infants from 6 to 12 mo of age. Am. J. Clin. Nutr. 2003, 78, 168–175. [Google Scholar] [CrossRef] [Green Version]
- Lind, T.; Persson, L.; Lonnerdal, B.; Stenlund, H.; Hernell, O. Effects of weaning cereals with different phytate content on growth, development and morbidity: A randomized intervention trial in infants from 6 to 12 months of age. Acta Paediatr. 2004, 93, 1575–1582. [Google Scholar] [CrossRef]
- Madrelle, J.; Lange, C.; Boutrolle, I.; Valade, O.; Weenen, H.; Monnery-Patris, S.; Issanchou, S.; Nicklaus, S. Development of a new in-home testing method to assess infant food liking. Appetite 2017, 113, 274–283. [Google Scholar] [CrossRef]
- ASTM International. Standard Guide for Sensory Evaluation of Products by Children and Minors. Available online: https://www.astm.org/Standards/E2299.htm (accessed on 13 May 2020).
- Scaglioni, S.; De Cosmi, V.; Ciappolino, V.; Parazzini, F.; Brambilla, P.; Agostoni, C. Factors influencing children’s eating behaviours. Nutrients 2018, 10, 706. [Google Scholar] [CrossRef] [Green Version]
- Román, S.; Sánchez-Siles, L.M. Parents’ choice criteria for infant food brands: A scale development and validation. Food Qual. Prefer. 2018, 64, 1–10. [Google Scholar] [CrossRef]
- Roman, S.; Sánchez-Siles, L.M.; Siegrist, M. The importance of food naturalness for consumers: Results of a systematic review. Trends Food Sci. Technol. 2017, 67, 44–57. [Google Scholar] [CrossRef]
- Sanchez-Siles, L.M.; Michel, F.; Román, S.; Bernal, M.J.; Philipsen, B.; Haro, J.F.; Bodenstab, S.; Siegrist, M. The Food Naturalness Index (FNI): An integrative tool to measure the degree of food naturalness. Trends Food Sci. Technol. 2019, 91, 681–690. [Google Scholar] [CrossRef]


| Nutrients (per 100 g) | Cereal A | Cereal B |
|---|---|---|
| Energy (kcal) | 376 | 375 |
| Protein (g) | 9.85 | 10.13 |
| Carbohydrates (g) | 79.50 | 75.05 |
| Sugars (g) | 24.10 | 12.07 |
| Fat (g) | 1.33 | 2.02 |
| Fiber (g) | 4.03 | 7.21 |
| Calcium (mg) | 160 | 160 |
| Iron (mg) | 6.23 | 8.16 |
| Zinc (mg) | 0.63 | 1.09 |
| Phytate (mg) * | 143.51 | 176.83 |
| Variable | Feeding Sequence | p Value | |
|---|---|---|---|
| AB (n = 22) | BA (n = 24) | ||
| Gender infant, n (%) | 0.777 | ||
| Male | 11 (50) | 11 (46) | |
| Female | 11 (50) | 13 (54) | |
| Birth weight (kg) (mean ± SD) | 3.27± 0.33 | 3.26 ± 0.45 | 0.905 |
| Baseline characteristics | |||
| Age (months) (mean ± SD) | 5.17 ± 0.38 | 5.24 ± 0.42 | 0.564 |
| Weight (kg) (mean ± SD) | 7.41 ± 0.87 | 7.36 ± 0.78 | 0.835 |
| Length (cm) (mean ± SD) | 64.50 ± 2.78 | 65.17 ± 2.51 | 0.397 |
| Head circumference (cm) (mean ± SD) | 42.28 ±1.51 | 42.61 ± 1.36 | 0.441 |
| Outcome of Sensory Acceptability | Visit | Group AB | Group BA | p-Value |
|---|---|---|---|---|
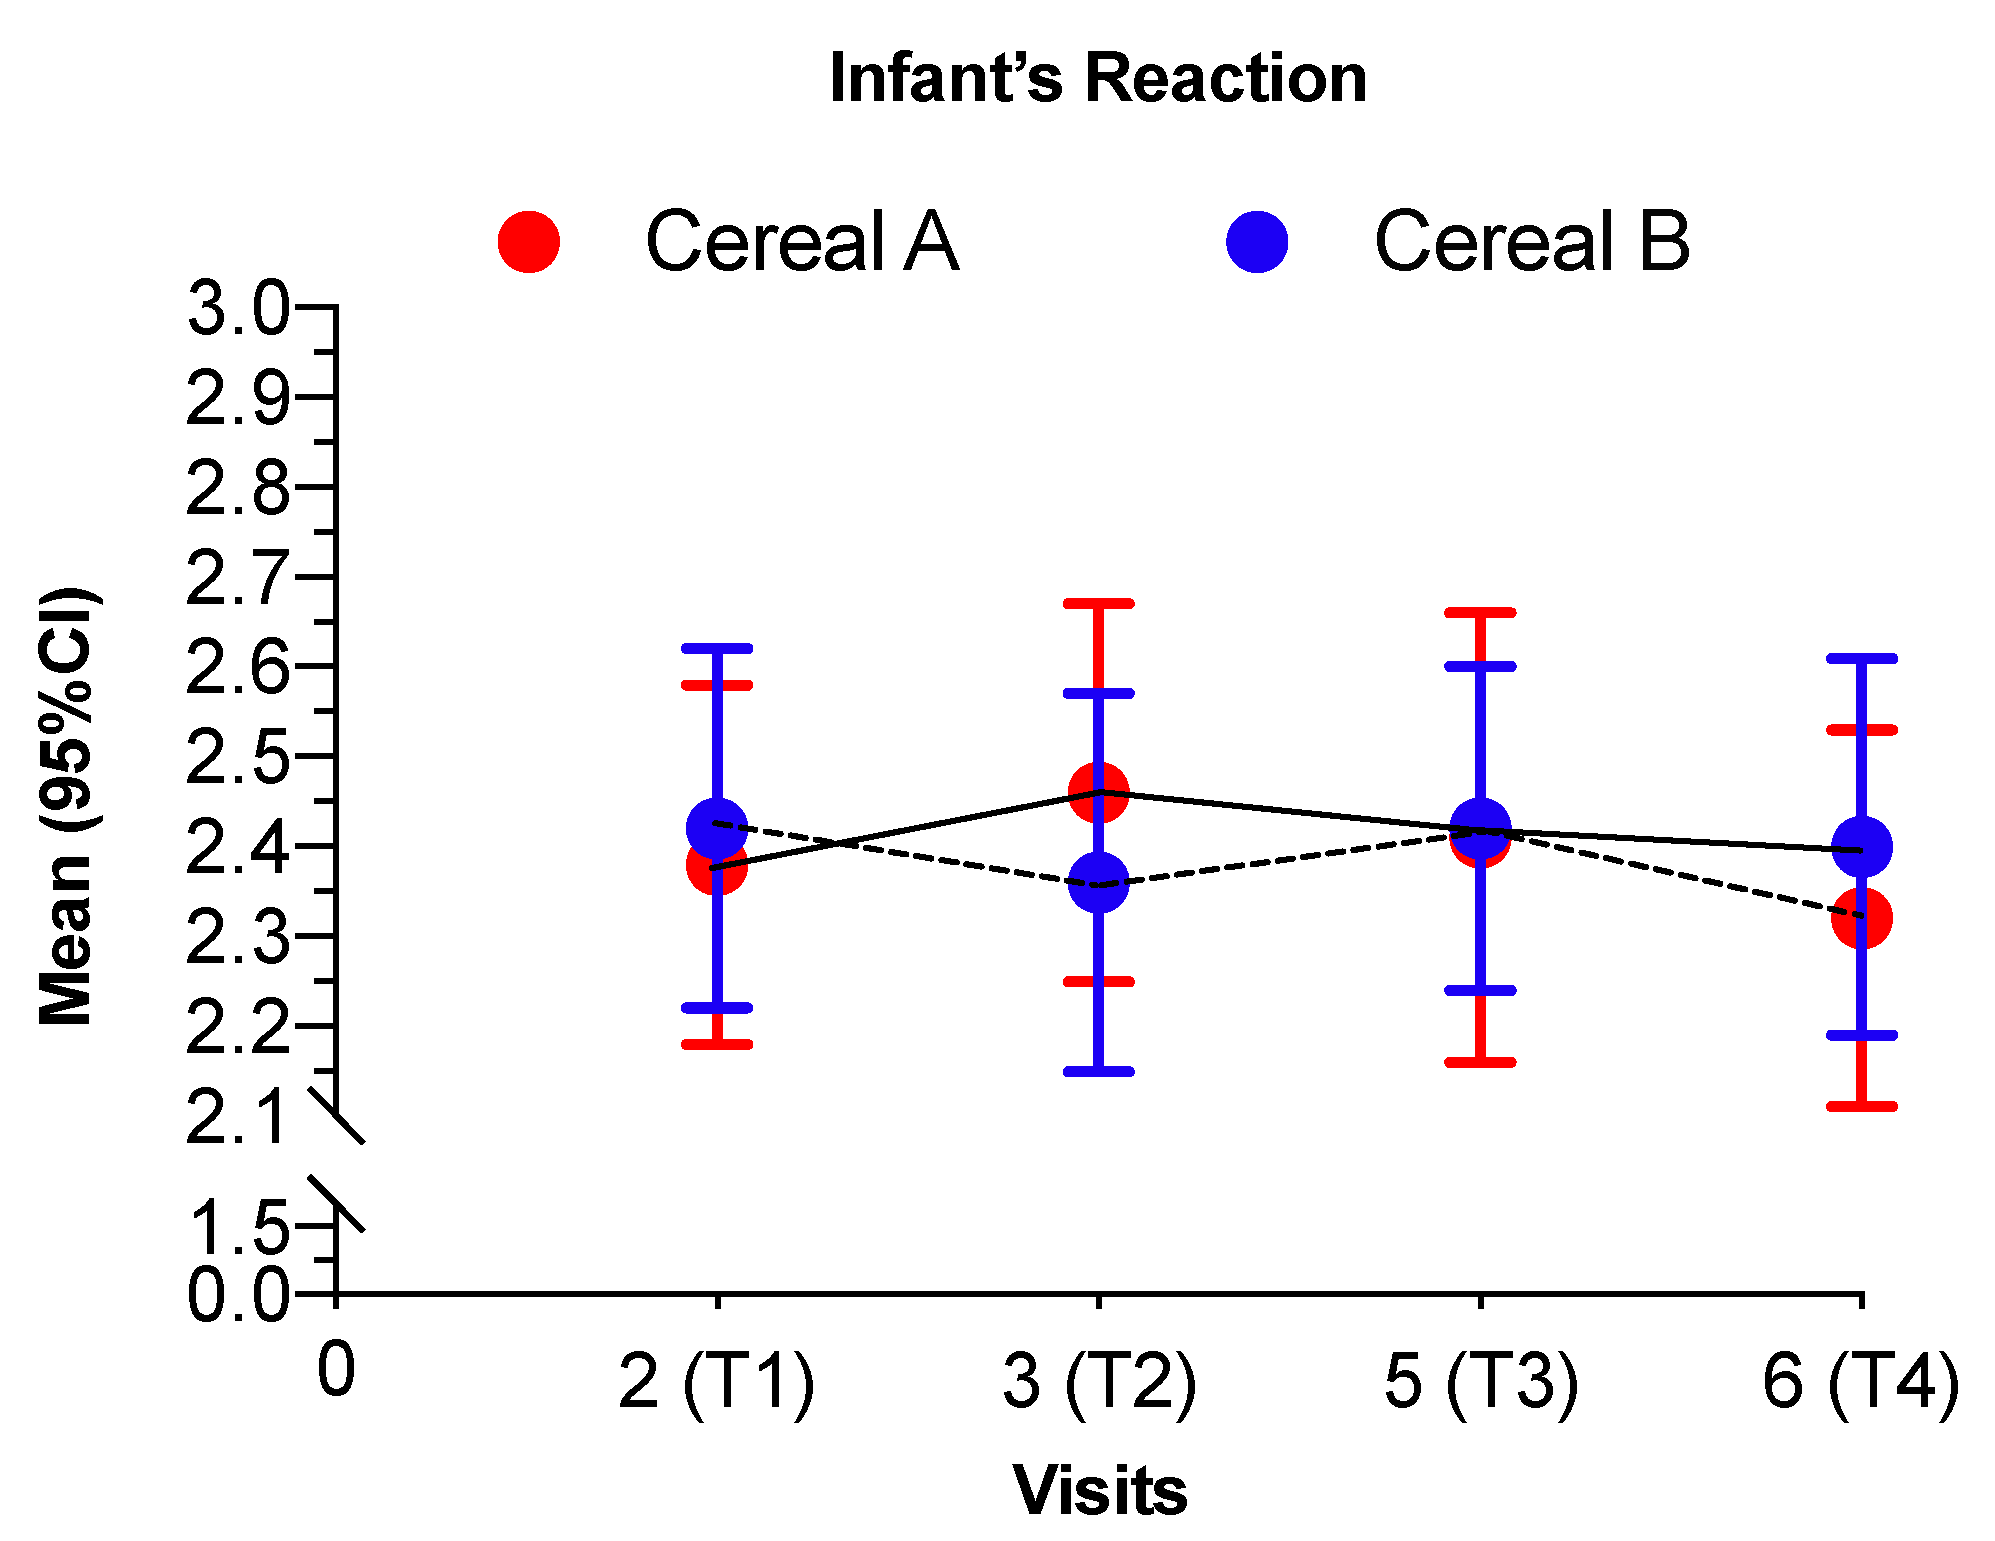
| Infant’s reaction | at T1 | 2.36 (2.13, 2.59) | 2.40 (2.18, 2.62) | 0.8178 |
| T2–T1 | 0.13 (−0.11, 0.37) | −0.03 (−0.25, 0.20) | 0.3461 | |
| T3–T2 | −0.04 (−0.28, 0.20) | 0.08 (−0.14, 0.31) | 0.4550 | |
| T4–T3 | −0.05 (−0.29, 0.19) | −0.13 (−0.35, 0.10) | 0.6580 | |
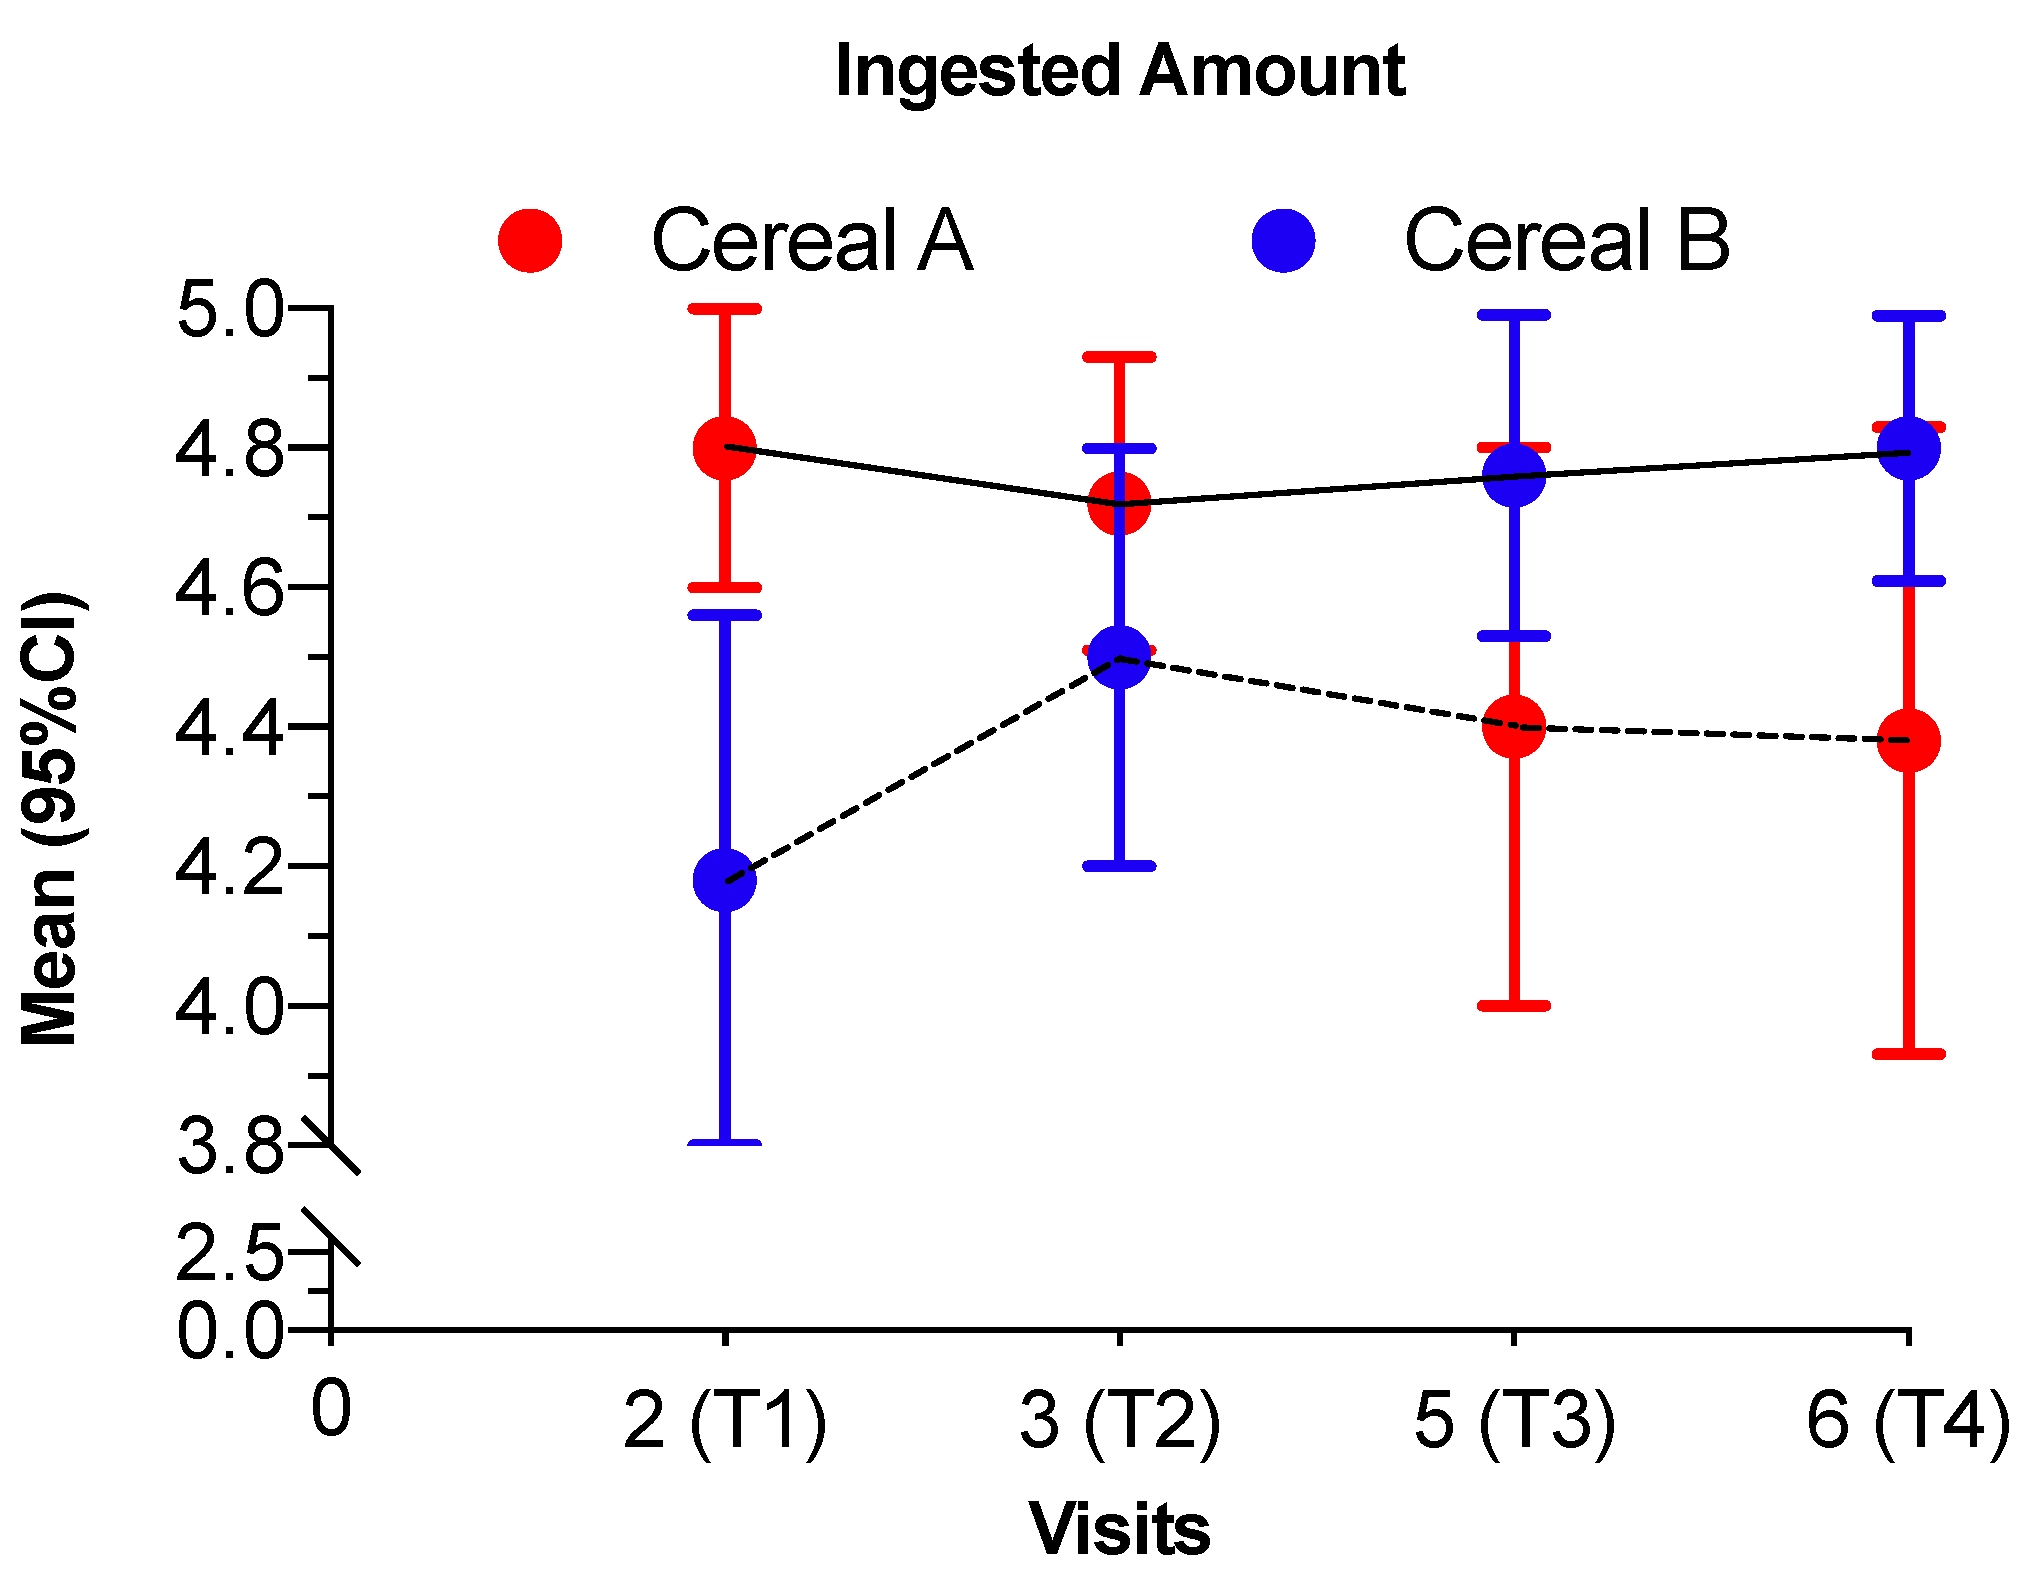
| Ingested amount | at T1 | 4.82 (4.47, 5.16) | 4.17 (3.84, 4.50) | 0.0082 |
| T2–T1 | −0.09 (−0.51, 0.33) | 0.38 (−0.03, 0.78) | 0.1199 | |
| T3–T2 | −0.00 (−0.42, 0.42) | −0.21 (−0.61, 0.20) | 0.4851 | |
| T4–T3 | 0.13 (−0.30, 0.57) | −0.04 (−0.45, 0.36) | 0.5600 | |
| Parent’s taste | at T1 | 4.73 (4.22, 5.24) | 4.81 (4.32, 5.30) | 0.8217 |
| T2–T1 | 0.00 (−0.39, 0.39) | −0.06 (−0.44, 0.32) | 0.8319 | |
| T3–T2 | 0.18 (−0.21, 0.57) | −0.33 (−0.71, 0.04) | 0.0642 | |
| T4–T3 | 0.00 (−0.40, 0.41) | 0.58 (0.21, 0.96) | 0.0407 | |
| Parent’s overall impression | at T1 | 4.86 (4.34, 5.39) | 4.46 (3.96, 4.96) | 0.2764 |
| T2–T1 | −0.09 (−0.49, 0.31) | 0.13 (−0.26, 0.51) | 0.4484 | |
| T3–T2 | −0.14 (−0.54, 0.27) | −0.00 (−0.38, 0.38) | 0.6318 | |
| T4–T3 | 0.01 (−0.40, 0.43) | 0.08 (−0.30, 0.47) | 0.8110 |
| Outcome var. | Time | Group AB | Group BA | p-Value |
|---|---|---|---|---|
| Regurgitation | at T1 | 1.64 (1.11, 2.16) | 1.21 (0.71, 1.71) | 0.2518 |
| T2–T1 | −0.91 (−1.43, −0.39) | −0.08 (−0.58, 0.41) | 0.0245 | |
| T3–T2 | 0.14 (−0.38, 0.65) | 0.06 (−0.43, 0.56) | 0.8397 | |
| T4–T3 | −0.27 (−0.79, 0.24) | −0.35 (−0.85, 0.14) | 0.8235 | |
| Gassiness | at T1 | 1.95 (1.42, 2.49) | 2.10 (1.59, 2.62) | 0.6947 |
| T2–T1 | −0.50 (−0.96, −0.04) | −0.56 (−100, −0.12) | 0.8480 | |
| T3–T2 | 0.09 (−0.37, 0.55) | 0.19 (−0.25, 0.63) | 0.7671 | |
| T4–T3 | −0.50 (−0.96, −0.04) | −0.35 (−0.80, 0.09) | 0.6548 |
| Outcome var. | Time | Group AB | Group BA | p-Value |
|---|---|---|---|---|
| Depositions/day | at T1 | 1.73 (1.39, 2.06) | 1.40 (1.07, 1.72) | 0.1682 |
| T2–T1 | 0.09 (−0.29, 0.48) | 0.19 (−0.18, 0.56) | 0.7225 | |
| T3–T2 | −0.05 (−0.43, 0.34) | 0.09 (−0.27, 0.46) | 0.6089 | |
| T4–T3 | −0.00 (−0.38, 0.38) | −0.07 (−0.44, 0.30) | 0.7887 | |
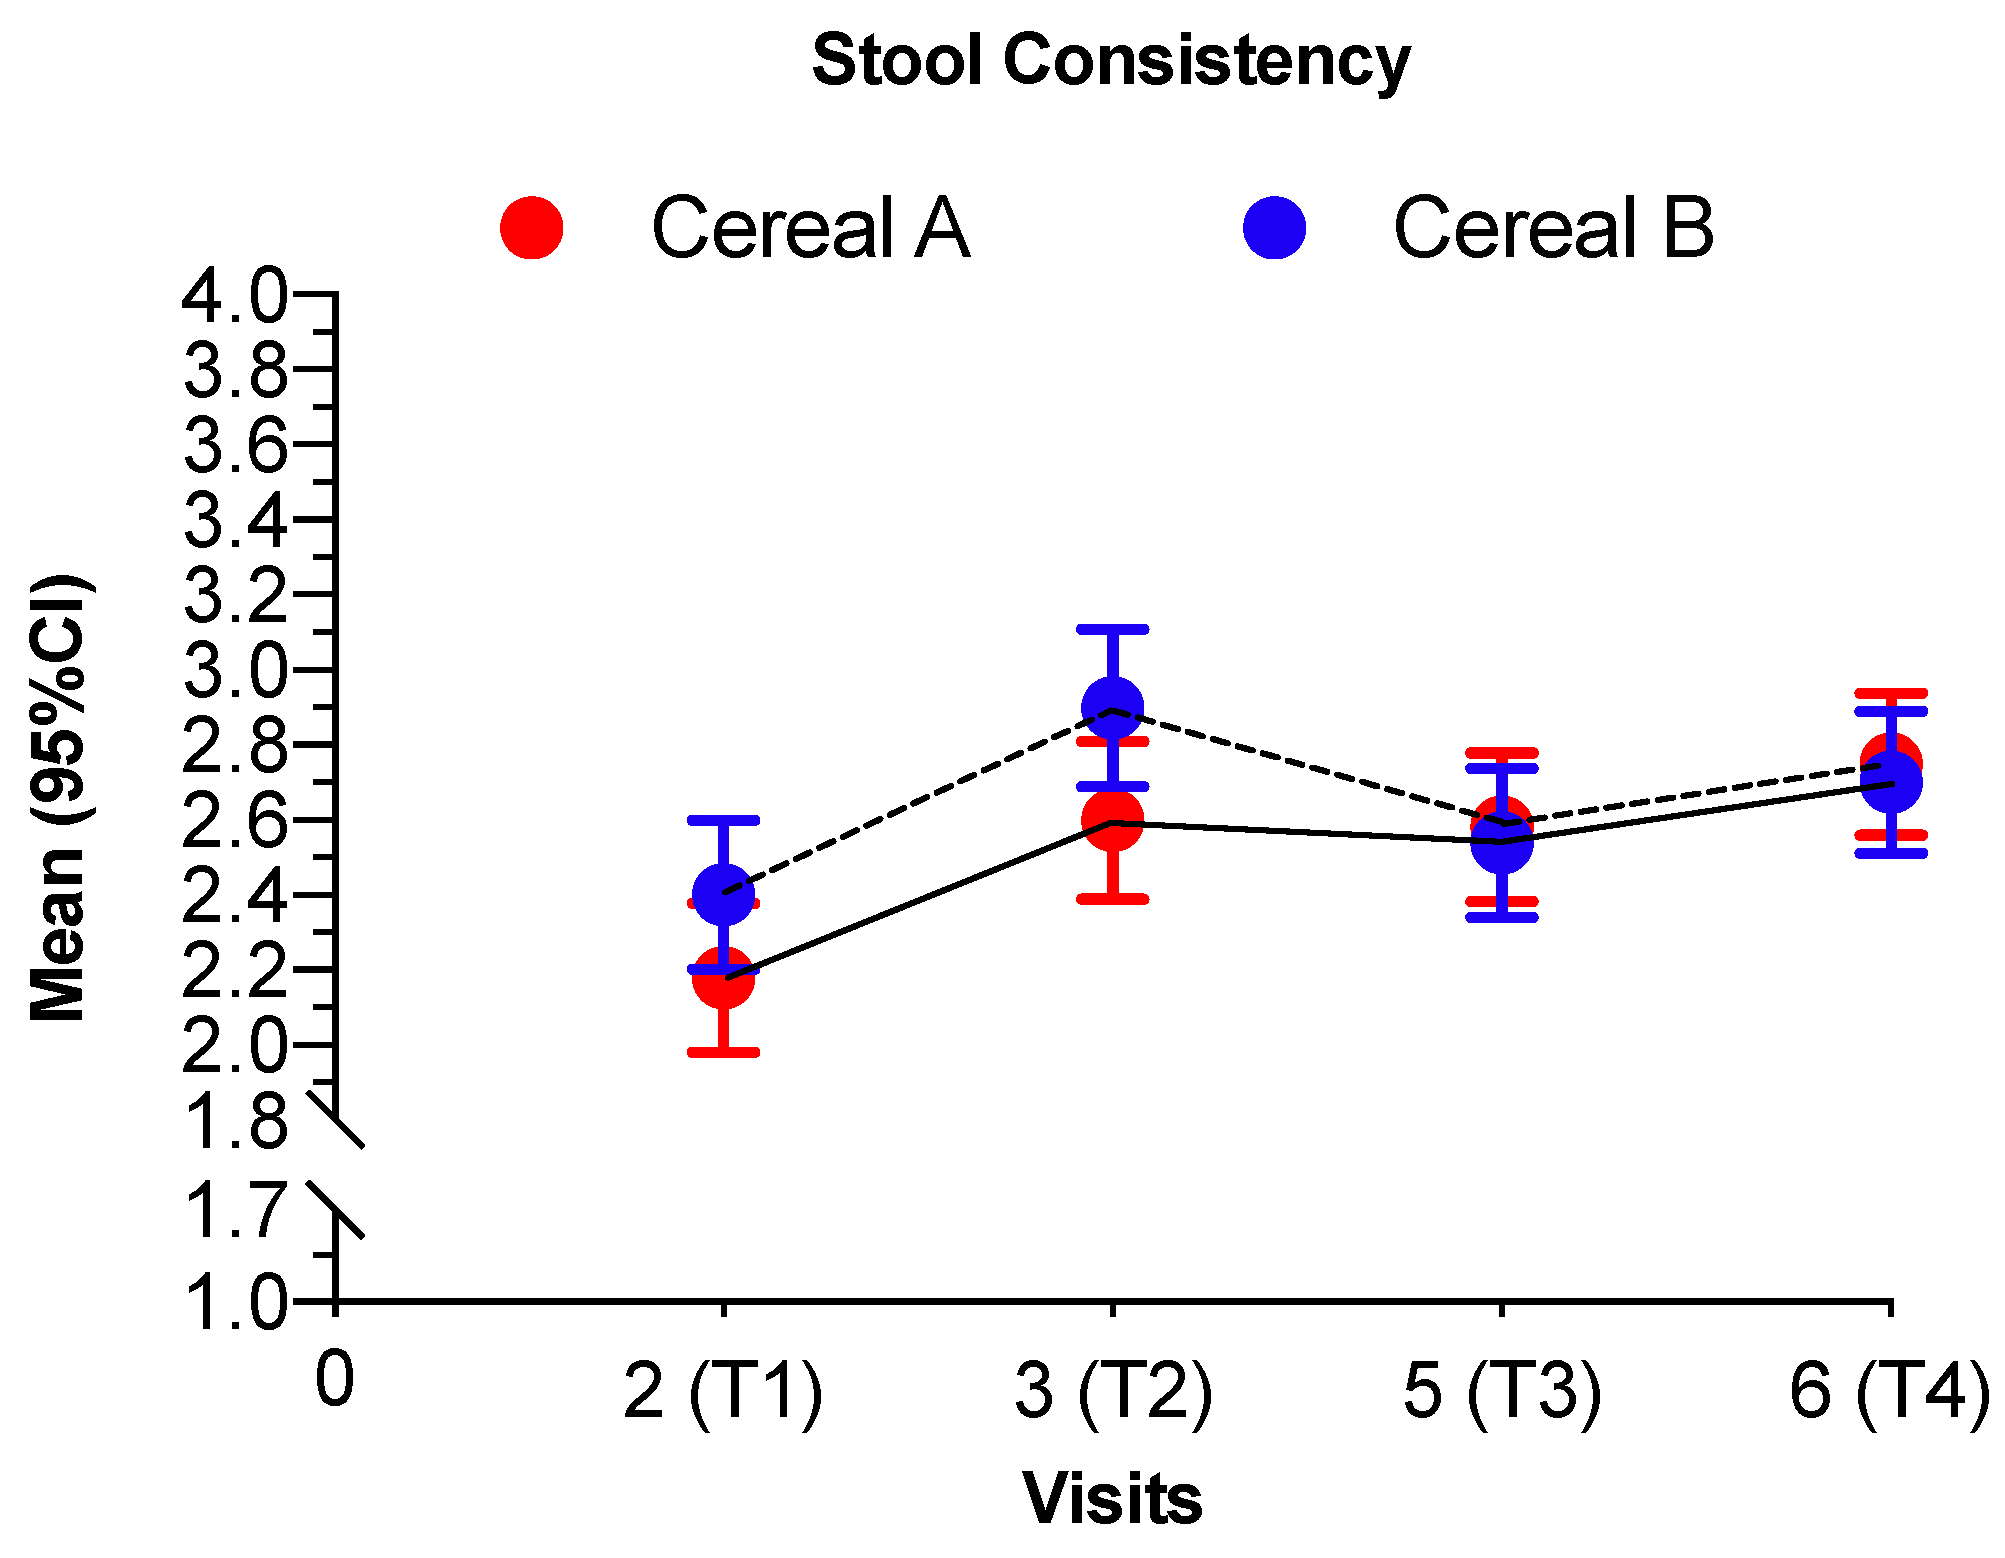
| Stool consistency | at T1 | 2.38 (2.15, 2.61) | 2.39 (2.17, 2.60) | 0.9617 |
| T2–T1 | 0.31 (0.01, 0.62) | 0.55 (0.26, 0.84) | 0.2682 | |
| T3–T2 | 0.02 (−0.28, 0.33) | −0.16 (−0.45, 0.13) | 0.3940 | |
| T4–T3 | 0.03 (−0.28, 0.34) | 0.05 (−0.24, 0.34) | 0.9199 |
© 2020 by the authors. Licensee MDPI, Basel, Switzerland. This article is an open access article distributed under the terms and conditions of the Creative Commons Attribution (CC BY) license (http://creativecommons.org/licenses/by/4.0/).
Share and Cite
Sanchez-Siles, L.M.; Bernal, M.J.; Gil, D.; Bodenstab, S.; Haro-Vicente, J.F.; Klerks, M.; Plaza-Diaz, J.; Gil, Á. Are Sugar-Reduced and Whole Grain Infant Cereals Sensorially Accepted at Weaning? A Randomized Controlled Cross-Over Trial. Nutrients 2020, 12, 1883. https://0-doi-org.brum.beds.ac.uk/10.3390/nu12061883
Sanchez-Siles LM, Bernal MJ, Gil D, Bodenstab S, Haro-Vicente JF, Klerks M, Plaza-Diaz J, Gil Á. Are Sugar-Reduced and Whole Grain Infant Cereals Sensorially Accepted at Weaning? A Randomized Controlled Cross-Over Trial. Nutrients. 2020; 12(6):1883. https://0-doi-org.brum.beds.ac.uk/10.3390/nu12061883
Chicago/Turabian StyleSanchez-Siles, Luis Manuel, Maria Jose Bernal, David Gil, Stefan Bodenstab, Juan Francisco Haro-Vicente, Michelle Klerks, Julio Plaza-Diaz, and Ángel Gil. 2020. "Are Sugar-Reduced and Whole Grain Infant Cereals Sensorially Accepted at Weaning? A Randomized Controlled Cross-Over Trial" Nutrients 12, no. 6: 1883. https://0-doi-org.brum.beds.ac.uk/10.3390/nu12061883