Effectiveness of Interventions to Promote Healthy Eating Habits in Children and Adolescents at Risk of Poverty: Systematic Review and Meta-Analysis


Abstract
:
1. Introduction
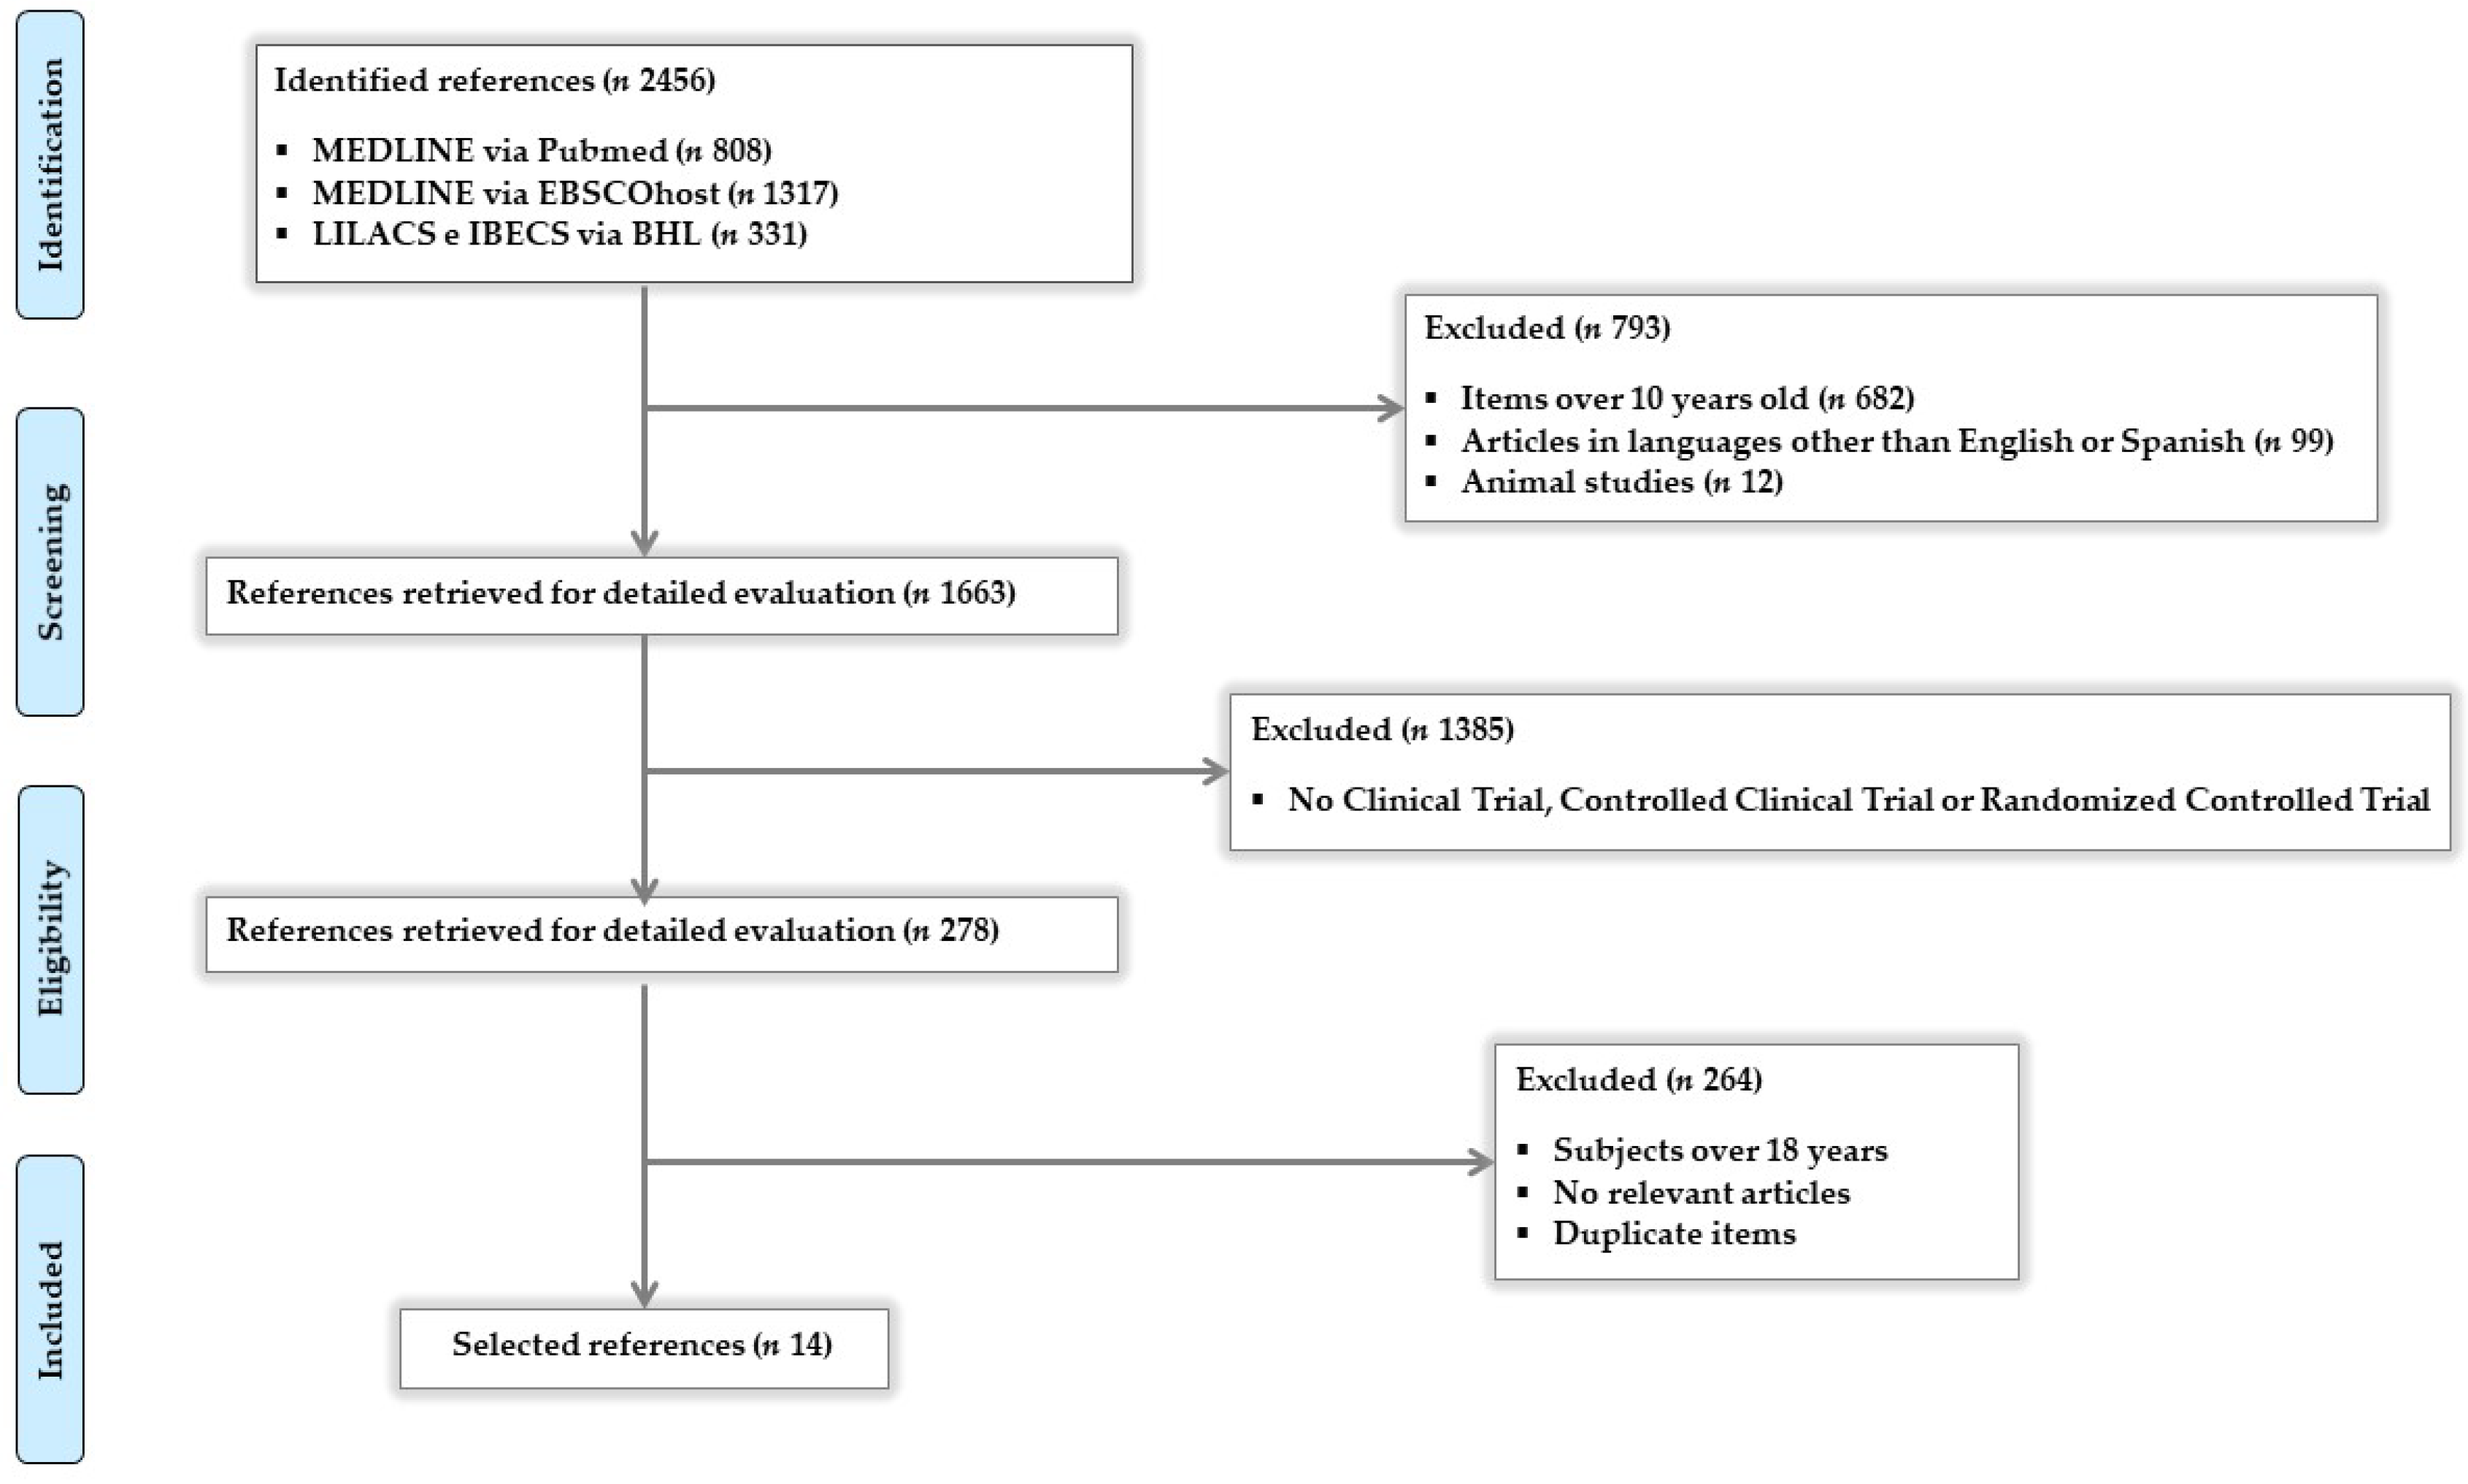
2. Materials and Methods
3. Results
3.1. Study Characteristics
3.1.1. Design, Duration, Follow-Up Time, Participants, and Primary Results
3.1.2. Types of Intervention and Methods of Measuring Results
3.2. Risk of Study Bias
3.3. Effectiveness of Interventions
3.3.1. Results of Individual Studies and Reported Effects
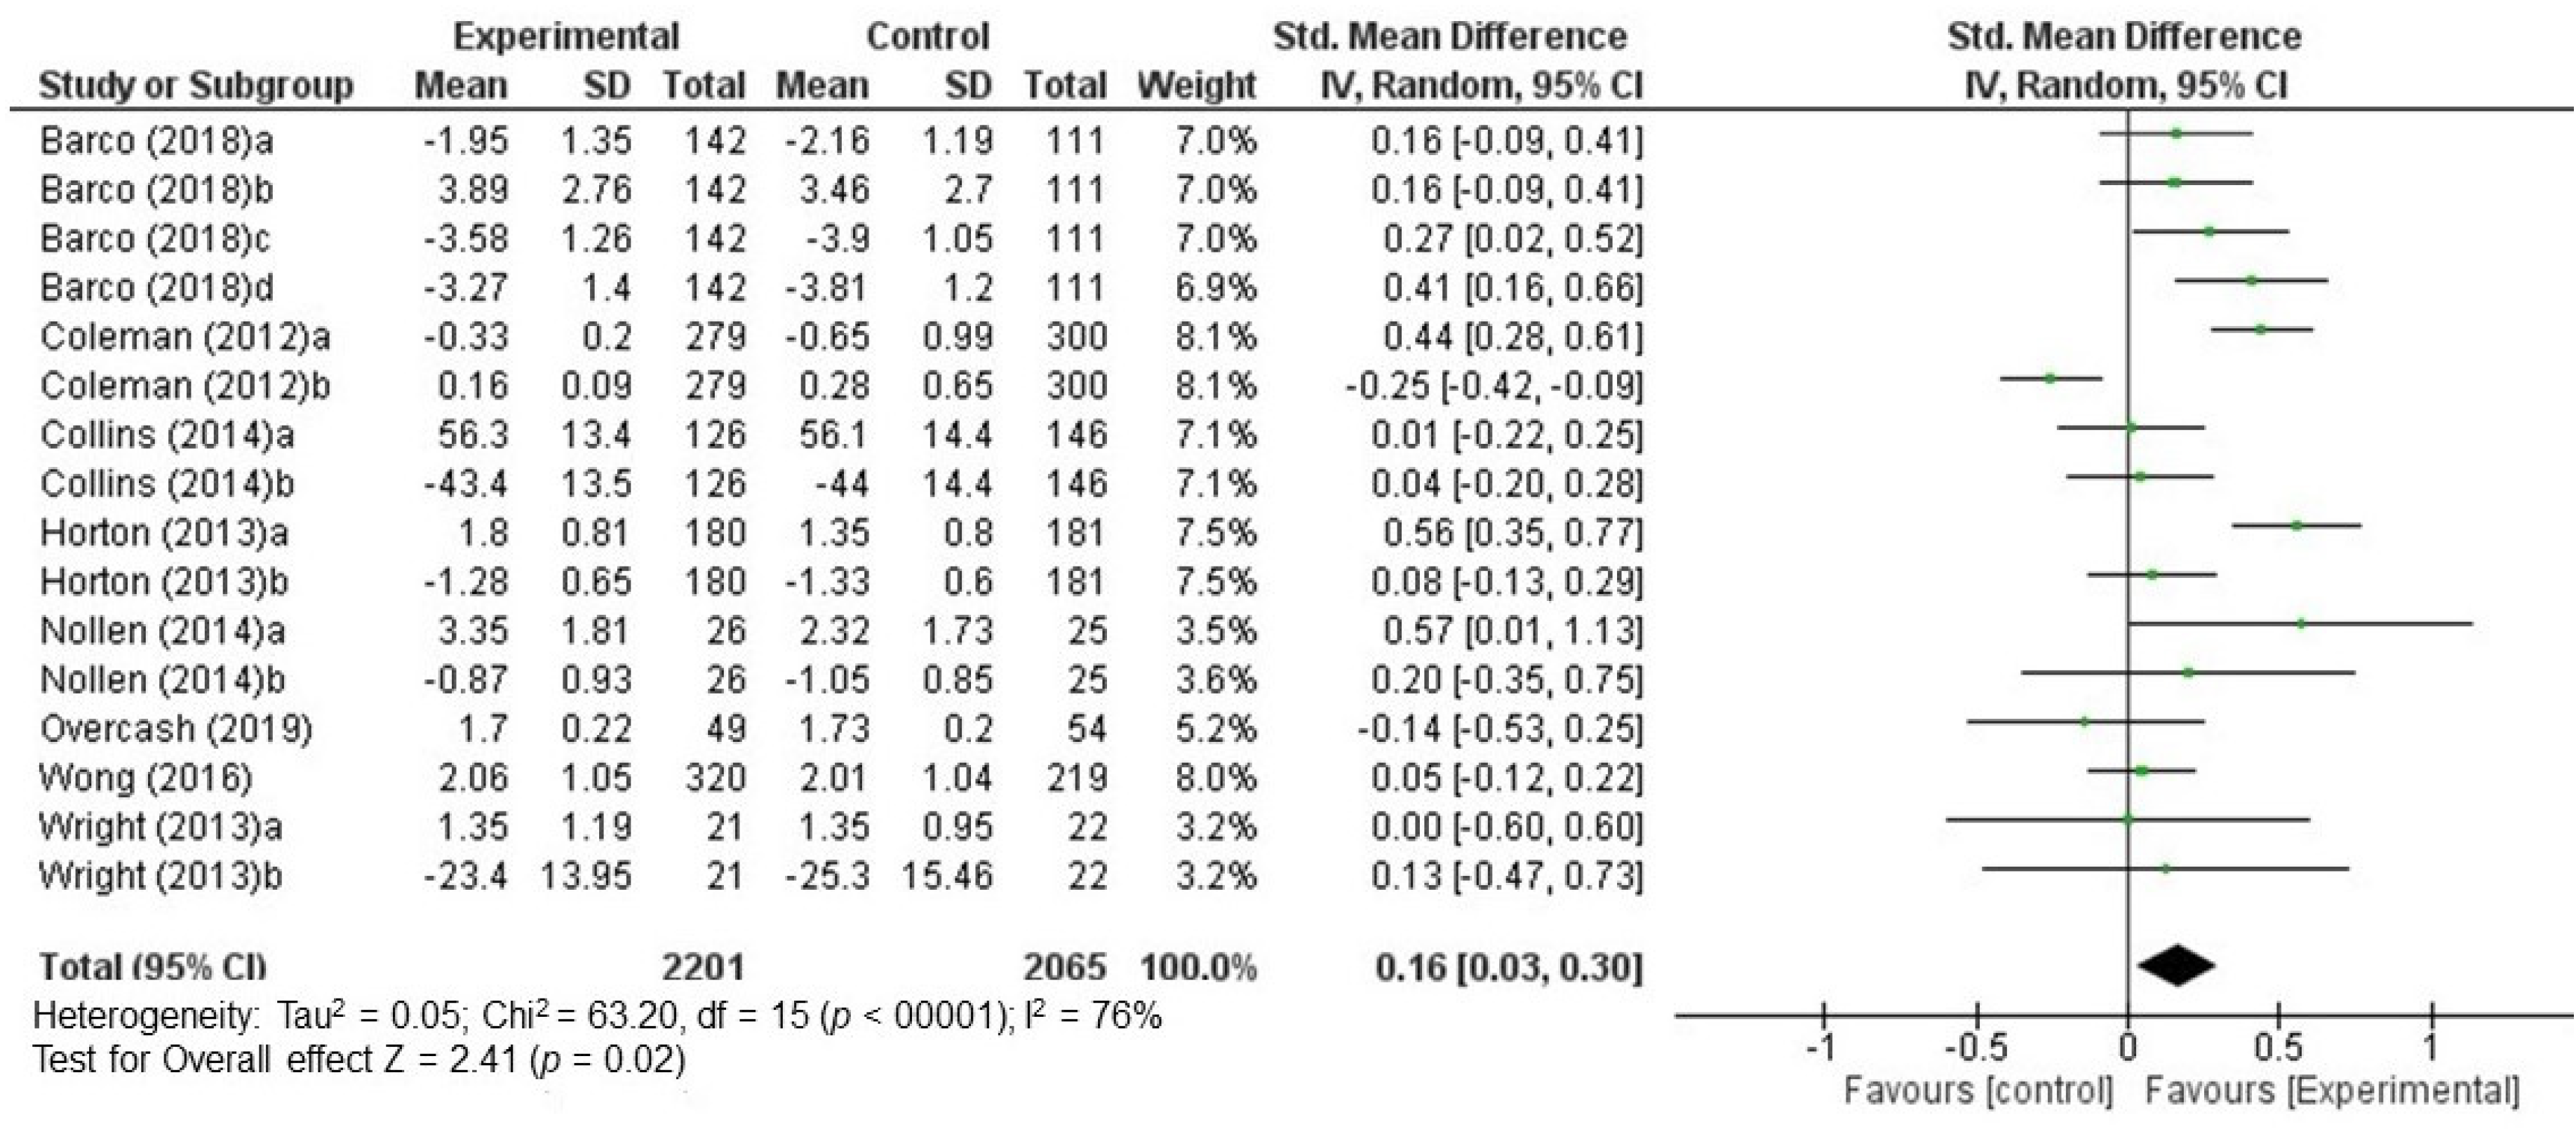
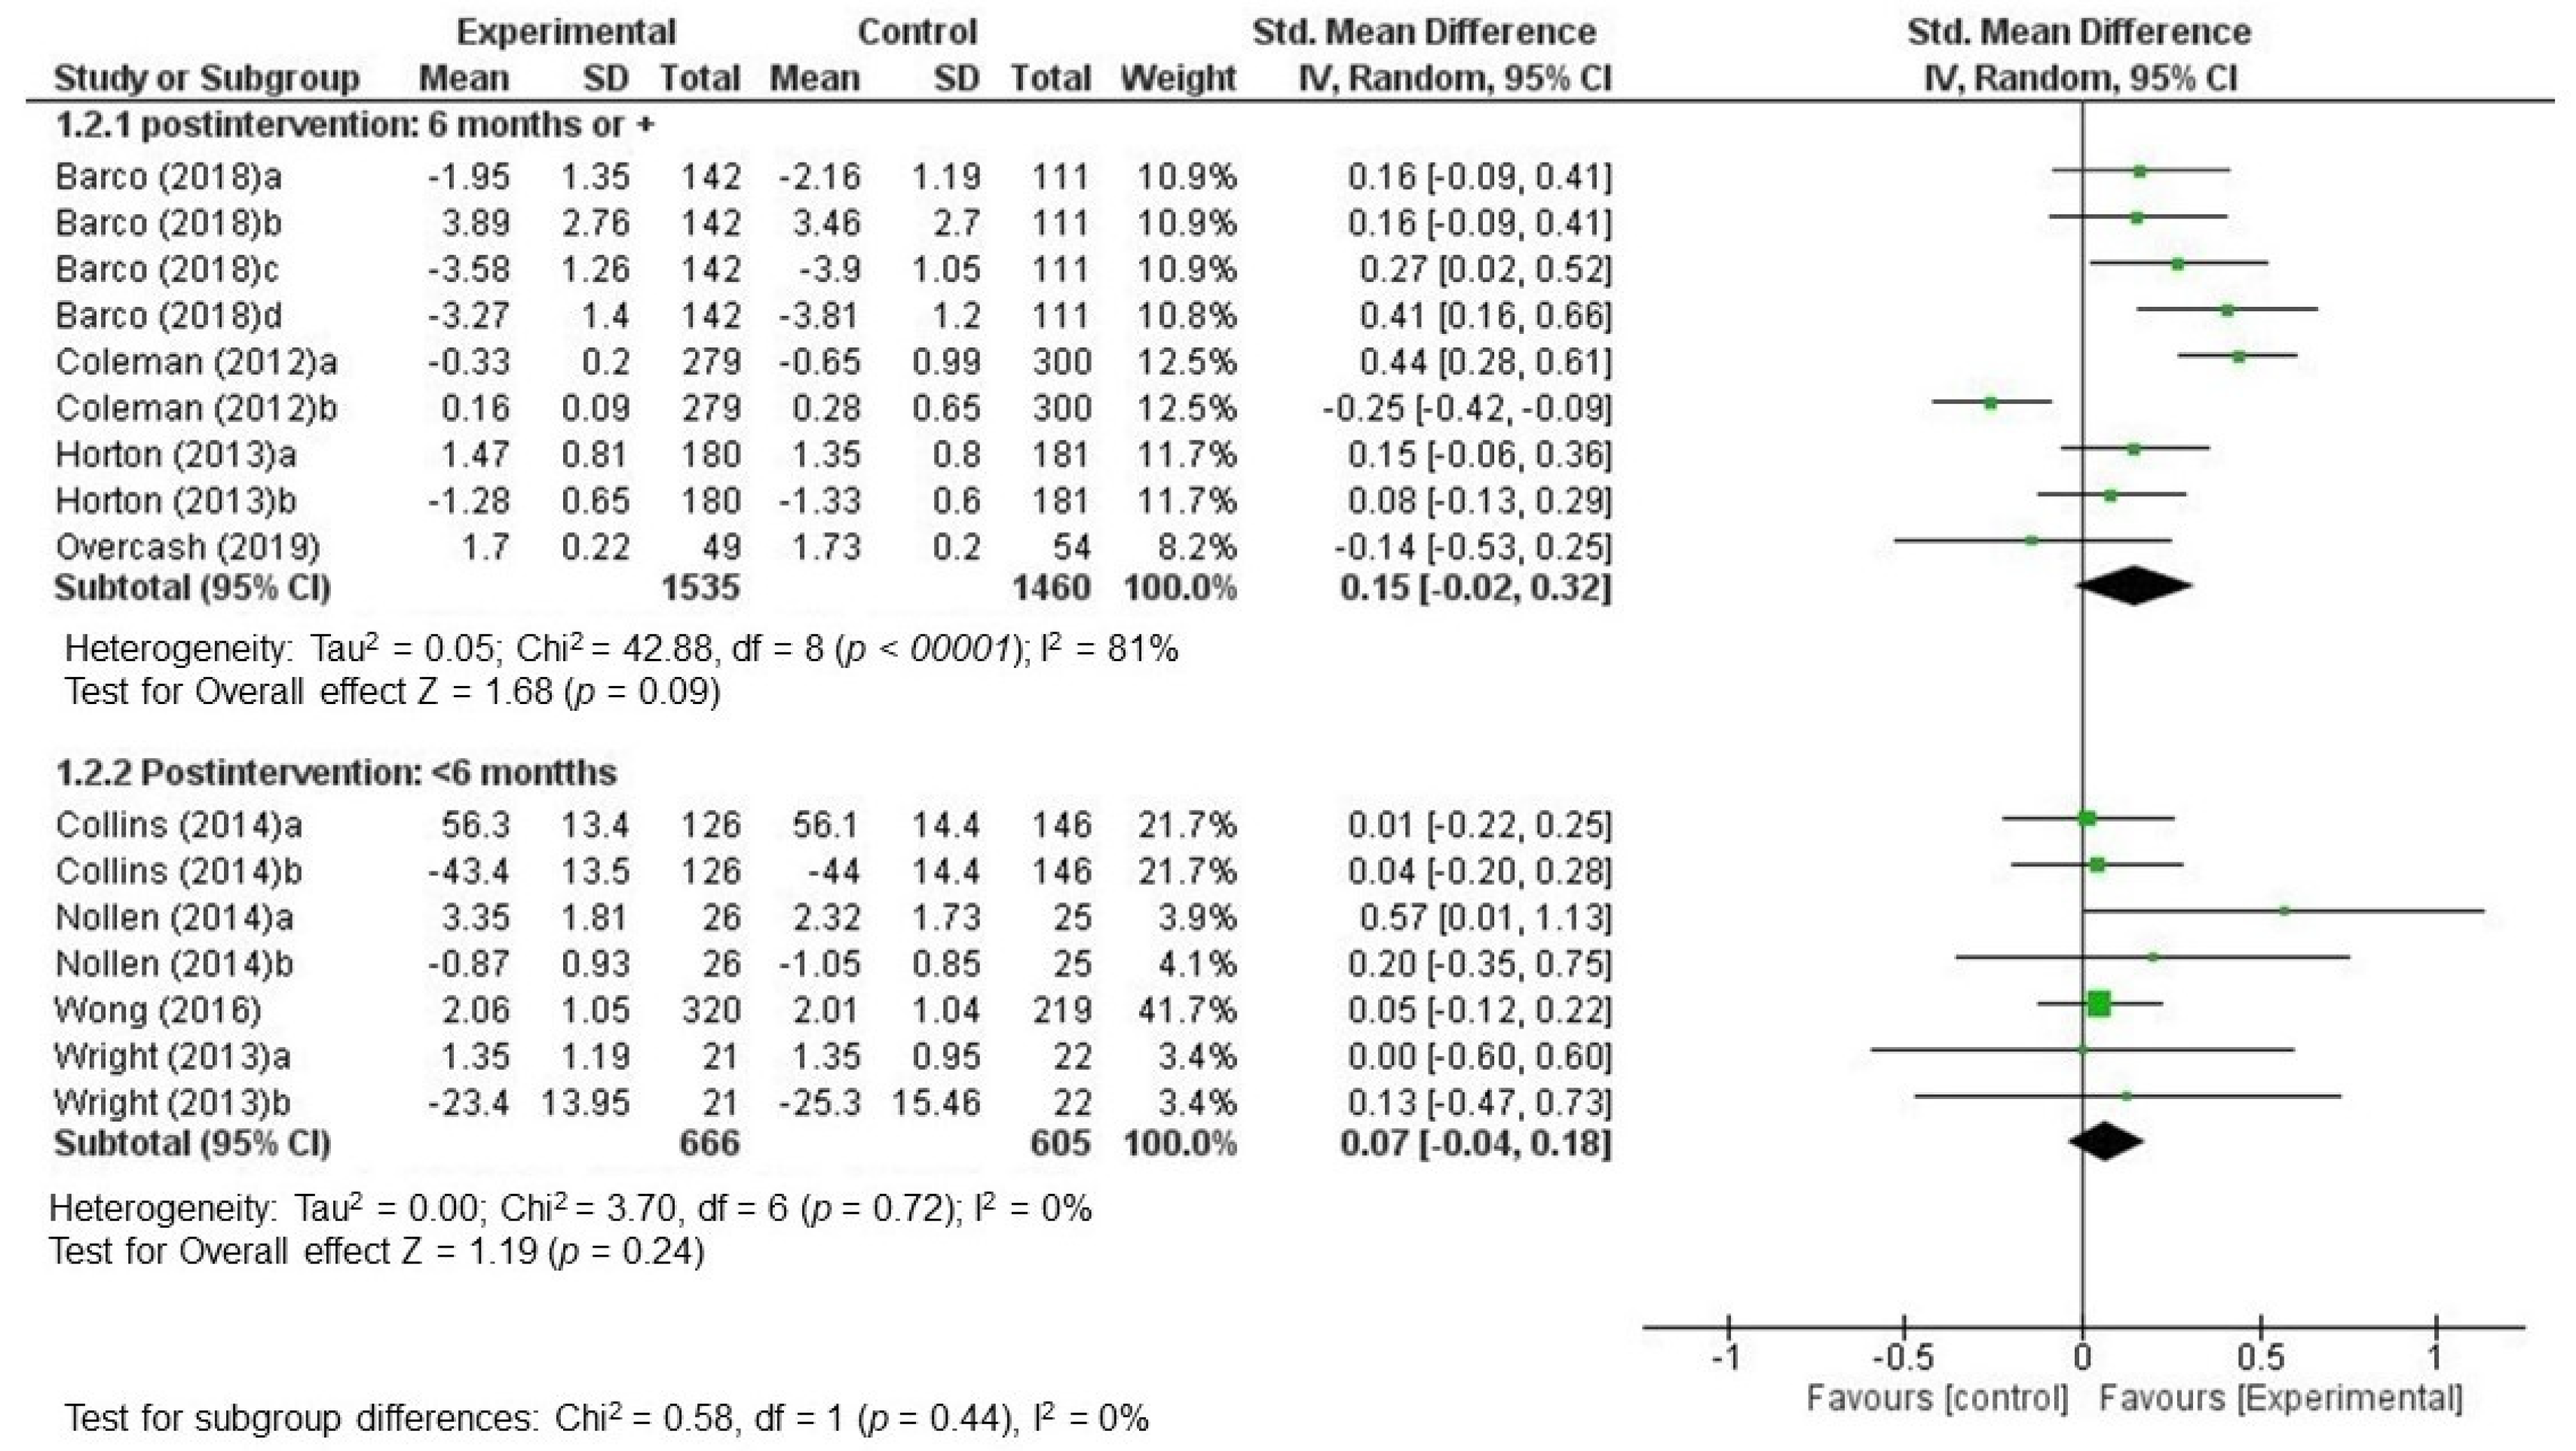
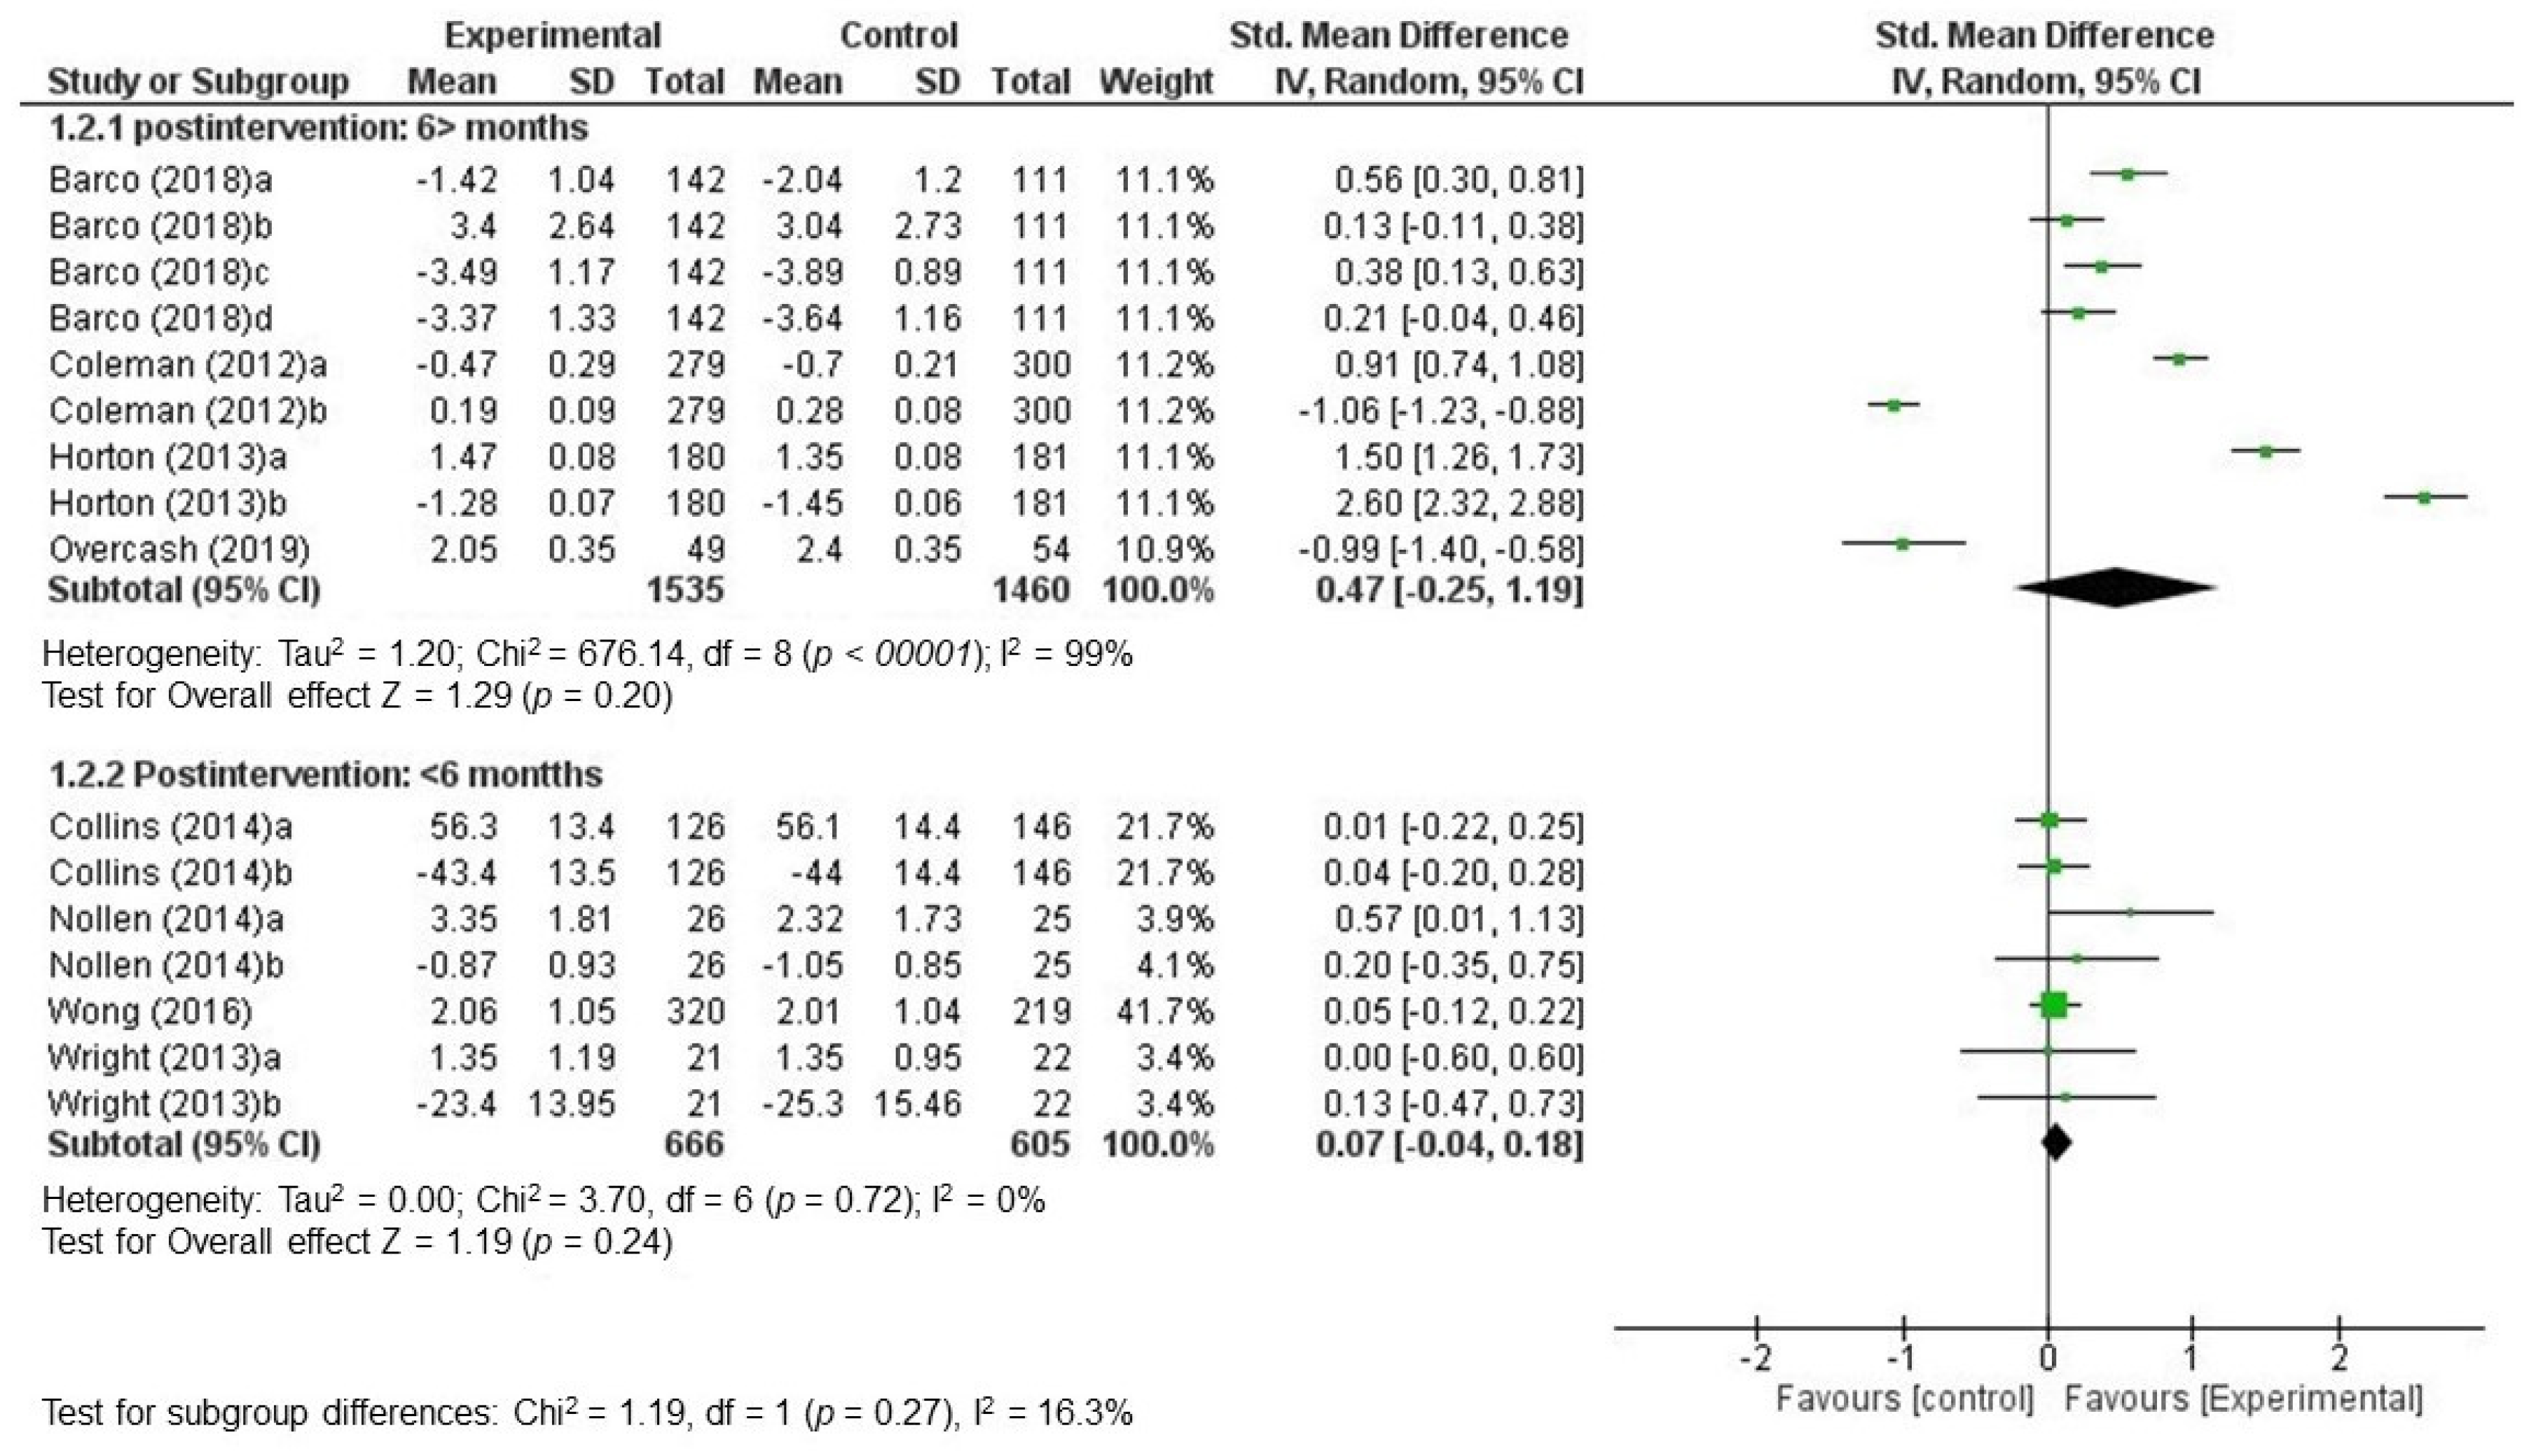
3.3.2. Global Effectiveness of Interventions: Data Quantitative Synthesis
4. Discussion
5. Strengths and Limitations
6. Conclusions
Supplementary Materials
Author Contributions
Funding
Conflicts of Interest
References
- Orrell-Valente, J.K.; Hill, L.G.; Brechwald, W.A.; Dodge, K.A.; Pettit, G.S.; Bates, J.E. “Just Three More Bites”: An Observational Analysis of Parents´Socialization of Children´s Eating at Mealtime. Appetite 2006, 48, 37–45. [Google Scholar] [CrossRef] [PubMed] [Green Version]
- Kunst, A.; Groenhof, F.; Mackenbach, J.; Health, E. Occupational class and cause specific mortality in middle aged men in 11 European countries: Comparison of population based studies. EU Working Group on Socioeconomic Inequalities in Health. BMJ 1998, 316, 1636–1642. [Google Scholar] [CrossRef] [PubMed] [Green Version]
- Saurel-Cubizolles, M.; Chastang, J.; Menvielle, G.; Leclerc, A.; Luce, D. Social inequalities in mortality by cause among men and women in France. J. Epidemiol. Community Health 2009, 63, 197–202. [Google Scholar] [CrossRef] [Green Version]
- Méjean, C.; Droomers, M.; van der Schouw, Y.; Sluijs, I.; Czernichow, S.; Grobbee, D.E.; Bueno-de-Mesquita, H.B.; Beulens, J.W. The contribution of diet and lifestyle to socioeconomic inequalities in cardiovascular morbidity and mortality. Int. J. Cardiol. 2013, 186, 5190–5195. [Google Scholar] [CrossRef] [PubMed]
- Laaksonen, M.; Talala, K.; Martelin, T.; Rahkonen, O.; Roos, E.; Helakorpi, S.; Laatikainen, T.; Prättälä, R. Health behaviours as explanations for educational level differences in cardiovascular and all-cause mortality: A follow-up of 60 000 men and women over 23 years. Eur. J. Public Health 2008, 18, 38–43. [Google Scholar] [CrossRef] [PubMed] [Green Version]
- Stringhini, S.; Sabia, S.; Shipley, M.; Brunner, E.; Nabi, H.; Kivimaki, M.; Singh-Manoux, A. Association of socioeconomic position with health behaviors and mortality. JAMA 2010, 303, 1159–1166. [Google Scholar] [CrossRef] [PubMed] [Green Version]
- Giskes, K.; Avendano, M.; Brug, J.; Kinst, A.E. A systematic review of studies on socioeconomic inequalities in dietary intakes associated with weight gain and overweight/obesity conducted among European adults. Obes. Rev. 2010, 11, 413–429. [Google Scholar] [CrossRef]
- Darmon, N.; Drewnowski, A. Does social class predict diet quality? Am. J. Clin. Nutr. 2008, 87, 1107–1117. [Google Scholar] [CrossRef] [Green Version]
- Irala-Estévez, J.; Groth, M.; Johansson, L.; Oltersdorf, U.; Prättälä, R.; Martínez-González, M.A. A systematic review of socio-economic differences in food habits in Europe: Consumption of fruit and vegetables. Eur. J. Clin. Nutr. 2000, 54, 706–714. [Google Scholar] [CrossRef] [Green Version]
- Grosso, G.; Marventano, S.; Nolfo, F.; Rametta, S.; Bandini, L.; Ferranti, R.; Bonomo, M.C.; Matalone, M.; Galvano, F.; Mistreta, A. Personal eating, lifestyle, and family-related behaviors correlate with fruit and vegetable consumption in adolescents living in sicily, southern Italy. Int. J. Vitam. Nutr. Res. 2013, 83, 355–366. [Google Scholar] [CrossRef]
- Lehto, E.; Ray, C.; Te Velde, S.; Petrova, S.; Duleva, V.; Krawinkel, M.; Krawinkel, M.; Behrendt, I.; Papadaki, A.; Thorsdottir, I.; et al. Mediation of parental educational level on fruit and vegetable intake among schoolchildren in ten European countries. Public Health Nutr. 2015, 18, 89–99. [Google Scholar] [CrossRef] [PubMed] [Green Version]
- Desbouys, L.; De Ridder, K.; Rouche, M.; Castetbon, K. Food Consumption in Adolescents and Young Adults: Age-Specific Socio-Economic and Cultural Disparities (Belgian Food Consumption Survey 2014). Nutrients 2019, 11, E1520. [Google Scholar] [CrossRef] [Green Version]
- Di Noia, J.; Byrd-Bredbenner, C. Determinants of fruit and vegetable intake in low-income children and adolescents. Nutr. Rev. 2014, 72, 575–590. [Google Scholar] [CrossRef]
- Drewnoswski, A.; Rhem, C. Socioeconomic gradient in consumption of whole fruit and 100% fruit juice among US children and adults. Nutr. J. 2015, 14, 3. [Google Scholar] [CrossRef] [PubMed] [Green Version]
- Nikolić, M.; Glibetić, M.; Gurinović, M.; Milešević, J.; Khokhar, S.; Chillo, S.; Abaravicius, J.A.; Bordoni, A.; Capozzi, F. Identifying critical nutrient intake in groups at risk of poverty in Europe: The CHANCE project approach. Nutrients 2014, 6, 1374–1393. [Google Scholar] [CrossRef] [PubMed]
- World Health Organization. TRhe World Health Report 2002: Reducing Rosks, Promoting Healthy Life. [Online]. 2002. Available online: https://apps.who.int/iris/bitstream/handle/10665/42510/WHR_2002.pdf?sequence=1 (accessed on 8 April 2020).
- Mozaffarian, D.; Afshin, A.; Benowitz, N.; Bittner, V.; Daniels, S.; Franch, H.A.; Jacobs, D.R., Jr.; Kraus, W.E.; Kris-Etherton, P.M.; Krummel, D.A.; et al. Population approaches to improve diet, physical activity, and smoking habits: A scientific statement from the American Heart Association. Circulation 2012, 126, 1514–1563. [Google Scholar] [CrossRef]
- Lachat, C.; Otchere, S.; Roberfroid, D.; Abdulai, A.; Seret, F.; Milesevic, J.; Xuereb, G.; Candeias, V.; Kolsteren, P. Diet and physical activity for the prevention of noncommunicable diseases in low- and middle-income countries: A systematic policy review. PLoS Med. 2013, 10, e1001465. [Google Scholar] [CrossRef] [Green Version]
- Michie, S.; Jochelson, K.; Markam, W.; Bridle, C. Low-income groups and behaviour change interventions: A review of intervention content, effectiveness and theoretical frameworks. J. Epidemiol. Community Health 2009, 63, 610–622. [Google Scholar] [CrossRef] [Green Version]
- Mayén, A.; de Mestral, C.; Zamora, G.; Paccaud, F.; Marques-Vidal, P.; Bovet, P.; Stringhini, S. Interventions promoting healthy eating as a tool for reducing social inequalities in diet in low- and middle-income countries: A systematic review. Int. J. Equity Health 2016, 15, 205. [Google Scholar] [CrossRef] [Green Version]
- Bull, E.; Dombrowski, S.; McCleary, N.; Johnston, M. Are Interventions for Low-Income Groups Effective in Changing Healthy Eating, Physical Activity and Smoking Behaviours? A Systematic Review and Meta-Analysis. BMJ Open 2014, 4, e006046. [Google Scholar] [CrossRef]
- Kornet-van der Aa, D.A.; Altenburg, T.M.; van Randeraad-van der Zee, C.H.; Chinapaw, M.J. The effectiveness and promising strategies of obesity prevention and treatment programmes among adolescents from disadvantaged backgrounds: A systematic review. Obes. Rev. 2017, 18, 581–593. [Google Scholar] [CrossRef] [Green Version]
- The Cochrane Collaboration. Cochrane Handbook for Systematic Reviews of Interventions. Versión 6, 2019. [Online]. 2020. Available online: https://training.cochrane.org/handbook/current (accessed on 12 April 2020).
- Avenell, A.; Broom, J.; Brown, T.J.; Poobalan, A.; Aucott, L.; Stearns, S.C.; Smith, W.C.; Jung, R.T.; Campbell, M.K.; Grant, A.M. Systematic review of the long-term effects and economic consequences of treatments for obesity and implications for health improvement. Health Technol. Assess. 2004, 8, 1–182. [Google Scholar] [CrossRef] [PubMed]
- Barco, A.C.; Baranowski, T.; Thompson, D.; Nicklas, T.; Tucunduva, S.T. Sustained Impact of the "Healthy Habits, Healthy Girls—Brazil" School-Based Randomized Controlled Trial for Adolescents Living in Low-Income Communities. Prev. Med. Rep. 2018, 10, 346–352. [Google Scholar]
- Coleman, K.J.; Shordon, M.; Caparosa, S.L.; Pomichowski, M.E.; Dzewaltowski, D.A. The Healthy Options for Nutrition Environments in Schools (Healthy ONES) Group Randomized Trial: Using Implementation Models to Change Nutrition Policy and Environments in Low Income Schools. Int. J. Behav. Nutr. Phys. Act. 2012, 9, 80. [Google Scholar] [CrossRef] [PubMed] [Green Version]
- Collins, C.E.; Dewar, D.L.; Schumacher, T.L.; Finn, T.; Morgan, P.; Lubans, D. 12 month changes in dietary intake of adolescent girls attending schools in low-income communities following the NEAT Girls cluster randomized controlled trial. Appetite 2014, 73, 147–155. [Google Scholar] [CrossRef]
- Evans, A.; Ranjit, N.; Rutledge, R.; Medina, J.; Jennings, R.; Smiley, A.; Stigler, M.; Hoelscher, D. Exposure to Multiple Components of a Garden-Based Intervention for Middle School Students Increases Fruit and Vegetable Consumption. Health Promot. Pract. 2012, 13, 608–616. [Google Scholar] [CrossRef]
- Horton, L.A.; Parada, H.; Slymen, D.J.; Arredondo, E.; Ibarra, L.; Ayala, G.X. Targeting children’s dietary behaviors in a family intervention. Salud Publica Mex. 2013, 55, 397–405. [Google Scholar]
- Nollen, N.L.; Mayo, M.S.; Carlson, S.E.; Rapoff, M.A.; Goggin, K.J.; Ellerbeck, E.F. Mobile Technology for Obesity Prevention: A Randomized Pilot Study in Racial- And Ethnic-Minority Girls. Am. J. Prev. Med. 2014, 46, 404–408. [Google Scholar] [CrossRef] [Green Version]
- Nyberg, G.; Norman, A.; Sundblom, E.; Zeebari, Z.; Elinder, L.S. Effectiveness of a universal parental support programme to promote health behaviours and prevent overweight and obesity in 6-year-old children in disadvantaged areas, the Healthy School Start Study II, a cluster-randomised controlled trial. Int. J. Beahv. Nutr. Phys. Act. 2016, 13, 4. [Google Scholar] [CrossRef] [Green Version]
- Rausch, H.; Kovalskys, I.; De Gregorio, M.J. Gender differences and a school-based obesity prevention program in Argentina: A randomized trial. Rev. Panm. Salud Publica 2013, 34, 75–82. [Google Scholar]
- Tamiru, D.; Argaw, A.; Gerbaba, M.; Ayana, G.; Nigussie, A.; Belachew, T. Effect of Integrated School-Based Nutrition Education on Optimal Dietary Practices and Nutritional Status of School Adolescents in Southwest of Ethiopia: A Quasi-Experimental Study. Int. J. Adolesc. Med. Health 2016, 29, 6. [Google Scholar] [CrossRef]
- Wong, W.W.; Ortiz, C.L.; Stuff, J.E.; Mikhail, C.; Lathan, D.; Moore, L.A.; Alejandro, M.E.; Butte, N.F.; Smith, E.O. A Community-based Healthy Living Promotion Program Improved Self-esteem Among Minority Children. J. Pediatr. Gatroenterol. Nutr. 2016, 63, 106–112. [Google Scholar] [CrossRef] [PubMed]
- Rees, G.; Bakhshi, S.; Surujlal-Harry, A.; Stasinopoulos, M.; Baker, A. A Computerised Tailored Intervention for Increasing Intakes of Fruit, Vegetables, Brown Bread and Wholegrain Cereals in Adolescent Girls. Public Health Nutr. 2010, 13, 1271–1278. [Google Scholar] [CrossRef]
- Wright, J.A.; Phillips, B.D.; Watson, B.L.; Newby, P.K.; Norman, G.J.; Adams, W.G. Randomized trial of a family-based, automated, conversational obesity treatment program for underserved populations. Obesity (Silver Spring) 2013, 21, E369–E378. [Google Scholar] [CrossRef] [PubMed] [Green Version]
- Alaimo, K.; Olesksyk, S.C.; Drzal, N.B.; Golzynsky, D.L.; Lucarelli, J.F.; Wen, Y.; Velie, M. Effects of changes in lunch-time competitive foods, nutrition practices, and nutrition policies on low-income middle-school children’s diets. Child. Obes. 2013, 9, 509–523. [Google Scholar] [CrossRef] [PubMed] [Green Version]
- Overcash, F.M.; Vickers, Z.; Ritter, A.; Mann, T.; Mykerezi, E.; Redden, J.; Rendahl, A.K.; Davey, C.; Reicks, M. An in-home intervention of parent-implemented strategies to increase child vegetable intake: Results from a non-randomized cluster-allocated community trial. BMC Public Health 2019, 19, 881. [Google Scholar] [CrossRef] [PubMed] [Green Version]
- Do Amaral, E.; Melo, G.R.; de Carvalho Silva Vargas, F.; Dos Santos Chagas, C.M.; Toral, N. Nutritional interventions for adolescents using information and communication technologies (ICTs): A systematic review. PLoS ONE 2017, 12, e0184509. [Google Scholar] [CrossRef] [PubMed]
- Racey, M.; O´Brien, C.; Douglas, S.; Márquez, O.; Hendrie, G.; Newton, G. Systematic Review of School-Based Interventions to Modify Dietary Behavior: Does Intervention Intensity Impact Effectiveness? J. Sch. Health 2016, 86, 452–463. [Google Scholar] [CrossRef]
- Singh, A.; Bassi, S.; Nazar, G.; Saluja, K.; Park, M.; Kinra, S.; Arora, M. Impact of school policies on non-communicable disease risk factors—A systematic review. BMC Public Health 2017, 17, 292. [Google Scholar] [CrossRef] [Green Version]
- Black, A.P.; D´Onise, K.; Mcdermott, R.; Vally, H.; O´Dea, K. How effective are family-based and institutional nutrition interventions in improving children’s diet and health? A systematic review. BMC Public Health 2017, 17, 818. [Google Scholar] [CrossRef] [Green Version]
- Caballero, B.; Clay, T.; Davis, S.; Ethelbah, B.; Rock, B.; Lohman, T.; Norman, J.; Story, M.; Stone, E.J.; Stephenson, J.; et al. Pathways: A school-based, randomized controlled trial for the prevention of obesity in American Indian schoolchildren. Am. J. Clin. Nutr. 2003, 78, 1030–1038. [Google Scholar] [CrossRef] [Green Version]
- Luepker, R.V.; Perry, C.L.; Mckinlay, S.M.; Nader, P.R.; Parcel, G.S.; Stone, E.J.; Webber, L.S.; Elder, J.P.; Feldman, H.A.; Jonhson, C.C.; et al. Outcomes of a field trial to improve children’s dietary patterns and physical activity. The Child and Adolescent Trial for Cardiovascular Health. CATCH collaborative group. JAMA 1996, 275, 768–776. [Google Scholar] [CrossRef]
- Crepinsek, M.; Singh, A.; Bernstein, L.S.; McLaughlin, J.E. Dietary effects of universal-free school breakfast: Findings from the evaluation of the school breakfast program pilot project. J. Acad. Nutr. Diet. 2006, 106, 1796–1803. [Google Scholar] [CrossRef]
- Hingle, M.D.; O´Connor, T.M.; Dave, J.M.; Baranowski, T. Parental involvement in interventions to improve child dietary intake: A systematic review. Prev. Med. 2010, 51, 103–111. [Google Scholar] [CrossRef] [PubMed] [Green Version]
- Kader, M.; Sundblom, E.; Elinder, L.S. Effectiveness of universal parental support interventions addressing children’s dietary habits, physical activity and bodyweight: A systematic review. Prev. Med. 2015, 77, 52–67. [Google Scholar] [CrossRef] [PubMed] [Green Version]
- De Lauzon-Gillain, B.; Oliveira, A.; Charles, M.A.; Grammatikaki, E.; Jones, L.; Rigal, N.; Lopes, C.; Manios, Y.; Moriera, P.; Emmett, P.; et al. A review of methods to assess parental feeding practices and preschool children’s eating behavior: The need for further development of tools. J. Acad. Nutr. Diet. 2012, 12, 1578–1602. [Google Scholar] [CrossRef] [PubMed] [Green Version]
- Khandpur, N.; Blaine, R.; Fisher, J.; Davison, K. Fathers’ child feeding practices: A review of the evidence. Appetite 2014, 78, 110–121. [Google Scholar] [CrossRef] [PubMed]
- Stevens, J.; Taber, D.R.; Murray, D.M.; Ward, D.S. Advances and controversies in the design of obesity prevention trials. Obesity (Silver Spring) 2007, 15, 2163–2170. [Google Scholar] [CrossRef] [PubMed] [Green Version]
- Borenstein, M.; Hedges, L.; Higgins, J.; Rothstein, H. Introduction to Meta-Analysis; Wiley: West Sussex, UK, 2009. [Google Scholar]
- Arija, V. Métodos de valoración del consumo alimentario. In Nutrición y Dietética Clínica; Salas-Salvadó, J., Bonada, A., Trallero, R., Saló, M., Burgos, R., Eds.; Elsevier Masson: Barcelona, Spain, 2014; pp. 67–82. [Google Scholar]
- Arija, V.; Abellana, R.; Ribot, B.; Ramón, J.M. Biases and adjustments in nutritional assessments from dietary questionnaires. Nutr. Hosp. 2015, 31, 113–118. [Google Scholar]
- Falomir, Z.; Arregui, M.; Madueño, F.; Corella, D.; Coltell, O. Automation of Food Questionnaires in Medical Studies: A state-of-the-art review and future prospects. Comput. Biol. Med. 2012, 42, 964–974. [Google Scholar] [CrossRef] [Green Version]
- Illner, A.K.; Freisling, H.; Boeing, H.; Huybrechts, I.; Crispim, S.; Slimani, N. Review and evaluation of innovative technologies for measuring diet in nutritional epidemiology. Int. J. Epidemiol. 2012, 41, 1187–1203. [Google Scholar] [CrossRef] [PubMed] [Green Version]
- Boutron, I.; Moher, D.; Altman, D.G.; Schulz, K.F.; Ravaud, P. CONSORT Group Extending the CONSORT statement to randomized trials of nonpharmacologic treatment: Explanation and elaboration. Ann. Intern. Med. 2008, 148, 295–309. [Google Scholar] [CrossRef] [PubMed]


| Study ID [reference] Clinical Trial Identifier, City (Country) | Study Design, Duration and Time Points | Participants | Primary Measure of Result | Identification of the Population at Risk of Poverty |
|---|---|---|---|---|
| Alaimo (2013) [37] MI (USA) | Randomized Controlled Trial 2 years. Baseline and next school year. | 1176 children (55 schools) 12.3 (0.6) years (Mean (SD)). | Nutrient density and healthy food intake | Low income middle schools. Inclusion criteria: having 50% or more of students eligible for free or reduced-price meals. |
| Barco (2018) [25] NCT02228447 São Paulo (Brazil) | Randomized Controlled Trial. 1 year Baseline, Immediate post-intervention and 6-month post-intervention. | 253 girls (10 schools). 14–18 years. | Height and weight, waist circumference. (Dietary behavior is included as secondary outcome, among others). | Public high schools located in low-income areas with medium HDI (There is not low HDI in São Paulo). |
| Coleman (2012) [26] | Randomized Controlled Trial. 2 years Baseline, first- and second-year post-intervention. | 579 children (8 schools). 8.9 (1.6) years (Mean (SD)). | Amount of outside foods and beverages on campuses. | Targeted low-income school district. All children in the district were eligible for free and reduced school meals. |
| Collins (2014) [27] Hunter, Newcastle and Central Coast regions of New South Wales (Australia) | Randomized Controlled Trial. 1 year. Baseline and 12-month follow up | 357 girls (12 schools) 13.18 (0.45) years (Mean (SD)) | Percentage energy contributed from nutrient-dense core foods groups and EDNP foods groups. | 12 government secondary schools located in the bottom 50% of the SEIFA measure of relative disadvantage. |
| Evans (2012) [28] | Clinical Trial 4 months. Baseline and post-intervention. | 214 children (5 schools). Sixth and seventh-grade students | Dietary intake: fruit and vegetable. | Students who were eligible for free/reduced lunch and breakdown of racial/ethnic minority students. All five schools served students who liven underserved, ethnically diverse communities. |
| Horton (2013) [29] Imperial County, CA, (USA) | Randomized Controlled Trial. 2 years. Baseline, postintervention, 6-month follow-up (the latter is not described in this paper). | 361 mother-child 7–13 years | Dietary intake: fruit and vegetable, sugar-sweetened beverages, fast food. Weight, height, BMI. | Imperial County (CA): is characterized by nationally high poverty rates. |
| Nollen (2014) [30] | Randomized Controlled Trial. 1 year. Baseline, 4-week follow-up, 8-week follow-up and, 12-week follow-up. | 51 girls. 9–14 years. | Dietary intake (fruits/vegetables, sugar-sweetened beverages), scree time, BMI. | Economically disadvantaged neighborhoods. |
| Nyberg (2016) [31] Stockholm County (Sweden) | Controlled Clinical Trial 6 months. Baseline, post-intervention, 5 months follow-up. | 378 children (13 schools, 31 pre-school classes allocated to intervention group or control group 6 years. | Physical activity, dietary intake, screen time, body weight, height and BMI standard deviation. | Three areas in Stockholm County with low employment and low educational level and targeted specifically by the government to support socio-economic development. |
| Overcash (2019) [38] NCT03641521Minneapolis/St. Paul, MI/WI metropolitan area (USA) | Controlled Clinical Trial. 1 year and 7 months Baseline, immediate post-treatment, 6-month follow-up, 12-month follow-up. | 103 parent-child pairs enroll into 1 of 15 location sites. Parent/child (9–12 years). | Total vegetable intake, diet quality (HEI scores), total energy intake, vegetable liking, variety of vegetables tried, child BMI-z score, and home availability of vegetables | Sites serving low-income families including subsidized housing, schools, churches, and community centers. Inclusion criteria: the family must qualify for some form of public assistance. |
| Study ID [reference] Clinical Trial Identifier, City (Country) | Study Design, Duration and Time Points | Participants | Primary Measure of Result | Identification of the Population at Risk of Poverty |
| - n and description | ||||
| - Age | ||||
| Rausch (2013) [32] Rosario (Argentina) | Randomized Controlled Trial. 5 months. Baseline, post-intervention. | 405 children. 9–11 years (6 schools). | Body weight, height, BMI. Dietary intake. | The school districts that participated in this study comprised neighborhoods of vulnerable social sectors in which macroeconomic conditions are compatible with very-low, low, and lower-middle income standards. |
| Rees (2010) [35] London and the West Midlands (UK) | Randomized Controlled Cluster Trial. 3 months. Baseline and 3-month follow-up. | 823 children (8 schools) 12–16 years. | Dietary intakes: brown bread, wholegrain cereal, fruit and vegetables. | The areas were contacted based on their representation of ethnic minority and low-income groups. |
| Tamiru (2016) [33] Jimma Zone, Oromia Regional State, (Ethiopia) | Clinical Trial. 9 months. Baseline, midline (6th month) and end line (9th month). | 992 Mother-Child pairs (4 pairs primary schools). 13.6(1.99) years (Mean (SD)) | Quality diet, temporary hunger, body weight, height. | Jimma Zone: total population of 2.5 million; 94% living in the rural settings. |
| Wong (2016) [34] NCT00994084 Houston, TX, (USA) | Controlled Clinical Trial. 18 weeks Baseline and at the end of each of the 3 6-week sessions. | 1094 children (14 community center)). 10.2(0.1) years (Mean (SE)). | Body weight, height, dietary habits, nutrition knowledge, self-esteem, and physical activity. | Community centers located in low-income neighborhoods within the City of Houston. Hispanic o black children. |
| Wright (2013) [36] Boston, MA, (USA) | Randomized Controlled Trial. 1 year. Baseline and 3 months post intervention. | 50 parent-child 9–12 years obese children. | BMI, intakes of calories, fat, fruits and vegetables, television viewing later. | Families from underserved populations. African American (72%). |
| Study ID, [Reference] | Intervention Group Description | Control Group Description | Dietary Outcome Measures |
|---|---|---|---|
| Alaimo (2013) [37] | Intervention group: (1) HSAT Only; (2) Student SNAK Team; (3) MSBE Nutrition Policy. Intervention elements: CSHT (1, 2, 3), HSAT and Action Plan (1, 2, 3), Make ≥ 1 nutrition education/marketing change (1, 2, 3), SNAK (2 group), MSBE (3). Learning cycles. | Participated only in data collection during the study period (were offered the intervention post study). | Diet assessment measures from FFQ pre- and postintervention (55 school) in 4 groups of the 2 outcome measurement time points. |
| Barco (2018) [25] | Multicomponent school-based intervention (6 months). | Participated only in data collection during the study period | BFFQ-FP previously tested for reliability and relative validity in the 2 outcome measurement time points. |
| Coleman (2012) [26] | Target strategies (classroom, before/after school, recess, cafeteria (school meals)). Do-Study-Act (PDSA) | Participated only in data collection during the study period | Three observation system for the four main nutrition-related organizational behaviors/environments: - School lunch/cafeteria, morning snack recess/playgrounds in elementary: observations based upon what children were consuming. - Classrooms/school-wide events: systematic observation of school trash. |
| Collins (2014) [27] | Nutrition handbook that included 10 weeks of health information for parents. Three practical nutrition workshops. Newsletters and text messaging. 10-week delivery of health information by teachers in the schools. | Nutrition handbook that included 10 weeks of health information for parents. Three practical nutrition workshops. Newsletters and text messaging. | ACAESFFQ (was previously evaluated for reliability and validity in Australian school students to 9–16 years) in the 2 outcome measurement time points. |
| Evans (2012) [28] | Intervention (6 component) for a 5-month period (opportunity to participate in any of the six SHK intervention components). | Participated only in data collection during the study period. | Fruit and vegetables consumption (SHK questionnaire), baseline and post-intervention. |
| Horton (2013) [29] | DVD series and family manual. Home visit (1 visit/week for 2 months, followed by 1 visit/2 weeks during the third month with telephone calls on non-visit weeks, and a final home visit and telephone call during the fourth month): family support for healthy eating and to maximize sustainability of family behavior change. | Participated only in data collection during the study period (received the DVD series and family manual after completing the final assessment protocol) | Daily intake fruit and vegetable: 2 questions from the National Cancer Institute Food Attitudes and Behavior survey. Daily servings of sugar-sweetened beverages intake: 1 question on number of cans or glasses. Weekly fast food intake: asking how many days they ate in a typical week. |
| Nollen (2014) [30] | Three 4-week modules that targeted fruits/vegetables, sugar-sweetened beverages, scree time. Mobile intervention: real-time goal setting, self-monitoring, tips, feedback, and positive reinforcement. | Three 4-week modules that targeted fruits/vegetables, sugar-sweetened beverages, screen time. Written manual: same content as in mobile intervention but no prompting. | 2 standardized 24 h dietary recall in 3 outcome measurement time points. |
| Nyberg (2016) [31] | Health information for parents (brochure). Two individual sessions of Motivational Interviewing for parents (2 × 45 min). Teacher-led classroom activities children (10 × 30 min). | Health information for parents (brochure). Teacher-led classroom activities children (10 × 30 min). | Validated (against 24 h dietary recall) parent-proxy questionnaire, the EPAQ in the 3 outcome measurement time points. |
| Overcash (2019) [38] | Cooking Matters program (6 weekly classes). Behavioral Strategies segment: 6 total. | Cooking Matters program (6 weekly classes) | Three 24 h dietary recall immediately following in the 4 outcome measurement time points. |
| Rausch (2013) [32] | 4 workshops: three for the children (Healthy Eating, Body in Motion, and Healthy Body); and one for their parents/caregivers (40 min) Modifications to the school cafeteria menu. | Participated only in data collection during the study period | WFFQ baseline and post-intervention. |
| Rees (2010) [35] | Received a leaflet tailored to their responses to a baseline diet and psychological questionnaire. | Received a copy of a comparable generic leaflet based on national guidelines, which was not tailored. | Three 24 h dietary recall sheets over three different days at baseline, and again at follow-up 3 months later, |
| Tamiru (2016) [33] | School-based health and nutrition education. Enabling school-health environment. | Enabling school-health environment. | FANTA individual dietary-diversity questionnaire and 1 food-frequency at baseline and the 2 outcome measurement time points. |
| Wong (2016) [34] | 30 min of nutrition or healthy habits lessons twice a week (3–6-week sessions). | Took part in regular after-school childcare enrichment programs at community centers. Twice a week: Science is Fun activities. | A multiple-choice quiz in the 3 outcome measurement time points. |
| Wright (2013) [36] | 12 weeks telephone counseling intervention delivered by automated IVR system and an HER behavioral counseling tool used by the primary care clinician during follow- up visits (parents and children: similar but separate interventions). | Participated only in data collection during the study period (were offered the intervention post study). | Children: Block Dietary Data System Kids Food screener. Parents: Block 2007 screener Fat, Sugar, Fruit and Vegetable screener. In the 3 outcome measurement time points. |
| Study ID [Reference] | Outcome Measure | Baseline N/M (SD or SE) | Follow-Up N/M (SD or SE) | ||||||
|---|---|---|---|---|---|---|---|---|---|
| Intervention Group | Control Group | Intervention Group | Control Group | ||||||
| Alaimo (2013)a [37] | Total vegetables (cup/day). | 134 ɤ | 1.20 (0.95) * | 228 ɤ | 1.10 (0.94) * | ND | ND | ND | ND |
| Alaimo (2013)b [37] | % kcal from saturated fat and total fat. | ND | 20.03 (4.87) * | 228 ɤ | 21.69 (4.11) * | ND | ND | ND | ND |
| Barco (2018)a [25] | Animal food group: milk, meats (servings/day). | 142 | 2.13 (1.40) * | 111 | 2.12 (1.05) * | 142 | 1.95 (1.35) * | 111 | 2.16 (1.19) * |
| Barco (2018 )b [25] | Vegetarian food group: rice, veggies, fruits, beans(servings/day). | 142 | 3.77 (2.75) * | 111 | 3.77 (2.48) * | 142/ | 3.89 (2.76) * | 111 | 3.46 (2.70) * |
| Barco (2018)c [25] | Oils group (servings/day). | 142 | 3.97 (1.22) | 111 | 3.95 (1.38) | 142 | 3.58 (1.26) * | 111 | 3.90 (1.05) * |
| Barco (2018)d [25] | Sweets group (serving/day). | 142 | 4.33 (1.13) | 111 | 4.30 (1.14) | 142 | 3.27 (1.40) * | 111 | 3.81 (1.20) * |
| Coleman (2012)a [26] | Outside unhealthy foods and beverages (items/child/week). | 279 | 0.37 (0.17) * | 300 | 0.51 (0.21) * | 279 | 0.33 (0.20) * | 300 | 0.65 (0.99) * |
| Coleman (2012)b [26] | Outside healthy foods and beverages (items/child/week). | 279 | 0.15 (0.09) * | 300 | 0.19 (0.07) * | 279 | 0.16 (0.09) * | 300 | 0.28 (0.65) * |
| Collins (2014)a [27] | Energy from core foods (%). | 158 | 54.8 (13.5) | 172 | 55.4 (13.8) | 126 | 56.3(13.4) | 146 | 56.1 (14.4) |
| Collins (2014)b [27] | Energy from no-core foods (%). | 158 | 45.2 (13.5) | 172 | 45.0 (1.0) | 126 | 43.4 (13.5) | 146 | 44.0 (14.4) |
| Evans (2012) [28] | Vegetables and fruits (servings/day) | ND | ND | ND | ND | ND | ND | ND | ND |
| Horton (2013)a [29] | Vegetables and fruits (cup/day). | ND | ND | ND | ND | 180 | 1.47 (0.81) * | 181 | 1.35 (0.80) * |
| Horton (2013)b [29] | Sugar-sweetened (servings/day) and fast food (days/week). | ND | ND | ND | ND | 180/ | 1.28 (0.65) * | 181 | 1.33 (0.60) * |
| Nollen (2014)a [30] | Fruits and vegetables (servings/day). | 26 | 2.53 (1.45) | 25 | 2.34 (1.55) | 26 | 3.35 (1.81) | 25 | 2.32 (1.73) |
| Nollen (2014)b [30] | Sugar-sweetened beverages (servings/day). | 26 | 1.20 (0.92) | 25 | 0.95 (0.87) | 26 | 0.87 (0.93) | 25 | 1.05 (0.85) |
| Nyberg (2016)a [31] | vegetables, fruits (servings/day). | 185 | 0.72 (0.61) * | 193 | 0.83 (0.69) * | ND | ND | ND | ND |
| Nyberg (2016)b [31] | Fruit juice, milk flavored, soft drinks, snacks, chocolate/sweets, ice-cream, cake/buns/cookies | 185 | 0.37 (0.57) * | 193 | 0.50 (0.70) * | ND | ND | ND | ND |
| Overcash (2019) [38] | Total vegetable servings | 49 | 1.7 (0.2) | 54 | 1.6 (0.2) | 49 | 1.7 (0.22) * | 54 | 1.73 (0.2) * |
| Rausch (2013) [32] | Vegetables, fruits, Skim milk, cereals, juice (servings/week). | ND | ND | ND | ND | ND | ND | ND | ND |
| Rees (2010) [35] | Brown bread, wholegrain cereal, fruits and vegetables (servings/day). | 406 | 0.56 (0.71) * | 417 | 0.52 (0.67) * | ND | ND | ND | ND |
| Tamiru (2016) [33] | Consumption of animal source | ND | ND | ND | ND | ND | ND | ND | ND |
| Wong (2016) [34] | Fruits and vegetable | 524 | 2.13 (0.04) | 353 | 2.15 (0.04) | 320 ɤ | 2.06 (1.05) * | 219 ɤ | 2.01 (1.04) * |
| Wright (2013)a [36] | Vegetables and fruits (cup/day) | 21 | 1.15 (0.86) * | 22 | 1.35 (0.95) * | 21 | 1.35 (1.19) * | 22 | 1.35 (0.95) * |
| Wright (2013)b [36] | Saturated Fat and Total Fat (g/day) | 21 | 25.75 (16.49) * | 22 | 26.20 (16.31) * | 21 | 23.40 (13.95) * | 22 | 25.30 (15.46) * |
| Study ID [Reference] | Baseline Characteristics | Changes between Baseline and Follow-Up for the Intervention Group, with Respect to the Control Group |
|---|---|---|
| Alaimo (2013) [37] | School characteristics at baseline: no significant differences among groups. Student dietary intake: significant differences at baseline and all subsequent analyses adjusted for baseline dietary values. The authors showed the post-intervention results adjusted for baseline value, interaction of race/gender, kitchen type, urbanization, and percent of children eligible for free/reduced-price meals. | HSAT Only: significantly increase fruit intake (17.3%) and fruit juice (>13.8%). SNAK Team: increased added sugars intake (14.6%). MSBE Policy: increased fruit intake (18.3%). |
| Barco (2018) [25] | The authors reported dietary intake data in the baseline. Although groups were randomized after baseline assessments, statistical differences between groups at baseline were detected. Showed means (SD), Cohen’s d and p-value at baseline, and two post-intervention time points. | No significant changes in dietary intake were found. |
| Coleman (2012) [26] | The authors reported dietary intake data in the baseline, but not whether there were significant differences among the groups. Showed means (SD), F, p-value” at baseline and two post-intervention time points. | Unhealthy and healthy food and beverage items/child/week: outside unhealthy food items on intervention school campuses decreased over time (p < 0.001) while these items increased over time in control schools (p = 0.02). Unhealthy drink items on intervention school campuses decreased over time (p = 0.015) and control schools did not change. Outside healthy food items on intervention school campuses decreased (p = 0.03) and control school items did not change over time. |
| Collins (2014) [27] | The authors reported dietary intake data in the baseline but not whether there were significant differences among the groups. Showed means (SD), time p-value and group by time p-value at baseline, and post-intervention time point. | Percentage of energy from EDPN foods: >44% in both groups at baseline and this remained high at 12 months. Sweetened beverage/day: reduction in consumption, with a greater increase in the proportion consuming less than one sweetened beverage per day compared to the control girls (24–41% vs. 34–37%, p = 0.057). |
| Evans (2012) [28] | The collection of baseline data took place a few weeks after the “cafeteria” component of the intervention was applied, and therefore the baseline data were not usable as pretest measures. Showed means, estimated difference between treatment and control (SE), and p-value according to exposure to one or more/two or more intervention components, controlling for gender, race/ethnicity, and SES. | Since the comparison group includes students with exposure to one or more SHK components, treatment effects are relatively attenuated. Compared with students who were exposed to fewer than two components in SHK intervention, students who were exposed to two or more of the components scored significantly higher on fruit and vegetables intake, self-efficacy, and knowledge measures at posttest (p < 0.05) and significantly lower on the preference for unhealthy foods scale (p < 0.01). |
| Horton (2013) [29] | The authors did not report dietary intake data on the baseline. However, they showed the post-intervention results adjusted for baseline value, mother´s race, education, and marital status (means (SE), p-value). | Intervention effects were observed on weekly fast food consumption (p < 0.05) and 0.14 more daily cups of vegetables, which was not statistically significant. |
| Nollen [30] | The authors reported dietary intake data in the baseline but not whether there were significant differences among the groups. They reported that the seven girls lost to follow-up (four MT and three control) did not differ from the 44 completers on total energy or percentage of calories obtained from fat. Showed means (SD), Cohen’s d and p-value (between group and within group) at baseline, and two post-intervention time point. | Intervention group exhibited trends toward increased FVs (+0.88, p = 0.08) and decreased SSBs (−0.33, p = 0.09). The adjusted difference between groups of 1.0 servings of FV (p = 0.13) and 0.35 servings of SSB (p = 0.25) was not statistically significant but indicated small to moderate effects of the intervention. |
| Nyberg (2016) [31] | The authors reported dietary intake data in the baseline. There were no significant baseline differences between the groups except for intake of ice-cream, chocolate, and sweets, with children in the control group consuming significantly more than those in the intervention group. Post-intervention time point: results of mixed Poisson regression adjusted for sex, parental education and baseline value (regression coefficient beta, p-value between intervention and control groups, CI = 95%) | At baseline, 70% of the participating children consumed at least 2 servings of fruit and vegetables daily at home. Forty percent of the children consumed at least one serving of unhealthy foods daily at baseline. At T2, the intervention group had a significantly lower intake of unhealthy foods (aggregated snacks, ice-cream, cookies, and sweets) (p (p = 0.01). This effect was sustained in boys at T3 (p = 0.03). Intake of unhealthy drinks (soft drink, flavored milk, and fruit juice above 1 serving) at T2 was significantly lower in the intervention group (p = 0.01) compared to the control group. This effect was not sustained at T3. |
| Overcash (2019) [38] | The authors reported dietary intake data in the baseline, but not whether there were significant differences among the groups. Sowed LSM (SE), p-value at baseline and three post-intervention time points. | Total vegetable intake as well as intake for all but 1 of the individual vegetables measured (legumes at baseline, p = 0.04) did not significantly differ between the intervention and control children at any of the 4 time points (baseline and three post-intervention time point). |
| Raush (2013) [32] | The authors did not provide intakes in either the baseline (T1) or the time point (post-intervention). They compared the percentage of children who showed a positive change versus the negative change in healthy food intake before and after the intervention. | Girls in the experimental group tended to increase their intake of the five foods targeted by the program; this attained statistical significance for skim milk (p = 0.03) and orange juice (p = 0.05). Girls of the control group showed a decrease (albeit non-significant) in their intake of skim milk and of low-sugar cereals. |
| Rees (2010) [35] | The authors reported dietary intake data in the baseline but not whether there were significant differences among the groups. Sowed change in dietary intake (number of servings/day) from baseline to follow-up. | Intake of brown bread increased from 0.39 to 0.51 servings/day in the intervention group with a smaller but significant increase in the control group also (from 0.28 to 0.35 servings/day). For the other foods, there were no significant effects of the tailored intervention above that of the control intervention. |
| Tamiru (2016) [33] | The variety of dietary intake of both the intervention and the control schools at baseline was almost similar except for protein source food and oil consumption. Mean difference (SE), p-Value (baseline, midline, and end line) | There was a significant difference (p < 0.001) between the intervention and control schools where there was a significant improvement of animal source food consumption among intervention schools (p < 0.001). |
| Wong 2016 [34] | The authors reported dietary intake data in the baseline but not whether there were significant differences among the groups. Sowed means (SE), p-value (baseline and the end of the 3–6-week sessions) | The fruit/vegetable scores and the nutrition label score were not different between the 2 groups (p ≥ 0.67). |
| Wright (2013) [36] | The authors reported dietary intake data in the baseline but not whether there were significant differences among the groups. Sowed means (SE), p-value (baseline and post-intervention time point). | There were no statistically significant between group differences. |
© 2020 by the authors. Licensee MDPI, Basel, Switzerland. This article is an open access article distributed under the terms and conditions of the Creative Commons Attribution (CC BY) license (http://creativecommons.org/licenses/by/4.0/).
Share and Cite
Pastor, R.; Tur, J.A. Effectiveness of Interventions to Promote Healthy Eating Habits in Children and Adolescents at Risk of Poverty: Systematic Review and Meta-Analysis. Nutrients 2020, 12, 1891. https://0-doi-org.brum.beds.ac.uk/10.3390/nu12061891
Pastor R, Tur JA. Effectiveness of Interventions to Promote Healthy Eating Habits in Children and Adolescents at Risk of Poverty: Systematic Review and Meta-Analysis. Nutrients. 2020; 12(6):1891. https://0-doi-org.brum.beds.ac.uk/10.3390/nu12061891
Chicago/Turabian StylePastor, Rosario, and Josep A. Tur. 2020. "Effectiveness of Interventions to Promote Healthy Eating Habits in Children and Adolescents at Risk of Poverty: Systematic Review and Meta-Analysis" Nutrients 12, no. 6: 1891. https://0-doi-org.brum.beds.ac.uk/10.3390/nu12061891