Phase Angle: Could Be an Easy Tool to Detect Low-Grade Systemic Inflammation in Adults Affected by Prader–Willi Syndrome?

 ,
, 

 and
and
Abstract
:1. Introduction
2. Material and Methods
- Age <18 years and >45 years;
- Smokers;
- Subjects who habitually practiced physical activity, defined as an aerobic exercise lasting at least 30 min/day;
- Presence of type 2 diabetes mellitus according to the American Diabetes Association criteria or use of hypoglycemic drugs;
- Individuals with implanted devices such as pacemakers or defibrillators, because of the theoretical possible interference;
- Current therapy with anti-obesity drugs;
- Chronic diseases that could interfere with fluid homeostasis (chronic inflammatory diseases, liver or renal chronic diseases) based on a complete medical examination and laboratory investigations.
Statistical Analysis
3. Results
Correlation Analysis
4. Discussion
5. Conclusions
Supplementary Materials
Author Contributions
Funding
Acknowledgments
Conflicts of Interest
Abbreviations
References
- Cassidy, S.B.; Schwartz, S.; Miller, J.L.; Driscoll, D.J. Prader-Willi syndrome. Genet. Med. 2012, 14, 10–26. [Google Scholar] [CrossRef] [PubMed] [Green Version]
- Goldstone, A.P.; Holland, A.J.; Hauffa, B.P.; Hokken-Koelega, A.C.; Tauber, M. Recommendations for the diagnosis and management of Prader-Willi syndrome. J. Clin. Endocrinol. Metab. 2008, 93, 4183–4197. [Google Scholar] [CrossRef] [PubMed]
- Whittington, J.; Holland, A.; Webb, T.; Butler, J.; Clarke, D.; Boer, H. Cognitive abilities and genotype in a population-based sample of people with Prader-Willi syndrome. J. Intellect. Disabil. Res. 2004, 48, 172–187. [Google Scholar] [CrossRef]
- Alfaro, D.L.P.; Lemoine, P.; Ehlinger, V.; Molinas, C.; Diene, G.; Valette, M.; Pinto, G.; Coupaye, M.; Poitou-Bernert, C.; Thuilleaux, D.; et al. Causes of death in Prader-Willi syndrome: Lessons from 11 years’ experience of a national reference center. Orphanet J. Rare Dis. 2019, 14, 1–10. [Google Scholar] [CrossRef] [Green Version]
- Chawla, A.; Nguyen, K.D.; Goh, Y.P.S. Macrophage-Mediated inflammation in metabolic disease. Nat. Rev. Immunol. 2011, 11, 738–749. [Google Scholar] [CrossRef] [Green Version]
- Zatterale, F.; Longo, M.; Naderi, J.; Raciti, G.A.; Desiderio, A.; Miele, C.; Beguinot, F. Chronic Adipose Tissue Inflammation Linking Obesity to Insulin Resistance and Type 2 Diabetes. Front. Physiol. 2020, 10, 1607. [Google Scholar] [CrossRef]
- Butler, M.G.; Bittel, D.C.; Kibiryeva, N.; Garg, U. C-Reactive protein levels in subjects with Prader-Willi syndrome and obesity. Genet. Med. 2006, 8, 243–248. [Google Scholar] [CrossRef] [Green Version]
- Caixàs, A.; Giménez-Palop, O.; Broch, M.; Vilardell, C.; Megía, A.; Simón, I.; Giménez-Pérez, G.; Mauricio, D.; Vendrell, J.; Richart, C.; et al. Adult subjects with Prader-Willi syndrome show more low-grade systemic inflammation than matched obese subjects. J. Endocrinol. Invest. 2008, 31, 169–175. [Google Scholar] [CrossRef]
- Höybye, C. Inflammatory markers in adults with prader-willi syndrome before and during 12 months growth hormone treatment. Horm. Res. 2006, 66, 27–32. [Google Scholar] [CrossRef]
- Barbosa-Silva, M.C.G.; Barros, A.J.D. Bioelectrical impedance analysis in clinical practice: A new perspective on its use beyond body composition equations. Curr. Opin. Clin. Nutr. Metab. Care 2005, 8, 311–317. [Google Scholar] [CrossRef]
- Norman, K.; Stobäus, N.; Pirlich, M.; Bosy-Westphal, A. Bioelectrical phase angle and impedance vector analysis - Clinical relevance and applicability of impedance parameters. Clin. Nutr. 2012, 31, 854–861. [Google Scholar] [CrossRef] [PubMed]
- Stobäus, N.; Pirlich, M.; Valentini, L.; Schulzke, J.D.; Norman, K. Determinants of bioelectrical phase angle in disease. Br. J. Nutr. 2012, 107, 1217–1220. [Google Scholar] [CrossRef] [Green Version]
- Gonzalez, M.C.; Barbosa-Silva, T.G.; Bielemann, R.M.; Gallagher, D.; Heymsfield, S.B. Phase angle and its determinants in healthy subjects: Influence of body composition. Am. J. Clin. Nutr. 2016, 103, 712–716. [Google Scholar] [CrossRef] [PubMed] [Green Version]
- Kyle, U.G.; Bosaeus, I.; De Lorenzo, A.D.; Deurenberg, P.; Elia, M.; Gómez, J.M.; Heitmann, B.L.; Kent-Smith, L.; Melchior, J.C.; Pirlich, M.; et al. Bioelectrical impedance analysis–Part II: Utilization in clinical practice. Clin. Nutr. 2004, 23, 1430–1453. [Google Scholar] [CrossRef] [PubMed]
- Pham-Huy, L.A.; He, H.; Pham-Huy, C. Free radicals, antioxidants in disease and health. Int. J. Biomed. Sci. 2008, 4, 89. [Google Scholar] [PubMed]
- Selberg, O.; Selberg, D. Norms and correlates of bioimpedance phase angle in healthy human subjects, hospitalized patients, and patients with liver cirrhosis. Eur. J. Appl. Physiol. 2002, 86, 509–516. [Google Scholar] [CrossRef] [PubMed] [Green Version]
- Norman, K.; Stobäus, N.; Zocher, D.; Bosy-Westphal, A.; Szramek, A.; Scheufele, R.; Smoliner, C.; Pirlich, M. Cutoff percentiles of bioelectrical phase angle predict functionality, quality of life, and mortality in patients with cancer. Am. J. Clin. Nutr. 2010, 92, 612–619. [Google Scholar] [CrossRef] [Green Version]
- De Luis, D.A.; Aller, R.; Romero, E.; Dueñas, A.; Perez Castrillon, J.L. Relation of phase angle tertiles with blood adipocytokines levels, insulin resistance and cardiovascular risk factors in obese women patients. Eur. Rev. Med. Pharmacol. Sci. 2010, 14, 521–526. [Google Scholar]
- Barrea, L.; Muscogiuri, G.; Laudisio, D.; Di Somma, C.; Salzano, C.; Pugliese, G.; de Alteriis, G.; Colao, A.; Savastano, S. Phase angle: A possible biomarker to quantify inflammation in subjects with obesity and 25(OH)D deficiency. Nutrients 2019, 11, 1747. [Google Scholar] [CrossRef] [Green Version]
- Barrea, L.; Muscogiuri, G.; Pugliese, G.; Aprano, S.; de Alteriis, G.; Di Somma, C.; Colao, A.; Savastano, S. The Sun’s Vitamin in Adult Patients Affected by Prader–Willi Syndrome. Nutrients 2020, 12, 1132. [Google Scholar] [CrossRef]
- ClinCalc.com. Sample Size Calculator. Available online: https://clincalc.com/stats/samplesize.aspx (accessed on 30 April 2020).
- Barrea, L.; Annunziata, G.; Muscogiuri, G.; Laudisio, D.; Di Somma, C.; Maisto, M.; Tenore, G.C.; Colao, A.; Savastano, S. Trimethylamine N-oxide, Mediterranean diet, and nutrition in healthy, normal-weight adults: also a matter of sex? Nutrition 2019, 62, 7–17. [Google Scholar] [CrossRef] [PubMed]
- Barrea, L.; Muscogiuri, G.; Di Somma, C.; Tramontano, G.; De Luca, V.; Illario, M.; Colao, A.; Savastano, S. Association between Mediterranean diet and hand grip strength in older adult women. Clin. Nutr. 2018, 38, 721–729. [Google Scholar] [CrossRef] [PubMed]
- Savastano, S.; Di Somma, C.; Colao, A.; Barrea, L.; Orio, F.; Finelli, C.; Pasanisi, F.; Contaldo, F.; Tarantino, G. Preliminary data on the relationship between circulating levels of Sirtuin 4, anthropometric and metabolic parameters in obese subjects according to growth hormone/insulin-like growth factor-1 status. Growth Horm. IGF Res. 2015, 25, 28–33. [Google Scholar] [CrossRef] [PubMed]
- WHO. World Health Organization. Available online: http://www.euro.who.int/en/health-topics/disease-prevention/nutrition/a-healthy-lifestyle/body-mass-index-bmi (accessed on 4 May 2020).
- Nishida, C.; Ko, G.T.; Kumanyika, S. Body fat distribution and noncommunicable diseases in populations: Overview of the 2008 WHO Expert Consultation on Waist Circumference and Waist-Hip Ratio. Eur. J. Clin. Nutr. 2010, 64, 2–5. [Google Scholar] [CrossRef] [PubMed] [Green Version]
- Barrea, L.; Fabbrocini, G.; Annunziata, G.; Muscogiuri, G.; Donnarumma, M.; Marasca, C.; Colao, A.; Savastano, S. Role of nutrition and adherence to the mediterranean diet in the multidisciplinary approach of hidradenitis suppurativa: Evaluation of nutritional status and its association with severity of disease. Nutrients 2019, 11, 57. [Google Scholar] [CrossRef] [Green Version]
- Barrea, L.; Altieri, B.; Muscogiuri, G.; Laudisio, D.; Annunziata, G.; Colao, A.; Faggiano, A.; Savastano, S. Impact of nutritional status on gastroenteropancreatic neuroendocrine tumors (GEP-NET) aggressiveness. Nutrients 2018, 10, 1854. [Google Scholar] [CrossRef] [Green Version]
- Muscogiuri, G.; Barrea, L.; Di Somma, C.; Laudisio, D.; Salzano, C.; Pugliese, G.; de Alteriis, G.; Colao, A.; Savastano, S. Sex differences of vitamin D status across BMI classes: An observational prospective cohort study. Nutrients 2019, 11, 3034. [Google Scholar] [CrossRef] [Green Version]
- Kushner, R.F. Bioelectrical impedance analysis: A review of principles and applications. J. Am. Coll. Nutr. 1992, 11, 199–209. [Google Scholar]
- Yanovski, S.Z.; Hubbard, V.S.; Heymsfield, S.B.; Lukaski, H.C. Bioelectrical impedance analysis in body composition measurement: National institutes of health technology assessment conference statement. Am. J. Clin. Nutr. 1996, 64, 524S–532S. [Google Scholar]
- Bedogni, G.; Grugni, G.; Tringali, G.; Agosti, F.; Sartorio, A. Assessment of fat-free mass from bioelectrical impedance analysis in obese women with Prader-Willi syndrome. Ann. Hum. Biol. 2015, 42, 538–542. [Google Scholar] [CrossRef]
- Bedogni, G.; Grugni, G.; Tringali, G.; Tamini, S.; Marzullo, P.; Sartorio, A. Assessment of fat-free mass from bioelectrical impedance analysis in men and women with Prader-Willi syndrome: Cross-Sectional study. Int. J. Food Sci. Nutr. 2019, 70, 645–649. [Google Scholar] [CrossRef] [PubMed]
- Gray, D.S.; Bray, G.A.; Gemayel, N.; Kaplan, K. Effect of obesity on bioelectrical impedance. Am. J. Clin. Nutr. 1989, 50, 255–260. [Google Scholar] [CrossRef] [PubMed]
- Lazzer, S.; Grugni, G.; Tringali, G.; Sartorio, A. Prediction of basal metabolic rate in patients with Prader-Willi syndrome. Eur. J. Clin. Nutr. 2016, 70, 494–498. [Google Scholar] [CrossRef] [PubMed]
- Barbosa-Silva, M.C.G.; Barros, A.J.D.; Wang, J.; Heymsfield, S.B.; Pierson, R.N. Bioelectrical impedance analysis: Population reference values for phase angle by age and sex. Am. J. Clin. Nutr. 2005, 82, 49–52. [Google Scholar] [CrossRef]
- Choi, J.; Joseph, L.; Pilote, L. Obesity and C-reactive protein in various populations: A systematic review and meta-analysis. Obes. Rev. 2013, 14, 232–244. [Google Scholar] [CrossRef]
- Kao, T.W.; Lu, I.S.; Liao, K.C.; Lai, H.Y.; Loh, C.H.; Kuo, H.K. Associations between body mass index and serum levels of C-reactive protein. S. Afr. Med. J. 2009, 99. [Google Scholar] [CrossRef]
- Park, H.S.; Park, J.Y.; Yu, R. Relationship of obesity and visceral adiposity with serum concentrations of CRP, TNF-α and IL-6. Diabetes Res. Clin. Pract. 2005, 69, 29–35. [Google Scholar] [CrossRef]
- Nakamura, H.; Ito, H.; Egami, Y.; Kaji, Y.; Maruyama, T.; Koike, G.; Jingu, S.; Harada, M. Waist circumference is the main determinant of elevated C-reactive protein in metabolic syndrome. Diabetes Res. Clin. Pract. 2008, 79, 330–336. [Google Scholar] [CrossRef]
- Anja, B.W.; Danielzik, S.; Dörhöfer, R.P.; Later, W.; Wiese, S.; Müller, M.J. Phase angle from bioelectrical impedance analysis: Population reference values by age, sex, and body mass index. J. Parenter. Enter. Nutr. 2006, 30, 309–316. [Google Scholar] [CrossRef]
- Buffa, R.; Floris, G.; Marini, E. Migration of the bioelectrical impedance vector in healthy elderly subjects. Nutrition 2003, 19, 917–921. [Google Scholar] [CrossRef]
- Lowe, G.D.O.; Fowkes, F.G.R.; Dawes, J.; Donnan, P.T.; Lennie, S.E.; Housley, E. Blood viscosity, fibrinogen, and activation of coagulation and leukocytes in peripheral arterial disease and the normal population in the Edinburgh artery study. Circulation 1993, 87, 1915–1920. [Google Scholar] [CrossRef] [PubMed] [Green Version]
- Barrea, L.; Arnone, A.; Annunziata, G.; Muscogiuri, G.; Laudisio, D.; Salzano, C.; Pugliese, G.; Colao, A.; Savastano, S. Adherence to the mediterranean diet, dietary patterns and body composition in women with polycystic ovary syndrome (PCOS). Nutrients 2019, 11, 2278. [Google Scholar] [CrossRef] [PubMed] [Green Version]
- Barrea, L.; Macchia, P.E.; Di Somma, C.; Napolitano, M.; Balato, A.; Falco, A.; Savanelli, M.C.; Balato, N.; Colao, A.; Savastano, S. Bioelectrical phase angle and psoriasis: A novel association with psoriasis severity, quality of life and metabolic syndrome. J. Transl. Med. 2016, 14, 130. [Google Scholar] [CrossRef] [Green Version]
- Barrea, L.; Nappi, F.; Di Somma, C.; Savanelli, M.C.; Falco, A.; Balato, A.; Balato, N.; Savastano, S. Environmental risk factors in psoriasis: The point of view of the nutritionist. Int. J. Environ. Res. Public Health 2016, 13, 743. [Google Scholar] [CrossRef] [Green Version]
- Demirci, M.S.; Demirci, C.; Ozdogan, O.; Kircelli, F.; Akcicek, F.; Basci, A.; Ok, E.; Ozkahya, M. Relations between malnutritioninflammationatherosclerosis and volume status. The usefulness of bioimpedance analysis in peritoneal dialysis patients. Nephrol. Dial. Transplant. 2011, 26, 1708–1716. [Google Scholar] [CrossRef] [Green Version]
- Tomeleri, C.M.; Cavaglieri, C.R.; de Souza, M.F.; Cavalcante, E.F.; Antunes, M.; Nabbuco, H.C.G.; Venturini, D.; Barbosa, D.S.; Silva, A.M.; Cyrino, E.S. Phase angle is related with inflammatory and oxidative stress biomarkers in older women. Exp. Gerontol. 2018, 102, 12–18. [Google Scholar] [CrossRef]
- Xu, Y.; Xie, X.; Duan, Y.; Wang, L.; Cheng, Z.; Cheng, J. A review of impedance measurements of whole cells. Biosens. Bioelectron. 2016, 77, 824–836. [Google Scholar] [CrossRef] [PubMed]
- Marini, E.; Buffa, R.; Saragat, B.; Coin, A.; Toffanello, E.D.; Berton, L.; Manzato, E.; Sergi, G. The potential of classic and specific bioelectrical impedance vector analysis for the assessment of sarcopenia and sarcopenic obesity. Clin. Interv. Aging 2012, 7, 585. [Google Scholar] [CrossRef] [PubMed] [Green Version]
- Li, F.; Li, Y.; Duan, Y.; Hu, C.A.A.; Tang, Y.; Yin, Y. Myokines and adipokines: Involvement in the crosstalk between skeletal muscle and adipose tissue. Cytokine Growth Factor Rev. 2017, 33, 73–82. [Google Scholar] [CrossRef]
- Tilg, H.; Moschen, A.R. Adipocytokines: Mediators linking adipose tissue, inflammation and immunity. Nat. Rev. Immunol. 2006, 6, 772–783. [Google Scholar] [CrossRef]
- Berg, A.H.; Scherer, P.E. Adipose tissue, inflammation, and cardiovascular disease. Circ. Res. 2005, 96, 939–949. [Google Scholar] [CrossRef] [PubMed] [Green Version]
- Fantuzzi, G. Adipose tissue, adipokines, and inflammation. J. Allergy Clin. Immunol. 2005, 115, 911–919. [Google Scholar] [CrossRef] [PubMed]
- Greenberg, A.S.; Obin, M.S. Obesity and the role of adipose tissue in inflammation and metabolism. Am. J. Clin. Nutr. 2006, 83, 461S–465S. [Google Scholar] [CrossRef] [Green Version]
- Trayhurn, P.; Wang, B.; Wood, I.S. Hypoxia in adipose tissue: A basis for the dysregulation of tissue function in obesity? Br. J. Nutr. 2008, 100, 227–235. [Google Scholar] [CrossRef] [PubMed] [Green Version]
- Bisoendial, R.J.; Birjmohun, R.S.; Akdim, F.; van ’t Veer, C.; Spek, C.A.; Hartman, D.; de Groot, E.R.; Bankaitis-Davis, D.M.; Kastelein, J.J.P.; Stroes, E.S.G. C-Reactive Protein Elicits White Blood Cell Activation in Humans. Am. J. Med. 2009. [Google Scholar] [CrossRef]
- Avan, A.; Tavakoly Sany, S.B.; Ghayour-Mobarhan, M.; Rahimi, H.R.; Tajfard, M.; Ferns, G. Serum C-reactive protein in the prediction of cardiovascular diseases: Overview of the latest clinical studies and public health practice. J. Cell. Physiol. 2018, 233, 8508–8525. [Google Scholar] [CrossRef]
- Ragino, Y.I.; Stakhneva, E.M.; Polonskaya, Y.V.; Kashtanova, E.V. The role of secretory activity molecules of visceral adipocytes in abdominal obesity in the development of cardiovascular disease: A review. Biomolecules 2020, 10, 374. [Google Scholar] [CrossRef] [Green Version]
- Tchernof, A.; Després, J.P. Pathophysiology of human visceral obesity: An update. Physiol. Rev. 2013, 93, 359–404. [Google Scholar] [CrossRef]
- Kobayashi, S.; Inoue, N.; Ohashi, Y.; Terashima, M.; Matsui, K.; Mori, T.; Fujita, H.; Awano, K.; Kobayashi, K.; Azumi, H.; et al. Interaction of oxidative stress and inflammatory response in coronary plaque instability: Important role of C-reactive protein. Arterioscler. Thrombosis Vasc. Biol. 2003, 23, 1398–1404. [Google Scholar] [CrossRef] [Green Version]
- Ryu, J.; Lee, C.W.; Shin, J.A.; Park, C.S.; Kim, J.J.; Park, S.J.; Han, K.H. FcγRIIa mediates C-reactive protein-induced inflammatory responses of human vascular smooth muscle cells by activating NADPH oxidase 4. Cardiovasc. Res. 2007, 75, 555–565. [Google Scholar] [CrossRef]
- Sproston, N.R.; Ashworth, J.J. Role of C-reactive protein at sites of inflammation and infection. Front. Immunol. 2018, 9, 754. [Google Scholar] [CrossRef] [PubMed]
- Kotani, K.; Sakane, N. C-reactive protein and reactive oxygen metabolites in subjects with metabolic syndrome. J. Int. Med. Res. 2012, 40, 1074–1081. [Google Scholar] [CrossRef] [Green Version]
- Janssen, Y.M.; Van Houten, B.; Borm, P.J.; Mossman, B.T. Cell and tissue responses to oxidative damage. Lab. Invest. A J. Tech. Methods Pathol. 1993, 69, 261. [Google Scholar]
- Chen, L.; Deng, H.; Cui, H.; Fang, J.; Zuo, Z.; Deng, J.; Li, Y.; Wang, X.; Zhao, L. Inflammatory responses and inflammation-associated diseases in organs. Oncotarget 2018, 9, 7204. [Google Scholar] [CrossRef] [Green Version]
- Muscogiuri, G.; Formoso, G.; Pugliese, G.; Ruggeri, R.M.; Scarano, E.; Colao, A. Prader- Willi syndrome: An uptodate on endocrine and metabolic complications. Rev. Endocr. Metab. Disord. 2019, 20, 239–250. [Google Scholar] [CrossRef] [PubMed]
- Crinò, A.; Fintini, D.; Bocchini, S.; Grugni, G. Obesity management in Prader–Willi syndrome: Current perspectives. Diabetes Metab. Syndr. Obes. Targets Ther. 2018, 11, 579. [Google Scholar] [CrossRef] [PubMed] [Green Version]
- Olsson, L.M.; Poitou, C.; Tremaroli, V.; Coupaye, M.; Aron-Wisnewsky, J.; Bäckhed, F.; Clément, K.; Caesar, R. Gut microbiota of obese subjects with Prader-Willi syndrome is linked to metabolic health. Gut 2019, 69, 1229–1238. [Google Scholar] [CrossRef] [Green Version]
- van Nieuwpoort, I.C.; Twisk, J.W.R.; Curfs, L.M.G.; Lips, P.; Drent, M.L. Body composition, adipokines, bone mineral density and bone remodeling markers in relation to IGF-1 levels in adults with Prader-Willi syndrome. Int. J. Pediatr. Endocrinol. 2018, 2018, 1. [Google Scholar] [CrossRef] [Green Version]
- Faienza, M.F.; Ventura, A.; Lauciello, R.; Crinò, A.; Ragusa, L.; Cavallo, L.; Spera, S.; Grugni, G. Analysis of endothelial protein c receptor gene and metabolic profile in prader-willi syndrome and obese subjects. Obesity 2012, 20, 1866–1870. [Google Scholar] [CrossRef]
- Ortega, O.; Gallar, P.; Muñoz, M.; Rodríguez, I.; Carreño, A.; Ortiz, M.; Molina, A.; Oliet, A.; Lozano, L.; Vigil, A. Association between C-Reactive Protein Levels and N-Terminal Pro-B-Type Natriuretic Peptide in Pre-Dialysis Patients. Nephron Clin. Pract. 2004, 97, c125–c130. [Google Scholar] [CrossRef]
- Gonçalves, S.; Pecoits-Filho, R.; Perreto, S.; Barberato, S.H.; Stinghen, A.E.M.; Lima, E.G.A.; Fuerbringer, R.; Sauthier, S.M.; Riella, M.C. Associations between renal function, volume status and endotoxaemia in chronic kidney disease patients. Nephrol. Dial. Transplant. 2006, 21, 2788–2794. [Google Scholar] [CrossRef] [PubMed] [Green Version]
- Sprague, A.H.; Khalil, R.A. Inflammatory cytokines in vascular dysfunction and vascular disease. Biochem. Pharmacol. 2009, 78, 539–552. [Google Scholar] [CrossRef] [Green Version]
- Cai, Z.; Jitkaew, S.; Zhao, J.; Chiang, H.C.; Choksi, S.; Liu, J.; Ward, Y.; Wu, L.G.; Liu, Z.G. Plasma membrane translocation of trimerized MLKL protein is required for TNF-induced necroptosis. Nat. Cell Biol. 2014, 16, 55–65. [Google Scholar] [CrossRef] [PubMed]
- Kyle, U.G.; Soundar, E.P.; Genton, L.; Pichard, C. Can phase angle determined by bioelectrical impedance analysis assess nutritional risk? A comparison between healthy and hospitalized subjects. Clin. Nutr. 2012, 31, 875–881. [Google Scholar] [CrossRef] [PubMed]


| Parameters | PWS Adults n= 15 | Control Group n = 15 | * p-Value |
|---|---|---|---|
| Weight (kg) | 104.4 ± 34.4 | 120.5 ± 26.3 | 0.12 |
| R (Ω) | 445.6 ± 63.7 | 466.3 ± 53.3 | 0.28 |
| Xc (Ω) | 35.1 ± 9.4 | 45.8 ± 4.5 | 0.001 |
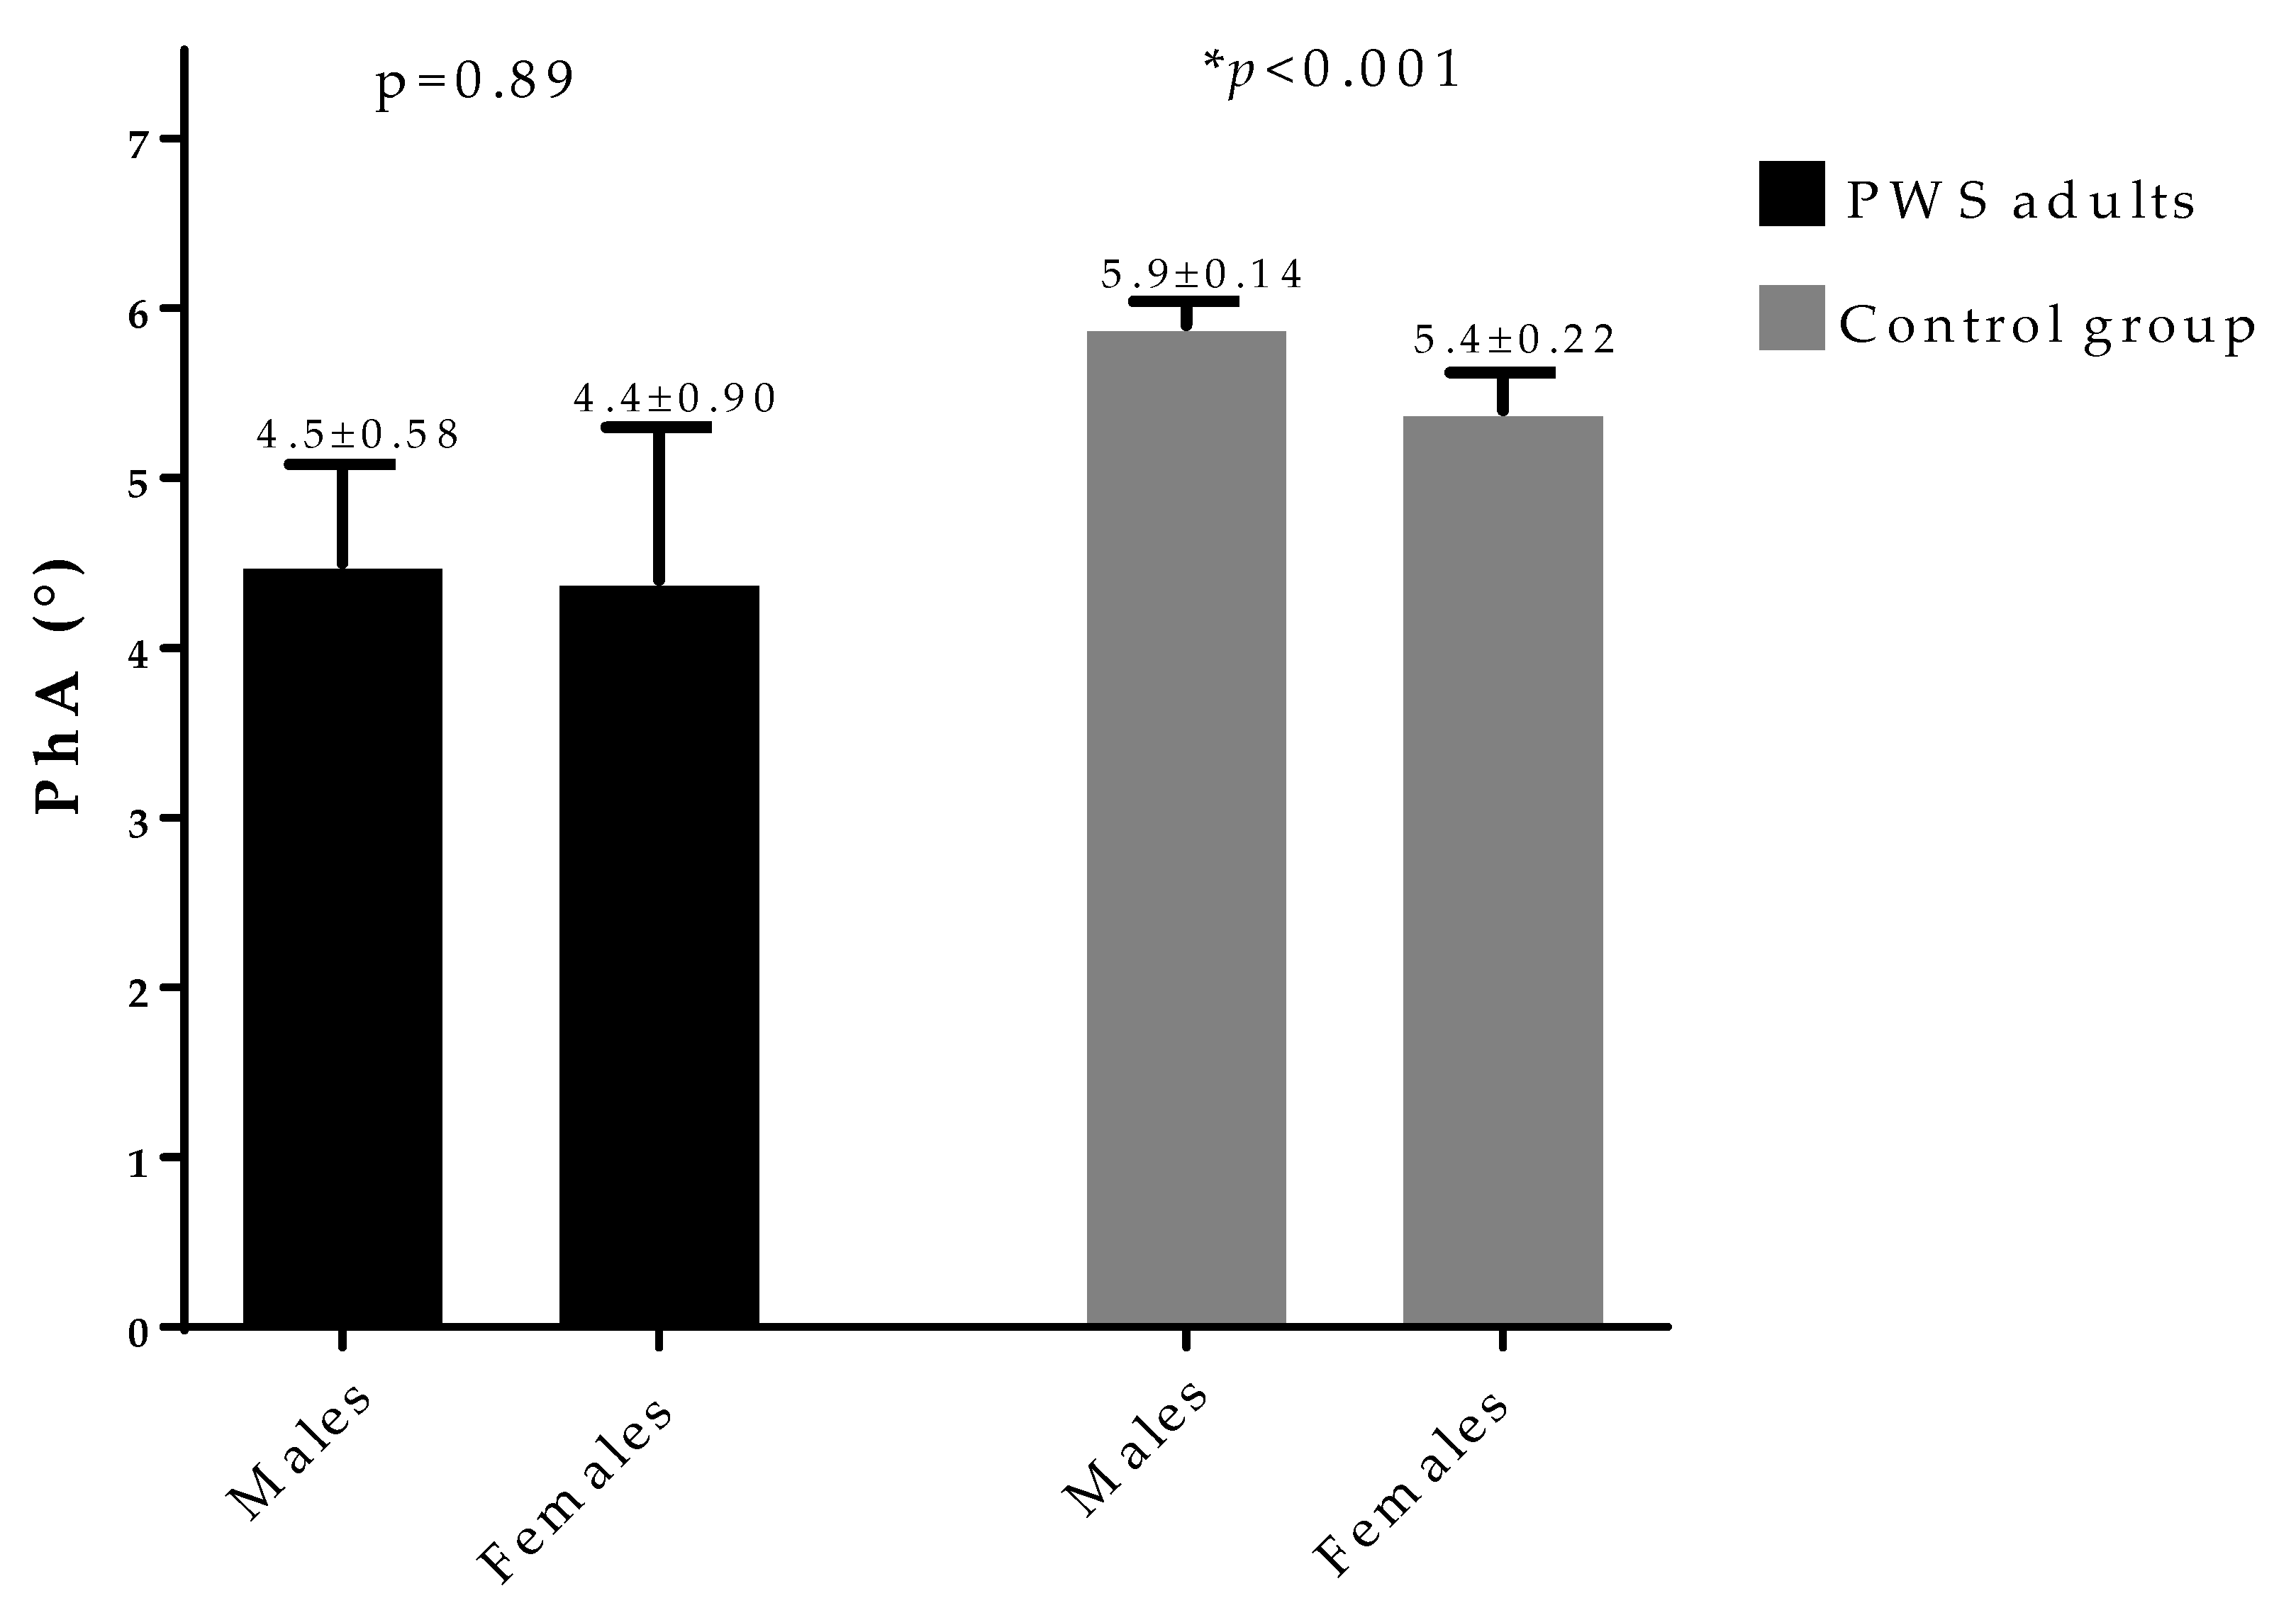
| PhA (°) | 4.5 ± 0.8 | 5.6 ± 0.3 | <0.001 |
| TBW (Lt) | 42.7 ± 12.2 | 43.6 ± 4.7 | 0.79 |
| ICW (Lt) | 19.3 ± 5.7 | 22.9 ± 2.9 | 0.06 |
| ECW (Lt) | 23.4 ± 7.4 | 20.7 ± 1.8 | 0.18 |
| ECW/ICW ratio | 1.2 ± 0.3 | 0.9 ± 0.1 | <0.001 |
| FM (Kg) | 49.9 ± 24.3 | 61.6 ± 22.6 | 0.10 |
| FFM (Kg) | 54.5 ± 13.7 | 58.9 ± 5.8 | 0.29 |
| Parameters | PhA (°) n = 15 | hs-CRP Levels (ng/mL) n = 15 | ||||||
|---|---|---|---|---|---|---|---|---|
| Simple Correlations | Adjusted for Gender, BMI, Waist Circumference | Simple Correlations | Adjusted for Gender, BMI, Waist Circumference | |||||
| r | * p-Value | r | * p-Value | r | * p-Value | r | * p-Value | |
| Age (years) | 0.03 | 0.92 | 0.18 | 0.58 | 0.21 | 0.46 | 0.18 | 0.59 |
| BMI (kg/m2) | −0.56 | 0.03 | - | - | 0.64 | 0.01 | - | - |
| Waist circumference (cm) | −0.51 | 0.04 | - | - | 0.74 | 0.002 | - | - |
| ICW (Lt) | 0.17 | 0.54 | 0.88 | <0.001 | 0.33 | 0.23 | −0.77 | 0.004 |
| ECW (Lt) | −0.56 | 0.03 | −0.75 | 0.01 | 0.77 | 0.001 | 0.28 | 0.38 |
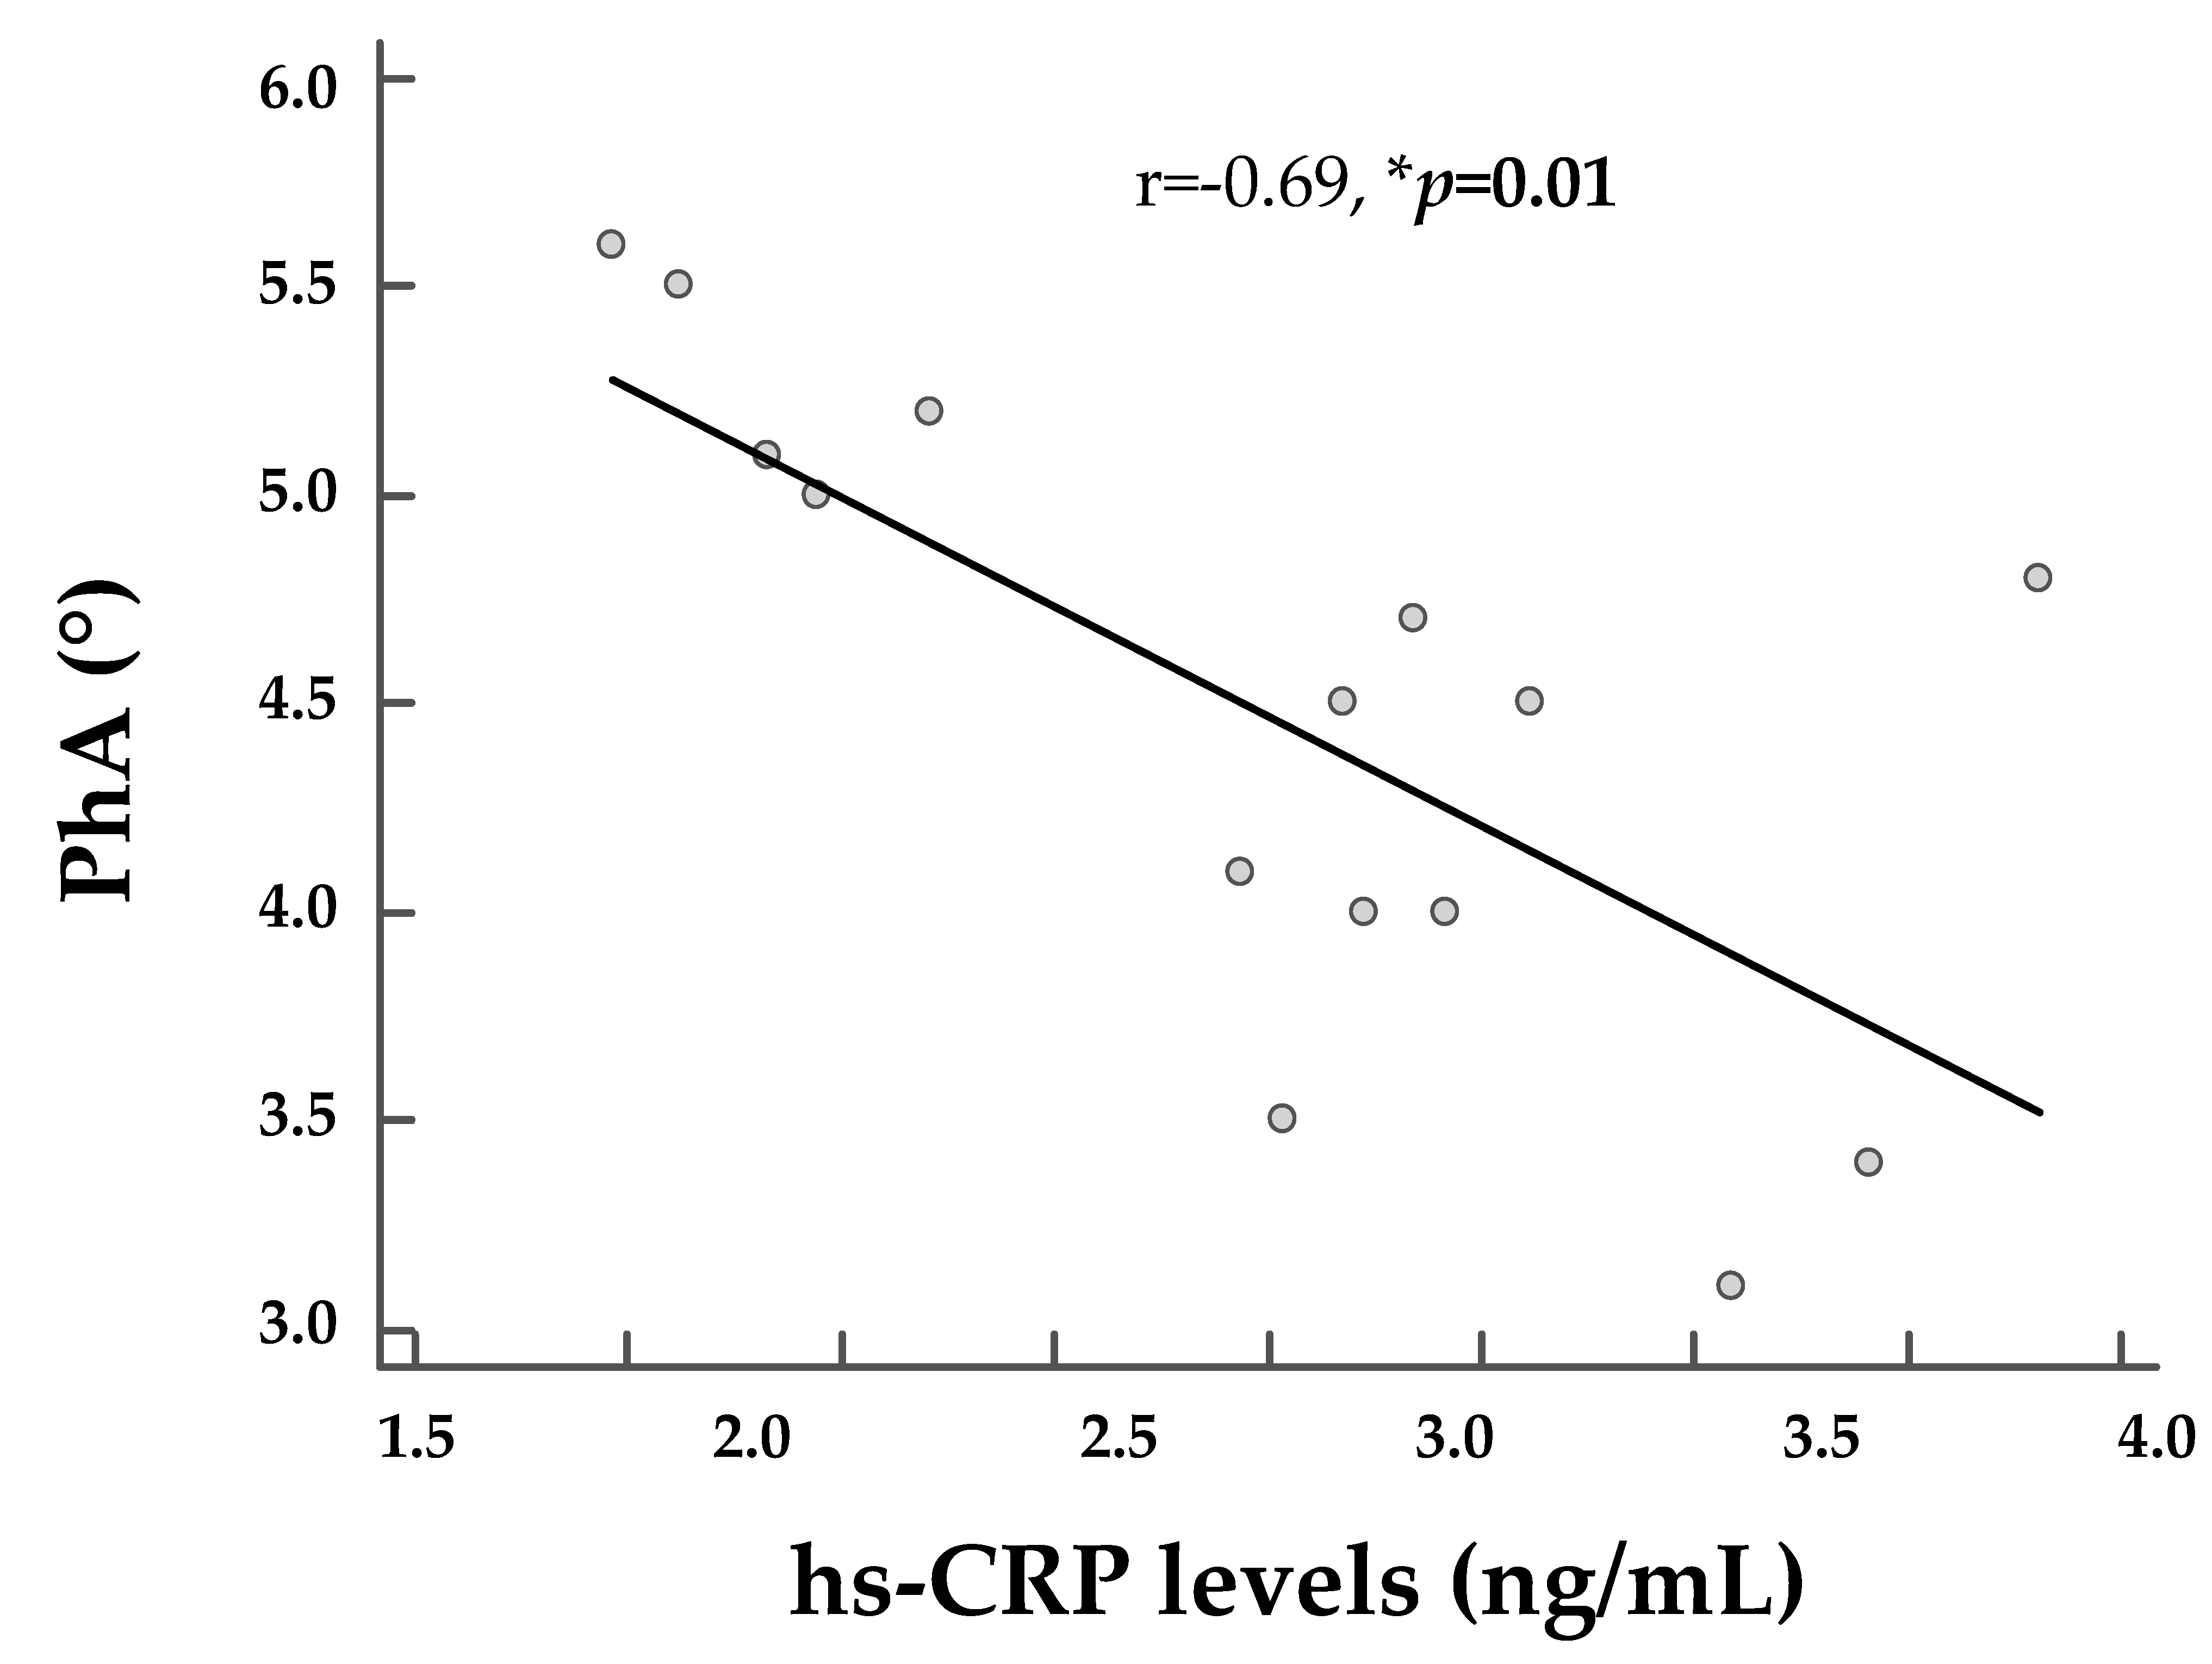
| ECW/ICW ratio | −0.99 | <0.001 | −0.99 | <0.001 | 0.67 | 0.01 | 0.68 | 0.01 |
| FM (Kg) | −0.60 | 0.02 | −0.18 | 0.57 | 0.66 | 0.01 | −0.01 | 0.96 |
| Parameters | Multiple Regression Analysis | |||
|---|---|---|---|---|
| R2 | β | t | * p-Value | |
| ECW/ICW ratio | 0.98 | −0.94 | −26.8 | <0.001 |
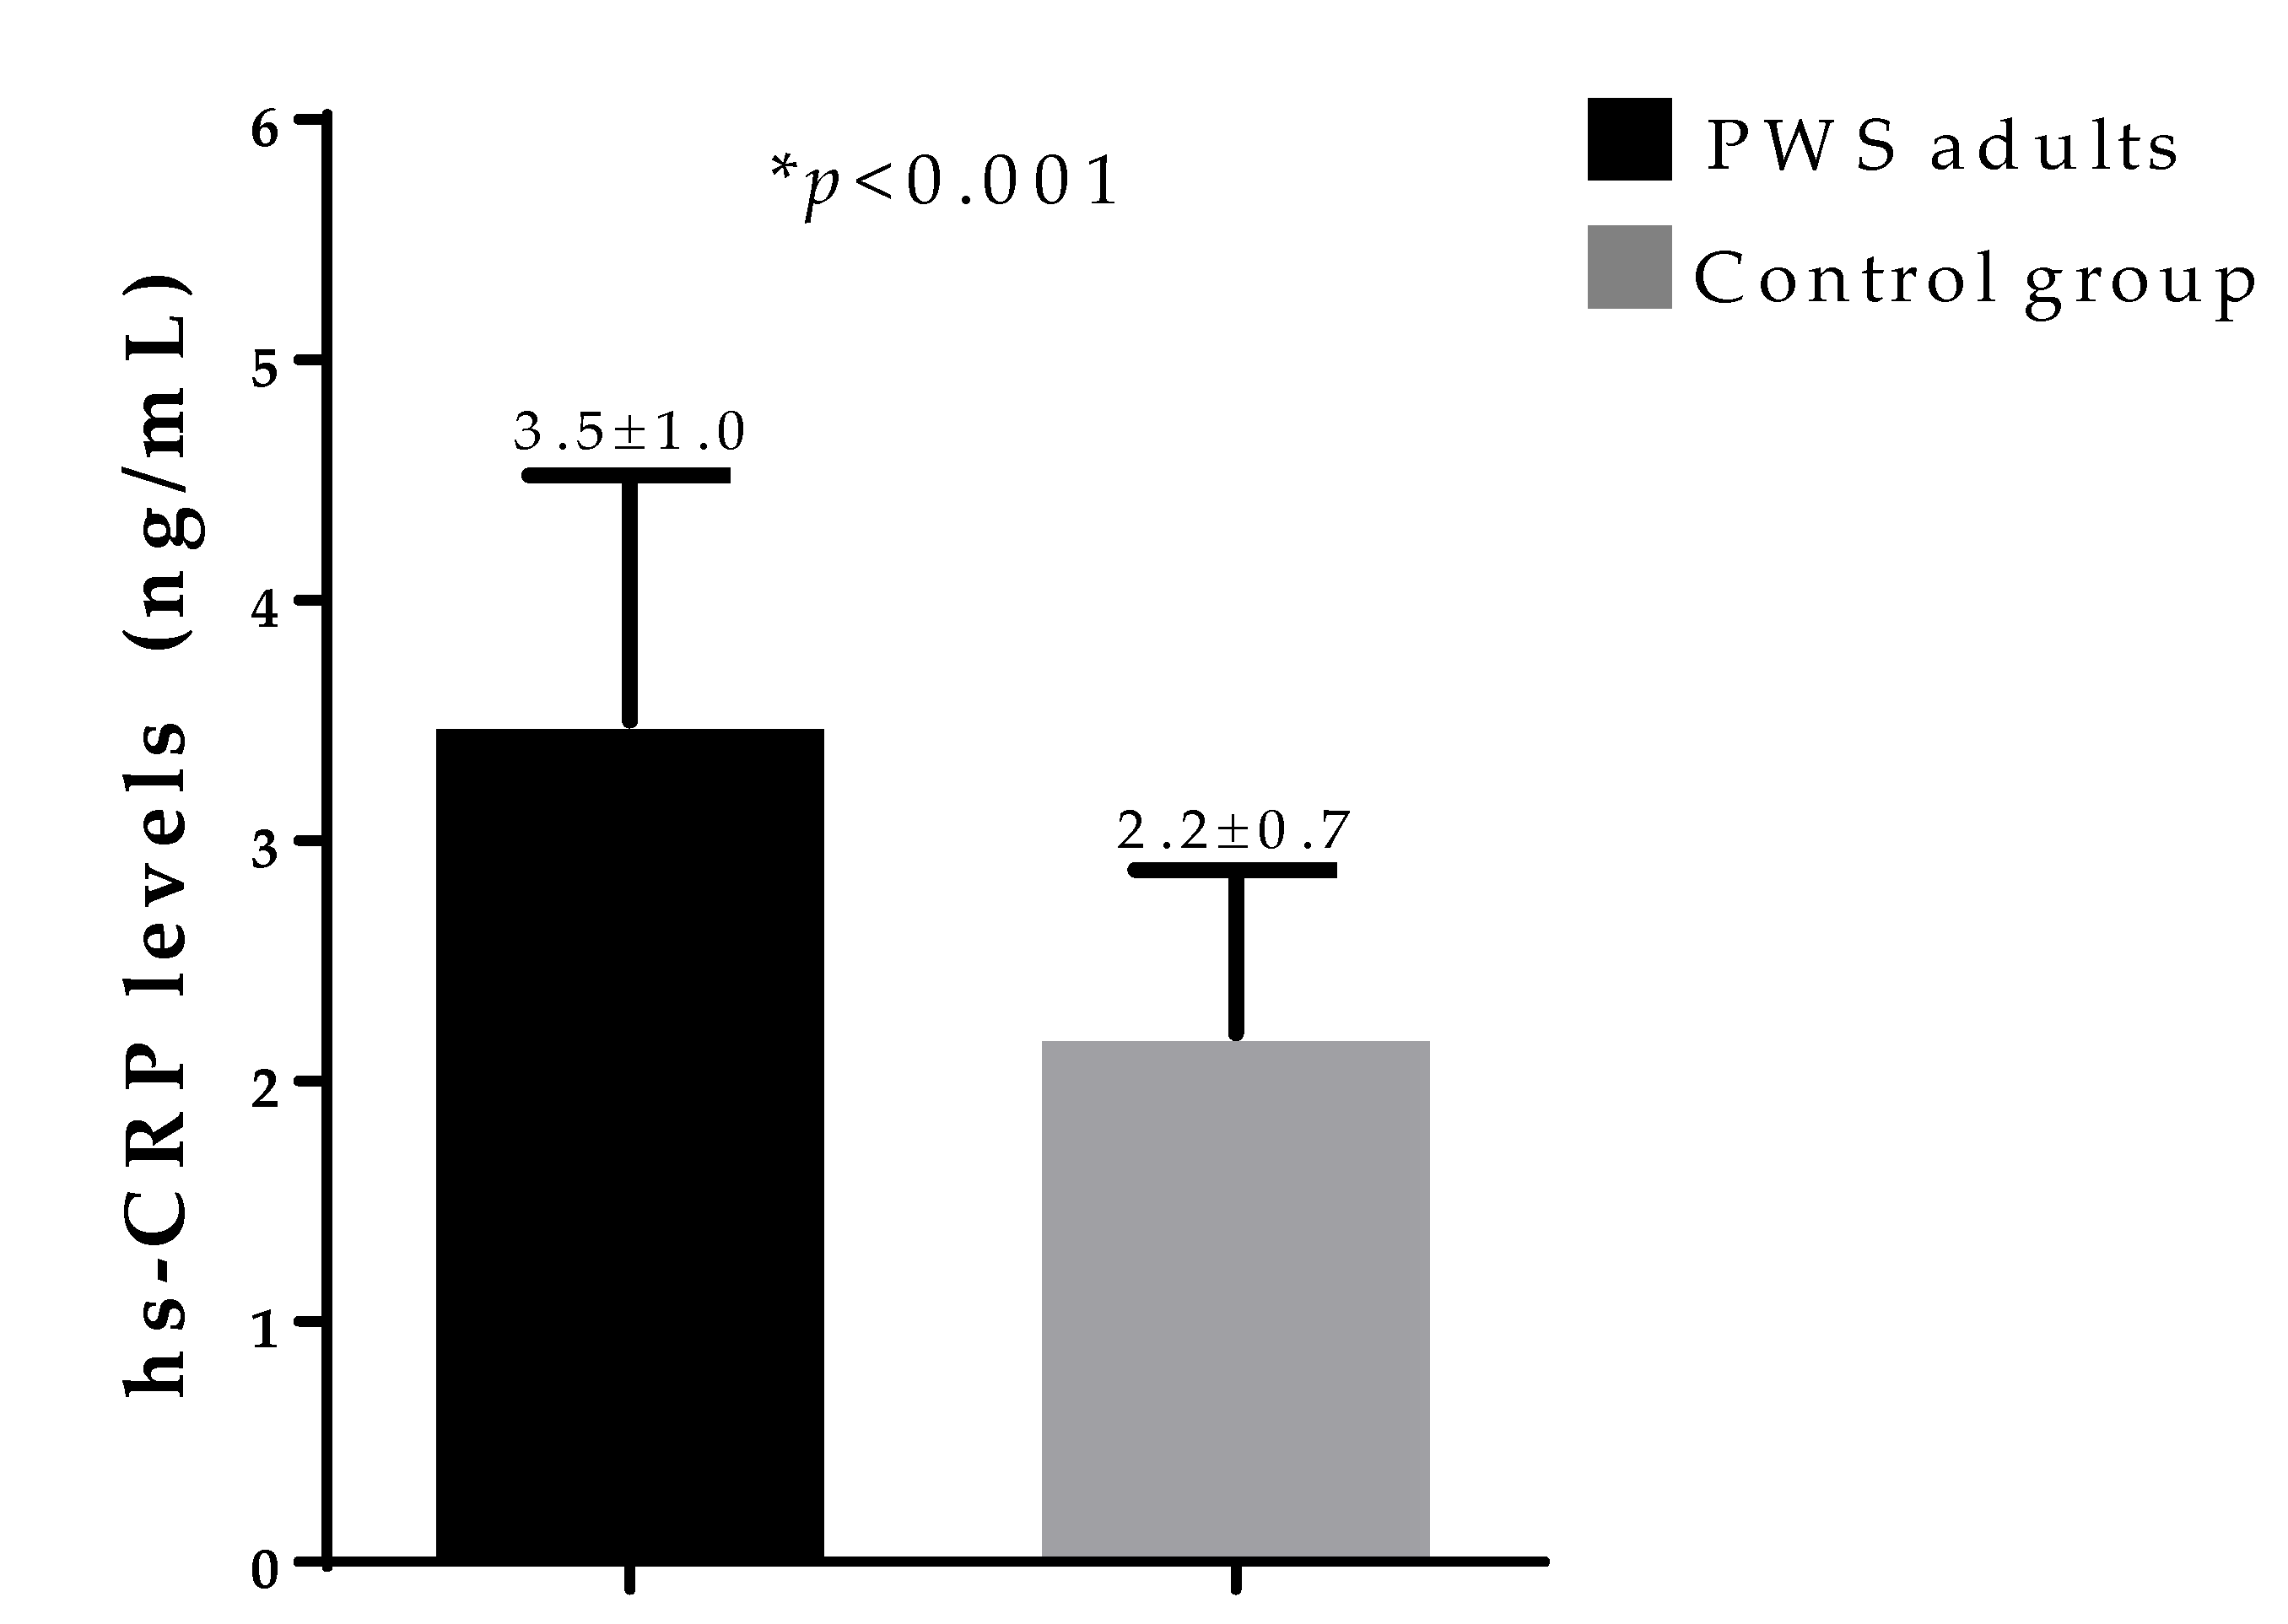
| hs-CRP levels | 0.99 | 0.08 | −2.5 | 0.02 |
| Excluded variables: BMI, waist circumference, and ECW. | ||||
© 2020 by the authors. Licensee MDPI, Basel, Switzerland. This article is an open access article distributed under the terms and conditions of the Creative Commons Attribution (CC BY) license (http://creativecommons.org/licenses/by/4.0/).
Share and Cite
Barrea, L.; Pugliese, G.; de Alteriis, G.; Colao, A.; Savastano, S.; Muscogiuri, G. Phase Angle: Could Be an Easy Tool to Detect Low-Grade Systemic Inflammation in Adults Affected by Prader–Willi Syndrome? Nutrients 2020, 12, 2065. https://0-doi-org.brum.beds.ac.uk/10.3390/nu12072065
Barrea L, Pugliese G, de Alteriis G, Colao A, Savastano S, Muscogiuri G. Phase Angle: Could Be an Easy Tool to Detect Low-Grade Systemic Inflammation in Adults Affected by Prader–Willi Syndrome? Nutrients. 2020; 12(7):2065. https://0-doi-org.brum.beds.ac.uk/10.3390/nu12072065
Chicago/Turabian StyleBarrea, Luigi, Gabriella Pugliese, Giulia de Alteriis, Annamaria Colao, Silvia Savastano, and Giovanna Muscogiuri. 2020. "Phase Angle: Could Be an Easy Tool to Detect Low-Grade Systemic Inflammation in Adults Affected by Prader–Willi Syndrome?" Nutrients 12, no. 7: 2065. https://0-doi-org.brum.beds.ac.uk/10.3390/nu12072065