Mediterranean Diet, Physical Activity and Gut Microbiome Composition: A Cross-Sectional Study among Healthy Young Italian Adults

 ,
,  , , ,
, , , 
Abstract
:1. Background
2. Materials and Methods
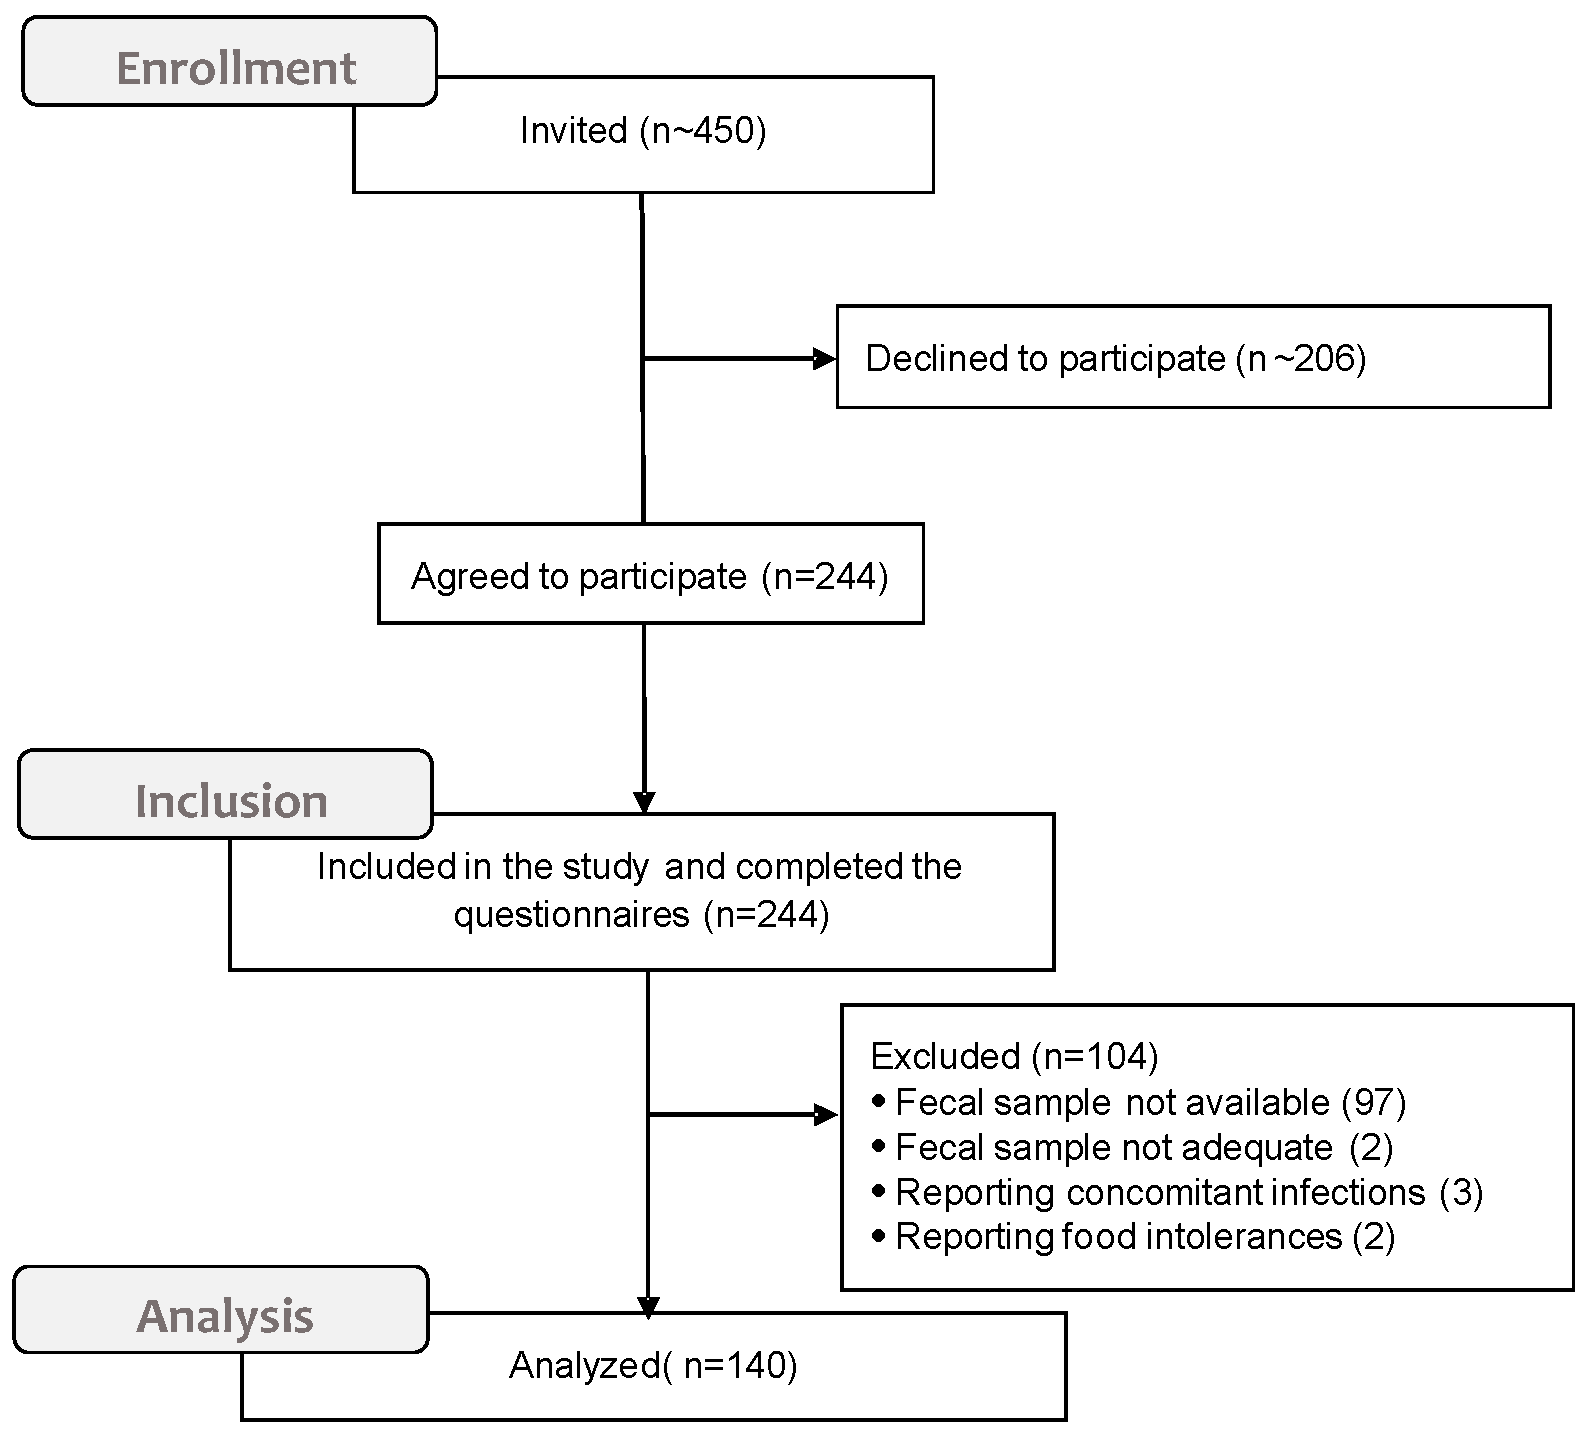
2.1. Setting and Participants
2.2. Questionnaires
2.3. Analysis of Fecal Samples
2.4. Statistical Analysis
3. Results
4. Discussion
5. Conclusions
Supplementary Materials
Author Contributions
Funding
Conflicts of Interest
References
- Grenham, S.; Clarke, G.; Cryan, J.F.; Dinan, T.G. Braingut-microbe communication in health and disease. Front. Physiol. 2011, 2, 1–15. [Google Scholar] [CrossRef] [PubMed] [Green Version]
- Belkaid, Y.; Hand, T.W. Role of the microbiota in immunity and inflammation. Cell 2014, 157, 121–141. [Google Scholar] [CrossRef] [PubMed] [Green Version]
- Mariat, D.; Firmesse, O.; Levenez, F.; Guimarăes, V.; Sokol, H.; Doré, J.; Corthier, G.; Furet, J.P. The Firmicutes/Bacteroidetes ratio of the human microbiota changes with age. BMC Microbiol. 2009, 9, 123. [Google Scholar] [CrossRef] [PubMed]
- Walker, A.W.; Ince, J.; Duncan, S.H.; Webster, L.M.; Holtrop, G.; Ze, X.; Brown, D.; Stares, M.D.; Scott, P.; Bergerat, A.; et al. Dominant and diet-responsive groups of bacteria within the human colonic microbiota. ISME J. 2011, 5, 220–230. [Google Scholar] [CrossRef]
- Mahnic, A.; Rupnik, M. Different host factors are associated with patterns in bacterial and fungal gut microbiota in Slovenian healthy cohort. PLoS ONE 2018, 13, e0209209. [Google Scholar] [CrossRef] [Green Version]
- Arumugam, M.; Raes, J.; Pelletier, E.; Le Paslier, D.; Yamada, T.; Mende, D.R.; Fernandes, G.R.; Tap, J.; Bruls, T.; Batto, J.; et al. Enterotypes of the human gut microbiome. Nature 2011, 473, 174–180. [Google Scholar] [CrossRef]
- Koliada, A.; Syzenko, G.; Moseiko, V.; Budovska, L.; Puchkov, K.; Perederiy, V.; Gavalko, Y.; Dorofeyev, A.; Romanenko, M.; Tkach, S.; et al. Association between body mass index and Firmicutes/Bacteroidetes ratio in an adult Ukrainian population. BMC Microbiol. 2017, 17, 120. [Google Scholar] [CrossRef] [Green Version]
- Zhernakova, A.; Kurilshikov, A.; Bonder, M.J.; Tigchelaar, E.F.; Schirmer, M.; Vatanen, T.; Mujagic, Z.; Vila, A.V.; Falony, G.; Vieira-Silva, S.; et al. Population-based metagenomics analysis reveals markers for gut microbiome composition and diversity. Science 2016, 352, 565–569. [Google Scholar] [CrossRef] [Green Version]
- Odamaki, T.; Kato, K.; Sugahara, H.; Hashikura, N.; Takahashi, S.; Xiao, J.; Abe, F.; Osawa, R. Age-related changes in gut microbiota composition from newborn to centenarian: A cross-sectional study. BMC Microbiol. 2016, 16, 90. [Google Scholar] [CrossRef] [Green Version]
- Sweeney, T.E.; Morton, J.M. The human gut microbiome: A review of the effect of obesity and surgically induced weight loss. JAMA Surg 2013, 148, 563–569. [Google Scholar] [CrossRef] [Green Version]
- Mathur, R.; Barlow, G.M. Obesity and the microbiome. Expert Rev. Gastroenterol. Hepatol. 2015, 9, 1087–1099. [Google Scholar] [CrossRef] [PubMed]
- Gentile, C.L.; Weir, T.L. The gut microbiota at the intersection of diet and human health. Science 2018, 362, 776–780. [Google Scholar] [CrossRef] [PubMed] [Green Version]
- Mitsou, E.K.; Kakali, A.; Antonopoulou, S.; Mountzouris, K.C.; Yannakoulia, M.; Panagiotakos, D.B.; Kyriacou, A. Adherence to the Mediterranean diet is associated with the gut microbiota pattern and gastrointestinal characteristics in an adult population. Br. J. Nutr. 2017, 117, 1645–1655. [Google Scholar] [CrossRef] [PubMed] [Green Version]
- Rinninella, E.; Cintoni, M.; Raoul, P.; Lopetuso, L.R.; Scaldaferri, F.; Pulcini, G.; Miggiano, G.A.D.; Gasbarrini, A.; Mele, M.C. Food Components and Dietary Habits: Keys for a Healthy Gut Microbiota Composition. Nutrients 2019, 11, 2393. [Google Scholar] [CrossRef] [Green Version]
- Di Liddo, R.; Piccione, M.; Schrenk, S.; Dal Magro, C.; Cosma, C.; Padoan, A.; Contran, N.; Scapellato, M.L.; Pagetta, A.; Spica, V.R.; et al. S100B as a new fecal biomarker of inflammatory bowel diseases. Eur. Rev. Med. Pharm. Sci 2020, 24, 323–332. [Google Scholar]
- Mayer, E.A.; Tillisch, K.; Gupta, A. Gut/brain axis and the microbiota. J. Clin. Investig. 2015, 125, 926–938. [Google Scholar] [CrossRef] [PubMed]
- Allen, J.M.; Mailing, L.J.; Niemiro, G.M.; Moore, R.; Cook, M.D.; White, B.A.; Holscher, H.D.; Woods, J.A. Exercise alters gut microbiota composition and function in lean and obese humans. Med. Sci. Sports Exerc. 2018, 50, 747–757. [Google Scholar] [CrossRef]
- Gallè, F.; Valeriani, F.; Cattaruzza, M.S.; Ubaldi, F.; Romano Spica, V.; Liguori, G.; WDPP, Working Group on Doping Prevention Project; GSMS-SItI. Exploring the association between physical activity and gut microbiota composition: A review of current evidence. Ann. Ig. 2019, 31, 582–589. [Google Scholar]
- Valeriani, F.; Gallè, F.; Cattaruzza, M.S.; Antinozzi, M.; Gianfranceschi, G.; Postiglione, N.; Romano Spica, V.; Liguori, G. Are nutrition and physical activity associated with gut microbiota? A pilot study on a sample of healthy young adults. Ann. Ig. 2020, 32. [epub ahead of print]. [Google Scholar]
- Martínez-González, M.A.; Fernández-Jarne, E.; Serrano-Martínez, M.; Wright, M.; Gomez-Gracia, E. Development of a short dietary intake questionnaire for the quantitative estimation of adherence to a cardioprotective Mediterranean diet. Eur. J. Clin. Nutr. 2004, 58, 1550–1552. [Google Scholar] [CrossRef] [Green Version]
- Craig, C.L.; Marshall, A.L.; Sjöström, M.; Bauman, A.E.; Booth, M.L.; Ainsworth, B.E.; Pratt, M.; Ekelund, U.; Yngve, A.; Sallis, J.F.; et al. International physical activity questionnaire: 12-country reliability and validity. Med. Sci. Sports Exerc. 2003, 35, 1381–1395. [Google Scholar] [CrossRef] [PubMed] [Green Version]
- Martin-Moreno, J.M.; Boyle, P.; Gorgojo, L.; Maisonneuve, P.; Fernandez-Rodriguez, J.C.; Salvini, S.; Willett, W.C. Development and validation of a food frequency questionnaire in Spain. Int. J. Epidemiol. 1993, 22, 512–519. [Google Scholar] [CrossRef] [PubMed]
- Valeriani, F.; Agodi, A.; Casini, B.; Cristina, M.L.; D’Errico, M.M.; Gianfranceschi, G.; Liguori, G.; Liguori, R.; Mucci, N.; Mura, I.; et al. Potential testing of reprocessing procedures by real-time polymerase chain reaction: A multicenter study of colonoscopy devices. Am. J. Infect. Control. 2018, 46, 159–164. [Google Scholar] [CrossRef] [Green Version]
- Valeriani, F.; Crognale, S.; Protano, C.; Gianfranceschi, G.; Orsini, M.; Vitali, M.; Romano Spica, V. Metagenomic analysis of bacterial community in a travertine depositing hot spring. New Microbiol. 2018, 41, 126–135. [Google Scholar] [PubMed]
- Valeriani, F.; Protano, C.; Gianfranceschi, G.; Leoni, E.; Galasso, V.; Mucci, N.; Vitali, M.; Romano Spica, V. Microflora Thermarum Atlas project: Biodiversity in thermal spring waters and natural SPA pools. Water Sci. Technol. Water Supply 2018, 18, 1472–1483. [Google Scholar] [CrossRef]
- Kong, Y. Btrim: A fast, lightweight adapter and quality trimming program for next-generation sequencing technologies. Genomics 2011, 98, 152–153. [Google Scholar] [CrossRef] [PubMed] [Green Version]
- Wang, S.; Hou, W.; Dong, H.; Jiang, H.; Huang, L.; Wu, G.; Zhang, C.; Song, Z.; Zhang, Y.; Ren, H.; et al. Control of Temperature on Microbial Community Structure in Hot Springs of the Tibetan Plateau. PLoS ONE 2013, 8, 62901. [Google Scholar] [CrossRef] [PubMed] [Green Version]
- World Health Organization. Body Mass Index—BMI. Available online: http://www.euro.who.int/en/health-topics/disease-prevention/nutrition/a-healthy-lifestyle/body-mass-index-bmi (accessed on 3 June 2020).
- IPAQ Group. Guidelines for Data Processing and Analysis of the International Physical Activity Questionnaire (IPAQ)—Short and Long Forms. Available online: www.ipaq.ki.se (accessed on 3 June 2020).
- Colwell, R.K.; Chao, A.; Gotelli, N.J.; Lin, S.Y.; Mao, C.X.; Chazdon, R.L.; Longino, J.T. Models and estimators linking individual-based and sample-based rarefaction, extrapolation, and comparison of assemblages. J. Plant. Ecol. 2012, 5, 3–21. [Google Scholar] [CrossRef] [Green Version]
- Magurran, A.E. Measuring Biological Diversity; Wiley-Blackwell: Oxford, UK, 2016. [Google Scholar]
- Arndt, D.; Xia, J.; Liu, Y.; Zhou, Y.; Guo, A.C.; Cruz, J.A.; Sinelnikov, I.; Budwill, K.; Nesbø, C.L.; Wishart, D.S. METAGENassist: A comprehensive web server for comparative metagenomics. Nucleic Acids Res. 2012, 40, 88–95. [Google Scholar] [CrossRef] [Green Version]
- Clark, K.R. Gorley RN PRIMER v6: User Manual/Tutorial; Primer-e: Plymouth, UK, 2006. [Google Scholar]
- Peters, B.A.; Shapiro, J.A.; Church, T.R.; Miller, G.; Trinh-Shevrin, C.; Yuen, E.; Friedlander, C.; Hayes, R.B.; Ahn, J. A taxonomic signature of obesity in a large study of American adults. Sci. Rep. 2018, 8, 9749. [Google Scholar] [CrossRef] [PubMed] [Green Version]
- De Filippis, F.; Pellegrini, N.; Vannini, L.; Jeffery, I.B.; La Storia, A.; Laghi, L.; Serrazanetti, D.I.; Di Cagno, R.; Ferrocino, I.; Lazzi, C.; et al. High-level adherence to a Mediterranean diet beneficially impacts the gut microbiota and associated metabolome. Gut 2016, 65, 1812–1821. [Google Scholar] [CrossRef] [PubMed]
- Garcia-Mantrana, I.; Selma-Royo, M.; Alcantara, C.; Collado, M.C. Shifts on Gut Microbiota Associated to Mediterranean Diet Adherence and Specific Dietary Intakes on General Adult Population. Front. Microbiol. 2018, 9, 890. [Google Scholar]
- Naderpoor, N.; Mousa, A.; Gomez-Arango, L.F.; Barrett, H.L.; Dekker Nitert, M.; de Courten, B. Faecal Microbiota Are Related to Insulin Sensitivity and Secretion in Overweight or Obese Adults. J. Clin. Med. 2019, 8, 452. [Google Scholar] [CrossRef] [Green Version]
- Luisi, M.; Lucarini, L.; Biffi, B.; Rafanelli, E.; Pietramellara, G.; Durante, M.; Vidali, S.; Provensi, G.; Madiai, S.; Gheri, C.F.; et al. Effect of Mediterranean Diet Enriched in High Quality Extra Virgin Olive Oil on Oxidative Stress, Inflammation and Gut Microbiota in Obese and Normal Weight Adult Subjects. Front. Pharm. 2019, 10, 1366. [Google Scholar] [CrossRef] [PubMed] [Green Version]
- Tannock, G.W.; Liu, Y. Guided dietary fibre intake as a means of directing short-chain fatty acid production by the gut microbiota. J. R. Soc. N. Z. 2020, 50, 434–455. [Google Scholar] [CrossRef]
- Liang, R.; Zhang, S.; Peng, X.; Yang, W.; Xu, Y.; Wu, P.; Chen, J.; Cai, Y.; Zhou, J. Characteristics of the gut microbiota in professional martial arts athletes: A comparison between different competition levels. PLoS ONE 2019, 14, e0226240. [Google Scholar] [CrossRef]
- Bressa, C.; Bailén-Andrino, M.; Pérez-Santiago, J.; González-Soltero, R.; Pérez, M.; Montalvo-Lominchar, M.G.; Maté-Muñoz, J.L.; Domínguez, R.; Moreno, D.; Larrosa, M. Differences in gut microbiota profile between women with active lifestyle and sedentary women. PLoS ONE 2017, 12, e0171352. [Google Scholar] [CrossRef] [PubMed] [Green Version]
- Shikany, J.M.; Demmer, R.T.; Johnson, A.J.; Fino, N.F.; Meyer, K.; Ensrud, K.E.; Lane, N.E.; Orwoll, E.S.; Kado, D.M.; Zmuda, J.M.; et al. Association of dietary patterns with the gut microbiota in older, community-dwelling men. Am. J. Clin. Nutr. 2019, 110, 1003–1014. [Google Scholar] [CrossRef] [PubMed]
- Martinez-Medina, M.; Denizot, J.; Dreux, N.; Robin, F.; Billard, E.; Bonnet, R.; Darfeuille-Michaud, A.; Barnich, N. Western diet induces dysbiosis with increased E coli in CEABAC10 mice, alters host barrier function favouring AIEC colonisation. Gut 2014, 63, 116–124. [Google Scholar] [CrossRef] [PubMed]


| Participants | |
|---|---|
| n = 140 | |
| Age | |
| mean value ± SD (range) | 22.5 ± 2.9 (18–36) |
| Gender | |
| n (%) | |
| males | 68 (48.6) |
| females | 72 (51.4) |
| BMI kg/m2 | |
| mean value ± SD (range) | 22.4 ± 2.8 (15.2–33.8) |
| BMI category | |
| n (%) | |
| under weight | 7 (5.0) |
| normal weight | 106 (75.7) |
| over weight | 24 (17.1) |
| obese | 3 (2.2) |
| MD adherence score | |
| mean value ± SD (median; range) | 5.3 ± 1.6 (5; 2–9) |
| MD adherence level | |
| n (%) | |
| ≤median | 73 (52.1) |
| >median | 67 (47.9) |
| Habitual PA | |
| MET-minutes/week | |
| mean value ± SD (range) | 3006.2 ± 2973.6 (148–21,090) |
| PA level | |
| n (%) | |
| low | 17 (12.1) |
| moderate | 57 (40.7) |
| high | 66 (47.1) |
| BMI | pa | ||||
| Underweight/ Normal Weight | Overweight/ Obese | ||||
| Shannon Index | 2.5 ± 0.2 | 2.5 ± 0.2 | 0.77 | ||
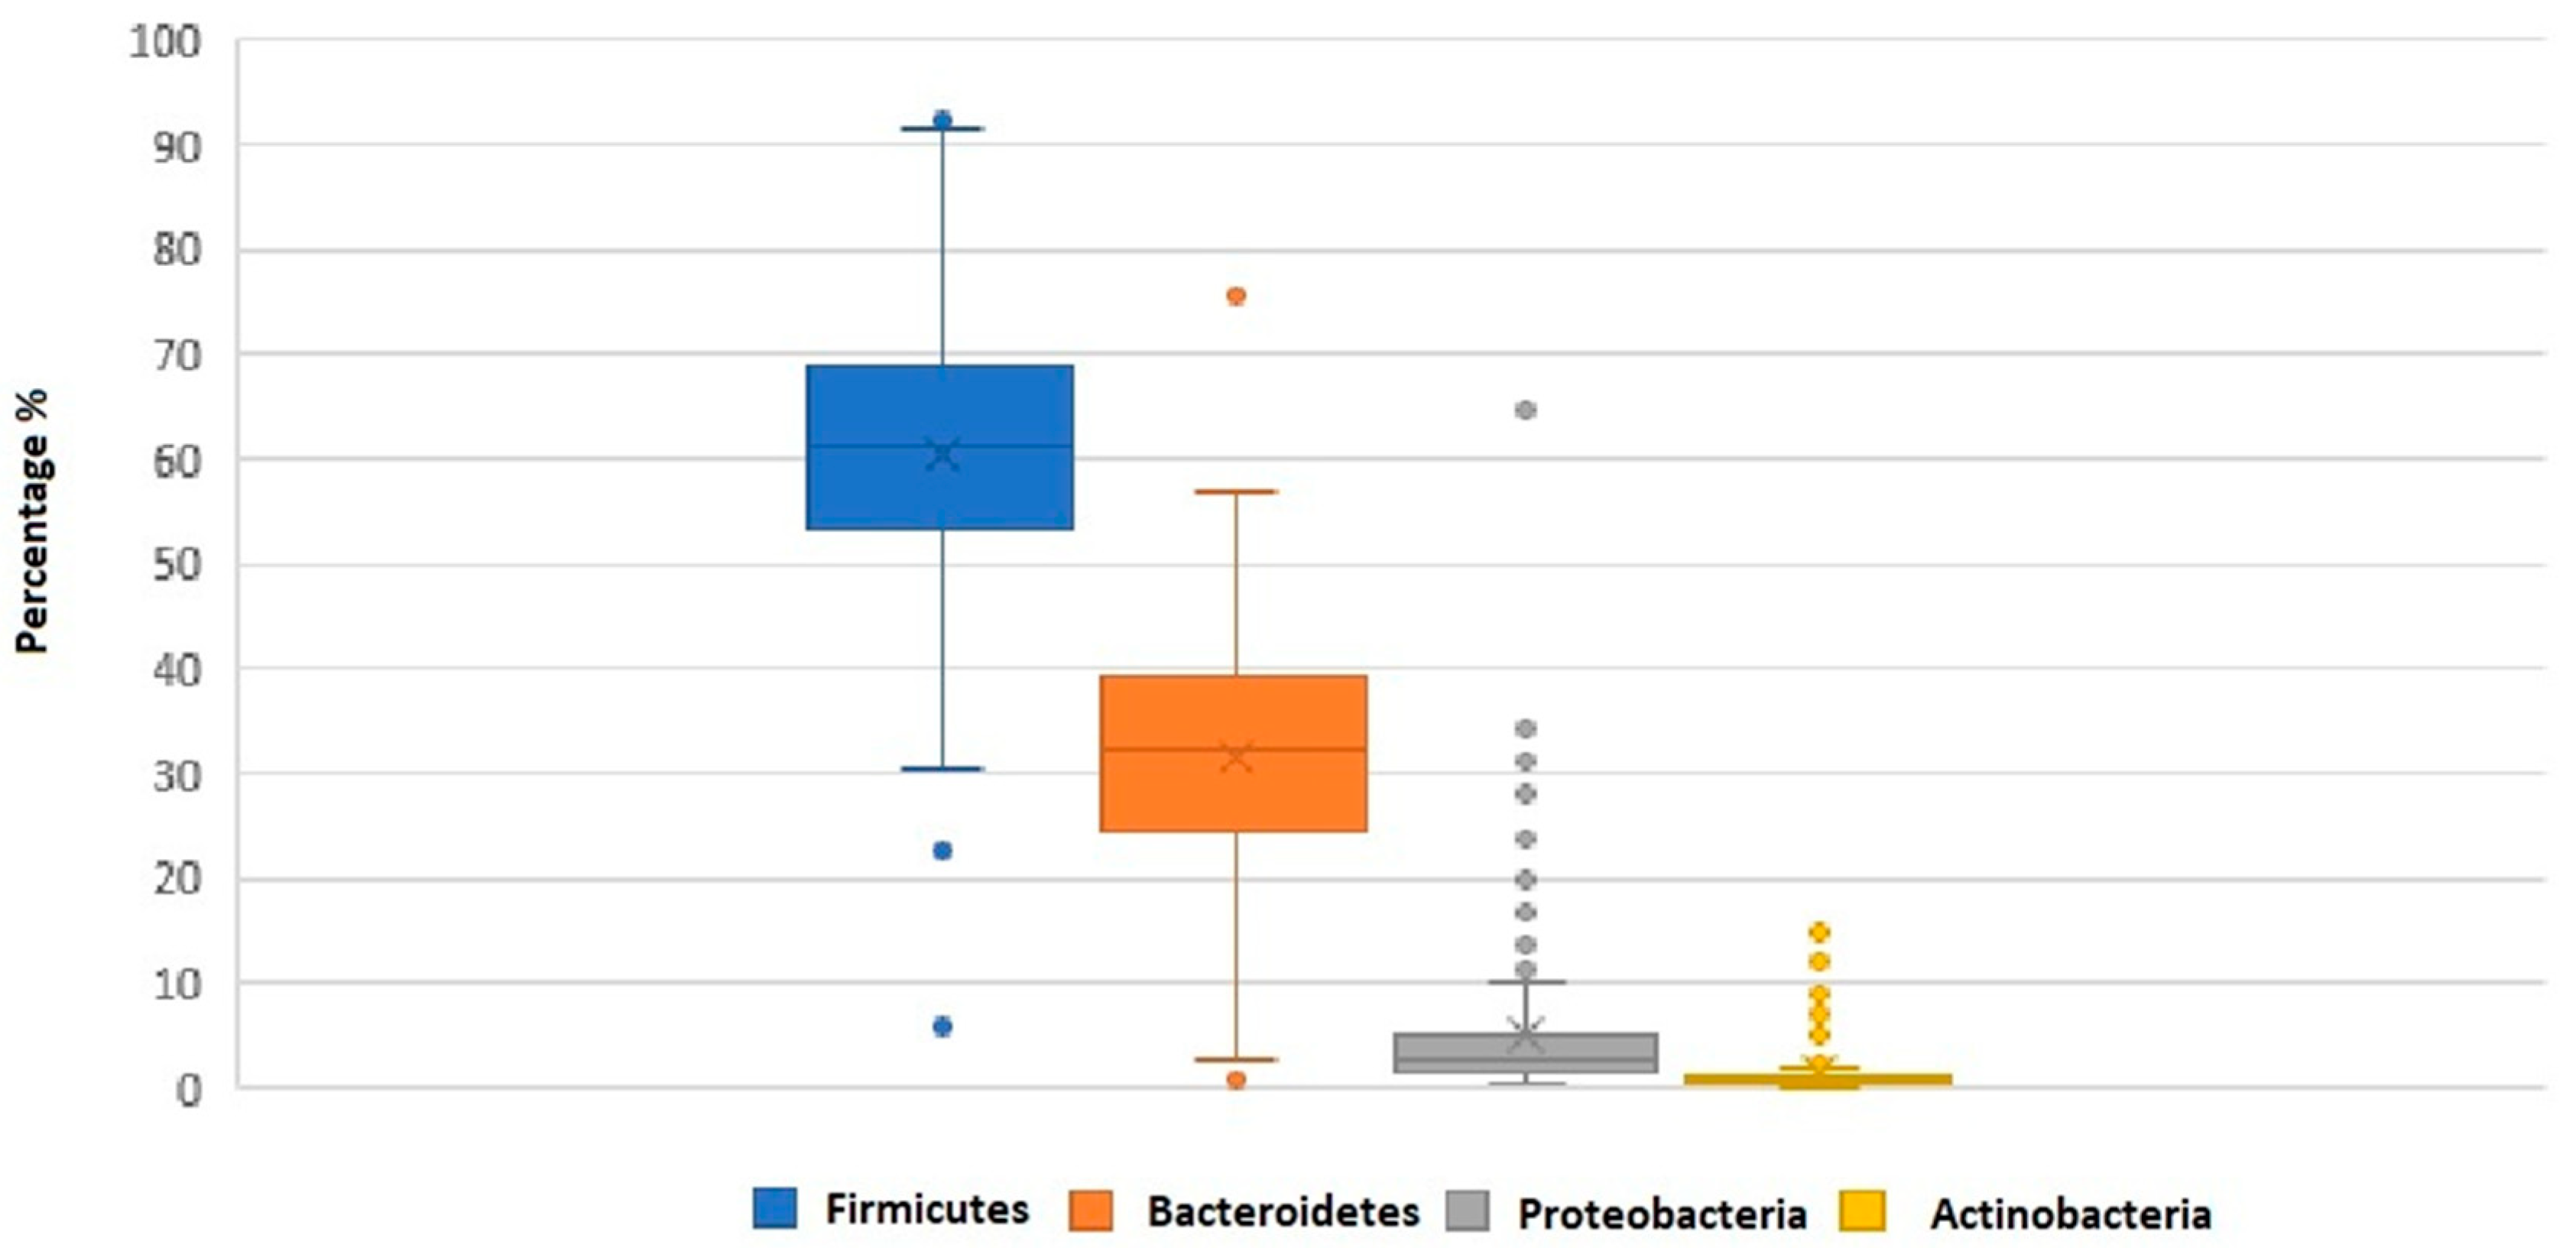
| Firmicutes | 58.9 ± 13.1 | 61.1 ± 8.7 | 0.47 | ||
| Bacteroidetes | 33.4 ± 10.4 | 31.8 ± 8.9 | 0.54 | ||
| F/B ratio | 2.1 ± 1.1 | 2.2 ± 1.3 | 0.56 | ||
| MD score | pa | ||||
| Variable | 0–5 | 6–9 | |||
| Shannon Index | 2.6 ± 0.2 | 2.6 ± 0.2 | 0.96 | ||
| Firmicutes | 58.9 ± 13.0 | 59.8 ± 11.9 | 0.68 | ||
| Bacteroidetes | 33.6 ± 11.1 | 32.6 ± 9.1 | 0.58 | ||
| F/B ratio | 2.1 ± 1.2 | 2.1 ± 1.0 | 0.94 | ||
| PA level | pb | ||||
| Low | moderate | High | |||
| Shannon Index | 2.6 ± 0.1 | 2.6 ± 0.2 | 2.5 ± 0.2 | 0.46 | |
| Firmicutes | 58.3 ± 16.0 | 58.1 ± 12.0 | 60.6 ± 11.8 | 0.55 | |
| Bacteroidetes | 32.7 ± 14.8 | 34.6 ± 9.4 | 31.9 ± 9.4 | 0.38 | |
| F/B ratio | 2.3 ± 1.5 | 1.9 ± 0.9 | 2.2 ± 1.1 | 0.27 | |
| Habitual PA Level | MD Adherence Score | p | ||
|---|---|---|---|---|
| 0–5 n = 73 | 6–9 n = 67 | |||
| Shannon Index | low active | 2.6 ± 0.1 | 2.5 ± 0.2 | |
| moderately active | 2.6 ± 0.2 | 2.6 ± 0.2 | 0.47 | |
| highly active | 2.5 ± 0.2 | 2.6 ± 0.2 | ||
| Firmicutes | low active | 57.1 ± 17.1 | 63.8 ± 9.1 | |
| moderately active | 59.0 ± 11.5 | 56.6 ± 12.9 | 0.51 | |
| highly active | 59.7 ± 12.6 | 61.1 ± 11.5 | ||
| Bacteroidetes | low active | 32.8 ± 16.1 | 31.8 ± 8.4 | |
| moderately active | 33.9 ± 9.1 | 35.6 ± 9.9 | 0.61 | |
| highly active | 33.4 ± 10.6 | 31.1 ± 8.6 | ||
| F/B ratio | low active | 2.3 ± 1.6 | 2.1 ± 0.7 | |
| moderately active | 1.9 ± 1.0 | 1.8 ± 0.9 | 0.81 | |
| highly active | 2.1 ± 1.3 | 2.1 ± 1.0 | ||
| Genus | BMI | pa | ||
| Underweight/ Normal Weight | Overweight/ Obese | |||
| Selenomonas | 0.23 ± 0.38 | 0.38 ± 1.30 | 0.02 | |
| Megasphaera | 0.12 ± 0.29 | 0.32 ± 0.87 | 0.001 | |
| Streptococcus | 1.66 ± 2.08 | 4.02 ± 6.69 | 0.001 | |
| Dorea | 1.16 ± 2.29 | 2.44 ± 4.25 | 0.001 | |
| Lachnobacterium | 0.27 ± 0.74 | 0.68 ± 2.43 | 0.007 | |
| Jannaschia | 0.19 ± 0.31 | 0.27 ± 0.50 | 0.02 | |
| Dialister | 0.35 ± 0.76 | 1.07 ± 2.34 | 0.001 | |
| Eubacterium | 0.71 ± 2.19 | 1.61 ± 3.42 | 0.01 | |
| Paraprevotella | 0.19 ± 0.30 | 0.08 ± 0.13 | 0.01 | |
| MD score | pa | |||
| Genus | 0–5 | 6–9 | ||
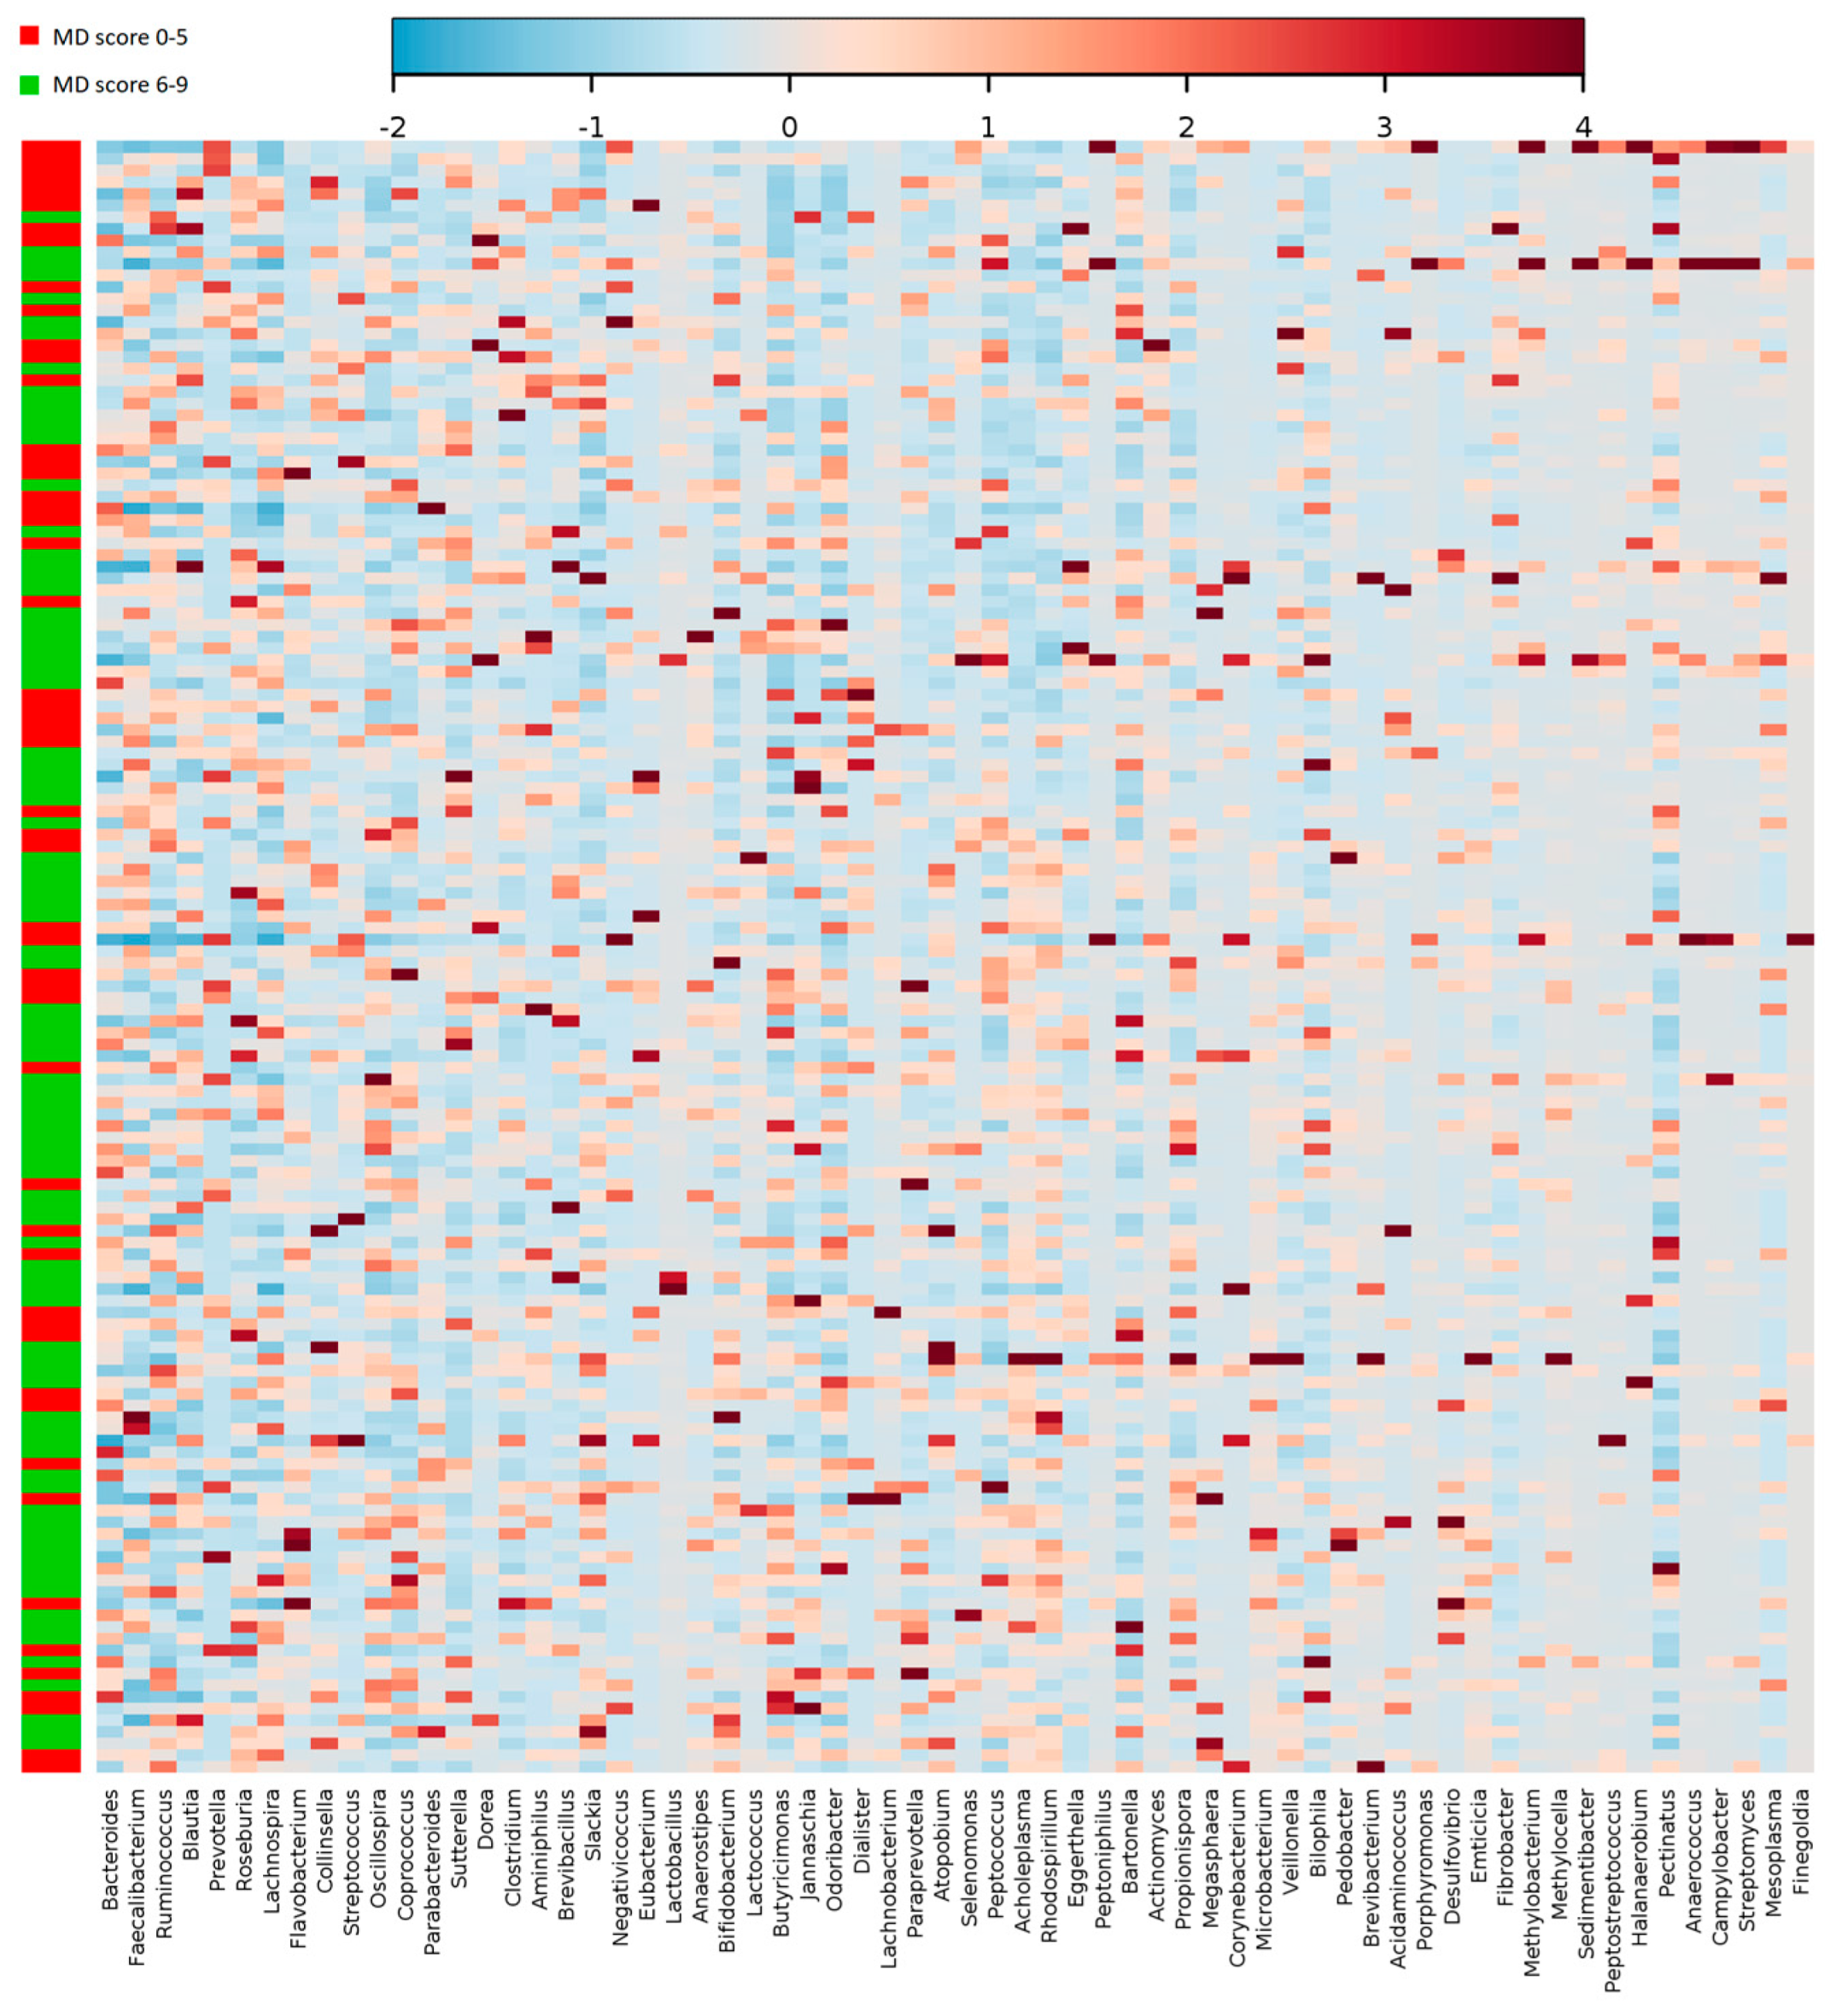
| Lachnospira | 0.37 ± 1.20 | 0.75 ± 2.28 | 0.02 | |
| Oscillospira | 2.18 ± 1.90 | 1.73 ± 1.25 | 0.03 | |
| Lactobacillus | 0.29 ± 0.52 | 1.26 ± 4.52 | 0.002 | |
| Ruminococcus | 9.51 ± 6.69 | 7.63 ± 4.90 | 0.002 | |
| Lactococcus | 0.22 ± 0.53 | 0.52 ± 1.30 | 0.01 | |
| Veillonella | 0.09 ± 0.05 | 0.14 ± 0.17 | 0.001 | |
| Paraprevotella | 0.23 ± 0.38 | 0.13 ± 0.22 | 0.008 | |
| PA level | pb | |||
| Genus | low | moderate | high | |
| Megasphaera | 0.55 ± 1.08 1 | 0.12 ± 0.24 | 0.11 ± 0.37 | 0.002 |
| Lachnobacterium | 1.30 ± 3.20 1 | 0.25 ± 0.41 | 0.17 ± 0.25 | 0.001 |
| Dialister | 1.53 ± 2.69 1 | 0.40 ± 0.80 | 0.24 ± 0.58 | 0.001 |
| Paraprevotella | 0.32 ± 0.49 2 | 0.21 ± 0.29 | 0.12 ± 0.25 | 0.037 |
© 2020 by the authors. Licensee MDPI, Basel, Switzerland. This article is an open access article distributed under the terms and conditions of the Creative Commons Attribution (CC BY) license (http://creativecommons.org/licenses/by/4.0/).
Share and Cite
Gallè, F.; Valeriani, F.; Cattaruzza, M.S.; Gianfranceschi, G.; Liguori, R.; Antinozzi, M.; Mederer, B.; Liguori, G.; Romano Spica, V. Mediterranean Diet, Physical Activity and Gut Microbiome Composition: A Cross-Sectional Study among Healthy Young Italian Adults. Nutrients 2020, 12, 2164. https://0-doi-org.brum.beds.ac.uk/10.3390/nu12072164
Gallè F, Valeriani F, Cattaruzza MS, Gianfranceschi G, Liguori R, Antinozzi M, Mederer B, Liguori G, Romano Spica V. Mediterranean Diet, Physical Activity and Gut Microbiome Composition: A Cross-Sectional Study among Healthy Young Italian Adults. Nutrients. 2020; 12(7):2164. https://0-doi-org.brum.beds.ac.uk/10.3390/nu12072164
Chicago/Turabian StyleGallè, Francesca, Federica Valeriani, Maria Sofia Cattaruzza, Gianluca Gianfranceschi, Renato Liguori, Martina Antinozzi, Beatriz Mederer, Giorgio Liguori, and Vincenzo Romano Spica. 2020. "Mediterranean Diet, Physical Activity and Gut Microbiome Composition: A Cross-Sectional Study among Healthy Young Italian Adults" Nutrients 12, no. 7: 2164. https://0-doi-org.brum.beds.ac.uk/10.3390/nu12072164