The Simplified Nutritional Appetite Questionnaire (SNAQ) as a Screening Tool for Risk of Malnutrition: Optimal Cutoff, Factor Structure, and Validation in Healthy Community-Dwelling Older Adults

 , and
, and
Abstract
:1. Introduction
2. Materials and Methods
2.1. Study Population
2.2. Clinical Assessment
2.3. Nutritional Assessment
2.4. Statistical Analysis
2.5. Ethics Approval and Consent
3. Results
3.1. Baseline Characteristics
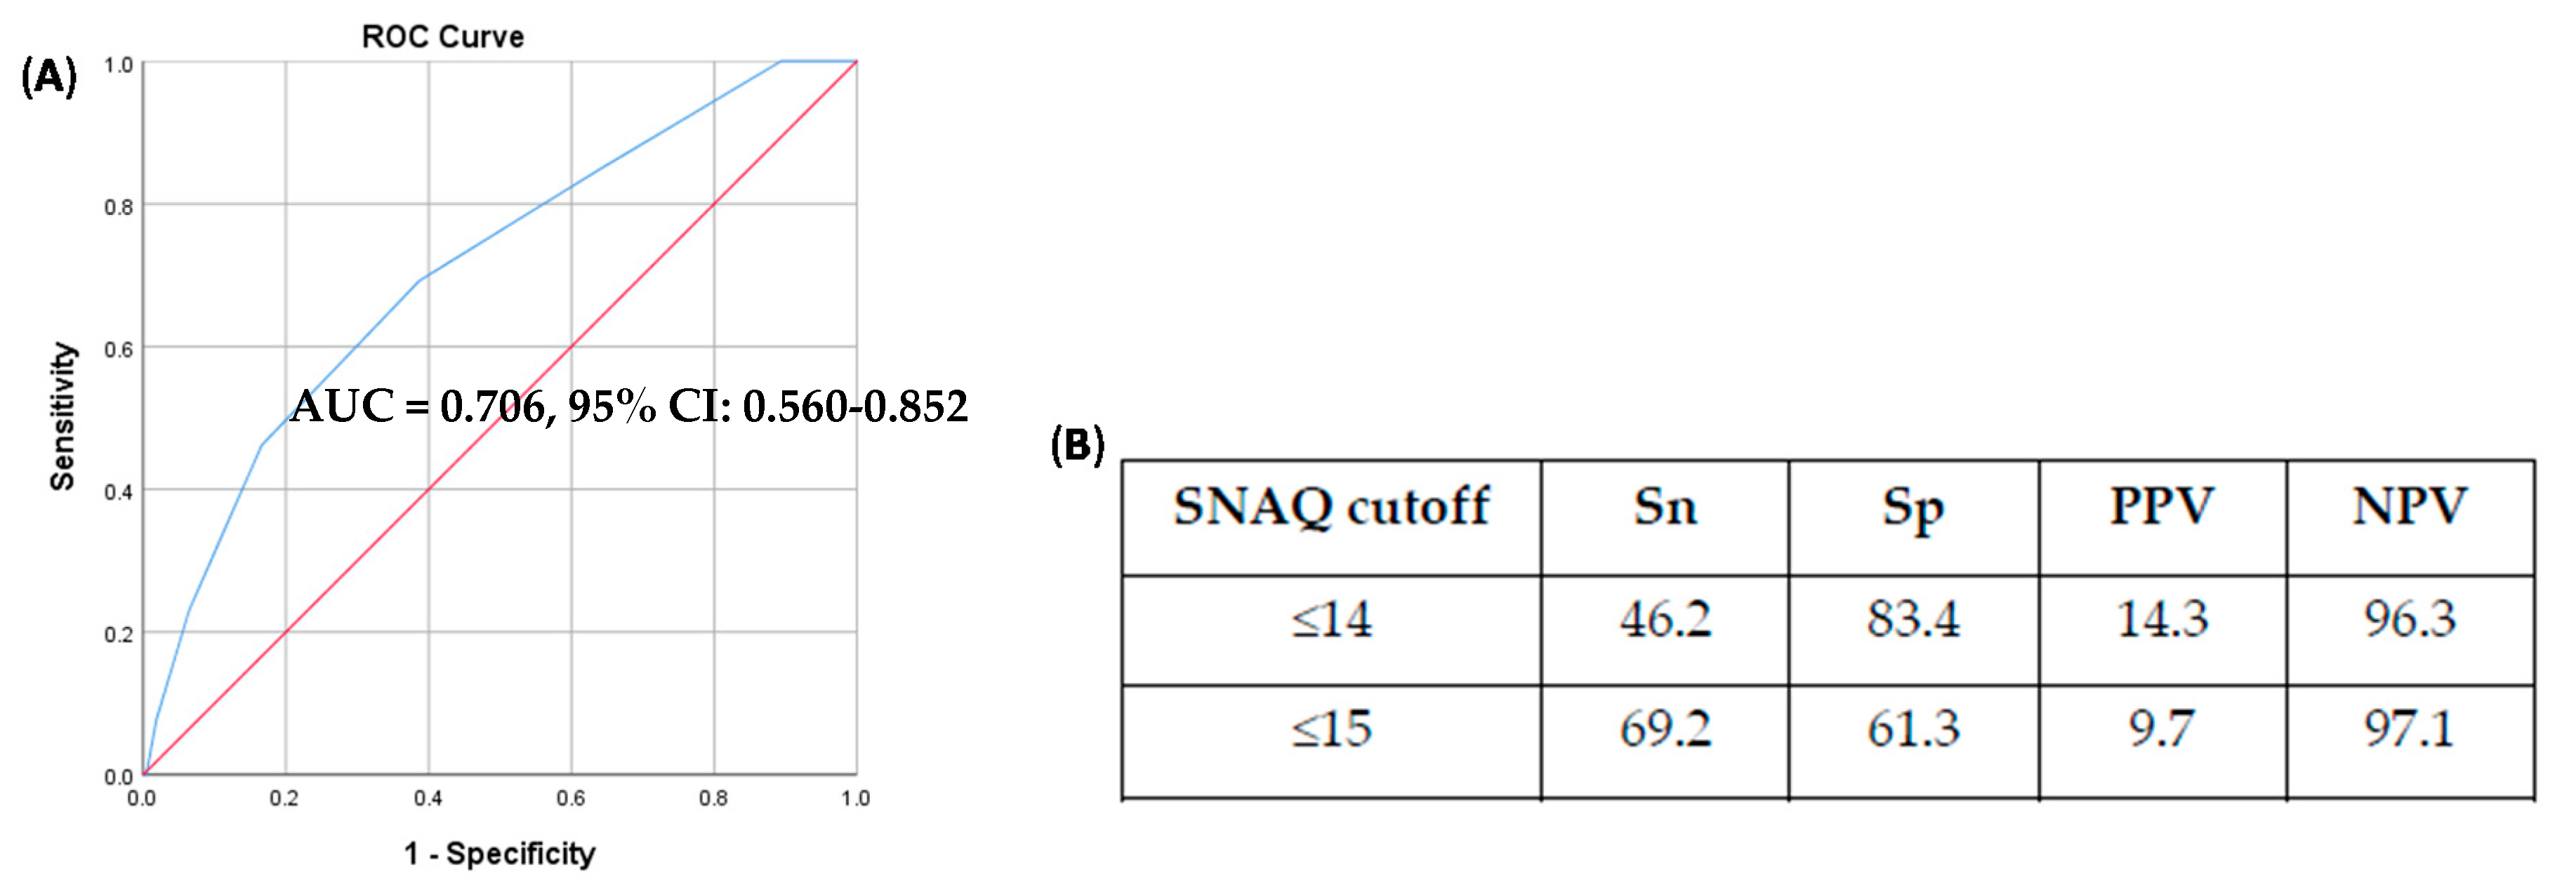
3.2. SNAQ Cutoff Score
3.3. Factor Structure and Reliability of SNAQ
3.4. Convergent and Discriminant Validity
3.5. Concurrent Validity
3.6. Predictive Validity and Outcome Associations
4. Discussion
5. Conclusions
Author Contributions
Funding
Acknowledgments
Conflicts of Interest
References
- Wallace, J.I.; Schwartz, R.S.; LaCroix, A.Z.; Uhlmann, R.F.; Pearlman, R.A. Involuntary Weight Loss in Older Outpatients: Incidence and Clinical Significance. J. Am. Geriatr. Soc. 1995, 43, 329–337. [Google Scholar] [CrossRef] [PubMed] [Green Version]
- Roberts, H.C.; Lim, S.E.R.; Cox, N.J.; Ibrahim, K. The Challenge of Managing Undernutrition in Older People with Frailty. Nutrients 2019, 11, 808. [Google Scholar] [CrossRef] [PubMed] [Green Version]
- Norazman, C.W.; Adznam, S.N.; Jamaluddin, R. Malnutrition as Key Predictor of Physical Frailty among Malaysian Older Adults. Nutrients 2020, 12, 1713. [Google Scholar] [CrossRef] [PubMed]
- Hickson, M. Malnutrition and Ageing. Postgrad. Med. J. 2006, 82, 2–8. [Google Scholar] [CrossRef] [PubMed]
- Gingrich, A.; Volkert, D.; Kiesswetter, E.; Thomanek, M.; Bach, S.; Sieber, C.C.; Zopf, Y. Prevalence and Overlap of Sarcopenia, Frailty, Cachexia and Malnutrition in Older Medical Inpatients. BMC Geriatr. 2019, 19, 120. [Google Scholar] [CrossRef] [PubMed] [Green Version]
- Guaitoli, P.R.; Jansma, E.P.; de Vet, H.C. Nutrition Screening Tools: Does One Size Fit All? A Systematic Review of Screening Tools for the Hospital Setting. Clin. Nutr. 2014, 33, 39–58. [Google Scholar]
- Power, L.; Mullally, D.; Gibney, E.R.; Clarke, M.; Visser, M.; Volkert, D.; Bardon, L.; de van der Schueren, M.A.E.; Corish, C.A. A Review of the Validity of Malnutrition Screening Tools Used in Older Adults in Community and Healthcare Settings—A MaNuEL Study. Clin. Nutr. ESPEN 2018, 24, 1–13. [Google Scholar] [CrossRef] [Green Version]
- Dent, E.; Hoogendijk, E.O.; Visvanathan, R.; Wright, O.R.L. Malnutrition Screening and Assessment in Hospitalised Older People: A Review. J. Nutr. Health Aging 2019, 23, 431–441. [Google Scholar] [CrossRef]
- Morley, J.E. Anorexia of Aging: A True Geriatric Syndrome. J. Nutr. Health Aging 2012, 16, 422–425. [Google Scholar] [CrossRef]
- Mathey, M.F. Assessing Appetite in Dutch Elderly with the Appetite, Hunger and Sensory Perception (AHSP) Questionnaire. J. Nutr. Health Aging 2001, 5, 22–28. [Google Scholar]
- Wilson, M.-M.G.; Thomas, D.R.; Rubenstein, L.Z.; Chibnall, J.T.; Anderson, S.; Baxi, A.; Diebold, M.R.; Morley, J.E. Appetite Assessment: Simple Appetite Questionnaire Predicts Weight Loss in Community-Dwelling Adults and Nursing Home Residents. Am. J. Clin. Nutr. 2005, 82, 1074–1081. [Google Scholar] [CrossRef] [PubMed]
- Hanisah, R.; Shahar, S.; Lee, F.S. Validation of Screening Tools to Assess Appetite among Geriatric Patients. J. Nutr. Health Aging 2012, 16, 660–665. [Google Scholar] [CrossRef] [PubMed]
- Rolland, Y.; Perrin, A.; Gardette, V.; Filhol, N.; Vellas, B. Screening Older People at Risk of Malnutrition or Malnourished Using the Simplified Nutritional Appetite Questionnaire (SNAQ): A Comparison With the Mini-Nutritional Assessment (MNA) Tool. J. Am. Med. Dir. Assoc. 2012, 13, 31–34. [Google Scholar] [CrossRef] [PubMed]
- Nakatsu, N.; Sawa, R.; Misu, S.; Ueda, Y.; Ono, R. Reliability and Validity of the Japanese Version of the Simplified Nutritional Appetite Questionnaire in Community-Dwelling Older Adults: Creating Japanese Appetite Questionnaire. Geriatr. Gerontol. Int. 2015, 15, 1264–1269. [Google Scholar] [CrossRef] [PubMed]
- İlhan, B.; Bahat, G.; Oren, M.M.; Kiliç, C.; Durmazoglu, S.; Karan, M.A. Reliability and Validity of Turkish Version of the Simplified Nutritional Appetite Questionnaire (SNAQ). J. Nutr. Health Aging 2018, 22, 1039–1044. [Google Scholar] [CrossRef] [PubMed]
- Akın, S.; Ozer, F.F.; Ertürk Zararsız, G.; Şafak, E.D.; Mucuk, S.; Göçer, Ş.; Mazıcıoğlu, M. Validity of Simplified Nutritional Appetite Questionnaire for Turkish Community-Dwelling Elderly and Determining Cut-off According to Mini Nutritional Assessment. Arch. Gerontol. Geriatr. 2019, 83, 31–36. [Google Scholar] [CrossRef]
- Sties, S.W.; Gonzáles, A.I.; Viana, M.d.S.; Brandt, R.; Bertin, R.L.; Goldfeder, R.; Ulbrich, A.Z.; Andrade, A.; Carvalho, T.d. Questionário Nutricional Simplificado de Apetite (QNSA) Para Uso Em Programas de Reabilitação Cardiopulmonar e Metabólica. Rev. Bras. Med. Esporte. 2012, 18, 313–317. [Google Scholar] [CrossRef] [Green Version]
- Andreae, C.; Strömberg, A.; Sawatzky, R.; Årestedt, K. Psychometric Evaluation of Two Appetite Questionnaires in Patients With Heart Failure. J. Card. Fail. 2015, 21, 954–958. [Google Scholar] [CrossRef]
- Yaxley, A.; Crotty, M.; Miller, M. Identifying Malnutrition in an Elderly Ambulatory Rehabilitation Population: Agreement between Mini Nutritional Assessment and Validated Screening Tools. Healthcare 2015, 3, 822–829. [Google Scholar] [CrossRef] [Green Version]
- Helfenstein, S.F.; Uster, A.; Rühlin, M.; Pless, M.; Ballmer, P.E.; Imoberdorf, R. Are Four Simple Questions Able to Predict Weight Loss in Outpatients With Metastatic Cancer? A Prospective Cohort Study Assessing the Simplified Nutritional Appetite Questionnaire. Nutr. Cancer 2016, 68, 743–749. [Google Scholar] [CrossRef] [Green Version]
- Tokudome, Y.; Okumura, K.; Kumagai, Y.; Hirano, H.; Kim, H.; Morishita, S.; Watanabe, Y. Development of the Japanese Version of the Council on Nutrition Appetite Questionnaire and Its Simplified Versions, and Evaluation of Their Reliability, Validity, and Reproducibility. J. Epidemiol. 2017, 27, 524–530. [Google Scholar] [CrossRef]
- Wang, T.; Shen, J. Usefulness of Simplified Nutritional Appetite Questionnaire (SNAQ) in Appetite Assessment in Elder Patients with Liver Cirrhosis. J. Nutr. Health Aging 2018, 22, 911–915. [Google Scholar] [CrossRef] [PubMed]
- Mohammadi, M.R.; Akhondzadeh, S.; Keshavarz, S.A.; Mostafavi, S.-A. The Characteristics, Reliability and Validity of the Persian Version of Simplified Nutritional Appetite Questionnaire (SNAQ). J. Nutr. Health Aging 2019, 23, 837–842. [Google Scholar] [CrossRef] [PubMed]
- Oh, S.Y.; Koh, S.-J.; Baek, J.Y.; Kwon, K.A.; Jeung, H.-C.; Lee, K.H.; Won, Y.-W.; Lee, H.J. Validity and Reliability of Korean Version of Simplified Nutritional Appetite Questionnaire in Patients with Advanced Cancer: A Multicenter, Longitudinal Study. Cancer Res. Treat. 2019, 51, 1612–1619. [Google Scholar] [CrossRef] [PubMed] [Green Version]
- Wleklik, M.; Lisiak, M.; Andreae, C.; Uchmanowicz, I. Psychometric Evaluation of Appetite Questionnaires in Elderly Polish Patients with Heart Failure. PPA 2019, 13, 1751–1759. [Google Scholar] [CrossRef] [Green Version]
- Morley, J.E.; Malmstrom, T.K.; Miller, D.K. A Simple Frailty Questionnaire (FRAIL) Predicts Outcomes in Middle Aged African Americans. J. Nutr. Health Aging 2012, 16, 601–608. [Google Scholar] [CrossRef] [Green Version]
- Sahadevan, S.; Lim, P.P.; Tan, N.J.; Chan, S.P. Diagnostic Performance of Two Mental Status Tests in the Older Chinese: Influence of Education and Age on Cut-off Values. Int. J. Geriatr. Psychiatry 2000, 15, 234–241. [Google Scholar] [CrossRef]
- Lim, P.P.; Ng, L.L.; Chiam, P.C.; Ong, P.S.; Ngui, F.T.; Sahadevan, S. Validation and Comparison of Three Brief Depression Scales in an Elderly Chinese Population. Int. J. Geriatr. Psychiatry 2000, 15, 824–830. [Google Scholar] [CrossRef]
- Mahoney, F.I.; Barthel, D.W. Functional Evaluation: The Barthel Index. Md. State Med. J. 1965, 14, 61–65. [Google Scholar]
- Lawton, M.P.; Brody, E.M. Assessment of Older People: Self-Maintaining and Instrumental Activities of Daily Living. Gerontologist 1969, 9, 179–186. [Google Scholar] [CrossRef]
- Schuling, J.; de Haan, R.; Limburg, M.; Groenier, K.H. The Frenchay Activities Index. Assessment of Functional Status in Stroke Patients. Stroke 1993, 24, 1173–1177. [Google Scholar] [CrossRef] [PubMed] [Green Version]
- Hurtig-Wennlöf, A.; Hagströmer, M.; Olsson, L.A. The International Physical Activity Questionnaire Modified for the Elderly: Aspects of Validity and Feasibility. Public Health Nutr. 2010, 13, 1847–1854. [Google Scholar] [CrossRef]
- Peel, C.; Sawyer Baker, P.; Roth, D.L.; Brown, C.J.; Brodner, E.V.; Allman, R.M. Assessing Mobility in Older Adults: The UAB Study of Aging Life-Space Assessment. Phys. Ther. 2005, 85, 1008–1119. [Google Scholar] [CrossRef] [Green Version]
- Pek, K.; Chew, J.; Lim, J.P.; Yew, S.; Tan, C.N.; Yeo, A.; Ding, Y.Y.; Lim, W.S. Social Frailty Is Independently Associated with Mood, Nutrition, Physical Performance, and Physical Activity: Insights from a Theory-Guided Approach. Int. J. Environ. Res. Public Health 2020, 17, 4239. [Google Scholar] [CrossRef] [PubMed]
- Fried, L.P.; Tangen, C.M.; Walston, J.; Newman, A.B.; Hirsch, C.; Gottdiener, J.; Seeman, T.; Tracy, R.; Kop, W.J.; Burke, G.; et al. Frailty in Older Adults: Evidence for a Phenotype. J. Gerontol. A Biol. Sci. Med. Sci. 2001, 56, M146–M156. [Google Scholar] [CrossRef] [PubMed]
- Chew, J.; Tay, L.; Lim, J.P.; Leung, B.P.; Yeo, A.; Yew, S.; Ding, Y.Y.; Lim, W.S. Serum Myostatin and IGF-1 as Gender-Specific Biomarkers of Frailty and Low Muscle Mass in Community-Dwelling Older Adults. J. Nutr. Health Aging 2019, 23, 979–986. [Google Scholar] [CrossRef] [PubMed]
- Guralnik, J.M.; Ferrucci, L.; Pieper, C.F.; Leveille, S.G.; Markides, K.S.; Ostir, G.V.; Studenski, S.; Berkman, L.F.; Wallace, R.B. Lower Extremity Function and Subsequent Disability: Consistency across Studies, Predictive Models, and Value of Gait Speed Alone Compared with the Short Physical Performance Battery. J. Gerontol. A Biol. Sci. Med. Sci. 2000, 55, M221–M231. [Google Scholar] [CrossRef] [Green Version]
- Oh, B.; Cho, B.; Choi, H.-C.; Son, K.-Y.; Park, S.M.; Chun, S.; Cho, S.-I. The Influence of Lower-Extremity Function in Elderly Individuals’ Quality of Life (QOL): An Analysis of the Correlation between SPPB and EQ-5D. Arch. Gerontol. Geriatr. 2014, 58, 278–282. [Google Scholar] [CrossRef]
- Chen, L.-K.; Woo, J.; Assantachai, P.; Auyeung, T.-W.; Chou, M.-Y.; Iijima, K.; Jang, H.C.; Kang, L.; Kim, M.; Kim, S.; et al. Asian Working Group for Sarcopenia: 2019 Consensus Update on Sarcopenia Diagnosis and Treatment. J. Am. Med. Dir. Assoc. 2020, 21, 300–307. [Google Scholar] [CrossRef]
- Guigoz, Y.; Lauque, S.; Vellas, B.J. Identifying the Elderly at Risk for Malnutrition. The Mini Nutritional Assessment. Clin. Geriatr. Med. 2002, 18, 737–757. [Google Scholar] [CrossRef]
- Bauer, J.M. The MNA in 2013—Still Going Stronger after Almost Twenty Years. J. Nutr. Health Aging 2013, 17, 288–289. [Google Scholar] [CrossRef] [Green Version]
- Vellas, B.; Villars, H.; Abellan, G.; Soto, M.E.; Rolland, Y.; Guigoz, Y.; Morley, J.E.; Chumlea, W.; Salva, A.; Rubenstein, L.Z.; et al. Overview of the MNA—Its History and Challenges. J. Nutr. Health Aging 2006, 10, 456–463; discussion 463–465. [Google Scholar] [PubMed]
- Wetzel, A.P. Factor Analysis Methods and Validity Evidence: A Review of Instrument Development Across the Medical Education Continuum. Acad. Med. 2012, 87, 1060–1069. [Google Scholar] [CrossRef] [PubMed] [Green Version]
- Covinsky, K.E.; Martin, G.E.; Beyth, R.J.; Justice, A.C.; Sehgal, A.R.; Landefeld, C.S. The Relationship Between Clinical Assessments of Nutritional Status and Adverse Outcomes in Older Hospitalized Medical Patients. J. Am. Geriatr. Soc. 1999, 47, 532–538. [Google Scholar] [CrossRef] [PubMed]
- Sullivan, D.H.; Bopp, M.M.; Roberson, P.K. Protein-Energy Undernutrition and Life-Threatening Complications among the Hospitalized Elderly. J. Gen. Intern. Med. 2002, 17, 923–932. [Google Scholar] [CrossRef] [Green Version]
- Wei, K.; Nyunt, M.-S.-Z.; Gao, Q.; Wee, S.-L.; Yap, K.-B.; Ng, T.-P. Association of Frailty and Malnutrition With Long-Term Functional and Mortality Outcomes Among Community-Dwelling Older Adults: Results From the Singapore Longitudinal Aging Study 1. JAMA Netw. Open 2018, 1, e180650. [Google Scholar] [CrossRef] [Green Version]
- Asamane, E.A.; Greig, C.A.; Aunger, J.A.; Thompson, J.L. Perceptions and Factors Influencing Eating Behaviours and Physical Function in Community-Dwelling Ethnically Diverse Older Adults: A Longitudinal Qualitative Study. Nutrients 2019, 11, 1224. [Google Scholar] [CrossRef] [Green Version]
- Gilbert, P.A.; Khokhar, S. Changing Dietary Habits of Ethnic Groups in Europe and Implications for Health: Nutrition Reviews©, Vol. 66, No. 4. Nutr. Rev. 2008, 66, 203–215. [Google Scholar] [CrossRef]
- Schroll, K.; Moreiras-Varela, O.; Schlettwein-Gsell, D.; Decarli, B.; de Groot, L.; van Staveren, W. Cross-Cultural Variations and Changes in Food-Group Intake among Elderly Women in Europe: Results from the Survey in Europe on Nutrition and the Elderly a Concerted Action (SENECA). Am. J. Clin. Nutr. 1997, 65, 1282S–1289S. [Google Scholar] [CrossRef] [Green Version]
- Herman, C.P. The Social Facilitation of Eating. A Review. Appetite 2015, 86, 61–73. [Google Scholar] [CrossRef]
- Kamphuis, C.B.; de Bekker-Grob, E.W.; van Lenthe, F.J. Factors Affecting Food Choices of Older Adults from High and Low Socioeconomic Groups: A Discrete Choice Experiment. Am. J. Clin. Nutr. 2015, 101, 768–774. [Google Scholar] [CrossRef] [PubMed]
- Conklin, A.I.; Maguire, E.R.; Monsivais, P. Economic Determinants of Diet in Older Adults: Systematic Review. J. Epidemiol. Community Health 2013, 67, 721–727. [Google Scholar] [CrossRef] [Green Version]
- Higgs, S.; Thomas, J. Social Influences on Eating. Curr. Opin. Behav. Sci. 2016, 9, 1–6. [Google Scholar] [CrossRef] [Green Version]
- Vesnaver, E.; Keller, H.H. Social Influences and Eating Behavior in Later Life: A Review. J. Nutr. Gerontol. Geriatr. 2011, 30, 2–23. [Google Scholar] [CrossRef] [PubMed]
- Di Francesco, V.; Fantin, F.; Omizzolo, F.; Residori, L.; Bissoli, L.; Bosello, O.; Zamboni, M. The Anorexia of Aging. Dig. Dis. 2007, 25, 129–137. [Google Scholar] [CrossRef] [PubMed]
- Morley, J.E.; Silver, A.J. Anorexia in the Elderly. Neurobiol. Aging 1988, 9, 9–16. [Google Scholar] [CrossRef]
- Gosnell, B.A.; Levine, A.S.; Morley, J.E. The Effects of Aging on Opioid Modulation of Feeding in Rats. Life Sci. 1983, 32, 2793–2799. [Google Scholar] [CrossRef]
- MacIntosh, C.G.; Morley, J.E.; Wishart, J.; Morris, H.; Jansen, J.B.M.J.; Horowitz, M.; Chapman, I.M. Effect of Exogenous Cholecystokinin (CCK)-8 on Food Intake and Plasma CCK, Leptin, and Insulin Concentrations in Older and Young Adults: Evidence for Increased CCK Activity as a Cause of the Anorexia of Aging. J. Clin. Endocrinol. Metab. 2001, 86, 5830–5837. [Google Scholar] [CrossRef]
- Jones, K.L.; Doran, S.M.; Hveem, K.; Bartholomeusz, F.D.; Morley, J.E.; Sun, W.M.; Chatterton, B.E.; Horowitz, M. Relation between Postprandial Satiation and Antral Area in Normal Subjects. Am. J. Clin. Nutr. 1997, 66, 127–132. [Google Scholar] [CrossRef]
- Cornali, C.; Franzoni, S.; Frisoni, G.B.; Trabucchi, M. Anorexia as an Independent Predictor of Mortality. J. Am. Geriatr. Soc. 2005, 53, 354–355. [Google Scholar] [CrossRef]
- Landi, F.; Russo, A.; Liperoti, R.; Tosato, M.; Barillaro, C.; Pahor, M.; Bernabei, R.; Onder, G. Anorexia, Physical Function, and Incident Disability Among the Frail Elderly Population: Results From the IlSIRENTE Study. J. Am. Med. Dir. Assoc. 2010, 11, 268–274. [Google Scholar] [CrossRef] [PubMed]
- Morley, J.E. Anorexia, Weight Loss, and Frailty. J. Am. Med. Dir. Assoc. 2010, 11, 225–228. [Google Scholar] [CrossRef] [PubMed]
- Morley, J.E.; Adams, E.V. Rapid Geriatric Assessment. J. Am. Med. Dir. Assoc. 2015, 16, 808–812. [Google Scholar] [CrossRef] [PubMed]


| Reference | Setting | Study Population | Comparator | SNAQ Cutoff | AUC | Sn (%) | Sp (%) | α | Comments |
|---|---|---|---|---|---|---|---|---|---|
| Non-Specialised Study Populations | |||||||||
| Wilson 2005 [11] | Community-dwelling subjects, USA | N = 352 Mean age = 73.8 Malnutrition = 10.5% | AHSP | <14 | 0.870 | 81.6 | 84.6 | 0.740 | Analysis was done on the older community-dwelling group. In younger community-dwelling subjects (mean age 39.4 ± 12.0 years), the optimal SNAQ cutoff was <15 (Sn 79.2%, Sp 79.4%) |
| Hanisah 2012 [12] | Subjects from the Medical Ward and Outpatient Medical Clinic in a hospital, Malaysia | N = 145 Mean age = 68.3 Malnutrition = 61.0% | AHSP | ≤14 | 69.7 | 62.5 | 0.578 | ||
| Rolland 2012 [13] | Hospitalized older patients in geriatric units and their spouses, France | N = 175 Mean age = 77.8 Malnutrition = 27.4% | MNA-LF | ≤14 ≤15 | 0.767 | 70.8 79.2 | 74.4 57.5 | ||
| Nakatsu 2015 [14] | Community-dwelling subjects recruited for a health check, Japan | N = 84 Mean age = 76.4 Malnutrition = N/A | MNA-SF | <14 | 0.545 | Translated into Japanese. EFA showed 1 factor (50.0% variance) | |||
| Ilhan 2018 [15] | Community-dwelling subjects attending a Geriatrics outpatient clinic, Turkey | N = 442 Mean age = 77.1 Malnutrition = 28.7% | MNA-LF | ≤14 | 0.522 | Translated into Turkish. Cronbach’s α is increased (0.757) if SNAQ Q4 is deleted. | |||
| Akin 2019 [16] | Community-dwelling subjects, Turkey | N = 871 Mean age = 71.4 Malnutrition = 45.5% | MNA-LF | ≤14 | 0.725 | 50.0 | 84.0 | 0.639 | |
| Lau 2020 | Community-dwelling subjects, Singapore | N = 230 Mean age = 67.2 Malnutrition = 5.7% | MNA-LF | ≤15 | 0.706 | 69.2 | 38.7 | 0.333 | EFA showed 2 factors (61.5% variance). |
| Specialised study populations | |||||||||
| Sties 2012 [17] | Subjects of a metabolic and cardiopulmonary rehabilitation programme, Brazil | N = 145 Mean age = 63.0 (males), 66.0 (females) Malnutrition = 7.0% | 0.610 | Translated into Portuguese. EFA showed 1 factor (47.0% variance). SNAQ Q4 correlated poorly with SNAQ total score. | |||||
| Andreae 2015 [18] | Subjects with heart failure attending an outpatient heart failure clinic, Sweden | N = 186 Median age = 72.0 Malnutrition = N/A | 0.770 | Translated into Swedish. CFA (single-factor model): Chi-square 3.0, p = 0.368; RMSEA 0.05 (90% CI 0.00-0.16), p = 0.368; CFI 1.00, TLI 0.99, WRMR 0.30. | |||||
| Yaxley 2015 [19] | Subjects receiving ambulatory rehabilitation following an acute hospital admission, Australia | N = 185 Median age = 78.0 Malnutrition = 63% | MNA-LF | ≤14 | 28.0 | 94.0 | |||
| Helfenstein 2016 [20] | Subjects with metastatic cancer receiving outpatient palliative care, Switzerland | N = 118 Median age = 69.0 Malnutrition = 31% | NRS | ≤14 | 0.653 | 38.0 | 66.0 | Translated into German. | |
| Tokudome 2017 [21] | Community-dwelling subjects attending day care or health promotion classes, on meal delivery services; and subjects staying in group homes, Japan | N = 649 Mean age = 80.4 Malnutrition = N/A | MNA-SF | ≤14 | 0.640 | Translated into Japanese. EFA showed 1 factor (33.7% variance). SNAQ Q4 correlated poorly with SNAQ total score. | |||
| Wang 2018 [22] | Hospitalized subjects with liver cirrhosis, China | N = 70 Mean age = 66.7 Malnutrition = 75.7% | BMI | ≤11.5 | 0.702 | 79.2 | 72.7 | ||
| Mohammadi 2019 [23] | Subjects seeking weight reduction at a private nutrition clinic, Iran | N = 213 (all females) Mean age = 39.0 Malnutrition = N/A | 0.700 | Translated into Farsi. EFA showed 1 factor (54.0% variance). | |||||
| Oh 2019 [24] | Subjects with recurrent or metastatic cancer, Korea | N = 194 Mean age = 60.0 Malnutrition = 31.4% | MNA-SF | ≤14 | 56.5 | 44.3 | 0.737 | Translated into Korean. EFA showed no overlapping concept item among SNAQ Q1-4. | |
| Wleklik 2019 [25] | Hospitalized subjects with heart failure, Poland | N = 103 Median age = 65.0–70.0 Malnutrition = 94% | MNA-LF | ≤14 | 0.860 | Translated into Polish. CFA (single-factor model): Chi-square 1.93, p = 0.380; RMSEA 0.00 (90% CI: 0.00-0.19), p = 0.47; CFI 1.00, TLI 1.00, SRMR 0.02. | |||
| Characteristics of Study Cohort | Total (n = 230) | SNAQ >15 (n = 137) | SNAQ ≤15 (n = 93) | p-Value |
|---|---|---|---|---|
| Age (years) | 67.2 ± 7.4 | 67.0 ± 6.8 | 67.5 ± 8.3 | 0.032 |
| Gender (female, %) | 72.6 | 69.3 | 77.4 | 0.178 |
| Race (Chinese, %) | 92.2 | 93.4 | 90.3 | 0.426 |
| Education (years) | 10.8 ± 4.4 | 11.0 ± 4.6 | 10.4 ± 4.0 | 0.079 |
| No. of cardiovascular risk factors (%) * | 0.696 | |||
| None | 29.7 | 28.7 | 31.2 | |
| 1 to 2 | 55.9 | 58.0 | 52.7 | |
| 3 and above | 14.4 | 13.3 | 16.1 | |
| Known osteoporosis (%) | 27.4 | 27.0 | 28.0 | 0.874 |
| Anthropometry | ||||
| BMI (kg/m2) | 23.9 ± 3.2 | 23.9 ± 3.2 | 23.8 ± 3.3 | 0.625 |
| Calf circumference (cm) | 34.8 ± 3.2 | 35.1 ± 3.1 | 34.4 ± 3.3 | 0.729 |
| Calf circumference < 31 cm (%) | 4.3 | 1.5 | 8.6 | 0.009 |
| Mid-arm circumference (cm) | 27.6 ± 3.0 | 27.8 ± 2.9 | 27.4 ± 3.1 | 0.936 |
| Waist circumference (cm) | 85.3 ± 9.3 | 85.4 ± 9.0 | 85.0 ± 9.8 | 0.426 |
| Cognition and Mood | ||||
| CMMSE (0–28) | 26.1 ± 1.7 | 26.3 ± 1.6 | 25.9 ± 1.8 | 0.311 |
| GDS (0–15) | 1.0 (0.0–2.0) | 1.0 (0.0–1.0) | 1.0 (0.0–2.0) | 0.002 |
| Nutrition | ||||
| MNA total (0–30) | 27.2 ± 1.9 | 27.6 ± 1.6 | 26.6 ± 2.1 | 0.011 |
| MNA < 24: Malnourished or at risk of malnutrition (%) | 5.7 | 2.9 | 9.7 | 0.029 |
| SNAQ total (0–20) | 15.8 ± 1.5 | 16.8 ± 0.8 | 14.3 ± 0.9 | 0.110 |
| SNAQ ≤ 14 (%) | 18.3 | - | - | |
| SNAQ ≤ 15 (%) | 40.4 | - | - | |
| Functional Status and Activity Level | ||||
| Barthel ADL index (0–100) | 100.0 (95.0–100.0) | 100.0 (95.0–100.0) | 100.0 (95.0–100.0) | 0.094 |
| Lawton iADL scale (0–23) | 23.0 (22.0–23.0) | 23.0 (22.0–23.0) | 23.0 (22.0–23.0) | 0.449 |
| Frenchay Activities Index, FAI (0–45) | 32.2 ± 5.2 | 32.8 ± 4.8 | 31.3 ± 5.6 | 0.302 |
| IPAQ, total METS per week (mins) | 5042.4 ± 2402.7 | 5429.0 ± 2506.9 | 4477.2 ± 2131.0 | 0.086 |
| Life-Space Assessment | ||||
| Life-Space Level 1 (max 8) | 8.0 ± 0.3 | 8.0 ± 0.17 | 8.0 ± 0.41 | 0.474 |
| Life-Space Level 2 (max 16) | 15.4 ± 2.2 | 15.6 ± 1.6 | 15.0 ± 2.7 | 0.069 |
| Life-Space Level 3 (max 24) | 18.7 ± 6.9 | 19.5 ± 6.7 | 17.6 ± 7.1 | 0.041 |
| Life-Space Level 4 (max 32) | 21.5 ± 8.5 | 22.0 ± 8.8 | 20.8 ± 8.0 | 0.285 |
| Life-Space Level 5 (max 40) | 26.9 ± 9.7 | 28.3 ± 9.4 | 24.7 ± 9.7 | 0.004 |
| Life-Space Total (max 120) | 90.5 ± 17.7 | 93.4 ± 16.5 | 86.1 ± 18.6 | 0.002 |
| Frailty and Physical Function | ||||
| Modified Fried phenotypic criteria (0–5) | 0.289 | |||
| 0: Nonfrail (%) | 57.8 | 62.0 | 51.6 | |
| 1–2: Prefrail (%) | 41.3 | 37.2 | 47.3 | |
| 3 and above: Frail (%) | 0.9 | 0.7 | 1.1 | |
| Social Frailty, SFS-8 (0–8) | 0.004 | |||
| 0–1: Social nonfrailty (%) | 63.8 | 72.1 | 51.6 | |
| 2–3: Social prefrailty (%) | 28.8 | 23.5 | 36.6 | |
| 4 and above: Social frailty (%) | 7.4 | 4.4 | 11.8 | |
| SPPB (0–12) | 12.0 (11.0–12.0) | 12.0 (12.0–12.0) | 12.0 (11.0–12.0) | 0.001 |
| Hand grip strength (kg) | 23.5 ± 7.1 | 24.5 ± 7.7 | 21.9 ± 5.9 | 0.017 |
| Gait speed (m/s) | 1.2 ± 0.2 | 1.2 ± 0.2 | 1.1 ± 0.2 | 0.256 |
| 5-time chair stand test (secs) | 9.46 ± 3.03 | 9.05 ± 2.81 | 10.06 ± 3.25 | 0.014 |
| Laboratory Markers | ||||
| 25-hydroxy Vitamin D level (µg/L) | 30.6 ± 8.8 | 30.6 ± 8.4 | 30.6 ± 9.4 | 0.322 |
| Serum albumin (g/L) | 41.2 ± 2.6 | 41.3 ± 2.6 | 41.0 ± 2.6 | 0.890 |
| SNAQ Items | Mean ± SD (n = 230) | Factor 1: Appetite Perception | Factor 2: Satiety and Intake | α If Item Deleted |
|---|---|---|---|---|
| Q1: My appetite is ____ | 3.97 ± 0.71 | 0.811 | 0.214 | |
| Q2: When I eat, I feel full ____ | 3.80 ± 0.57 | 0.676 | 0.285 | |
| Q3. Food tastes ____ | 3.81 ± 0.60 | 0.797 | 0.179 | |
| Q4. Normally I eat ____ | 4.21 ± 0.72 | 0.808 | 0.398 * | |
| Eigenvalue | 1.396 | 1.063 | ||
| Explained variance (%) | 34.9 | 26.6 |
| SNAQ Total | SNAQ Factor 1 | SNAQ Factor 2 | |
|---|---|---|---|
| SNAQ Factor 1 | 0.767 * | ||
| SNAQ Factor 2 | 0.689 * | 0.119 | |
| Convergent | |||
| MNA | 0.238 * | 0.187 * | 0.161 * |
| Calf circumference | 0.157 * | 0.151 * | 0.049 |
| GDS | −0.241 * | −0.257 * | −0.074 |
| Discriminant | |||
| Waist circumference | 0.037 | 0.011 | 0.047 |
| CMMSE | 0.127 | 0.147 * | 0.052 |
| Education | −0.089 | 0.128 | 0.005 |
| Social Frailty (SFS-8) | Physical Frailty (Fried) | Depressive Symptoms (GDS) | |||||||||
|---|---|---|---|---|---|---|---|---|---|---|---|
| Social Nonfrailty (n = 146) | Social Prefrailty (n = 66) | Social Frailty (n = 17) | p | Nonfrail (n = 133) | Prefrail (n = 95) | Frail (n = 2) | p | No (n = 222) | Yes (n = 8) | p | |
| SNAQ Total | 15.96 ± 1.35 | 15.56 ± 1.78 | 15.18 ± 1.43 | 0.045 | 15.94 ± 1.39 | 15.61 ± 1.64 | 14.50 ± 2.12 | 0.127 | 15.84 ± 1.50 | 15.07 ± 1.54 | 0.065 |
| SNAQ Factor 1 | 7.91 ± 0.95 | 7.70 ± 1.18 | 6.94 ± 1.09 | 0.001 | 7.91 ± 1.01 | 7.63 ± 1.12 | 7.00 ± 1.41 | 0.087 | 7.81 ± 1.05 | 7.43 ± 1.22 | 0.195 |
| SNAQ Factor 2 | 8.05 ± 0.89 | 7.86 ± 1.12 | 8.24 ± 0.97 | 0.267 | 8.03 ± 0.90 | 7.98 ± 1.06 | 7.50 ± 0.71 | 0.706 | 8.03 ± 0.07 | 7.64 ± 0.27 | 0.150 |
| Unadjusted | Adjusted * | |||
|---|---|---|---|---|
| Outcome Variables | Odds Ratio (95% CI) | p | Odds Ratio (95% CI) | p |
| Social frailty, SFS-8 ≥ 2 | ||||
| SNAQ ≤14 | 1.59 (0.81, 3.13) | 0.182 | 1.05 (0.50, 2.24) | 0.890 |
| SNAQ ≤15 | 2.42 (1.39, 4.20) | 0.002 | 1.99 (1.09, 3.63) | 0.025 |
| Life space mobility, LSA total ≤76 | ||||
| SNAQ ≤14 | 3.12 (1.50, 6.48) | 0.002 | 2.29 (1.03, 5.07) | 0.041 |
| SNAQ ≤15 | 2.68 (1.39, 5.16) | 0.003 | 2.06 (1.03, 4.12) | 0.041 |
| Short Physical Performance Battery <11 | ||||
| SNAQ ≤14 | 3.78 (1.65, 8.64) | 0.002 | 3.93 (1.60, 9.66) | 0.003 |
| SNAQ ≤15 | 2.94 (1.33, 6.52) | 0.008 | 3.00 (1.30, 6.94) | 0.010 |
| Hand grip strength ^ | ||||
| SNAQ ≤14 | 1.39 (0.66, 2.95) | 0.390 | 0.79 (0.33, 1.87) | 0.587 |
| SNAQ ≤15 | 1.51 (0.82, 2.79) | 0.188 | 1.14 (0.58, 2.25) | 0.711 |
| Five-time chair stand test ≥12 s | ||||
| SNAQ ≤14 | 2.53 (1.20, 5.35) | 0.015 | 2.45 (1.10, 5.48) | 0.029 |
| SNAQ ≤15 | 2.15 (1.11, 4.16) | 0.023 | 2.18 (1.09, 4.38) | 0.028 |
© 2020 by the authors. Licensee MDPI, Basel, Switzerland. This article is an open access article distributed under the terms and conditions of the Creative Commons Attribution (CC BY) license (http://creativecommons.org/licenses/by/4.0/).
Share and Cite
Lau, S.; Pek, K.; Chew, J.; Lim, J.P.; Ismail, N.H.; Ding, Y.Y.; Cesari, M.; Lim, W.S. The Simplified Nutritional Appetite Questionnaire (SNAQ) as a Screening Tool for Risk of Malnutrition: Optimal Cutoff, Factor Structure, and Validation in Healthy Community-Dwelling Older Adults. Nutrients 2020, 12, 2885. https://0-doi-org.brum.beds.ac.uk/10.3390/nu12092885
Lau S, Pek K, Chew J, Lim JP, Ismail NH, Ding YY, Cesari M, Lim WS. The Simplified Nutritional Appetite Questionnaire (SNAQ) as a Screening Tool for Risk of Malnutrition: Optimal Cutoff, Factor Structure, and Validation in Healthy Community-Dwelling Older Adults. Nutrients. 2020; 12(9):2885. https://0-doi-org.brum.beds.ac.uk/10.3390/nu12092885
Chicago/Turabian StyleLau, Sabrina, Kalene Pek, Justin Chew, Jun Pei Lim, Noor Hafizah Ismail, Yew Yoong Ding, Matteo Cesari, and Wee Shiong Lim. 2020. "The Simplified Nutritional Appetite Questionnaire (SNAQ) as a Screening Tool for Risk of Malnutrition: Optimal Cutoff, Factor Structure, and Validation in Healthy Community-Dwelling Older Adults" Nutrients 12, no. 9: 2885. https://0-doi-org.brum.beds.ac.uk/10.3390/nu12092885