
Coffee Consumption and Blood Pressure: Results of the Second Wave of the Cognition of Older People, Education, Recreational Activities, Nutrition, Comorbidities, and Functional Capacity Studies (COPERNICUS)

 ,
,  ,
,  , and
, and
Abstract
:1. Introduction
1.1. Hypertension
1.2. Coffee
1.3. Acute Effects of Coffee Consumption on BP
1.4. Chronic Effects of Coffee Consumption on BP
2. Materials and Methods
2.1. Study Group
2.1.1. Sample Size Calculation
2.1.2. Study Recruitment
2.2. Assessment Methods
2.2.1. Blood Pressure Measurement and Hypertension History Treatment and Assessment
2.2.2. Frequency of Coffee Consumption
2.2.3. Body Composition Analysis
2.3. Statistical Analysis
3. Results
4. Discussion
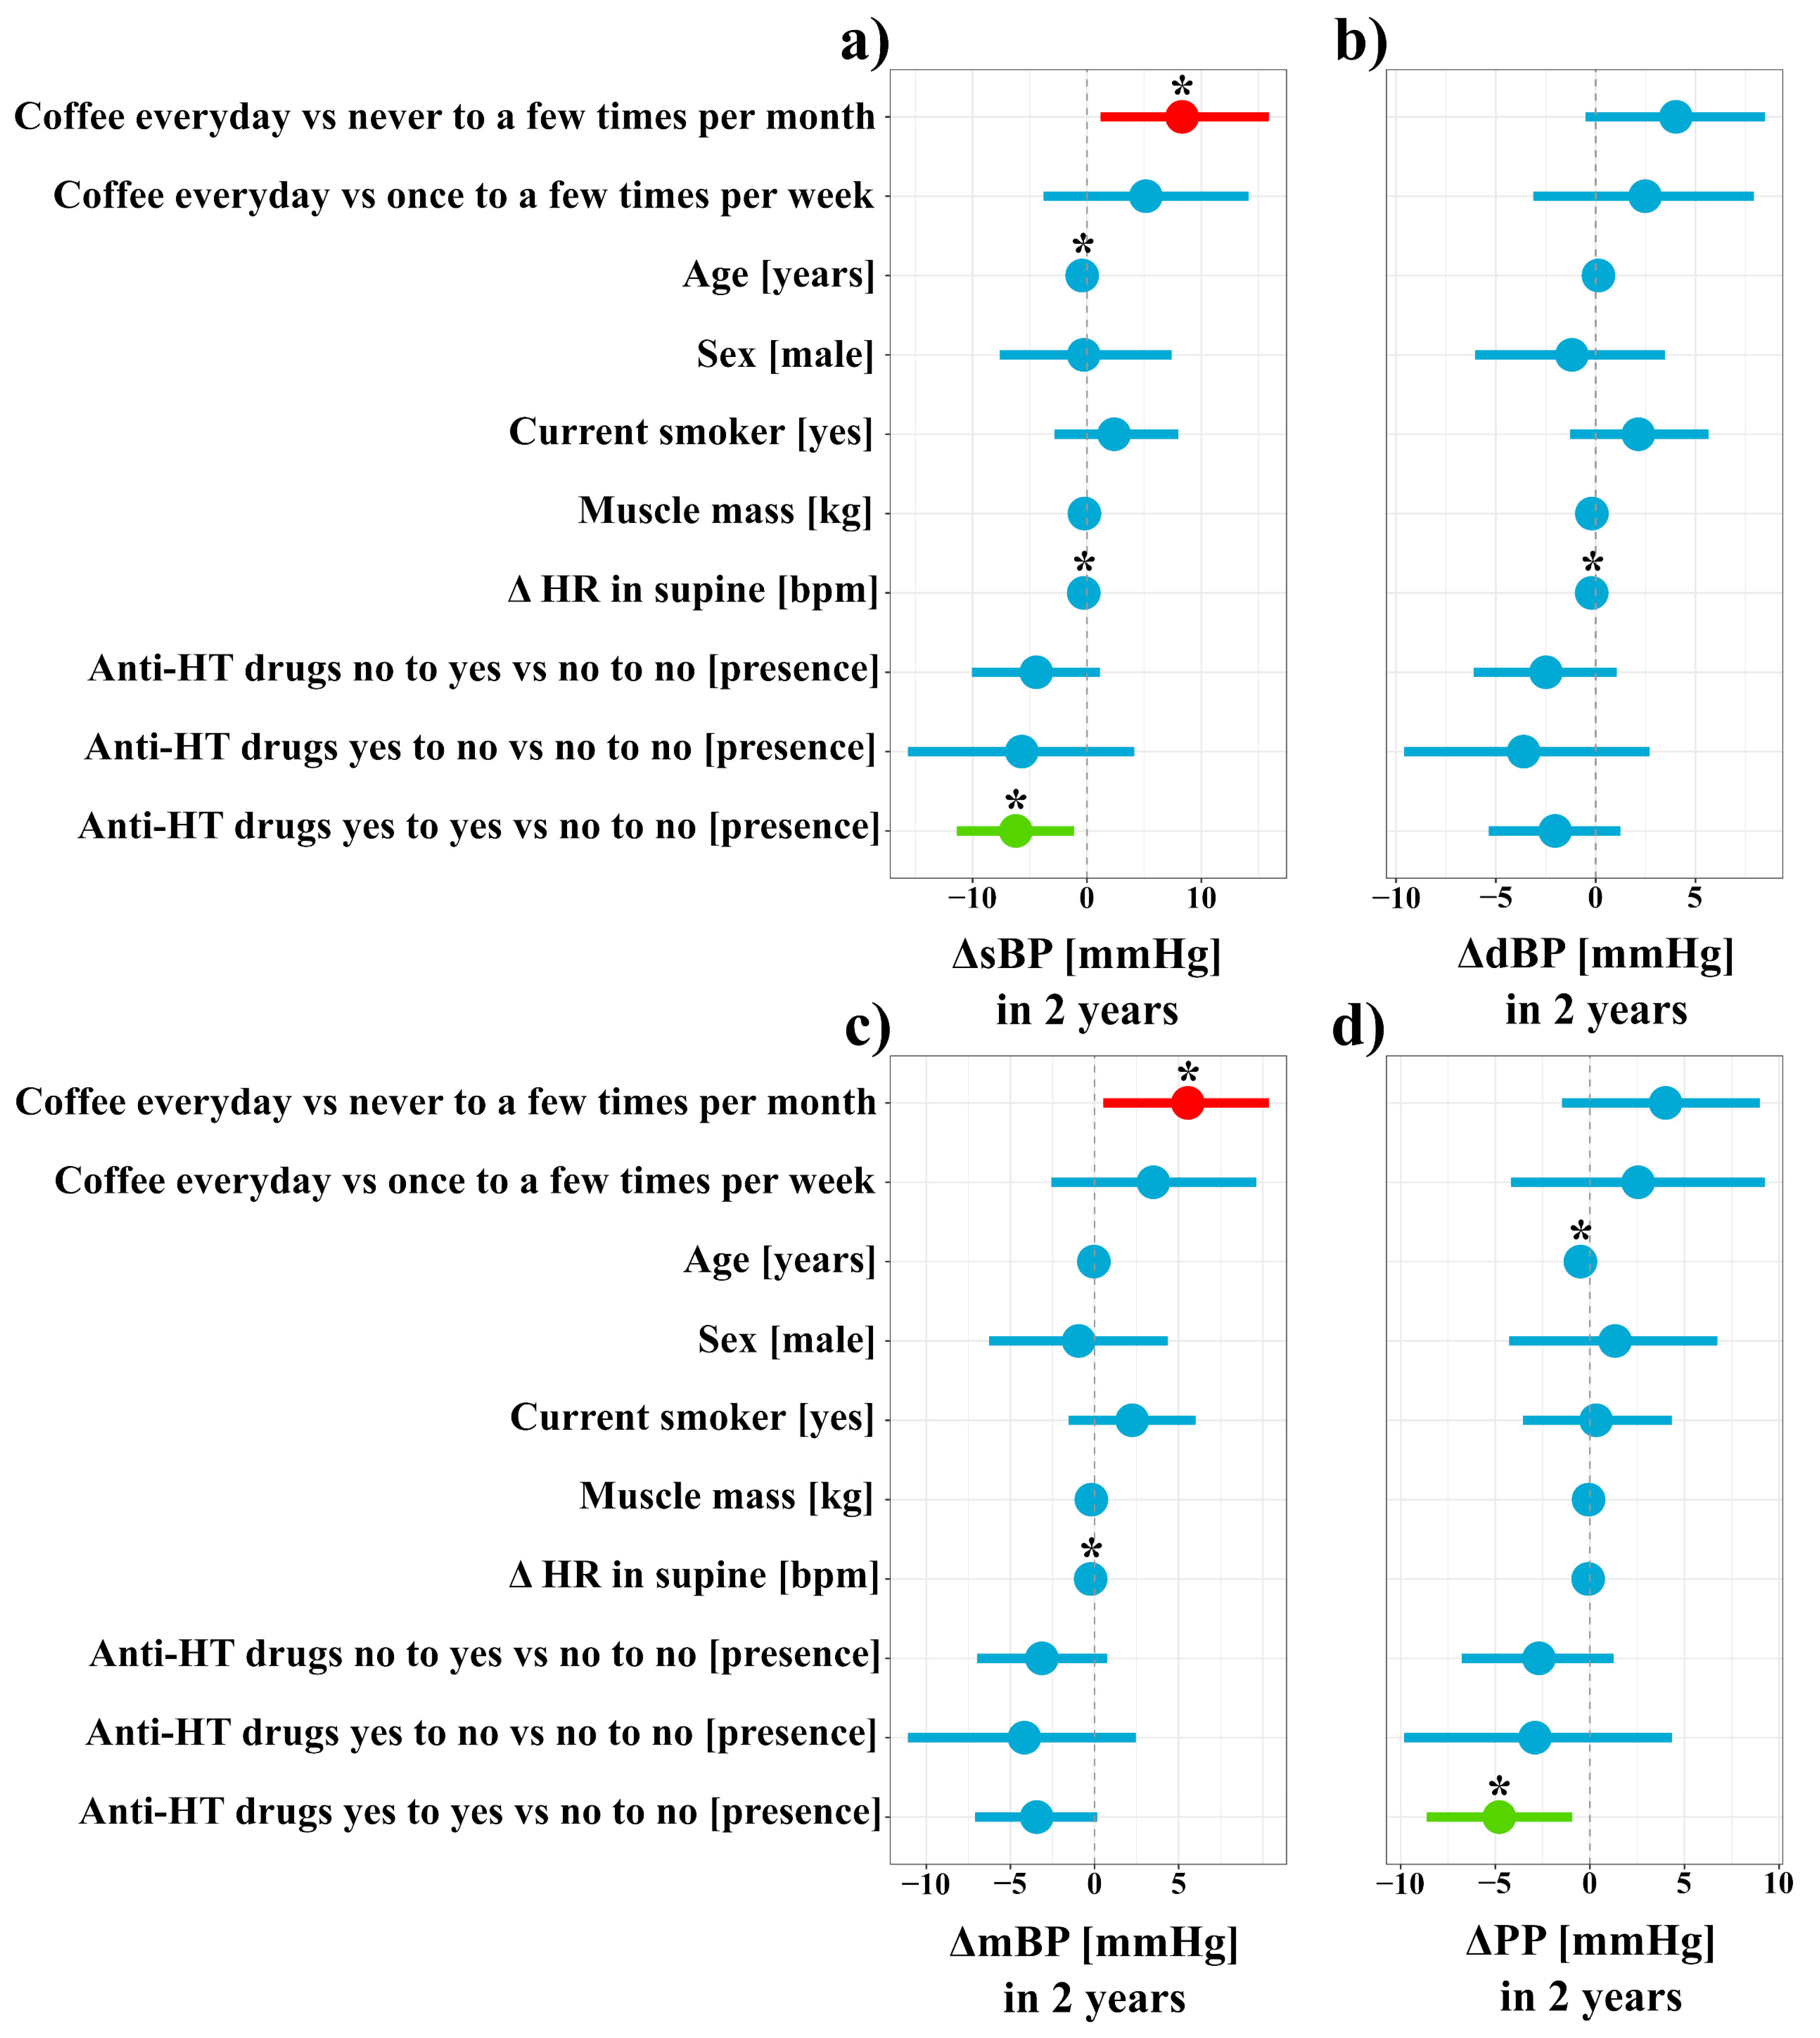
4.1. Realtionship between Coffee Consumption and Blood Pressure
4.2. Possible Confounding Factors in Relationship between Coffee Consumption and Blood Pressure
4.3. Physiological Differences between Systolic and Diastolic Blood Pressure
4.4. Study Limitations
5. Conclusions
Supplementary Materials
Author Contributions
Funding
Institutional Review Board Statement
Informed Consent Statement
Data Availability Statement
Acknowledgments
Conflicts of Interest
Appendix A

| Category | Count | Percent |
|---|---|---|
| Primary education (incomplete) | 1 | 0.49 |
| Primary education | 3 | 1.46 |
| Vocational school education | 22 | 10.73 |
| Secondary education (incomplete) | 6 | 2.93 |
| Secondary education | 92 | 44.88 |
| Higher professional/Engineering education | 26 | 12.68 |
| Master’s degree | 52 | 25.37 |
| PhD degree and higher | 3 | 1.46 |
| Variables | Time Points at Which the Variables Were Measured |
|---|---|
| Coffee consumption | after |
| Age (years) | before |
| Sex | before |
| Current smoker | after |
| Muscle mass before (kg) | before and after two years |
| Anti-HT drugs (quantity) | before and after two years |
| Δ in HR (bpm) | before and after two years |
References
- Shahoud, J.S.; Aeddula, N.R. Physiology, Arterial Pressure Regulation. StatPearls. 2019. Available online: https://0-www-ncbi-nlm-nih-gov.brum.beds.ac.uk/books/NBK538509/ (accessed on 24 September 2021).
- Sun, Z. Aging, arterial stiffness, and hypertension. Hypertension 2015, 65, 252–256. [Google Scholar] [CrossRef] [Green Version]
- Buford, T.W. Hypertension and aging. Ageing Res. Rev. 2016, 26, 96–111. [Google Scholar] [CrossRef] [Green Version]
- Bonita, J.S.; Mandarano, M.; Shuta, D.; Vinson, J. Coffee and cardiovascular disease: In Vitro, cellular, animal, and human studies. Pharmacol. Res. 2007, 55, 187–198. [Google Scholar] [CrossRef] [PubMed]
- Bae, J.H.; Park, J.H.; Im, S.S.; Song, D.K. Coffee and health. Integr. Med. Res. 2014, 3, 189–191. [Google Scholar] [CrossRef] [PubMed] [Green Version]
- Nurminen, M.L.; Niittynen, L.; Korpela, R.; Vapaatalo, H. Coffee, caffeine and blood pressure: A critical review. Eur. J. Clin. Nutr. 1999, 53, 831–839. [Google Scholar] [CrossRef] [PubMed] [Green Version]
- Geleijnse, J.M. Habitual coffee consumption and blood pressure: An epidemiological perspective. Vasc. Health Risk Manag. 2008, 4, 963–970. [Google Scholar] [CrossRef] [PubMed]
- Umemura, T.; Ueda, K.; Nishioka, K.; Hidaka, T.; Takemoto, H.; Nakamura, S.; Jitsuiki, D.; Soga, J.; Goto, C.; Chayama, K.; et al. Effects of acute administration of caffeine on vascular function. Am. J. Cardiol. 2006, 98, 1538–1541. [Google Scholar] [CrossRef]
- Conde, S.V.; da Silva, T.N.; Gonzalez, C.; Carmo, M.M.; Monteiro, E.C.; Guarino, M.P. Chronic caffeine intake decreases circulating catecholamines and prevents diet-induced insulin resistance and hypertension in rats. Br. J. Nutr. 2012, 107, 86–95. [Google Scholar] [CrossRef]
- Ammon, H.P.; Bieck, P.R.; Mandalaz, D.; Verspohl, E.J. Adaptation of blood pressure to continuous heavy coffee drinking in young volunteers. A double-blind crossover study. Br. J. Clin. Pharmacol. 1983, 15, 701–706. [Google Scholar] [CrossRef] [Green Version]
- Casiglia, E.; Bongiovi, S.; Paleari, C.D.; Petucco, S.; Boni, M.; Colangeli, G.; Penzo, M.; Pessina, A.C. Haemodynamic effects of coffee and caffeine in normal volunteers: A placebo-controlled clinical study. J. Intern. Med. 1991, 229, 501–504. [Google Scholar] [CrossRef]
- Grosso, G.; Micek, A.; Godos, J.; Pajak, A.; Sciacca, S.; Bes-Rastrollo, M.; Galvano, F.; Martinez-Gonzalez, M.A. Long-term coffee consumption is associated with decreased incidence of new-onset hypertension: A dose–response meta-analysis. Nutrients 2017, 9, 890. [Google Scholar] [CrossRef]
- Miranda, A.M.; Steluti, J.; Norde, M.M.; Fisberg, R.M.; Marchioni, D.M. The association between genetic risk score and blood pressure is modified by coffee consumption: Gene–diet interaction analysis in a population-based study. Clin. Nutr. 2019, 38, 1721–1728. [Google Scholar] [CrossRef]
- Zhang, Z.; Hu, G.; Caballero, B.; Appel, L.; Chen, L. Habitual coffee consumption and risk of hypertension: A systematic review and meta-analysis of prospective observational studies. Am. J. Clin. Nutr. 2011, 93, 1212–1219. [Google Scholar] [CrossRef] [Green Version]
- Kreidler, S.M.; Muller, K.E.; Grunwald, G.K.; Ringham, B.M.; Coker-Dukowitz, Z.T.; Sakhadeo, U.R.; Barón, A.E.; Glueck, D.H. GLIMMPSE: Online power computation for linear models with and without a baseline covariate. J. Stat. Softw. 2013, 54, i10. [Google Scholar] [CrossRef] [Green Version]
- Kujawski, S.; Kujawska, A.; Perkowski, R.; Androsiuk-Perkowska, J.; Hajec, W.; Kwiatkowska, M.; Skierkowska, N.; Husejko, J.; Bieniek, D.; Newton, J.L.; et al. Cognitive function changes in older people. Results of second wave of Cognition of Older People; Education; Recreational activities; NutritIon; Comorbidities; fUnctional capacity Studies (COPERNICUS). Front. Aging Neurosci. 2021, 13, 653570. [Google Scholar] [CrossRef] [PubMed]
- Frankenfield, D.C.; Rowe, W.A.; Cooney, R.N.; Smith, J.S.; Becker, D. Limits of body mass index to detect obesity and predict body composition. Nutrition 2001, 17, 26–30. [Google Scholar] [CrossRef]
- R Core Team. R: A Language and Environment for Statistical Computing; R Foundation for Statistical Computing: Vienna, Austria, 2020. [Google Scholar]
- Patil, I. Ggstatsplot: ‘ggplot2’ Based Plots with Statistical Details. CRAN 2018. [Google Scholar] [CrossRef]
- Bates, D.; Mächler, M.; Bolker, B.; Walker, S. Fitting linear mixed-effects models using lme4. J. Stat. Softw. 2015, 67, 1–48. [Google Scholar] [CrossRef]
- Navarro, A.M.; Martinez-Gonzalez, M.A.; Gea, A.; Ramallal, R.; Ruiz-Canela, M.; Toledo, E. Coffee consumption and risk of hypertension in the SUN Project. Clin. Nutr. 2019, 38, 389–397. [Google Scholar] [CrossRef]
- Xie, C.; Cui, L.; Zhu, J.; Wang, K.; Sun, N.; Sun, C. Coffee consumption and risk of hypertension: A systematic review and dose–response meta-analysis of cohort studies. J. Hum. Hypertens. 2018, 32, 83–93. [Google Scholar] [CrossRef]
- Miranda, A.M.; Goulart, A.C.; Benseñor, I.M.; Lotufo, P.A.; Marchioni, D.M. Coffee consumption and risk of hypertension: A prospective analysis in the cohort study. Clin. Nutr. 2021, 40, 542–549. [Google Scholar] [CrossRef]
- De Giuseppe, R.; Di Napoli, I.; Granata, F.; Mottolese, A.; Cena, H. Caffeine and blood pressure: A critical review perspective. Nutr. Res. Rev. 2019, 32, 169–175. [Google Scholar] [CrossRef] [PubMed]
- Sato, Y.; Itagaki, S.; Kurokawa, T.; Ogura, J.; Kobayashi, M.; Hirano, T.; Sugawara, M.; Iseki, K. In vitro and in vivo antioxidant properties of chlorogenic acid and caffeic acid. Int. J. Pharm. 2011, 403, 136–138. [Google Scholar] [CrossRef] [PubMed]
- Dórea, J.G.; da Costa, T.H. Is coffee a functional food? Br. J. Nutr. 2005, 93, 773–782. [Google Scholar] [CrossRef] [Green Version]
- Yashin, A.; Yashin, Y.; Wang, J.Y.; Nemzer, B. Antioxidant and antiradical activity of coffee. Antioxidants 2013, 2, 230–245. [Google Scholar] [CrossRef] [PubMed]
- Nishitsuji, K.; Watanabe, S.; Xiao, J.; Nagatomo, R.; Ogawa, H.; Tsunematsu, T.; Umemoto, H.; Morimoto, Y.; Akatsu, H.; Inoue, K.; et al. Effect of coffee or coffee components on gut microbiome and short-chain fatty acids in a mouse model of metabolic syndrome. Sci. Rep. 2018, 8, 16173. [Google Scholar] [CrossRef] [PubMed] [Green Version]
- Cowan, T.E.; Palmnas, M.; Ardell, K.; Yang, J.J.; Reimer, R.; Vogel, H.; Shearer, J. Chronic coffee consumption alters gut microbiome: Potential mechanism to explain the protective effects of coffee on type 2 diabetes? Exp. Biol. Meet. Abstr. 2013, 27, 951.1. [Google Scholar] [CrossRef]
- Kolb, H.; Kempf, K.; Martin, S. Health effects of coffee: Mechanism unraveled? Nutrients 2020, 12, 1842. [Google Scholar] [CrossRef]
- Zhou, A.; Hyppönen, E. Long-term coffee consumption; caffeine metabolism genetics; and risk of cardiovascular disease: A prospective analysis of up to 347,077 individuals and 8368 cases. Am. J. Clin. Nutr. 2019, 109, 509–516. [Google Scholar] [CrossRef]
- Safar, M.E.; Plante, G.E.; Mimran, A. Arterial stiffness; pulse pressure; and the kidney. Am. J. Hypertens. 2015, 28, 561–569. [Google Scholar] [CrossRef] [Green Version]
- Cheung, R.J.; Gupta, E.K.; Ito, M.K. Acute coffee ingestion does not affect LDL cholesterol level. Ann. Pharmacother. 2005, 39, 1209–1213. [Google Scholar] [CrossRef] [PubMed]
- Mattioli, A.V. Effects of caffeine and coffee consumption on cardiovascular disease and risk factors. Future Cardiol. 2007, 3, 203–212. [Google Scholar] [CrossRef]
- Mokrysz, S. Preferencje konsumentów wobec rodzajów kawy oraz marek kawy mielonej dostępnych na polskim rynku. Stud. Ekon. 2017, 330, 128–138. [Google Scholar]
- Przybysz, M.A.; Widla, G.; Dluzewska, E. Preferencje konsumenckie picia kawy. Wpływ temperatury i czasu prażenia ziarna kawy na ocenę smaku i zapachu espresso. Zesz. Probl. Postępów Nauk. Rol. 2013, 572, 65–79. [Google Scholar]
- Campesi, I.; Marino, M.; Cipolletti, M.; Romani, A.; Franconi, F. Put “gender glasses” on the effects of phenolic compounds on cardiovascular function and diseases. Eur. J. Nutr. 2018, 57, 2677–2691. [Google Scholar] [CrossRef]
- Gordon, E.H.; Peel, N.M.; Samanta, M.; Theou, O.; Howlett, S.E.; Hubbard, R.E. Sex differences in frailty: A systematic review and meta-analysis. Exp. Gerontol. 2017, 89, 30–40. [Google Scholar] [CrossRef]
- Yang, Y.; Kozloski, M. Sex differences in age trajectories of physiological dysregulation: Inflammation, metabolic syndrome, and allostatic load. J. Gerontol. Ser. A Biomed. Sci. Med. Sci. 2011, 66, 493–500. [Google Scholar] [CrossRef] [PubMed] [Green Version]
- Wu, J.N.; Ho, S.C.; Zhou, C.; Ling, W.H.; Chen, W.Q.; Wang, C.L.; Chen, Y.M. Coffee consumption and risk of coronary heart diseases: A meta-analysis of 21 prospective cohort studies. Int. J. Cardiol. 2009, 137, 216–225. [Google Scholar] [CrossRef] [PubMed]


| Variables | Mean ± SD |
|---|---|
| Age before (years) | 69.67 ± 6 |
| Muscle mass before (kg) | 45.54 ± 8.2 |
| Muscle mass after two years (kg) | 44.87 ± 6.7 |
| HR before (bpm) | 67.57 ± 8 |
| HR after (bpm) | 69.6 ± 9.8 |
| Parameter | Level of Estimate | Number | % |
|---|---|---|---|
| Sex | Male | 40 | 19.5 |
| Female | 165 | 80.5 | |
| Current smoker | No | 165 | 80.5 |
| Yes | 38 | 18.5 | |
| Missing data | 2 | 1 | |
| Anti-HT drugs | yes to no | 10 | 4.9 |
| yes to yes | 62 | 30.2 | |
| no to yes | 49 | 23.9 | |
| no to no | 84 | 41 | |
| Coffee consumption frequency | never to a few times per month | 19 | 9.3 |
| once a week to a few times per week | 26 | 12.7 | |
| every day | 160 | 78 |
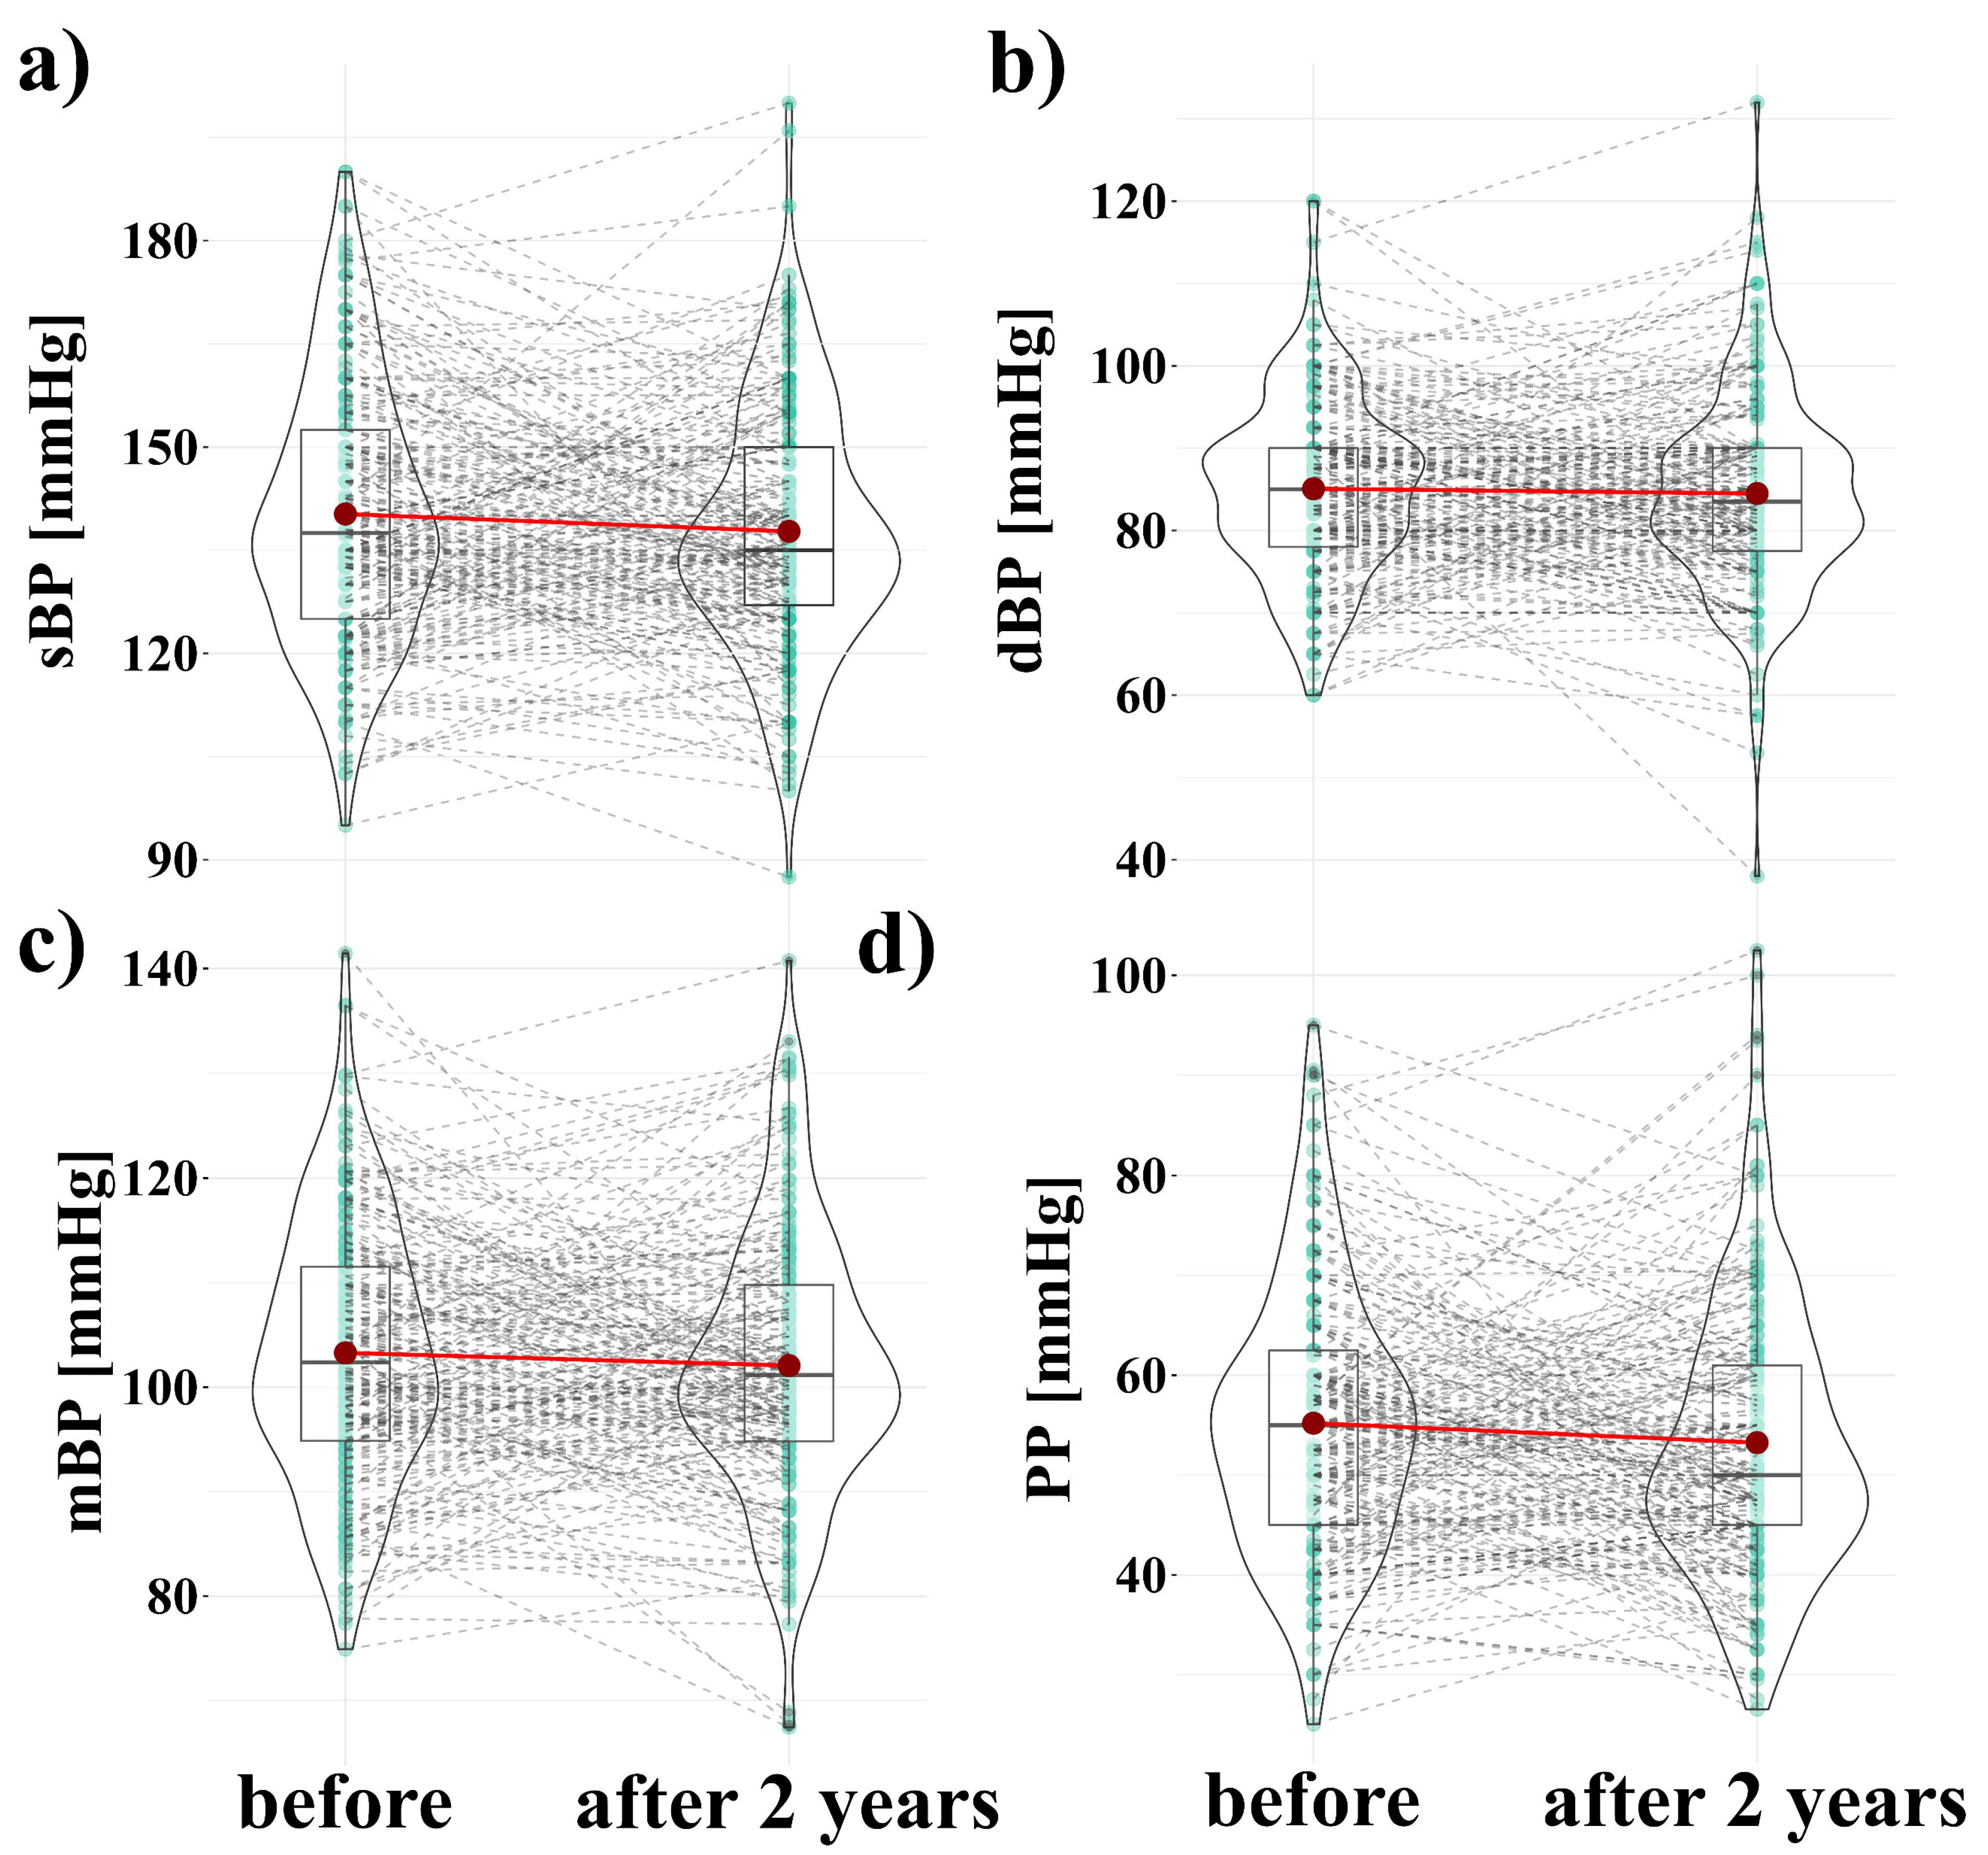
| Variable | Mean ± SD before | Mean ± SD after 2 Years | loge(VWilcoxon) | p-Value |
|---|---|---|---|---|
| sBP | 140.26 ± 19 | 137.73 ± 18 | 9.29 | 0.13 |
| dBP | 85.06 ± 10.7 | 84.49 ± 12.1 | 9.16 | 0.42 |
| mBP | 103.28 ± 12.5 | 102.06 ± 12.7 | 9.33 | 0.25 |
| PP | 55.20 ± 13.3 | 53.25 ± 14 | 9.36 | 0.06 |
Publisher’s Note: MDPI stays neutral with regard to jurisdictional claims in published maps and institutional affiliations. |
© 2021 by the authors. Licensee MDPI, Basel, Switzerland. This article is an open access article distributed under the terms and conditions of the Creative Commons Attribution (CC BY) license (https://creativecommons.org/licenses/by/4.0/).
Share and Cite
Kujawska, A.; Kujawski, S.; Hajec, W.; Skierkowska, N.; Kwiatkowska, M.; Husejko, J.; Newton, J.L.; Simoes, J.A.; Zalewski, P.; Kędziora-Kornatowska, K. Coffee Consumption and Blood Pressure: Results of the Second Wave of the Cognition of Older People, Education, Recreational Activities, Nutrition, Comorbidities, and Functional Capacity Studies (COPERNICUS). Nutrients 2021, 13, 3372. https://0-doi-org.brum.beds.ac.uk/10.3390/nu13103372
Kujawska A, Kujawski S, Hajec W, Skierkowska N, Kwiatkowska M, Husejko J, Newton JL, Simoes JA, Zalewski P, Kędziora-Kornatowska K. Coffee Consumption and Blood Pressure: Results of the Second Wave of the Cognition of Older People, Education, Recreational Activities, Nutrition, Comorbidities, and Functional Capacity Studies (COPERNICUS). Nutrients. 2021; 13(10):3372. https://0-doi-org.brum.beds.ac.uk/10.3390/nu13103372
Chicago/Turabian StyleKujawska, Agnieszka, Sławomir Kujawski, Weronika Hajec, Natalia Skierkowska, Małgorzata Kwiatkowska, Jakub Husejko, Julia L. Newton, Jose Augusto Simoes, Paweł Zalewski, and Kornelia Kędziora-Kornatowska. 2021. "Coffee Consumption and Blood Pressure: Results of the Second Wave of the Cognition of Older People, Education, Recreational Activities, Nutrition, Comorbidities, and Functional Capacity Studies (COPERNICUS)" Nutrients 13, no. 10: 3372. https://0-doi-org.brum.beds.ac.uk/10.3390/nu13103372