
Palatable Flavoured Fluids without Carbohydrates and Electrolytes Do Not Enhance Voluntary Fluid Consumption in Male Collegiate Basketball Players in the Heat

 , and
, and 
Abstract
:1. Introduction
2. Materials and Methods
2.1. Participants
2.2. Design
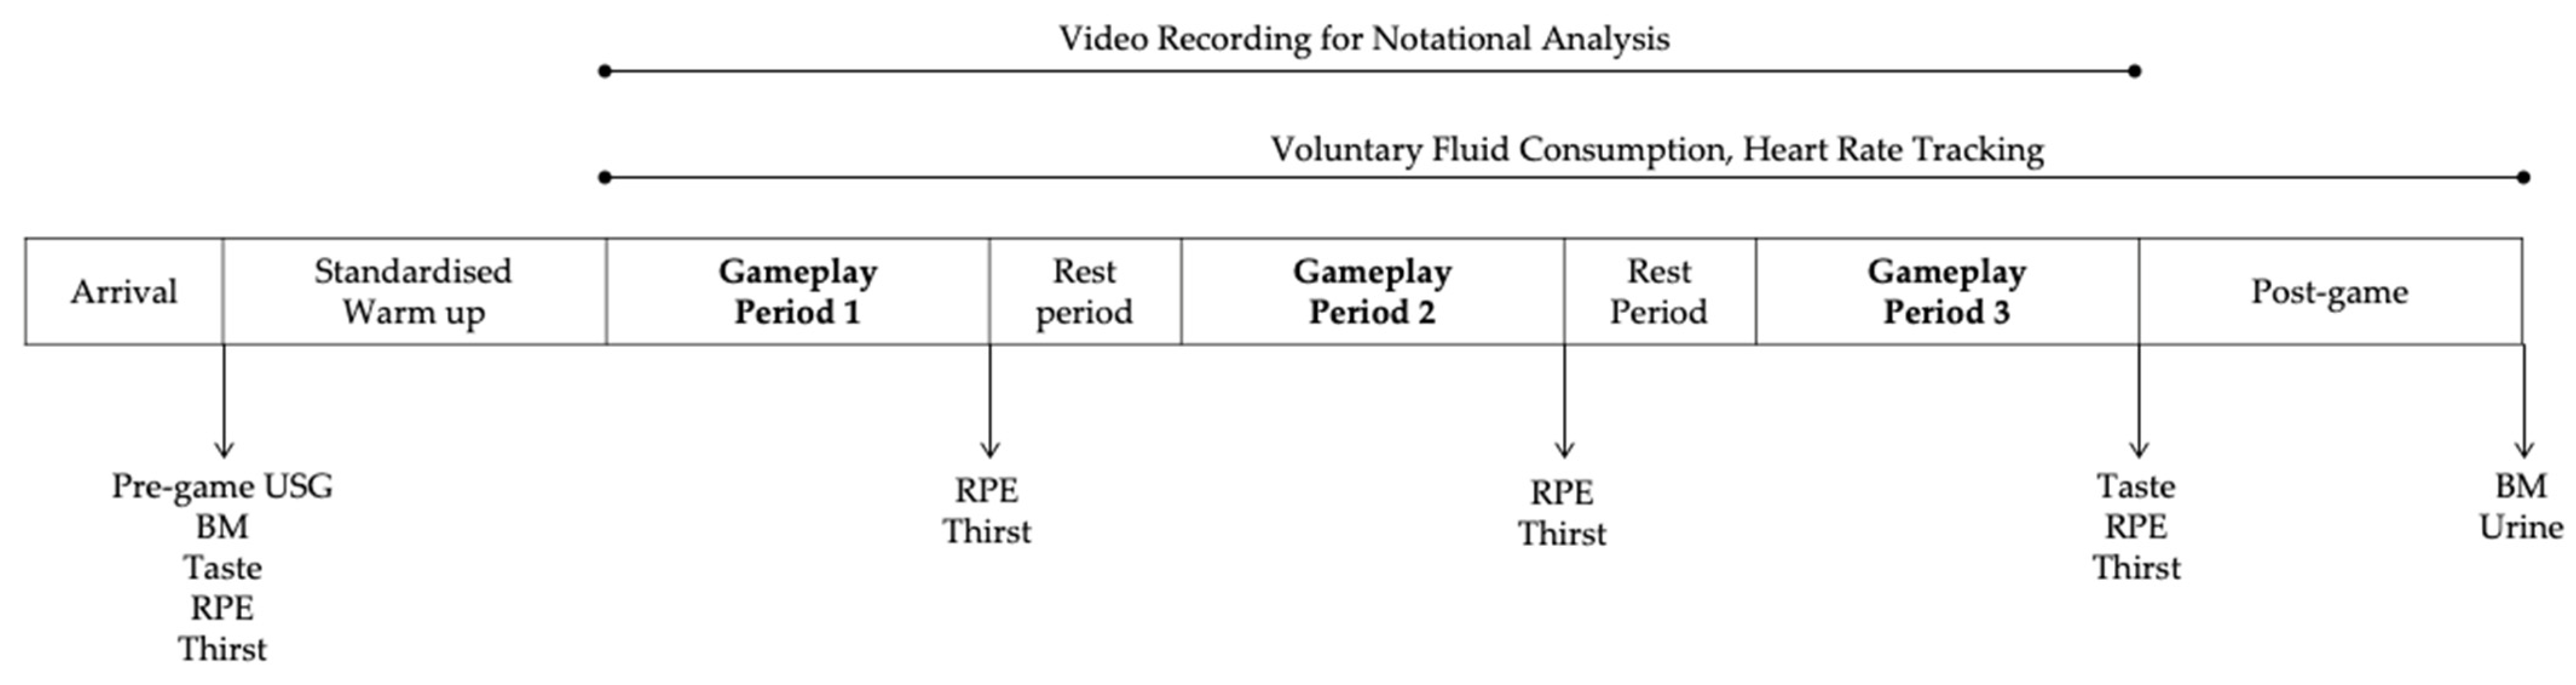
2.3. Procedure
2.3.1. Environmental Conditions
2.3.2. 3 × 3 Small-Sided Basketball Game
2.3.3. Fluid Palatability
Fluid Provision
Palatability Ratings
2.3.4. Fluid Balance
Hydration Status
Fluid Consumption
Sweat Rate
2.3.5. Subjective Measures
Ratings of Perceived Exertion
Thirst
2.3.6. Performance
Heart Rate Tracking
Notational Analysis
2.4. Statistical Analysis
3. Results
4. Discussion
5. Limitations
6. Conclusions
Author Contributions
Funding
Institutional Review Board Statement
Informed Consent Statement
Data Availability Statement
Acknowledgments
Conflicts of Interest
References
- McDermott, B.P.; Anderson, S.A.; Armstrong, L.E.; Casa, D.J.; Cheuvront, S.N.; Cooper, L.; Larry Kenney, W.; O’Connor, F.G.; Roberts, W.O. National athletic trainers’ association position statement: Fluid replacement for the physically active. J. Athl. Train. 2017, 52, 877–895. [Google Scholar] [CrossRef] [PubMed] [Green Version]
- Adams, W.M.; Ferraro, E.M.; Huggins, R.A.; Casa, D.J. Influence of body mass loss on changes in heart rate during exercise in the heat: A systematic review. J. Strength Cond. Res. 2014, 28, 2380–2389. [Google Scholar] [CrossRef] [PubMed]
- Belval, L.N.; Hosokawa, Y.; Casa, D.J.; Adams, W.M.; Armstrong, L.E.; Baker, L.B.; Burke, L.; Cheuvront, S.; Chiampas, G.; González-Alonso, J.; et al. Practical Hydration Solutions for Sports. Nutrients 2019, 11, 1550. [Google Scholar] [CrossRef] [Green Version]
- Davis, J.K.; Baker, L.B.; Barnes, K.; Ungaro, C.; Stofan, J. Thermoregulation, Fluid Balance, and Sweat Losses in American Football Players. Sports Med. 2016, 46, 1391–1405. [Google Scholar] [CrossRef] [PubMed]
- Nuccio, R.P.; Barnes, K.A.; Carter, J.M.; Baker, L.B. Fluid balance in team sport athletes and the effect of hypohydration on cognitive, technical, and physical performance. Sports Med. 2017, 47, 1951–1982. [Google Scholar] [CrossRef] [PubMed] [Green Version]
- Marriott, B.M.; Carlson, S.J. (Eds.) Institute of Medicine (US) Committee on Military Nutrition Research. In Fluid Replacement and Heat Stress; National Academies Press: Washington, DC, USA, 1994. [Google Scholar]
- Yeomans, M.R. Taste, palatability and the control of appetite. Proc. Nutr. Soc. 1998, 57, 609–615. [Google Scholar] [CrossRef] [Green Version]
- Burdon, C.A.; Johnson, N.A.; Chapman, P.G.; O’Connor, H.T. Influence of beverage temperature on palatability and fluid ingestion during endurance exercise: A systematic review. Int. J. Sport Nutr. Exerc. Metab. 2012, 22, 199–211. [Google Scholar] [CrossRef] [Green Version]
- Burke, L.M. Fluid balance during team sports. J. Sports Sci. 1997, 15, 287–295. [Google Scholar] [CrossRef]
- Minehan, M.R.; Riley, M.D.; Burke, L.M. Effect of flavor and awareness of kilojoule content of drinks on preference and fluid balance in team sports. Int. J. Sport Nutr. 2002, 12, 81–92. [Google Scholar] [CrossRef]
- Wilk, B.; Bar-Or, O. Effect of drink flavor and NaCl on voluntary drinking and hydration in boys exercising in the heat. J. Appl. Physiol. 1996, 80, 1112–1117. [Google Scholar] [CrossRef]
- Rivera-Brown, A.M.; Gutiérrez, R.; Gutiérrez, J.C.; Frontera, W.R.; Bar-Or, O. Drink composition, voluntary drinking, and fluid balance in exercising, trained, heat-acclimatized boys. J. Appl. Physiol. 1999, 86, 78–84. [Google Scholar] [CrossRef]
- Frank, G.K.W.; Oberndorfer, T.A.; Simmons, A.N.; Paulus, M.P.; Fudge, J.L.; Yang, T.T.; Kaye, W.H. Sucrose activates human taste pathways differently from artificial sweetener. NeuroImage 2008, 39, 1559–1569. [Google Scholar] [CrossRef]
- Popkin, B.M.; D’Anci, K.E.; Rosenberg, I.H. Water, hydration, and health. Nutr. Rev. 2010, 68, 439–458. [Google Scholar] [CrossRef]
- Rivera-Brown, A.M.; Ramírez-Marrero, F.A.; Wilk, B.; Bar-Or, O. Voluntary drinking and hydration in trained, heat-acclimatized girls exercising in a hot and humid climate. Eur. J. Appl. Physiol. 2008, 103, 109–116. [Google Scholar] [CrossRef]
- Wilk, B.; Timmons, B.W.; Bar-Or, O. Voluntary fluid intake, hydration status, and aerobic performance of adolescent athletes in the heat. Appl. Physiol. Nutr. Metab. 2010, 35, 834–841. [Google Scholar] [CrossRef]
- Wilk, B.; Rivera-Brown, A.M.; Bar-Or, O. Voluntary drinking and hydration in non-acclimatized girls exercising in the heat. Eur. J. Appl. Physiol. 2007, 101, 727–734. [Google Scholar] [CrossRef]
- Bourdas, D.I.; Zacharakis, E.D.; Travlos, A.K.; Souglis, A. Return to Basketball Play Following COVID-19 Lockdown. Sports 2021, 9, 81. [Google Scholar] [CrossRef]
- Randers, M.B.; Knudsen, N.S.; Thomasen, M.M.D.; Panduro, J.; Larsen, M.N.; Mohr, M.; Milanovic, Z.; Krustrup, P.; Andersen, T.B. Danger zone assessment in small-sided recreational football: Providing data for consideration in relation to COVID-19 transmission. BMJ Open Sport Exerc. Med. 2021, 7, e000911. [Google Scholar] [CrossRef] [PubMed]
- Erčulj, F.; Vidic, M.; Leskošek, B. Shooting efficiency and structure of shooting in 3 × 3 basketball compared to 5v5 basketball. Int. J. Sports Sci. Coach. 2020, 15, 91–98. [Google Scholar] [CrossRef]
- Cheuvront, S.N.; Ely, B.R.; Kenefick, R.W.; Sawka, M.N. Biological variation and diagnostic accuracy of dehydration assessment markers. Am. J. Clin. Nutr. 2010, 92, 565–573. [Google Scholar] [CrossRef] [PubMed] [Green Version]
- Hamouti, N.; Del Coso, J.; Estevez, E.; Mora-Rodriguez, R. Dehydration and sodium deficit during indoor practice in elite european male team players. Eur. J. Sport Sci. 2010, 10, 329–336. [Google Scholar] [CrossRef]
- Vaquera, A.; Suárez-Iglesias, D.; Guiu, X.; Barroso, R.; Thomas, G.; Renfree, A. Physiological Responses to and Athlete and Coach Perceptions of Exertion during Small-Sided Basketball Games. J. Strength Cond. Res. 2018, 32, 2949–2953. [Google Scholar] [CrossRef]
- Sampaio, J.; Abrantes, C.; Leite, N. Power, heart rate and perceived exertion responses to 3 × 3 and 4 × 4 basketball small-sided games. Rev. Psicol. Deporte 2009, 18, 0463–0467. [Google Scholar]
- Atli, H.; Köklü, Y.; Alemdaroğlu, U.; Koçak, F.Ü. A comparison of heart rate response and frequencies of technical actions between half-court and full-court 3-a-side games in high school female basketball players. J. Strength Cond. Res. 2013, 27, 352–356. [Google Scholar] [CrossRef] [PubMed]
- Klusemann, M.J.; Pyne, D.B.; Foster, C.; Drinkwater, E.J. Optimising technical skills and physical loading in small-sided basketball games. J. Sports Sci. 2012, 30, 1463–1471. [Google Scholar] [CrossRef] [PubMed]
- Ha, M.-S.; Ha, S.-D.; Choi, S.-H.; Bae, D.-H. Assessment of exposure of Korean consumers to acesulfame K and sucralose using a stepwise approach. Int. J. Food Sci. Nutr. 2013, 64, 715–723. [Google Scholar] [CrossRef] [PubMed]
- Meyer, F.; Bar-Or, O.; Salsberg, A.; Passe, D. Hypohydration during exercise in children: Effect on thirst, drink preferences, and rehydration. Int. J. Sport Nutr. 1994, 4, 22–35. [Google Scholar] [CrossRef]
- Peryam, D.R.; Pilgrim, F.J. Hedonic scale method of measuring food preferences. Food Technol. 1957, 11, 9–14. [Google Scholar]
- Hamouti, N.; Del Coso, J.; Ávila, A.; Mora-Rodriguez, R. Effects of athletes’ muscle mass on urinary markers of hydration status. Eur. J. Appl. Physiol. 2010, 109, 213–219. [Google Scholar] [CrossRef]
- Maughan, R.J.; Shirreffs, S.M. Development of hydration strategies to optimize performance for athletes in high-intensity sports and in sports with repeated intense efforts. Scand. J. Med. Sci. Sports 2010, 20, 59–69. [Google Scholar] [CrossRef]
- Foster, C.; Florhaug, J.A.; Franklin, J.; Gottschall, L.; Hrovatin, L.A.; Parker, S.; Doleshal, P.; Dodge, C. A new approach to monitoring exercise training. J. Strength Cond. Res. 2001, 15, 109. [Google Scholar] [CrossRef] [PubMed]
- Maresh, C.M.; Gabaree-Boulant, C.L.; Armstrong, L.E.; Judelson, D.A.; Hoffman, J.R.; Castellani, J.W.; Kenefick, R.W.; Bergeron, M.F.; Casa, D.J. Effect of hydration status on thirst, drinking, and related hormonal responses during low-intensity exercise in the heat. J. Appl. Physiol. 2004, 97, 39–44. [Google Scholar] [CrossRef] [Green Version]
- García, J.; Ibáñez, S.J.; De Santos, R.M.; Leite, N.; Sampaio, J. Identifying basketball performance indicators in regular season and playoff games. J. Hum. Kinet. 2013, 36, 161–168. [Google Scholar] [CrossRef]
- Cohen, J. Statistical Power Analysis for the Behavioral Sciences, 2nd ed.; Hillsdale, N.J., Ed.; Lawrence Erlbaum Associates: Hillsdale, NJ, USA, 1988. [Google Scholar]
- Hopkins, W.G. Magnitude-Based decisions as hypothesis tests. Sportscience 2020, 24, 1–20. [Google Scholar]
- Hopkins, W.G.; Marshall, S.W.; Batterham, A.M.; Hanin, J. Progressive statistics for studies in sports medicine and exercise science. Med. Sci. Sports Exerc. 2009, 41, 3. [Google Scholar] [CrossRef] [Green Version]
- Deming, N.J.; Carr, K.W.; Anna, J.L.; Dupre, B.R.; Smith, M.E.; Dinenno, F.A.; Richards, J.C. Self-selected fluid volume and flavor strength does not alter fluid intake, body mass loss, or physiological strain during moderate-intensity exercise in the heat. J. Therm. Biol. 2020, 89, 102575. [Google Scholar] [CrossRef] [PubMed]
- Szlyk, P.C.; Sils, I.V.; Francesconi, R.P.; Hubbard, R.W.; Armstrong, L.E. Effects of water temperature and flavoring on voluntary dehydration in men. Physiol. Behav. 1989, 45, 639–647. [Google Scholar] [CrossRef]
- Stachenfeld, N.S. Acute Effects of Sodium Ingestion on Thirst and Cardiovascular Function. Bone 2008, 7 (Suppl. 4), S7–S13. [Google Scholar] [CrossRef] [Green Version]
- Silva, R.P.; Mündel, T.; Natali, A.J.; Filho, M.G.B.; Lima, J.R.P.; Alfenas, R.C.G.; Lopes, P.R.N.R.; Belfort, F.G.; Marins, J.C.B. Fluid balance of elite Brazilian youth soccer players during consecutive days of training. J. Sports Sci. 2011, 29, 725–732. [Google Scholar] [CrossRef]
- Owen, A.L.; Forsyth, J.J.; Wong, D.P.; Dellal, A.; Connelly, S.P.; Chamari, K. Heart Rate–Based Training Intensity and Its Impact on Injury Incidence among Elite-Level Professional Soccer Players. J. Strength Cond. Res. 2015, 29, 1705–1712. [Google Scholar] [CrossRef]
- Schelling, X.; Torres-Ronda, L. Conditioning for Basketball: Quality and Quantity of Training. Strength Cond. J. 2013, 35, 89–94. [Google Scholar] [CrossRef]
- Halouani, J.; Chtourou, H.; Gabbett, T.; Chaouachi, A.; Chamari, K. Small-Sided Games in Team Sports Training: A Brief Review. J. Strength Cond. Res. 2014, 28, 3594–3618. [Google Scholar] [CrossRef] [PubMed]
- Agorastos, G. Review of mouthfeel classification. A new perspective of food perception. J. Food Sci. Nutr. 2020, JFSN-107. [Google Scholar] [CrossRef]
- Catani, S.; Liao, S.; Loades, M. Methods and Compositions to Improve Mouth Feel. US Patent 225,614, 13 September 2005. (withdrawn). [Google Scholar]
- Spencer, M.; Gupta, A.; Van Dam, L.; Shannon, C.; Menees, S.; Chey, W.D. Artificial Sweeteners: A Systematic Review and Primer for Gastroenterologists. J. Neurogastroenterol. Motil. 2016, 22, 168–180. [Google Scholar] [CrossRef] [PubMed] [Green Version]
- Ndofirepi, T.M.; Mamsa, N.; Rambe, P. Explaining the Market Acceptance of Artificial Sweeteners in a Developing Country: Evidence from Female Young Adults in Zimbabwe. J. Food Prod. Mark. 2020, 26, 225–245. [Google Scholar] [CrossRef]


| Demographic Data 1 | USG Values | Pre-Game Hydration Classification 2 | ||||||
|---|---|---|---|---|---|---|---|---|
| Conventional USG Threshold 3 | Secondary USG Threshold 4 | |||||||
| N | Age (years) | Mass (kg) | Pre-Game USG | Euhydrated (≤1.020) | Hypohydrated (>1.020) | Euhydrated (≤1.025) | Hypohydrated (>1.025) | |
| FW | 9 | 23.4 (1.4) | 76.4 (9.0) | 1.021 (0.007) | 3 (33.3) | 6 (66.7) | 6 (66.7) | 3 (33.3) |
| W | 9 | 22.8 (1.2) | 76.6 (15.1) | 1.016 (0.009) | 5 (55.6) | 4 (44.4) | 8 (88.9) | 1 (11.1) |
| Overall | 18 | 23.1 (1.3) | 76.5 (12.1) | 1.018 (0.008) | 8 (44.4) | 10 (55.6) | 14 (77.8) | 4 (22.2) |
| Mean (SD) | Mean Difference (95% CI) | p Value | Effect Size (95% CI) | MBD | |||
|---|---|---|---|---|---|---|---|
| FW | W | ||||||
| Palatability Ratings | Hedonic Rating | 6.78 (0.83) | 5.56 (1.33) | 1.22 (0.11 to 2.33) | 0.033 | 1.10 (0.01 to 2.14) | |
| Sweetness | 4.44 (1.42) | 2.00 (1.50) | 2.44 (0.98 to 3.91) | 0.003 | 1.67 (0.418 to 2.87) | ||
| Saltiness | 3.89 (0.78) | 2.11 (1.45) | 1.78 (0.61 to 2.94) | 0.007 | 1.52 (0.32 to 2.68) | ||
| Sourness | 4.33 (1.32) | 2.22 (1.39) | 2.11 (0.75 to 3.47) | 0.005 | 1.55 (0.34 to 2.71) | ||
| Hydration Status | Fluid Consumption (mL) | 1083 (326) | 1421 (403) | −338 (−705 to 28.6) | 0.068 | −0.92 * (−1.92 to 0.13) | Likely; Moderate |
| Sweat Rate (mL/h) | 865 (117) | 874 (165) | −9.06 (−152 to 134) | 0.895 | −0.06 (−0.99 to 0.86) | ||
| Change in BM (%) | −0.93 (0.52) | −0.53 (0.37) | −0.40 (−0.85 to 0.05) | 0.077 | −0.89 * (−1.89 to 0.15) | Likely; Moderate | |
| Mean (SD) | Mean Difference (95% CI) | p Value | Effect Size (95% CI) | |||
|---|---|---|---|---|---|---|
| FW | W | |||||
| Physiological Measures | RPE | 5.78 (1.56) | 6.56 (1.88) | −0.78 (−2.50 to 0.95) | 0.354 | −0.45 (−1.39 to 0.51) |
| Average heart rate (bpm) | 172 (12) | 179 (14) | −7 (−19 to 6) | 0.289 | −0.52 (−1.46 to 0.46) | |
| Basketball Performance | 2P% | 49.20 (12.00) | 51.89 (7.75) | −2.64 (−12.77 to 7.48) | 0.587 | −0.26 (−1.19 to 0.68) |
| 3P% | 17.67 (16.73) | 9.79 (18.66) | 7.88 (−9.83 to 25.58) | 0.360 | 0.44 (−0.15 to 1.38) | |
| AST | 6.11 (3.26) | 6.78 (3.07) | −0.67 (−3.83 to 2.50) | 0.661 | −0.47 (−1.41 to 0.49) | |
| DR | 7.00 (4.06) | 7.67 (3.64) | −0.67 (−4.52 to 3.19) | 0.719 | −0.03 (−0.95 to 0.89) | |
Publisher’s Note: MDPI stays neutral with regard to jurisdictional claims in published maps and institutional affiliations. |
© 2021 by the authors. Licensee MDPI, Basel, Switzerland. This article is an open access article distributed under the terms and conditions of the Creative Commons Attribution (CC BY) license (https://creativecommons.org/licenses/by/4.0/).
Share and Cite
Taim, B.C.; Suppiah, H.T.; Wee, J.; Lee, M.; Lee, J.K.W.; Chia, M. Palatable Flavoured Fluids without Carbohydrates and Electrolytes Do Not Enhance Voluntary Fluid Consumption in Male Collegiate Basketball Players in the Heat. Nutrients 2021, 13, 4197. https://0-doi-org.brum.beds.ac.uk/10.3390/nu13124197
Taim BC, Suppiah HT, Wee J, Lee M, Lee JKW, Chia M. Palatable Flavoured Fluids without Carbohydrates and Electrolytes Do Not Enhance Voluntary Fluid Consumption in Male Collegiate Basketball Players in the Heat. Nutrients. 2021; 13(12):4197. https://0-doi-org.brum.beds.ac.uk/10.3390/nu13124197
Chicago/Turabian StyleTaim, Bernadette Cherianne, Haresh T. Suppiah, Jericho Wee, Marcus Lee, Jason K. W. Lee, and Michael Chia. 2021. "Palatable Flavoured Fluids without Carbohydrates and Electrolytes Do Not Enhance Voluntary Fluid Consumption in Male Collegiate Basketball Players in the Heat" Nutrients 13, no. 12: 4197. https://0-doi-org.brum.beds.ac.uk/10.3390/nu13124197