
Effectiveness of Workplace-Based Diet and Lifestyle Interventions on Risk Factors in Workers with Metabolic Syndrome: A Systematic Review, Meta-Analysis and Meta-Regression


 ,
,
Abstract
:1. Introduction
2. Materials and Methods
2.1. Design
2.2. Source of Data
2.3. Search Strategy
- Population: adult workers aged 18 years or older.
- Intervention: dietary interventions aimed at improving MetS risk factors in workers. To ensure we recovered all the relevant information, given that interventions could include several components, we performed an open search for MetS interventions and then manually selected only those that focused on nutrition, discarding those centred exclusively on other aspects, such as physical activity, stress or sleep.
- Outcome: clinical impact of the interventions in terms of improvement in MetS risk factors and other aspects related to occupational health.
2.3.1. Term 1: Metabolic Syndrome
2.3.2. Term 2: Occupational Health
2.4. Final Selection of Articles
2.5. Data Extraction
Study Variables for Each Article
- Author: first author.
- Year: year of publication.
- Design: procedures, methods and techniques. We only accepted clinical trials and comparative studies.
- Country/MetS criteria: country where the intervention took place and diagnostic classification of MetS.
- Worker profile and work environment: place of work and characteristics of the adult workers who received the intervention.
- Type of intervention: description and characteristics of the dietary intervention.
- Effect: causal relationship derived from the results. We recorded the clinical and anthropometric results derived from the interventions, as well as other outcomes of interest related to improvement of MetS and/or occupational health parameters.
2.6. Quality of Reporting of the Selected Documents
2.7. Obsolescence
2.8. Meta-Analysis and Meta-Regression
3. Results
3.1. Systematic Review
3.1.1. Dietary Interventions
3.1.2. Basic Education and General Counselling on Healthy Habits and Diet
3.1.3. Specific Diet/Changes in Diet and Food Intake
3.1.4. Behavioural Changes or Motivational Coaching
3.1.5. Other Interventions: Physical Activity, Stress Management and Sleep Hygiene
3.1.6. Use of Internet and Social Networks
3.1.7. Results of Dietary Interventions
- Improvement in Anthropometric Measurements
- 2.
- Improvements in Lipid Profile
- 3.
- Changes in Blood Pressure Readings
- 4.
- Changes in Fasting Blood Glucose (FBG, mg/dL)
- 5.
- Improvements in Prevalence of MetS or in Number of Risk Factors for MetS
- 6.
- Health Beliefs, Health Promotion Behaviours and Self-Efficacy
- 7.
- Changes in Food Group or Diet/Nutrition Intake
- 8.
- Changes in Total Daily Physical Activity
3.2. Meta-Analysis
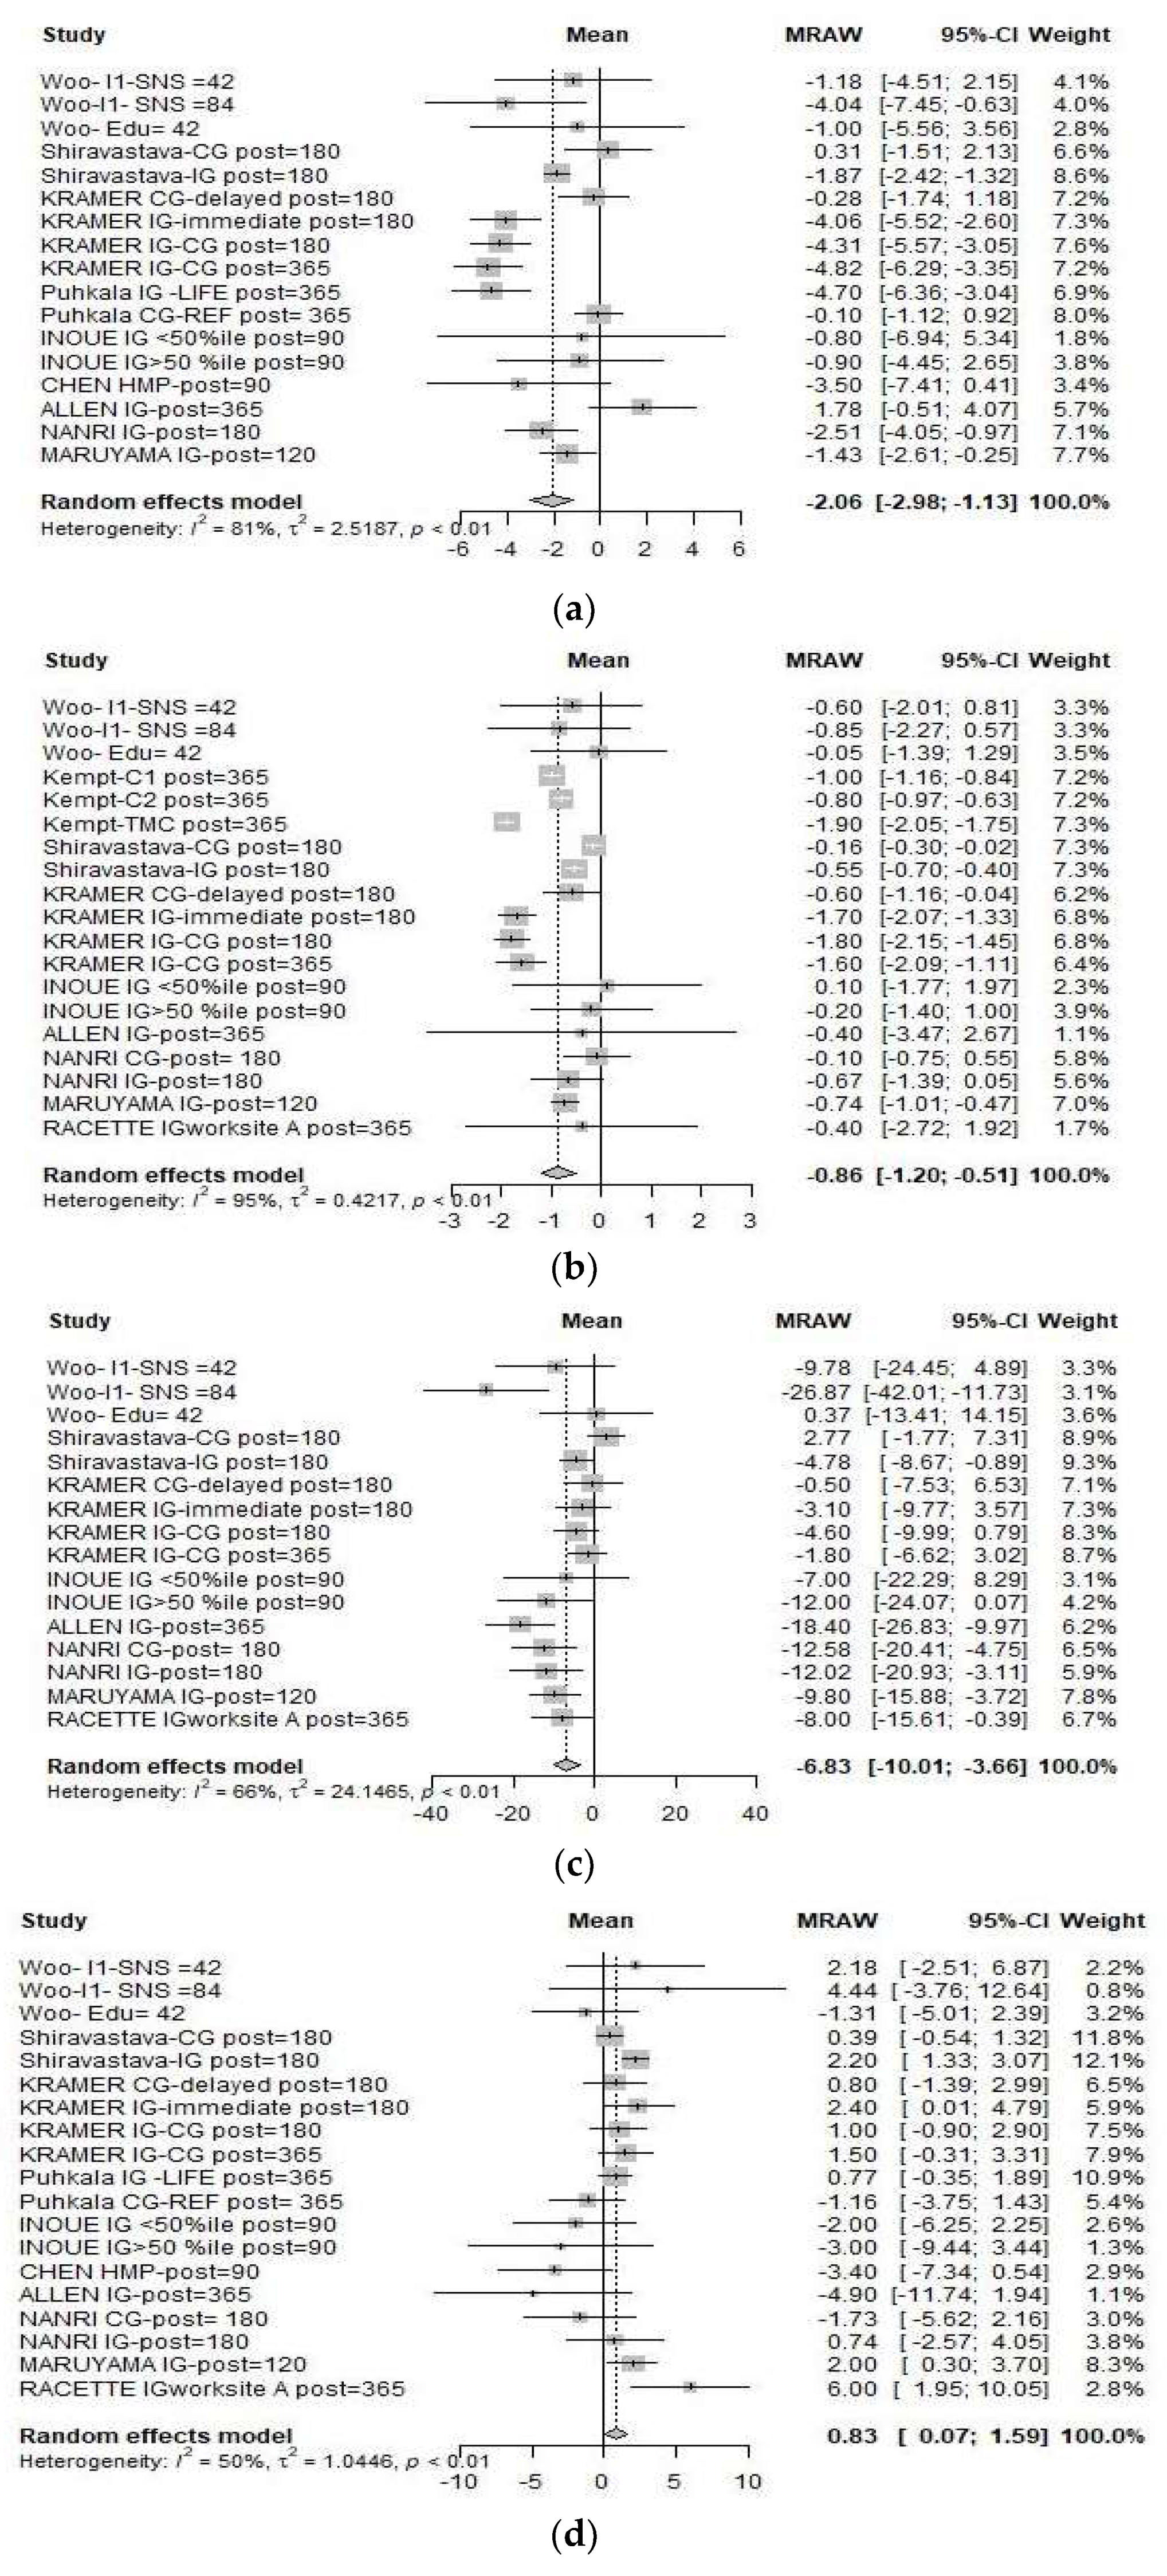
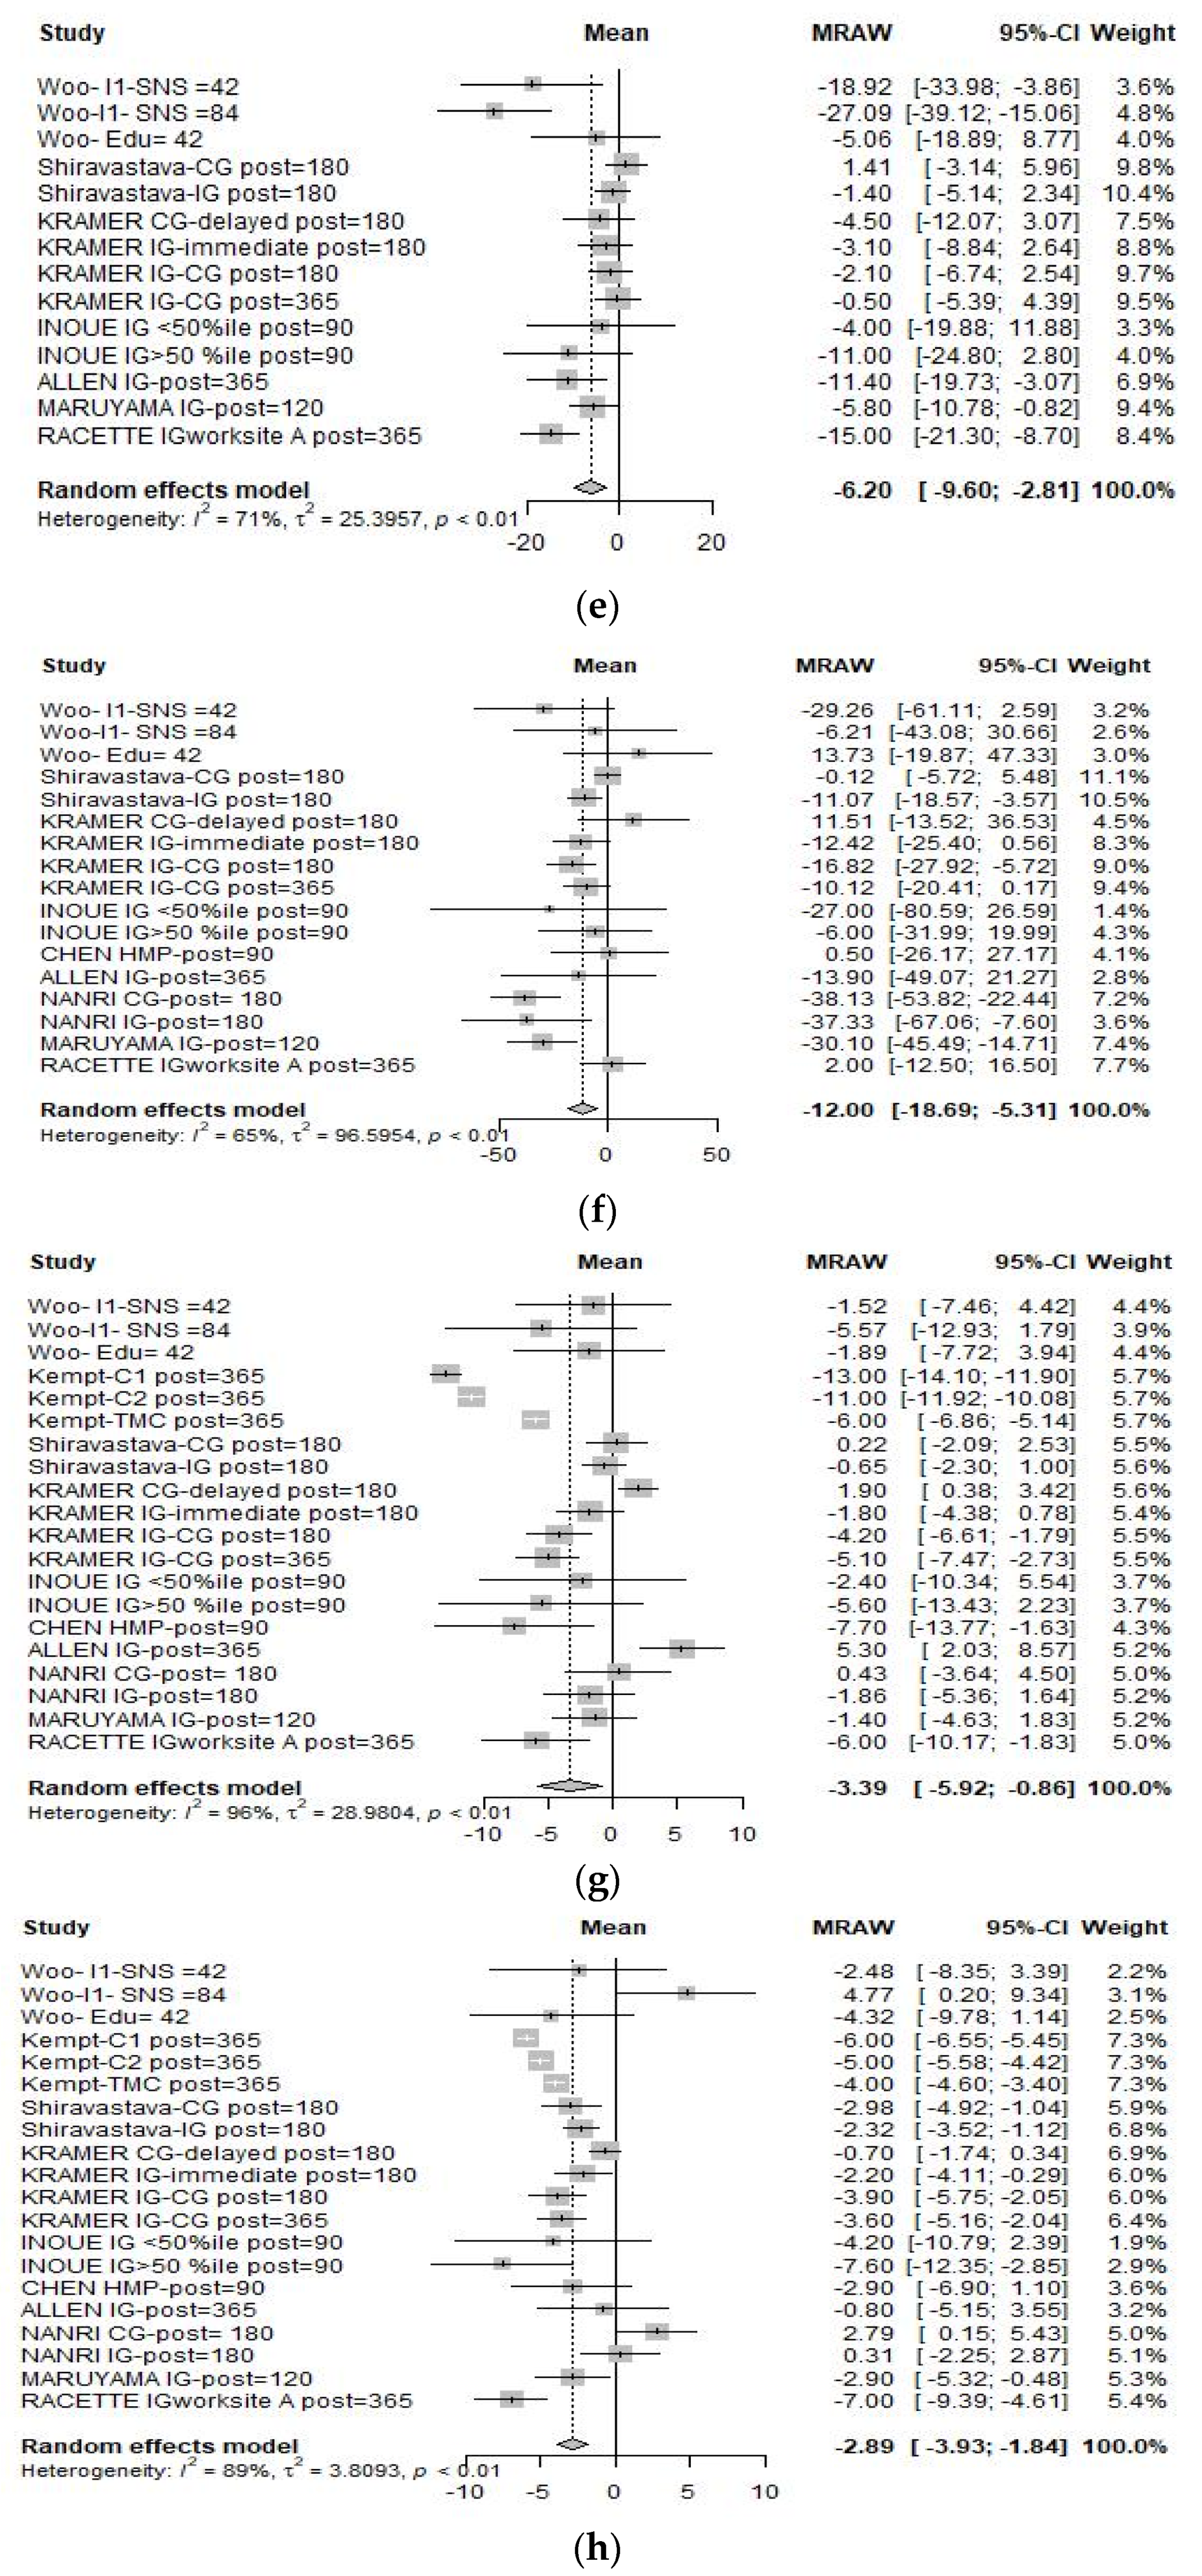
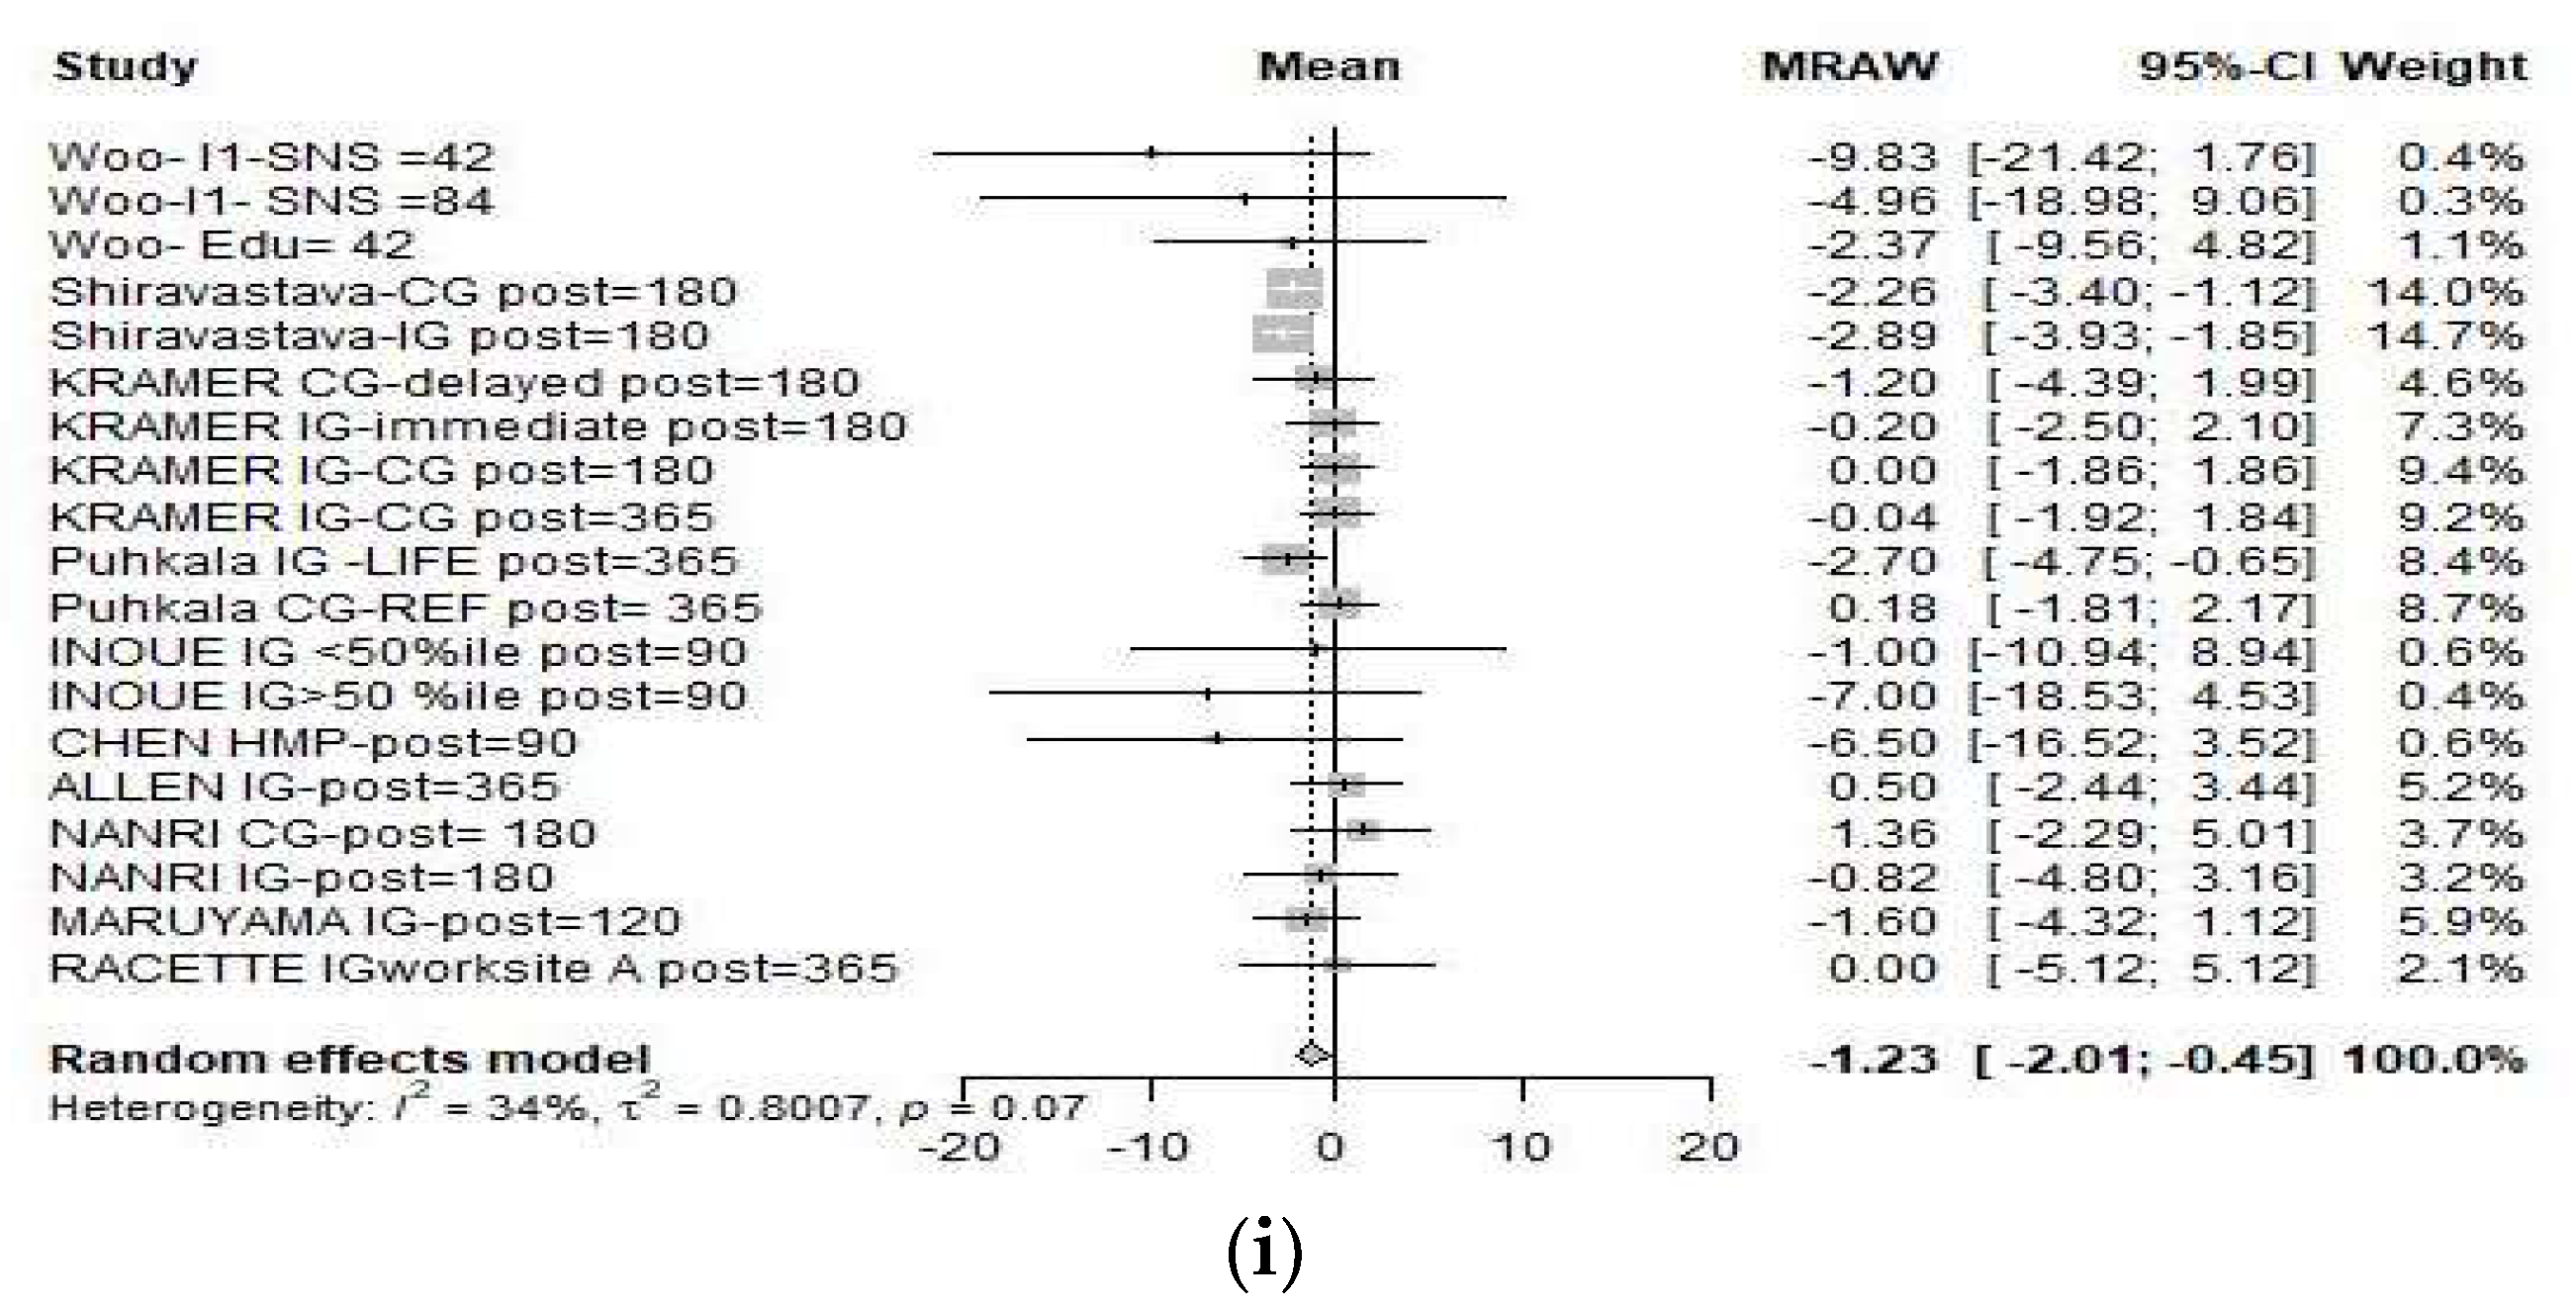
3.2.1. Effect Size
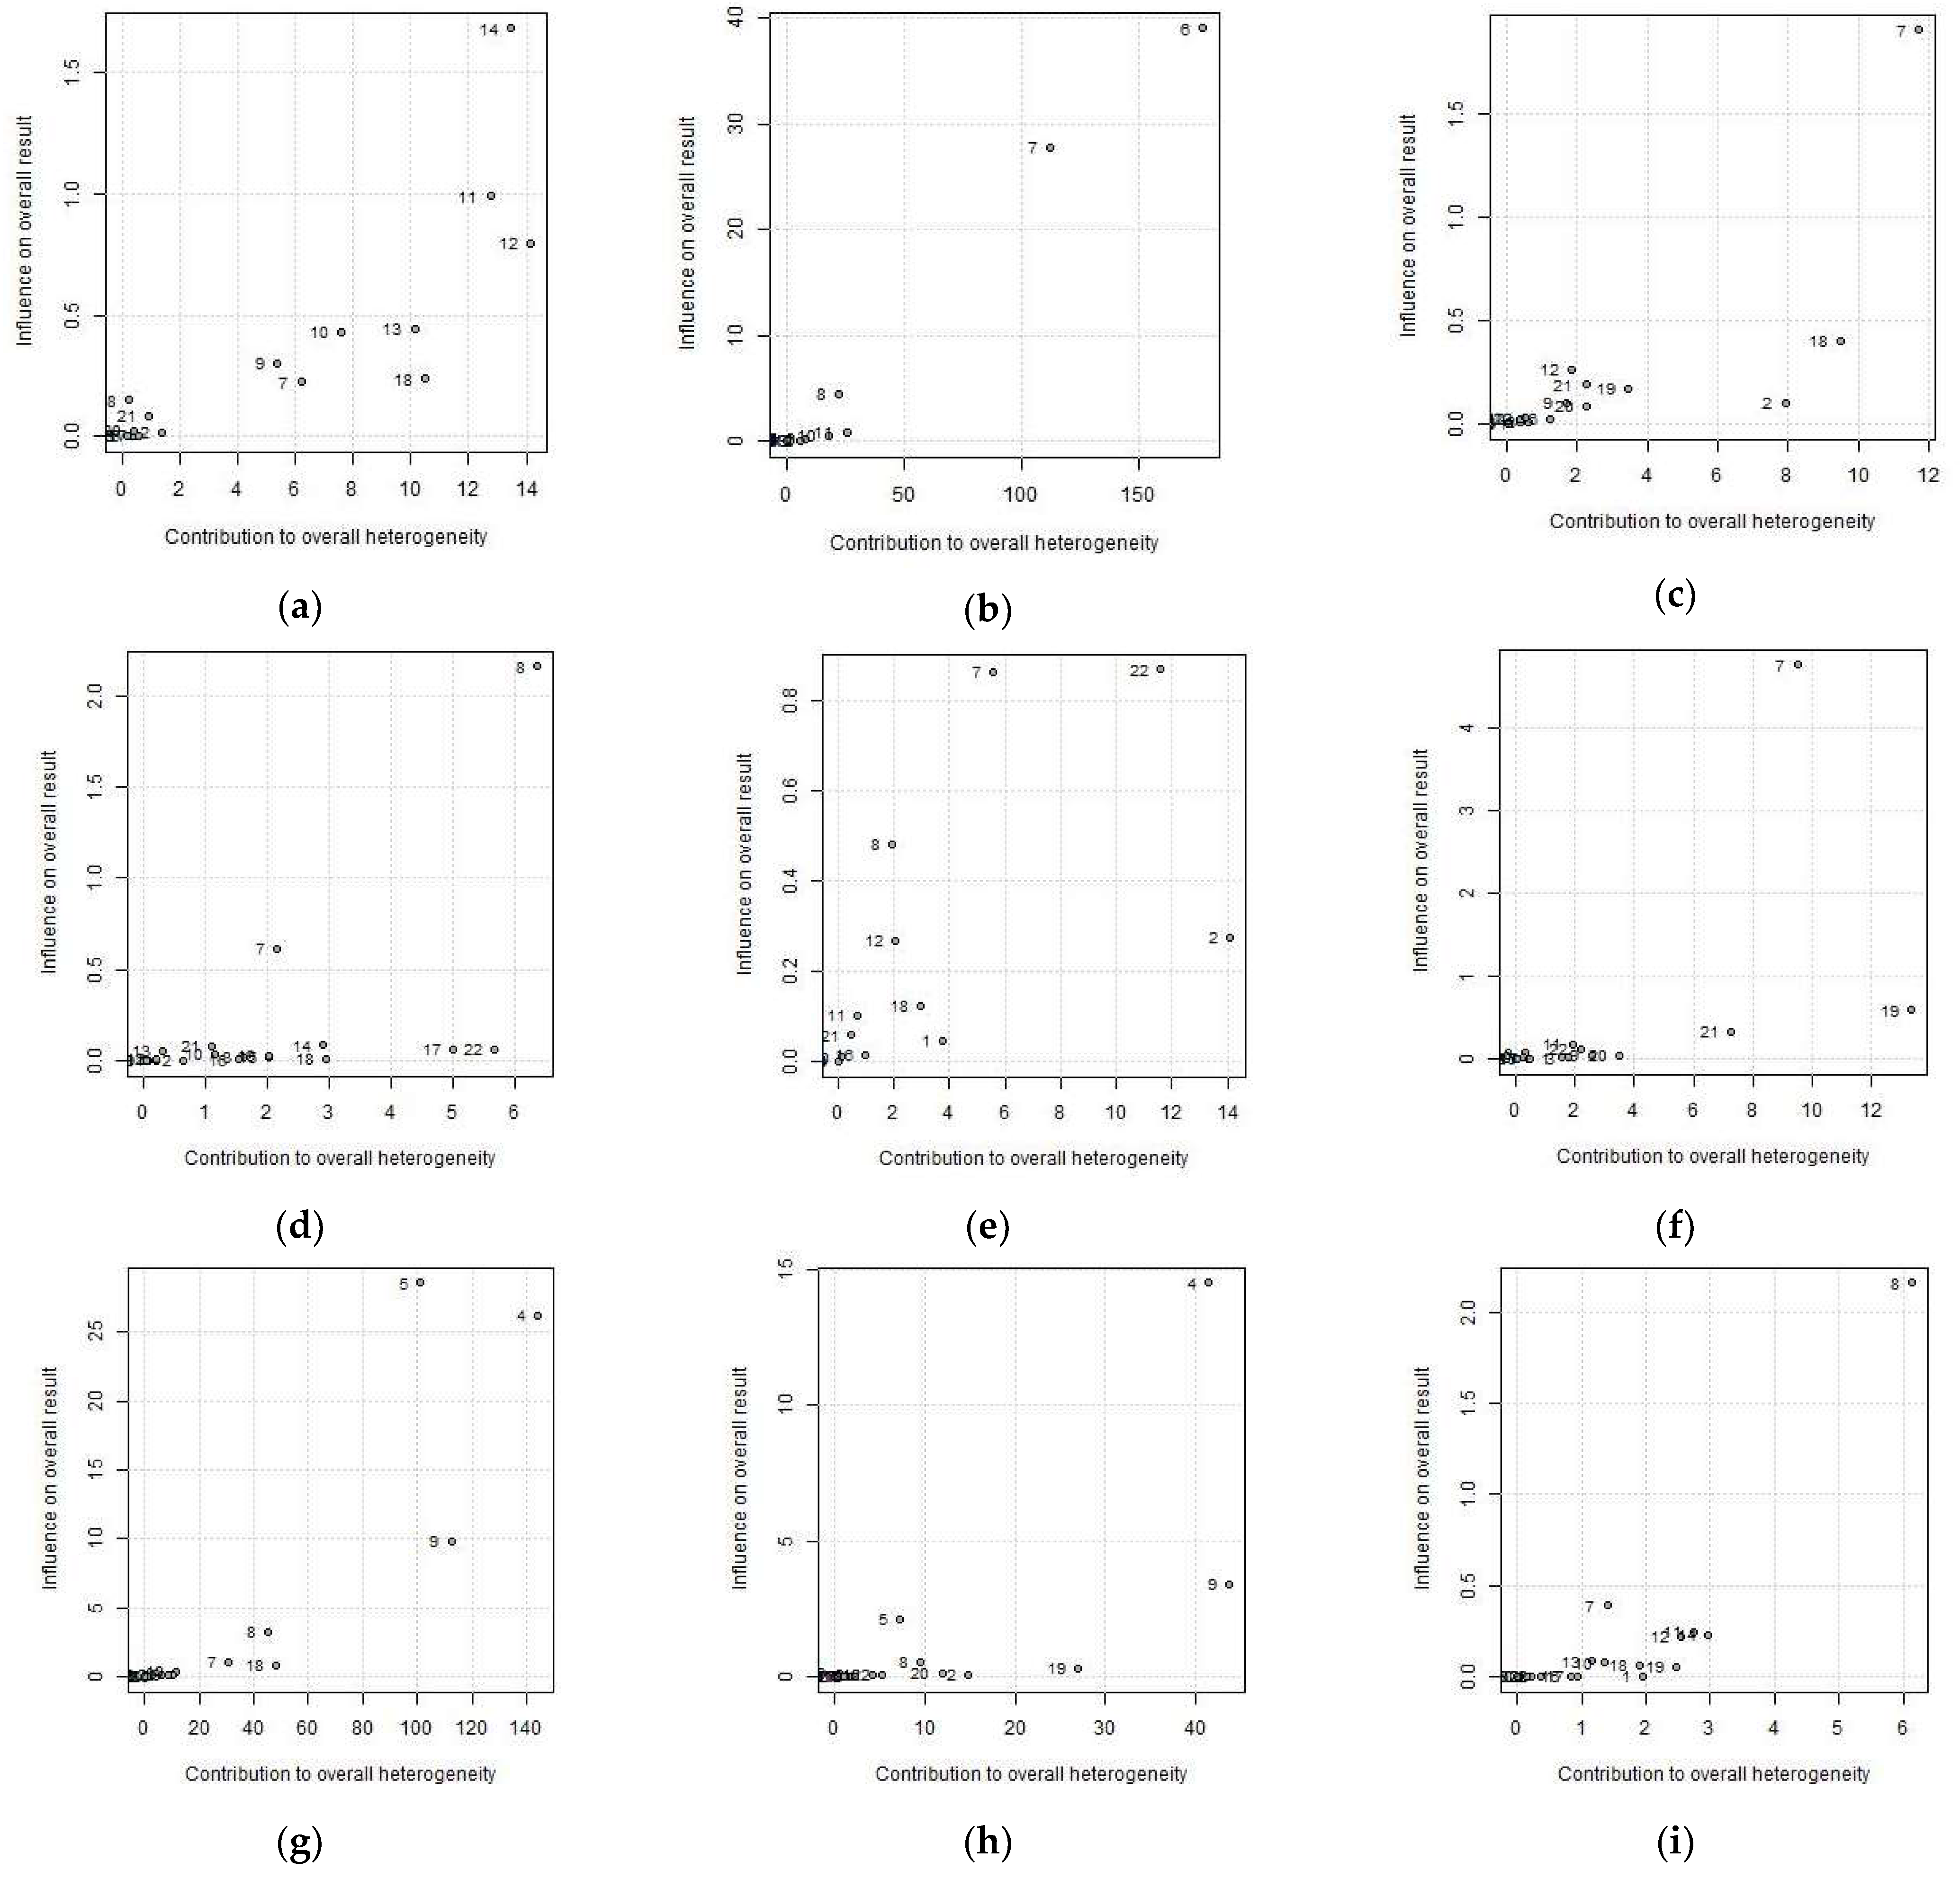
3.2.2. Heterogeneity of the Included Studies
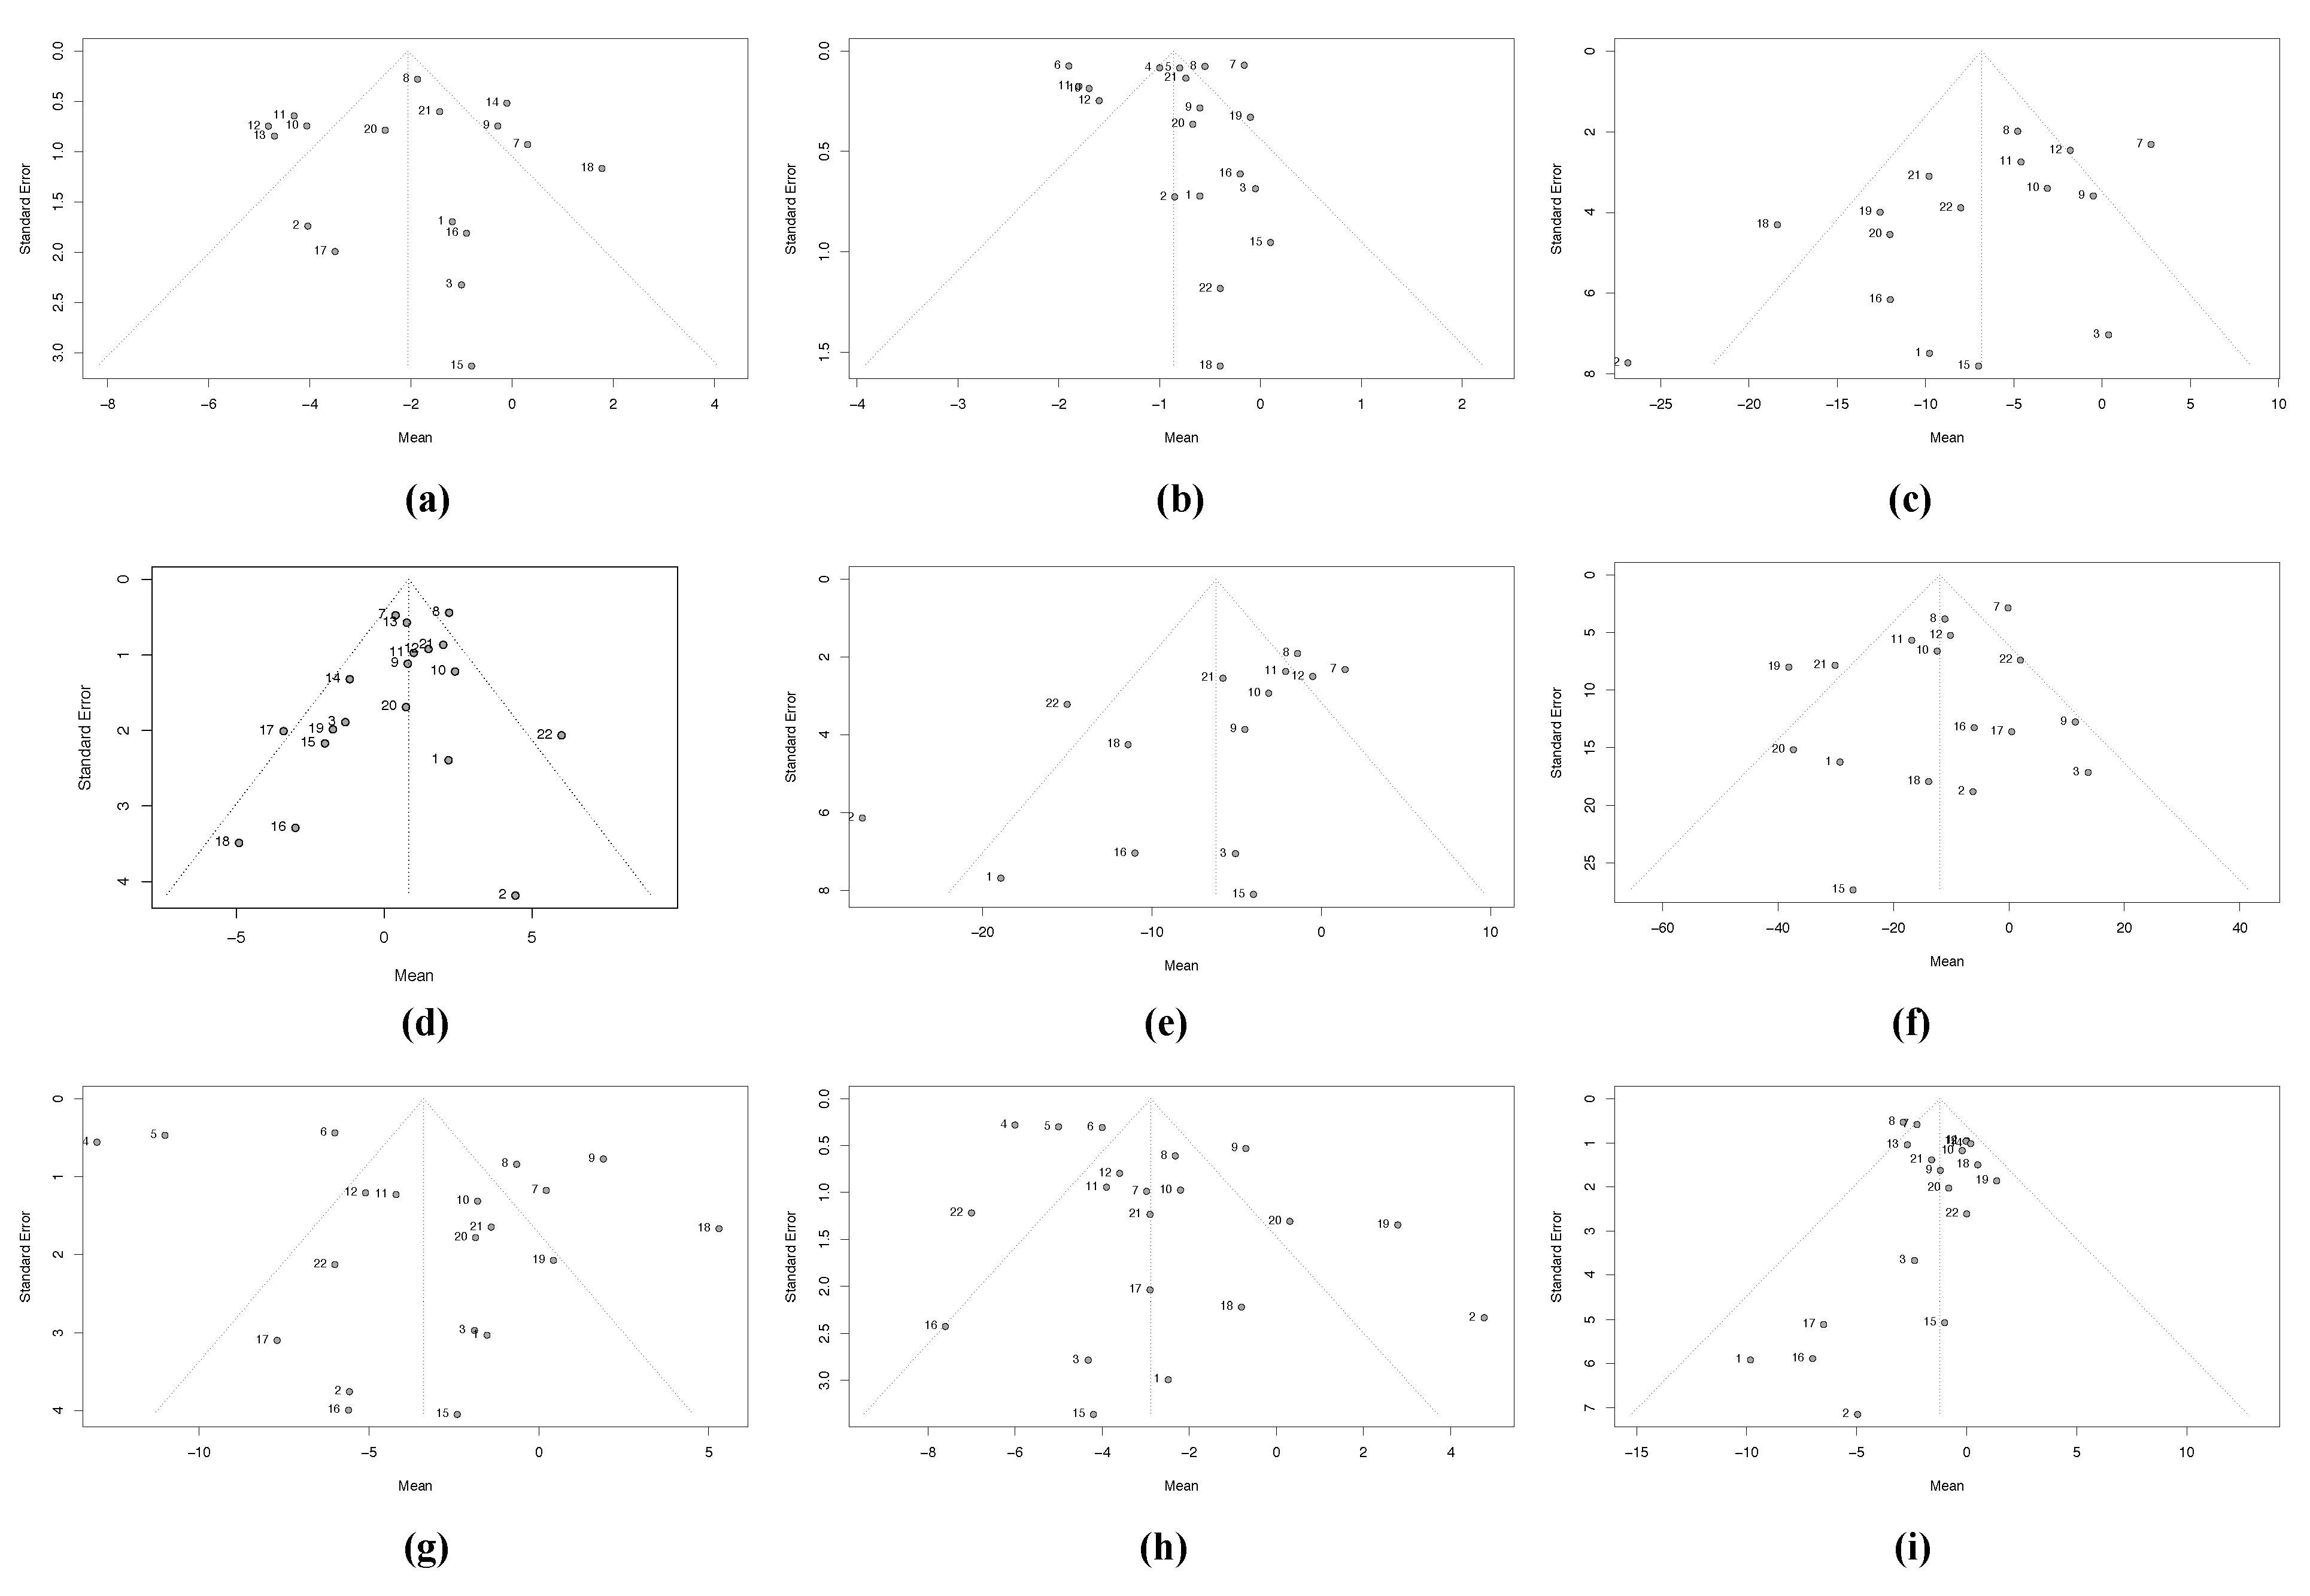
3.2.3. Heterogeneity Due to Missing Studies (Publication Bias)
3.2.4. Moderator Analysis or Meta-Regression
4. Discussion
5. Limitations of the Review
6. Implications for Future Research
7. Conclusions
Author Contributions
Funding
Conflicts of Interest
References
- Saklayen, M.G. The Global Epidemic of the Metabolic Syndrome. Curr. Hypertens. Rep. 2018, 20, 1–8. [Google Scholar] [CrossRef] [Green Version]
- Alberti, K.G.; Eckel, R.H.; Grundy, S.M.; Zimmet, P.Z.; Cleeman, J.I. International Diabetes Federation Task Force on Epidemiology and Prevention; National Heart, Lung, and BloodInstitute; American Heart Association; World Heart Federation; International Atherosclerosis Society; International Association for the Study of Obesity. Harmonizing the metabolic syndrome: A joint interimstatement. Circulation 2009, 120, 1640–1645. [Google Scholar] [PubMed] [Green Version]
- Mottillo, S.; Filion, K.B.; Genest, J.; Joseph, L.; Pilote, L.; Poirier, P.; Rinfret, S.; Schiffrin, E.L.; Eisenberg, M.J. Themetabolicsyndrome and cardiovascular risk: A systematic review and meta-analysis. J. Am. Coll. Cardiol. 2010, 28, 1113–1132. [Google Scholar] [CrossRef] [Green Version]
- Grundy, S.M. Metabolic syndrome update. Trends Cardiovasc. Med. 2016, 26, 364–373. [Google Scholar] [CrossRef]
- Van Namen, M.; Prendergast, L.; Peiris, C. Supervised lifestyle intervention for people with metabolic syndrome improves outcomes and reduces individual risk factors of metabolic syndrome: A systematic review and meta-analysis. Metabolism 2019, 101, 153988. [Google Scholar] [CrossRef] [PubMed] [Green Version]
- Saboya, P.P.; Bodanese, L.C.; Zimmermann, P.R.; Da Silva Gustavo, A.; Macagnan, F.E.; Feoli, A.P.; Da Silva Oliveira, M. Lifestyle Intervention on Metabolic Syndrome and its Impact on Quality of Life: A Randomized Controlled Trial. Arq. Bras. De Cardiol. 2017, 108, 60–69. [Google Scholar] [CrossRef]
- Clifton, P. Metabolic Syndrome—Role of Dietary Fat Type and Quantity. Nutrients 2019, 11, 1438. [Google Scholar] [CrossRef] [Green Version]
- Sun, K.; Ren, M.; Liu, D.; Wang, C.; Yan, L. Alcohol consumption and risk of metabolic syndrome: A meta-analysis of prospective studies. Clin. Nutr. 2014, 33, 596–602. [Google Scholar] [CrossRef]
- Malik, V.S.; Popkin, B.M.; Bray, G.A.; Després, J.-P.; Willett, W.C.; Hu, F.B. Sugar-Sweetened Beverages and Risk of Metabolic Syndrome and Type 2 Diabetes: A meta-analysis. Diabetes Care 2010, 33, 2477–2483. [Google Scholar] [CrossRef] [Green Version]
- Pérez-Martínez, P.; Mikhailidis, D.P.; Athyros, V.G.; Bullo, M.; Couture, P.; Covas, M.I.; de Koning, L.; Delgado-Lista, J.; Díaz-López, A.; Drevon, C.A.; et al. Lifestyle recommendations for the prevention and management of metabolic syndrome: An international panel recommendation. Nutr. Rev. 2017, 75, 307–326. [Google Scholar] [CrossRef] [PubMed] [Green Version]
- Burton, W.N.; Chen, C.-Y.; Schultz, A.B.; Edington, D.W. The Prevalence of Metabolic Syndrome in an Employed Population and the Impact on Health and Productivity. J. Occup. Environ. Med. 2008, 50, 1139–1148. [Google Scholar] [CrossRef]
- Schultz, A.B.; Edington, D.W. The association between changes in metabolic syndrome and changes in cost in a workplace pop-ulation. J. Occup. Environ. Med. 2009, 51, 771–779. [Google Scholar] [CrossRef] [Green Version]
- Schultz, A.B.; Edington, D.W. Analysis of the Association between Metabolic Syndrome and Disease in a Workplace Population over Time. Value Health 2010, 13, 258–264. [Google Scholar] [CrossRef] [PubMed] [Green Version]
- Ryo, M.; Nakamura, T.; Funahashi, T.; Noguchi, M.; Kishida, K.; Okauchi, Y.; Nishizawa, H.; Ogawa, T.; Kojima, S.; Ohira, T.; et al. Health Education “Hokenshido” Program Reduced Metabolic Syndrome in the Amagasaki Visceral Fat Study. Three-Year Follow-up Study of 3,174 Japanese Employees. Intern. Med. 2011, 50, 1643–1648. [Google Scholar] [CrossRef] [PubMed] [Green Version]
- Mato, V.V.; Caddick, N.; King, J.A.; Johnson, V.; Edwardson, C.; Yates, T.; Stensel, D.J.; Daly, H.; Nimmo, M.A.; Clemes, S.A. The Impact of a Novel Structured Health Intervention for Truckers (SHIFT) on Physical Activity and Cardiometabolic Risk Factors. J. Occup. Environ. Med. 2018, 60, 368–376. [Google Scholar] [CrossRef] [PubMed] [Green Version]
- Marks, S. Culturally Sensitive Education Can Decrease Hispanic Workers’ Risk of Metabolic Syndrome. Work. Health Saf. 2016, 64, 543–549. [Google Scholar] [CrossRef] [PubMed]
- Wanden-Berghe, C.; Sanz-Valero, J. Systematic reviews in nutrition: Standardized methodology. Br. J. Nutr. 2012, 107, S3–S7. [Google Scholar] [CrossRef] [Green Version]
- Pandis, N.; Chung, B.; Scherer, R.W.; Elbourne, D.; Altman, D.G. CONSORT 2010 statement: Extension checklist for reporting within person randomised trials. BMJ 2017, 357, j2835. [Google Scholar] [CrossRef] [Green Version]
- Cooper, H.; Hedges, L.V. Reseach as a Scientific Process. In The Handbook of Research Syntheses and Meta-Analysis; Cooper, H., Hedges, L.V., Valentine, J.C., Eds.; Russel Sage Foundation: New York, NY, USA, 2011; pp. 1–14. [Google Scholar]
- Baujat, B.; Mahé, C.; Pignon, J.P.; Hill, C. A Graphical Method for Exploring Heterogeneity in Meta-Analyses: Application to a Meta-Analysis of 65 Trials. Stat. Med. 2002, 21, 2641–2652. [Google Scholar] [CrossRef]
- Duval, S.; Tweedie, R. Nonparametric Trim and Fill Method of Accouranging for Publication Bias in meta-analisys. J. Am. Stat. Assoc. 2000, 95, 89–98. [Google Scholar]
- Copas, J.B.; Shi, J.Q. A Sensitivity Analysis for Publication Bias in Systematic Reviews. Stat. Methods Med. Res. 2001, 10, 251–265. [Google Scholar] [CrossRef]
- Luo, D.; Wan, X.; Liu, J.; Tong, T. Optimally estimating the sample mean from the sample size, median, mid-range, and/or mid-quartile range. Stat. Methods Med. Res. 2018, 27, 1785–1805. [Google Scholar] [CrossRef] [PubMed] [Green Version]
- Wan, X.; Wang, W.; Liu, J.; Tong, T. Estimating the sample mean and standard deviation from the sample size, median, range and/or interquartile range. BMC Med. Res. Methodol. 2014, 14, 1–13. [Google Scholar] [CrossRef] [PubMed] [Green Version]
- Balduzzi, S.; Rücker, G.; Schwarzer, G. How to perform a meta-analysis with R: A practical tutorial. Evid. Based Ment. Health 2019, 22, 153–160. [Google Scholar] [CrossRef] [Green Version]
- Schwarzer, G.; Carpenter, J.R.; Rucker, G. Metasens: Statistical Methods for Sensitivity Analysis in Meta-Analysis, R Package Version 0.6-0. 2021. Available online: https://cran.r-project.org/package=metasens (accessed on 14 September 2021).
- Woo, S.H.; Oh, E.G.; Kim, K.-S.; Chu, S.H.; Kim, G.S.; Nam, C.M. Development and Assessment of a Social Network Service-Based Lifestyle-Modification Program for Workers at High Risk of Developing Cardiovascular Disease. Work. Health Saf. 2020, 68, 109–120. [Google Scholar] [CrossRef] [PubMed]
- Kempf, K.; Röhling, M.; Martin, S.; Schneider, M. Telemedical coaching for weight loss in overweight employees: A three-armed randomised controlled trial. BMJ Open 2019, 9, e022242, Erratum in BMJ Open 2019, 29, e022242corr1. [Google Scholar] [CrossRef] [Green Version]
- Shrivastava, U.; Fatma, M.; Mohan, S.; Singh, P.; Misra, A. Randomized Control Trial for Reduction of Body Weight, Body Fat Patterning, and Cardiometabolic Risk Factors in Overweight Worksite Employees in Delhi, India. J. Diabetes Res. 2017, 2017, 7254174. [Google Scholar] [CrossRef] [PubMed] [Green Version]
- Proeschold-Bell, R.J.; Turner, E.L.; Bennett, G.G.; Yao, J.; Li, X.-F.; Eagle, D.E.; Meyer, R.A.; Williams, R.B.; Swift, R.Y.; Moore, H.E.; et al. A 2-Year Holistic Health and Stress Intervention: Results of an RCT in Clergy. Am. J. Prev. Med. 2017, 53, 290–299. [Google Scholar] [CrossRef]
- Steinberg, G.; Scott, A.; Honcz, J.; Spettell, C.; Pradhan, S. Reducing Metabolic Syndrome Risk Using a Personalized Wellness Program. J. Occup. Environ. Med. 2015, 57, 1269–1274. [Google Scholar] [CrossRef]
- Kramer, M.K.; Molenaar, D.M.; Arena, V.; Venditti, E.M.; Meehan, R.J.; Miller, R.; Vanderwood, K.K.; Eaglehouse, Y.; Kriska, A. Improving Employee Health: Evaluation of a worksite lifestyle change program to decrease risk factors for diabetes and car-diovascular disease. J. Occup. Environ. Med. 2015, 57, 284–291. [Google Scholar] [CrossRef] [PubMed] [Green Version]
- Puhkala, J.; Kukkonen-Harjula, K.; Mansikkamäki, K.; Aittasalo, M.; Hublin, C.; Kärmeniemi, P.; Olkkonen, S.; Partinen, M.; Sallinen, M.; Tokola, K.; et al. Lifestyle counseling to reduce body weight and cardiometabolic risk factors among truck and bus drivers – a randomized controlled trial. Scand. J. Work. Environ. Health 2015, 41, 54–64. [Google Scholar] [CrossRef]
- Inoue, H.; Sasaki, R.; Aiso, I.; Kuwano, T. Short-term intake of a Japanese-style healthy lunch menu contributes to prevention and/or improvement in metabolic syndrome among middle-aged men: A non-randomized controlled trial. Lipids Health Dis. 2014, 13, 57. [Google Scholar] [CrossRef] [Green Version]
- Chen, Y.-C.; Tsao, L.-I.; Huang, C.-H.; Yu, Y.-Y.; Liu, I.-L.; Jou, H.-J. An Internet-based health management platform may effectively reduce the risk factors of metabolic syndrome among career women. Taiwan. J. Obstet. Gynecol. 2013, 52, 215–221. [Google Scholar] [CrossRef] [Green Version]
- Allen, J.C.; Lewis, J.B.; Tagliaferro, A.R. Cost-Effectiveness of Health Risk Reduction After Lifestyle Education in the Small Workplace. Prev. Chronic Dis. 2012, 9, E96. [Google Scholar] [CrossRef] [Green Version]
- Nanri, A.; Tomita, K.; Matsushita, Y.; Ichikawa, F.; Yamamoto, M.; Nagafuchi, Y.; Kakumoto, Y.; Mizoue, T. Effect of Six Months Lifestyle Intervention in Japanese Men with Metabolic Syndrome: Randomized Controlled Trial. J. Occup. Health 2012, 54, 215–222. [Google Scholar] [CrossRef] [PubMed]
- Maruyama, C.; Kimura, M.; Okumura, H.; Hayashi, K.; Arao, T. Effect of a worksite-based intervention program on metabolic parameters in middle-aged male white-collar workers: A randomized controlled trial. Prev. Med. 2010, 51, 11–17. [Google Scholar] [CrossRef] [PubMed]
- Racette, S.B.; Deusinger, S.S.; Inman, C.L.; Burlis, T.L.; Highstein, G.R.; Buskirk, T.D.; Steger-May, K.; Peterson, L.R. Worksite Opportunities for Wellness (WOW): Effects on cardiovascular disease risk factors after 1 year. Prev. Med. 2009, 49, 108–114. [Google Scholar] [CrossRef] [Green Version]
- National Cholesterol Education Program. Third Report of the Expert Panel of Detection, Evaluation, and Treatment of High Blood Cholesterol in Adults; (Adults Treatment Panel III), (NIH Pub. No. 02-5215); National Heart, Lung and Blood Institute: Bethesda, MD, USA, 2002.
- Alberti, K.G.M.M.; Zimmet, P.; Shaw, J. Metabolic syndrome—A new world-wide definition. A Consensus Statement from the International Diabetes Federation. Diabet. Med. 2006, 23, 469–480. [Google Scholar] [CrossRef]
- Hwang, L.-C.; Bai, C.-H.; Chen, C.-J. Prevalence of Obesity and Metabolic Syndrome in Taiwan. J. Formos. Med. Assoc. 2006, 105, 626–635. [Google Scholar] [CrossRef] [Green Version]
- Marzusawa, Y. The Examination Committee of Criteria for “Metabolic Syndrome” in Japan. Criteria for “metabolicsyndrome” in Japan. J. Jpn. Soc. Int. Med. 2005, 94, 188–203. (In Japanese) [Google Scholar]
- Harvard University. School of Public Health. Healthy Eating Plate & Healthy Eating Pyramid. 2011. Available online: https://www.hsph.harvard.edu/nutritionsource/healthy-eating-plate/ (accessed on 10 September 2021).
- Rosenstock, I.M. The Health Belief Model: Explaining Health Behavior througt Expectancies. In Health Behavior and Health Education: Theory, Research and Practice; Glanz, K., Lewis, F.M., Rimer, B.K., Eds.; Jossey-Bass Publishers: San Francisco, CA, USA, 1990. [Google Scholar]
- Prochaska, J.O.; DiClemente, C.C. Stages and processes of self-change of smoking: Toward an integrative model of change. J. Consult. Clin. Psychol. 1983, 51, 390–395. [Google Scholar] [CrossRef]
- Williams, R.B.; Williams, V.P. Control: No More Snapping at Your Family, Sulking at Work, Steaming in the Grocery Line, Seething in Meetings, Stuffifing your Frustration; Rodale Books: New York, NY, USA, 2006. [Google Scholar]
- Bodenheimer, T. Coaching patients to be active, informed partners in their health. Fam. Syst. Health 2020, 38, 190–192. [Google Scholar] [CrossRef]
- Aracil-Lavado, E.; Wanden-Berghe, C.; Sanz-Valero, J. Evaluation of quality of life according to the nutritional status of the adult palliative patient: Systematic review. Hosp. Domic. 2017, 1, 199–210. [Google Scholar] [CrossRef] [Green Version]
- Bhui, K.; Dinos, S.; Galant-Miecznikowska, M.; De Jongh, B.; Stansfeld, S. Perceptions of work stress causes and effective interventions in employees working in public, private and non-governmental organisations: A qualitative study. BJPsych Bull. 2016, 40, 318–325. [Google Scholar] [CrossRef] [PubMed] [Green Version]
- Huang, P.L. A comprehensive definition for metabolic syndrome. Dis. Model. Mech. 2009, 2, 231–237. [Google Scholar] [CrossRef] [Green Version]
- Singh, I.M.; Shishehbor, M.H.; Ansell, B.J. High-density lipoprotein as a therapeutic target: A systematic review. JAMA 2007, 298, 786–789. [Google Scholar] [CrossRef]
- Rahimi, K.; Bidel, Z.; Nazarzadeh, M.; Copland, E.; Canoy, D.; Ramakrishnan, R.; Pinho-Gomes, A.-C.; Woodward, M.; Adler, A.; Agodoa, L.; et al. Pharmacological blood pressure lowering for primary and secondary prevention of cardiovascular disease across different levels of blood pressure: An individual participant-level data meta-analysis. Lancet 2021, 397, 1625–1636. [Google Scholar] [CrossRef]
- Han, T.; Richmond, P.; Avenell, A.; Lean, M. Waist circumference reduction and cardiovascular benefits during weight loss in women. Int. J. Obes. 1997, 21, 127–134. [Google Scholar] [CrossRef] [PubMed] [Green Version]
- Castro-Barquero, S.; Ruiz-León, A.M.; Sierra-Pérez, M.; Estruch, R.; Casas, R. Dietary Strategies for Metabolic Syndrome: A Comprehensive Review. Nutrients 2020, 12, 2983. [Google Scholar] [CrossRef]
- Huang, J.-H.; Li, R.-H.; Huang, S.-L.; Sia, H.-K.; Lee, S.-S.; Wang, W.-H.; Tang, F.-C. Relationships between different types of physical activity and metabolic syndrome among Taiwanese workers. Sci. Rep. 2017, 7, 13735. [Google Scholar] [CrossRef] [Green Version]
- Haufe, S.; Kerling, A.; Protte, G.; Bayerle, P.; Stenner, H.T.; Rolff, S.; Sundermeier, T.; Kück, M.; Ensslen, R.; Nachbar, L.; et al. Telemonitoring-supported exercise training, metabolic syndrome severity, and work ability in company employees: A randomised controlled trial. Lancet Public Health 2019, 4, e343–e352. [Google Scholar] [CrossRef] [Green Version]
- Tsai, H.H.; Yeh, C.Y.; Su, C.T.; Chen, C.J.; Peng, S.M.; Chen, R.Y. The effects of exercise program on burnout and metabolic syndrome components in banking and insurance workers. Ind. Health 2013, 51, 336–346. [Google Scholar] [CrossRef] [Green Version]
- Dahal, P.K.; Hosseinzadeh, H. Association of health literacy and diabetes self-management: A systematic review. Aust. J. Prim. Health 2019, 25, 526. [Google Scholar] [CrossRef] [PubMed]
- Juvinyà-Canal, D.; Bertran-Noguer, C.; Suñer-Soler, R. Alfabetización para la salud, más que información. Gac. Sanit. 2018, 32, 8–10. [Google Scholar] [CrossRef]
- Thom, D.H.; Ghorob, A.; Hessler, D.; De Vore, D.; Chen, E.; Bodenheimer, T.A. Impact of Peer Health Coaching on Glycemic Control in Low-Income Patients with Diabetes: A Randomized Controlled Trial. Ann. Fam. Med. 2013, 11, 137–144. [Google Scholar] [CrossRef] [PubMed] [Green Version]
- Burgess, E.; Hassmén, P.; Welvaert, M.; Pumpa, K. Behavioural treatment strategies improve adherence to lifestyle intervention programmes in adults with obesity: A systematic review and meta-analysis. Clin. Obes. 2017, 7, 105–114. [Google Scholar] [CrossRef]
- Eftekhari, S.; Alipour, F.; Aminian, O.; Saraei, M. The association between job stress and metabolic syndrome among medical university staff. J. Diabetes Metab. Disord. 2021, 20, 321–327. [Google Scholar] [CrossRef]
- Yamaoka, K.; Tango, T. Effects of lifestyle modification on metabolic syndrome: A systematic review and meta-analysis. BMC Med. 2012, 10, 138. [Google Scholar] [CrossRef]
- Lin, C.-H.; Chiang, S.-L.; Tzeng, W.-C.; Chiang, L.-C. Systematic Review of Impact of Lifestyle-Modification Programs on Metabolic Risks and Patient-Reported Outcomes in Adults with Metabolic Syndrome. Worldviews Evid. Based Nurs. 2014, 11, 361–368. [Google Scholar] [CrossRef]
- World Health Organization; Burton, J. WHO Healthy Workplace Framework and Model: Background and Supporting Literature and Practices. 2010. Available online: https://apps.who.int/iris/handle/10665/113144 (accessed on 12 September 2021).
- Pelletier, K.R. A review and analysis of the clinical and cost-effectiveness studies of comprehensive health promotion and disease management programs at the worksite update VIII 2008 to 2010. J. Occup. Environ. Med. 2011, 53, 1310–1331. [Google Scholar] [CrossRef]
- World Health Organization. Global Strategy on Diet, Physical Activity and Health. 2004. Available online: https://apps.who.int/iris/handle/10665/43035 (accessed on 18 September 2021).
- The European Programme FOOD (Fighting Obesity through Offer and Demand). Balance Nutrition at Work, Conference Report; European Parliament: Brussels, Belgium, 2011.


| Author, Year | Country, MetS Clinical Criteria | Population Studied (N, M to F Ratio, Age, Occupation) | FUP | Health Status Inclusion Criteria | Intervention | Outcome Variables | Results | Conclusions |
|---|---|---|---|---|---|---|---|---|
| Woo et al., 2020 [27] | South Korea, NI | N: 68 (IG1 23; IG2 19; CG 26) M/F: NI Age range: 25–60 years Occupation: hospital workers | 12 weeks | 2 risk factors for MetS or 1 risk factor for CVD | Social Network Service-Based Lifestyle-Modification Programme. IG1: education/counselling about regular physical activity; doctor consultation; nutritional goals. IG2: only educational information. CG: no intervention. | CVD risk factors: BP, WC, BMI, TG, TC, HDL-c and LDL-c. Health beliefs, health promotion behaviours and self-efficacy. Data collected at baseline, 6 weeks and 12 weeks in all 3 groups. | Week 6: IG1 showed significant decrease in WC, BMI, TC, LDL-c, health promotion behaviours and self-efficacy, but not significantly greater than in IG2 or CG. Week 12: IG1 showed significant decrease in WC, BMI, TC, LDL-c. Self-efficacy and health promotion behaviours improved to a greater degree in IG1 than in IG2 and CG. | Programme improved self-efficacy and health behaviour, improving CVD risk factors |
| Kempf et al., 2019 [28] | Germany, NI | N: 104 (IG 34; CG1 34; CG2 36) M/F: 84/16 Mean age: 50 years Occupation: employees of medical company Boehringer Ingelheim | 36 months | Overweight (BMI ≥ 25 kg/m2 and/or WC > 94 cm for men or >80 cm for women). | Telemedical coaching focused on controlled weight loss with or without telemonitoring. IG: Telemedical coaching + telemonitoring (scales and pedometer) + weekly then monthly care calls over 12 months. CG1: scales and pedometer from baseline CG2: short coaching phase (monthsmonths 6–9) + scales and pedometer from mth 6. | 1. Weight loss after 12 months in all 3 groups 2. Difference in weight loss after 6 months (IG vs. C1 and IG vs. C2). 3. BMI, WC, SBP/DBP, TG, TC, HDL-c, LDL-c, HbA1C, FBG, CRP, eating behaviour, PA. Data collected at 3, 6, 9, 12 and 36 months. | Significant reduction in BMI, SBP/DBP and eating behaviour in all groups. Weight loss after 12 months: IG vs. CG1: −3.6 kg (−7.4; −0.1) (p = 0.047); IG vs. C2: −4.2 kg (−7.9; −0.5) (p = 0.026) in per-protocol analysis. ≥5%weight loss at 12 months: IG: 63% (p = 0.037); CG1: 33%; CG2: 31% in per-protocol analysis. At 36 months: weight loss at 12 months was maintained until 36 months. All 3 groups significantly reduced weight (IG: −8.4 [95% CI −11.3; −5.4] kg; CG1: −4.0 [95% CI −6.6; −1.8] kg; CG2: −3.3 [95% CI −5.8; −0.8] kg). No difference between groups in per-protocol or intention to treat analyses after 3 years | Improvements in SBP, anthropometric measurements and eating behaviour indicate that telemedical coaching with telemonitoring can help to prevent weight gain and improve health. |
| Shrivastava et al., 2017 [29] | India, NCEP-ATP-III [35] | N: 598 M/F: 87.9%/12.1% Mean age: IG 35.8 years (SD 7.6); CG 39.0 yearsyears (SD 8.7) Occupation: Employees at 4 corporate worksites (public and private) | 6 months | Overweight (BMI ≥ 23 kg/m2) | Multicomponent intervention to improve knowledge, attitude and health lifestyle, focused on healthy living, diet and physical activity. IG: 2 sessions/2 weeks on healthy living, diet, and PA + 2 PA training sessions + stress management sessions. CG: 2 general health talks in 6 months. | 1. FBG, TC, HDL-c, LDL-c, TG. 2. Anthropometric measurements (WC, BMI, skinfold). 3. Other behavioural risk factors (tobacco and alcohol), dietary intake/food frequency, PA pattern. | IG achieved significant decrease in weight, BMI, WC, waist to hip ratio, skinfold (biceps, triceps, subscapular, suprailiac), FBG, TG; increase in HDL-c In CG, no significant difference in mean values except FBG and 3 skinfolds (biceps, triceps, subscapular). Weight loss in 12% of IG versus 4% of CG. (12.51 ± 10.38 cm vs. 3.50 ± 8.18 cm reduction in skinfold measurements). Greater conversion from sedentary to more active lifestyle in IG versus CG (67% to 55% vs. 69% to 65%). Lower calorie intake and fat consumption. More individuals in IG than in CG reduced number of risk factors for MetS. | Intervention achieved reduction in weight, subcutaneous fat and cardiometabolic risk factors after 6 months. The results could encourage other worksites in India to implement similar multicomponent interventions. |
| Proeschold-Bell et al., 2017 [30] | USA, IDF [36] | N: 1114 (IG1 395; IG2 283; IG3 436) M/F: 69.3%/30.7% Mean age: 51.9years (SD 10.0) Occupation: United Methodist clergy | 24 months | No health status inclusion criteria | IG1: “Immediate intervention” and IG2: “1 year waitlist”: Personal goal setting + 3 workshops delivering stress management and theological content supporting healthy behaviours + 10–weeks online weight-loss program + small grant. IG3 “2-year waitlist: online stress management + journaling + exercises”. | 1. MetS prevalence 2. Prevalence of depression, mean stress score, mean weight. Data collected at 0, 12, 18 and 24 months | Initial MetS prevalence: 50.9% Change in MetS prevalence in IG1: 49.5% to 42.9%; in IG2: 49.8% to 46.1%; in IG3: 49.6% to 45.1%. After 1 yr: 14% MetS prevalence (PR 0.86, 95% CI 0.79; 0.94, p < 0.001). After 2 years: −12% MetS prevalence sustained. Prevalence of components at baseline: central obesity 81.2%, low HDL 57.4%, hypertension 52.6%, high TG 50.9%, abnormal glucose regulation 13.7%. Beneficial effect at 24-months for the 3 most prevalent components Weight loss at 24 months: −3.4 kg for IG1; −4.4 kg for IG2; −1.7 kg for IG3. Depression and stress: no change in depression, gradual decrease in stress in all cohorts. | Spirited Life intervention improved MetS, central obesity, HDL, and BP over 24 months in US Christian Clergy. These findings support long-term behavioural change interventions. |
| Steinberg et al., 2015 [31] | USA NCEP-ATP-III [35] | N: 2835 (IG 1890; CG 945) M/F: 17%/83% Mean age: 46.53 years Occupation: Aetna employees who had previously participated in MetS biometric screening | 12 months | ≥2 MetS risk factors, one of which had to be WC | Personalised lifestyle-focused wellness programme. Contact with coaches and client care managers to achieve a healthier weight; focus on nutrition, PA, and behavioural well-being. Genetic profile for 3 genes associated with obesity, appetite and compulsory behaviour. IG1: given information about MetS results + invited to the program. IG2: MetS results + invited to the program + specific prediction of 12-mth future probability of MetS CG: given MetS results but not invited to program. | 1. WC, TG, HDL-c, BP, FBG 2. Medical cost per employee-month during 12 months. | WC: greater reduction in IG2 vs. CG (−1.06 inches vs. −0.48 inches, p = 0.02). TG level: greater decrease in IG participants vs. CG (−18,47 mg/dL vs. −2.64 mg/dL, [p = 0.01]) Weight loss: 76% of IG participants lost weight; average weight loss 4.5 kg from baseline (p < 0.001). HDL-c: increase in IG1/IG2 vs. CG. Only IG2 showed significant increase (2.81 mg/dL vs. 1.44 mg/dL, p = 0.02). Total health care cost: lower in IG1/IG2 vs. CG ($312 vs. $434, p < 0.02). | A clinically targeted, personalised wellness program can significantly improve commitment and clinical outcomes related to MetS risk, as well as reducing costs, within just 1 year. |
| Kramer et al., 2015 [32] | USA NCEP-ATP-III [35] | N: 89 (IG 60; CG 29) M/F: 40/49 Mean age: 52.3 years (range 34–70) Occupation: Employees of Bayer Corporation | 12 months | BMI ≥ 24 kg/m2 and evidence of prediabetes. | Lifestyle intervention to achieve and maintain 7% weight loss and to safely and progressively increase to 150 min/wk of moderate physical activity (e.g., brisk walking). IG: immediate intervention CG: delayed intervention (6 months after enrolment) All participants had weekly sessions for 12 weeks (face-to-face or DVD) and monthly meetings for 1 year. All participants were weighed at each in-person meeting and received handouts, pedometer, fat/calorie counter and exercise bands. | 1. Change in weight at 6 months vs. baseline 2. BMI, BP, lipid profile, FBG, WC, HbA1c and PA. Data collected at baseline, 6, 12 and 18 months | Greater weight loss in IG vs. CG at 6 months (5.1% vs. 1%) as well as improved WC, HbA1, SBP/DBP, BMI and physical activity time. TG level decreased in IG but not in CG. Nonsignificant difference in TG decrease between groups. Higher proportion of IG achieved at least 5% or 7% weight loss vs. CG (45% vs. 7%, p = 0.0005, and 29% vs. 4%, p = 0.007). Nonsignificant difference in increase in weekly PA between IG and CG (75 min, IQR 30 to 126 vs. 40 min, IQR 0 to 112.5; p = 0.17). Increased HDL at 6 months in men and decrease in women. At 6 months (IG and CG): decreased weight (p < 0.001), HbA1c, SBP/DBP, WC, BMI; and increased PA. At 12 months (IG and CG): decreased TG, DBP/SBP, BMI, WC and HbA1c. At 18 months (IG and CG): decreased weight and WC; increased PA of 25 min/week with baseline (p = 0.04). | This intervention was effective in reducing weight and other risk factors for diabetes and CVD in this worksite setting |
| Puhkala et al., 2015 [33] | Finland, IDF [36] | N: 113 (IG 55; CG 58) M/F: NI Mean age: IG 47.6 years (SD 7.9) CG: 46.5 years (SD 8.6) Occupation: Long-distance bus and truck drivers. | 24 months | WC ≥ 100 cm | Individual lifestyle counselling programme focused on improving nutrition, physical activity and sleep, to reduce body weight and MetS risk factors based on participants’ preferences, abilities and experience. IG: 12 months of counselling on diet, physical activity and sleep (6 individual 1-hr sessions and 7 30-min phone calls). Daily dietary, physical activity and sleep goals. CG: 3 months of counselling after 12 months (2 face-to-face sessions + 3 phone calls) | Weight, WC, glucose, TC, HDL, TG Questionnaire on health status and working conditions. Z-score to evaluate each MetS risk factor. Data collected at baseline, 12 months and 24 months. | Mean body weight change at 12 months: −3.4 kg (p = 0.001, range −26.1–9.9) kg in IG vs. +0.7 kg (p = 0.214, range −9.5–12.5) kg in CG. Net difference −4.0 kg (95% CI −6.2; −1.9) Weight loss at 12 months: 13% of IG lost ≥10% of initial body weight and 13% lost 5−9.9%. MetS prevalence at 12 months vs. baseline: 62% vs. 80% in IG and 60% vs. 62% in CG% (p = 0.34). Greater reduction in Z-score in IG vs. CG. MetS prevalence at 24 months: 60% in IG and 51% in CG. Non-significant difference between groups. Other results at 12 months: in IG, significant decrease in glucose and DBP; significant increase in HDL. Nonsignificant differences in LDL, TG, SBP. Z-score lower in IG. | The study showed clinically meaningful decreases in body weight and cardiometabolic risk factors after 12 months of counselling followed by 12 months of follow-up. Weight reduction and some improvement in cardiometabolic risk factors among long-distance truck and bus drivers is possible through lifestyle counselling, despite challenging working conditions. |
| Inoue et al., 2014 [34] | Japan NCEP-ATP-III [35] | N: 35 (IG 28; CG 7) M/F: 35/0 Mean age: 47.2 years (SD 7.9). Occupation: male office workers in the city hall | 3 months | None partake in daily exercise | Japanese-style healthy lunch menu providing balanced nutrition and sufficient vegetables during 3 months (600–650 kcal, fat < 18 g, cholesterol ≤ 100 mg, fibre ≥ 8 g, total vegetables ≥ 130 g, sodium chloride equivalent ≤ 3.8 g). IG: received healthy lunch. For analysis, group divided into those who consumed healthy lunch < 50/61 times (< 50%ile) and ≥ 50/61 times (≥ 50%ile) CG: consumed usual lunches without restriction. Nutritional content was assessed. Weekend diet unrestricted for all participants. | TC, LDL, HDL, TG, HbA1c, glucose, leptin, anthropometric data and dietary intake. | CG at 3 months: no significant difference in anthropometrics data; increased SBP (p = 0.063). IG (< 50%ile) at 3 months: decreased DBP (p = 0.000). IG (≥ 50%ile) at 3 months: decreased SBP (p = 0.023), DBP (p = 0,001), TC (p = 0.006) and LDL (p = 0.010) Changes in nutritional intake: energy and carbohydrate intake significantly decreased in IG (< 50%ile); total dietary fibre and vegetables significantly increased in IG (≥ 50%ile). | Japanese-style healthy lunches (consumed consistently) decreased blood pressure and serum lipids and increased plasma ghrelin levels. Our study demonstrates that a short-term intervention consisting of Japanese-style healthy lunches at a workplace cafeteria contributes to lipid metabolism regulation. |
| Chen et al., 2013 [35] | Taiwan, MetS criteria of the Bureau of Health Promotion in Taiwan [37] | N: 63; (IG: 31 CG: 32) Mean age: CG 45.66 years (SD 8.32); IG: 41.90 years (SD 9.80) Occupation: Full-time career women | 3 months | MetS risk factors. | Internet-based tailored health management platform. IG: 3-month intervention focused on nutrition, exercise recommendations and personal advice. CG: no intervention | Changes in health behaviour. MetS risk factors after 3 months (WC, TG, HDL, LDL, FBG, SBP/DBP) | Improvements for IG vs. CG at 3 months: WC (−3.5 vs. −0.6 cm, p < 0.05); fasting glucose (−6.5 vs. −3.1, p < 0.05); mean number of MetS risk factors (−0.6 vs. −0.011, p < 0.05). At 1.5 months, nutrition score had improved in both groups. At 3 months, both groups showed improvements in health behavioural score (p = 0.02), nutrition score (p = 0.02) and mental health score (p = 0.03). | A 3-month internet-based health intervention helped reduce participants’ waist circumference, fasting glucose and number of risk factors for MetS. |
| Allen et al., 2012 [36] | USA NCEP-ATP-III [35] | N: 64 (IG 26; CG 29) M/F: 6/58 Mean age: 48.9 years Occupation: Employees of the University of New Hampshire Cooperative Extension | 12 months | No health status inclusion criteria | The workplace health promotion programme consisted of 10 monthly lifestyle education sessions delivered online and focused on health topics such as CHD risk, diabetes, importance of healthy diet and PA. IG: health risk screening + education sessions + pedometers. Interactive question-and-answer session and sampling of foods. Foods chosen for their nutritional benefit and ease of preparation; healthy snack options. CG: health risk screening + minimal information | 1. Percentage-point reduction in LDL-C. 2. 10-year risk for CHD according to Framingham Risk Score (TC, HDL, LDL, glucose, CRP, BMI, SBP/DBP, body fat, cigarette smoking). | After 12 months, mean LDL-c (SD) was significantly lower in IG vs. CG (110.9 [22.2] mg/dL vs. 126.7 [21.8] mg/dL), with a relative difference between groups of 13.4%; no change in CG from baseline. Mean (SD) TC was significantly lower after 12 months in IG (183.4 [22.2] mg/dL) vs. CG (198.6 [20.9] mg/dL); no change in CG from baseline. WC increased in CG and unchanged in IG after 12 months. MetS markers: higher number of markers in CG vs. IG at 12 months (1.9 vs. 1.3). No difference between groups at 12 months in Framingham Risk Score, but absolute reduction of 0.3 points in CHD risk in IG (relative improvement of 18%). Number of steps increased from baseline to 12 months. | Compared with statin administration or lifestyle education in a clinical setting, intervention by videoconference is cost-effective and reduces LDL-c and overall CHD risk. |
| Nanri et al., 2012 [37] | Japan, Japanese definition of MetS [38] | N: 102 (IG 49; CG 53) M/F: 102/0 Mean age: 53.2 years (SD 6.8, range 38–68]. Occupation: Male employees of company in Japan | 6 months | WC ≥ 85 cm plus ≥ 2 MetS risk factors | Lifestyle modification programme based on behavioural change theory. IG: Individual advice for health-related lifestyle changes, including diet and physical activity. Facilitators for behavioural change: pedometers, scales, leaflet and a diary to record behavioural performance and body changes. CG: standard guidelines | 1. MetS prevalence at six months. 2. Changes in prevalence of abdominal obesity, dyslipidaemia, BP, hyperglycaemia; and mean change in MetS components (WC, weight, BMI, BP, TC, HDL-c, TG, glucose, HbA1c, CRP). | MetS prevalence did not differ significantly between the two groups (65.3% in IG vs. 62.3% in CG; p = 0,75). No significant differences were observed in BP, TC, HDL-c, TG or glucose. In the IG, intake of cereals and sugar/sweeteners significantly decreased. Rice decreased from 357 g to 297 g (p = 0.004) and PA increased by 57 min/wk (p < 0.001) after 6 months and no change in the control group (p = 0.99). | The intervention did not decrease MetS prevalence. Weight, WC and HbA1c were significantly lower in the IG vs. CG, and the IG made more healthy changes such as reducing sugar, cereals and sweets, and increasing physical activity. |
| Maruyama et al., 2010 [38] | Tokyo, Japan, NI | N: 87 (IG 52; CG 47) M/F: 87/0 Age range: 30 to 59 years Occupation: Office workers belonging to a health insurance association | 4 months | MetS risk factors based on results of regular health check-ups. | Lifestyle modification programme to promote healthy dietary habits and PA. IG: 4 individual counselling sessions with a dietitian and a physical trainer. Participants registered their current targeted food intake and pedometer data on a website for self-monitoring, website advice and personal counselling from the counsellors. CG: no intervention | 1. Food group intake and number of steps. Weight, WC, BP, BMI, TC, TG, HDL-c, LDL-c, HA1c, insulin. | Increased consumption of healthy food and decreased consumption of unhealthy food in IG (p = 0.00) but not in CG. Change in number of steps was similar in both groups. Significantly higher percentage of subjects with improvements in clinical parameters in IG compared with CG. | Generalised and relatively simple lifestyle changes, encouraged by a counsellor appear to help prevent metabolic disorders. Interventions based on personal contact and interactive resources are necessary to confirm long-term effects. |
| Racette et al., 2009 [39] | USA (NCEP-ATP-III) [35] | N: 151 M/F: 17/134 Mean age: 45 years (SD 9) Occupation: employees at selected worksites within a large medical centre | 12 months | All employees were eligible. | Health promotion program based on behaviour change theory. IG: assessments + intervention on nutrition and PA + incentives to promote healthy behaviours + pedometers, weekly healthy snack cart, on-site WeightWatchers group meetings and group exercise classes, monthly lunchtime seminars and newsletters, walking team competitions and participation rewards CG: annual health assessment only | 1. Weight, BMI, body composition, BP, fitness, lipids, Framingham risk score. 2. TC, HDL-c, LDL-c, TG, FBG. 3. Changes in food group intake and total daily PA | Both groups showed improvements in fitness, BP, HDL-c and LDL-c, and a slight reduction in weight, BMI and fat mass (greater reduction in IG). In the IG, the proportion of participants with the lowest Framingham Risk Score increased from 40% at baseline to 57% after 1 year. The prevalence of MetS reduced significantly in the IG from 38% to 25%, owing to improvements in HDL-c and BP. IG participants also increased fruit and vegetable intake from 4.7 servings at baseline to 7.8 servings at 6 months and 7.0 at 1 year (all p < 0.001); decreased consumption of saturated fat, fatty meals and fried foods (p < 0.001); and significantly increased total daily PA. CG showed significant but smaller improvements in fruit and vegetable intake, saturated fat intake and PA. | Multi-component worksite intervention achieved significant improvements in CVD risk factors and physical fitness. These benefits were attributable to the health assessments and personalized feedback rather than the intervention. |
| Study | Checklist Item | ||||||||||||||||||||||||||
|---|---|---|---|---|---|---|---|---|---|---|---|---|---|---|---|---|---|---|---|---|---|---|---|---|---|---|---|
| 1 | 2 | 3 | 4 | 5 | 6 | 7 | 8 | 9 | 10 | 11 | 12 | 13 | 14 | 15 | 16 | 17 | 18 | 19 | 20 | 21 | 22 | 23 | 24 | 25 | Total | (%) | |
| Woo et al., 2020 [27] | 0.5 | 1 | 0.5 | 1 | 1 | 0.5 | 0 | 1 | 0 | 0 | 0.5 | 1 | 0.5 | 0.5 | 1 | 1 | 0 | 0 | 0 | 1 | 1 | 1 | 0 | 1 | 0 | 14 | 56 |
| Kempf et al., 2019 [28] | 1 | 1 | 0.5 | 1 | 1 | 0.5 | 0.5 | 1 | 1 | 1 | 0.5 | 1 | 1 | 0.5 | 1 | 1 | 0.5 | 0 | 1 | 1 | 1 | 1 | 1 | 1 | 1 | 20.5 | 82 |
| Shrivastava et al., 2017 [29] | 1 | 1 | 0.5 | 1 | 1 | 0.5 | 0.5 | 1 | 0 | 0 | 0 | 1 | 0.5 | 0 | 1 | 0 | 0 | 1 | 0 | 1 | 1 | 1 | 1 | 0 | 0 | 13.5 | 54 |
| Proeschold-Bell et al., 2017 [30] | 0.5 | 0.5 | 0.5 | 1 | 0 | 0.5 | 0.5 | 1 | 1 | 1 | 0.5 | 1 | 1 | 0 | 1 | 1 | 1 | 0 | 0 | 1 | 0 | 0 | 1 | 1 | 1 | 16 | 64 |
| Steinberg et al., 2015 [31] | 0.5 | 1 | 0 | 0.5 | 0 | 0.5 | 0 | 1 | 0 | 0 | 0 | 1 | 1 | 0.5 | 1 | 0 | 0 | 0 | 0 | 1 | 1 | 1 | 0 | 1 | 0 | 11.5 | 46 |
| Kramer et al., 2015 [32] | 0.5 | 1 | 0.5 | 1 | 0 | 0.5 | 0 | 0.5 | 0 | 0 | 0 | 0.5 | 0.5 | 0.5 | 1 | 1 | 0.5 | 0 | 0 | 1 | 1 | 1 | 0 | 1 | 0 | 12 | 48 |
| Puhkala et al., 2015 [33] | 1 | 1 | 0.5 | 05 | 1 | 0.5 | 0.5 | 1 | 1 | 1 | 1 | 1 | 0 | 0 | 1 | 1 | 0.5 | 1 | 0 | 1 | 1 | 1 | 0 | 1 | 1 | 19 | 76 |
| Inoue et al., 2014 [34] | 0.5 | 1 | 0.5 | 1 | 1 | 1 | 0 | 0 | 0 | 0 | 0 | 0.5 | 0.5 | 0 | 1 | 0 | 0 | 0 | 0 | 1 | 0 | 1 | 0 | 1 | 1 | 11 | 44 |
| Chen et al., 2013 [35] | 0.5 | 1 | 0.5 | 1 | 1 | 0 | 0 | 0.5 | 0 | 0 | 0 | 0.5 | 1 | 0.5 | 1 | 1 | 0 | 0 | 0 | 1 | 0 | 1 | 0 | 1 | 0 | 10 | 40 |
| Allen et al., 2012 [36] | 0.5 | 1 | 0 | 1 | 0 | 0.5 | 0 | 0.5 | 0 | 0 | 0 | 0.5 | 0.5 | 0 | 1 | 0 | 0.5 | 0 | 0 | 1 | 0 | 1 | 0 | 0 | 1 | 9.5 | 38 |
| Nanri et al., 2012 [37] | 1 | 1 | 0.5 | 1 | 0 | 0.5 | 0 | 0.5 | 0 | 0 | 0 | 0.5 | 0.5 | 0 | 1 | 1 | 0.5 | 0 | 0 | 1 | 0 | 1 | 1 | 1 | 1 | 12.5 | 50 |
| Maruyama et al., 2010 [38] | 1 | 1 | 0.5 | 1 | 1 | 0 | 0.5 | 0.5 | 1 | 1 | 0.5 | 0.5 | 1 | 0.5 | 1 | 0 | 0.5 | 0 | 0 | 1 | 0 | 1 | 0 | 1 | 1 | 15 | 60 |
| Racette et al., 2009 [39] | 0.5 | 1 | 0 | 1 | 1 | 0.5 | 0 | 0 | 0 | 1 | 0 | 1 | 1 | 0.5 | 1 | 1 | 1 | 0 | 1 | 1 | 0 | 1 | 0 | 1 | 1 | 16 | 64 |
| Intervention Led by | Int.1 | Int.2 | Int.3 | Int.4 | Int.5 | Int.6 | |
|---|---|---|---|---|---|---|---|
| Woo et al., 2020 [27] | Health administrators, doctors and nutritionists | x | x | x | x | x | |
| Kempf et al., 2019 [28] | Diabetes nurses trained in mental and motivational coaching | x | x | x | |||
| Shrivastava et al., 2017 [29] | Physicians, nutritionist and physical trainer | x | x | x | x | ||
| Proeschold-Bell et al., 2017 [30] | Intervention health coaches | x | x | x | x | ||
| Steinberg et al., 2015 [31] | Personal coaches and client care managers | x | x | x | x | ||
| Kramer et al., 2015 [32] | Trained prevention professionals as lifestyle coaches and a nurse practitioner | x | x | x | x | ||
| Puhkala al, 2015 [33] | Nutritionists and a physiotherapist | x | x | x | x | x | |
| Inoue et al., 2014 [34] | Cook in staff cafeteria | x | |||||
| Chen et al., 2013 [35] | Health management expert | x | x | x | |||
| Allen et al., 2012 [36] | Lifestyle professionals | x | x | x | |||
| Nanri et al., 2012 [37] | Trained occupational health nurse | x | x | x | |||
| Maruyama et al., 2010 [38] | Dietitian and physical trainer (certified health counsellors for the program) | x | x | x | x | ||
| Racette et al., 2009 [39] | Dietitian and exercise specialist | x | x | x | x |
| ID | Omitting | WC | BMI | TC | HDL-c | LDL-c | TG | SBP | DBP | FBG |
|---|---|---|---|---|---|---|---|---|---|---|
| 1 | Woo et al., 2020 | 82.20% | 95.51% | 67.83% | 52.43% | 70.30% | 65.68% | 96.58% | 89.62% | 32.81% |
| 2 | Woo et al., 2020 | 81.96% | 95.51% | 61.00% | 51.85% | 59.79% | 66.86% | 96.59% | 88.67% | 37.11% |
| 3 | Woo et al., 2020 | 82.21% | 95.49% | 67.65% | 50.46% | 72.83% | 65.54% | 96.58% | 89.64% | 37.52% |
| 4 | Kempf et al., 2019 | 95.49% | 94.98% | 84.72% | ||||||
| 5 | Kempf et al., 2019 | 95.49% | 95.49% | 89.05% | ||||||
| 6 | Kempf et al., 2019 | 89.54% | 96.59% | 89.61% | ||||||
| 7 | Shrivastava et al., 2017 | 80.80% | 92.88% | 53.80% | 48.76% | 68.21% | 51.68% | 96.38% | 89.54% | 33.25% |
| 8 | Shrivastava et al., 2017 | 82.17% | 95.17% | 68.08% | 38.05% | 71.26% | 66.59% | 96.25% | 89.00% | 10.40% |
| 9 | Kramer et al., 2015 | 80.98% | 95.50% | 66.77% | 52.62% | 72.83% | 64.86% | 95.57% | 85.79% | 37.50% |
| 10 | Kramer et al., 2015 | 80.40% | 95.28% | 67.83% | 51.08% | 72.77% | 66.66% | 96.51% | 89.38% | 34.15% |
| 11 | Kramer et al., 2015 | 78.81% | 95.18% | 68.08% | 52.70% | 72.35% | 65.25% | 96.57% | 89.63% | 29.95% |
| 12 | Kramer et al., 2015 | 78.45% | 95.42% | 66.50% | 52.43% | 71.35% | 66.84% | 96.59% | 89.60% | 30.59% |
| 13 | Puhkala et al., 2015 | 79.72% | 52.23% | 34.62% | ||||||
| 14 | Puhkala et al., 2015 | 78.38% | 48.43% | 29.32% | ||||||
| 15 | Inoue et al., 2014 | 82.22% | 95.50% | 68.07% | 49.86% | 72.84% | 66.55% | 96.59% | 89.64% | 37.60% |
| 16 | Inoue et al., 2014 | 82.17% | 95.49% | 67.17% | 50.58% | 72.22% | 66.84% | 96.59% | 89.52% | 35.61% |
| 17 | Chen et al., 2013 | 82.13% | 44.97% | 66.52% | 96.59% | 89.61% | 35.42% | |||
| 18 | Allen et al., 2012 | 79.67% | 95.51% | 58.84% | 48.47% | 70.79% | 66.82% | 96.25% | 89.50% | 32.75% |
| 19 | Nanri et al., 2012 | 95.44% | 65.24% | 49.87% | 52.21% | 96.52% | 87.71% | 31.23% | ||
| 20 | Nanri et al., 2012 | 82.16% | 95.51% | 66.29% | 52.65% | 64.06% | 96.55% | 88.87% | 37.30% | |
| 21 | Maruyama et al., 2010 | 82.04% | 95.49% | 66.24% | 51.09% | 72.51% | 60.19% | 96.54% | 89.57% | 37.62% |
| 22 | Racette et al., 2009 | 95.51% | 67.70% | 43.75% | 62.19% | 65.11% | 96.59% | 89.31% | 36.78% | |
| Pooled estimate | 81.07% | 95.25% | 65.84% | 49.93% | 70.58% | 64.67% | 96.41% | 89.06% | 33.96% |
| Trim-and-Fill | Copas | ||||||
|---|---|---|---|---|---|---|---|
| Random Effects Model | Random Effects Model | ||||||
| Variable | No. of Added Studies | Effect Size | 95% CI | No. of Added Studies | Effect Size | 95% CI | |
| 1 | WC | 0 | 0 | ||||
| 2 | BMI | 6 | −1.10 | [−1.45; −0.75] | 0 | ||
| 3 | TC | 5 | −3.65 | [−7.08; −0.23] | 3 | −5.00 | [−7.38; −2.63] |
| 4 | HDL-c | 3 | 1.08 | [0.28; −1.88] | 0 | ||
| 5 | LDL-c | 6 | −1.68 | [−5.47; −2.10] | 8 | −2.03 | [−4.01; −0.06] |
| 6 | TG | 4 | −5.79 | [−13.13; 1.54] | 0 | ||
| 7 | SBP | 10 | −8.24 | [−10.84; −5.64] | 0 | ||
| 8 | DBP | 7 | −4.67 | [−5.78; −3.57] | 0 | ||
| 9 | FBG | 0 | 0 | ||||
| Variable | Period | Sig. | Int.1 | Sig. | Int.2 | Sig. | Int.3 | Sig. | Int.4 | Sig. | Int.5 | Sig. | Int.6 | Sig. |
|---|---|---|---|---|---|---|---|---|---|---|---|---|---|---|
| WC | −0.03 | 0.898 | 1.29 | 0.170 | 0.33 | 0.751 | −0.79 | 0.424 | −2.19 | 0.035 | −0.09 | 0.943 | −0.99 | 0.346 |
| BMI | −0.09 | 0.065 | 0.78 | 0.006 | 0.49 | 0.293 | −0.79 | 0.009 | −0.77 | 0.034 | 0.32 | 0.655 | −0.51 | 0.139 |
| TC | 0.03 | 0.963 | −3.37 | 0.323 | −3.40 | 0.354 | −3.07 | 0.372 | 0.90 | 0.803 | 2.41 | 0.696 | 1.38 | 0.688 |
| HDL-c | 0.06 | 0.548 | −0.64 | 0.430 | −0.37 | 0.660 | 1.58 | 0.043 | 2.02 | 0.015 | 0.25 | 0.784 | 1.21 | 0.136 |
| LDL-c | 0.18 | 0.738 | −2.41 | 0.521 | −6.42 | 0.063 | −5.41 | 0.136 | −1.57 | 0.695 | 5.50 | 0.371 | −3.63 | 0.331 |
| TG | 0.3 | 0.784 | −4.68 | 0.519 | −1.23 | 0.874 | −3.55 | 0.616 | −0.84 | 0.914 | 1.09 | 0.930 | 6.01 | 0.418 |
| SBP | −0.45 | 0.077 | 4.85 | 0.038 | −0.91 | 0.758 | 0.72 | 0.799 | −1.44 | 0.614 | 2.90 | 0.604 | −3.53 | 0.175 |
| DBP | −0.33 | 0.003 | 3.34 | 0.001 | −2.25 | 0.087 | 0.50 | 0.670 | 0.38 | 0.754 | 0.61 | 0.777 | −1.46 | 0.193 |
| FBG | 0.21 | 0.032 | −1.26 | 0.071 | −0.52 | 0.578 | 1.79 | 0.002 | −0.09 | 0.925 | −1.15 | 0.144 | −0.65 | 0.460 |
Publisher’s Note: MDPI stays neutral with regard to jurisdictional claims in published maps and institutional affiliations. |
© 2021 by the authors. Licensee MDPI, Basel, Switzerland. This article is an open access article distributed under the terms and conditions of the Creative Commons Attribution (CC BY) license (https://creativecommons.org/licenses/by/4.0/).
Share and Cite
Gea Cabrera, A.; Caballero, P.; Wanden-Berghe, C.; Sanz-Lorente, M.; López-Pintor, E. Effectiveness of Workplace-Based Diet and Lifestyle Interventions on Risk Factors in Workers with Metabolic Syndrome: A Systematic Review, Meta-Analysis and Meta-Regression. Nutrients 2021, 13, 4560. https://0-doi-org.brum.beds.ac.uk/10.3390/nu13124560
Gea Cabrera A, Caballero P, Wanden-Berghe C, Sanz-Lorente M, López-Pintor E. Effectiveness of Workplace-Based Diet and Lifestyle Interventions on Risk Factors in Workers with Metabolic Syndrome: A Systematic Review, Meta-Analysis and Meta-Regression. Nutrients. 2021; 13(12):4560. https://0-doi-org.brum.beds.ac.uk/10.3390/nu13124560
Chicago/Turabian StyleGea Cabrera, Alicia, Pablo Caballero, Carmina Wanden-Berghe, María Sanz-Lorente, and Elsa López-Pintor. 2021. "Effectiveness of Workplace-Based Diet and Lifestyle Interventions on Risk Factors in Workers with Metabolic Syndrome: A Systematic Review, Meta-Analysis and Meta-Regression" Nutrients 13, no. 12: 4560. https://0-doi-org.brum.beds.ac.uk/10.3390/nu13124560