
The Effects of Sleep Quality and Resilience on Perceived Stress, Dietary Behaviors, and Alcohol Misuse: A Mediation-Moderation Analysis of Higher Education Students from Asia, Europe, and North America during the COVID-19 Pandemic

 , , , , ,
  , , ,
, , , 
Abstract
:1. Introduction
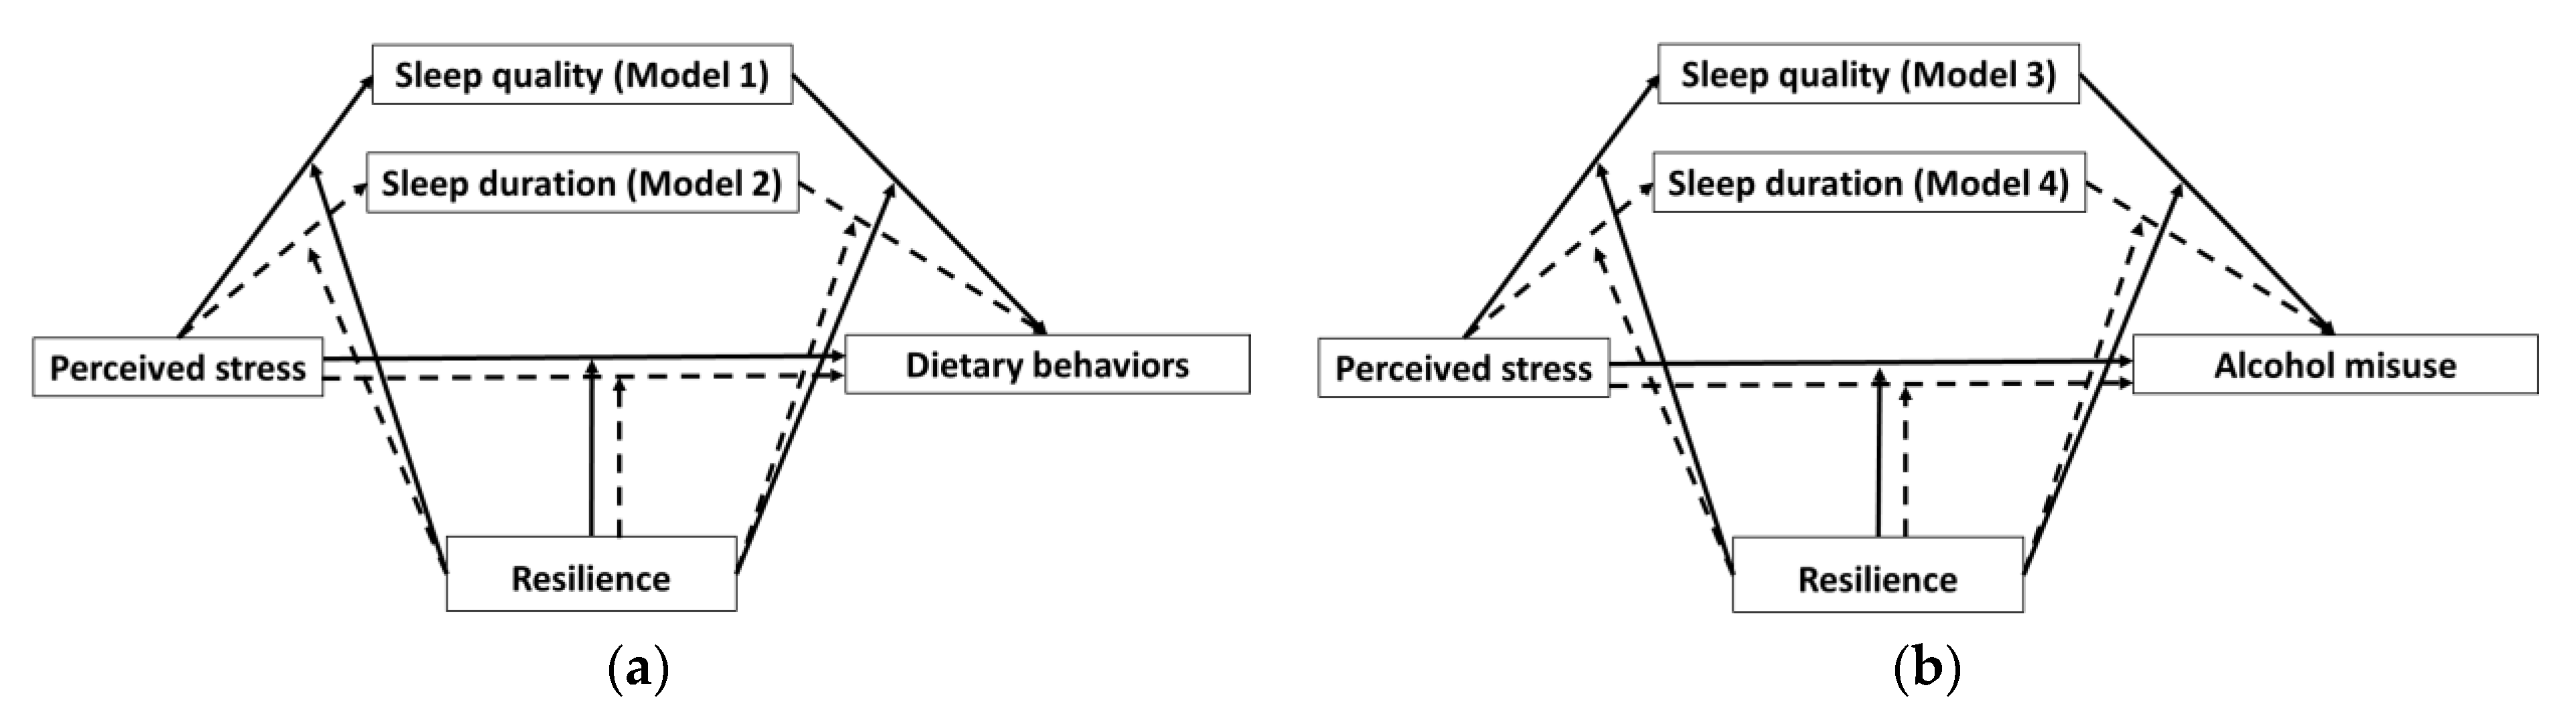
- (1)
- Higher levels of perceived stress were likely to be associated with poorer dietary behaviors through decreased sleep quality and sleep duration.
- (2)
- Higher levels of perceived stress were likely to be associated with higher alcohol misuse through decreased sleep quality and sleep duration.
- (3)
- Higher levels of resilience were likely to reduce the negative effects of perceived stress on poor dietary behaviors.
- (4)
- Higher levels of resilience were likely to reduce the negative effects of perceived stress on alcohol misuse.
2. Materials and Methods
2.1. Study Design
2.2. Demographics and Biological Information
2.3. Assessment of Perceived Stress and Resilience
2.4. Assessment of Dietary Behaviors and Alcohol Misuse
2.5. Assessment of Sleep Quality and Duration
2.6. Assessment of the Influence of the COVID-19 Pandemic on the Factors Described Above
2.7. Meditation and Moderation Models
2.8. Statistical Analysis
3. Results
3.1. Demographics
3.2. Correlations between Examined Variables
3.3. Health Behavior Classification of Higher Education Students
3.4. Influence of the COVID-19 Pandemic on Health Behaviors and Mental Health of Higher Education Students
3.5. Mediation and Moderation Analysis
4. Discussion
4.1. Mediation Effects of Sleep Quality and Sleep Duration on the Relationship between Perceived Stress and Dietary Behaviors
4.2. Mediation Effects of Sleep Quality and Sleep Duration on the Relationship between Perceived Stress and Alcohol Misuse
4.3. Moderation Effects—Resilience
4.4. Public Health Messages
4.5. Strengths and Limitations
5. Conclusions
Author Contributions
Funding
Institutional Review Board Statement
Informed Consent Statement
Data Availability Statement
Acknowledgments
Conflicts of Interest
References
- America Psychology Association by the Numbers: Stress on Campus. Available online: https://www.apa.org/monitor/2017/09/numbers (accessed on 19 October 2020).
- Ramachandiran, M.; Dhanapal, S. Academic Stress among University Students: A Quantitative Study of Generation Y and Z’s Perception. Available online: /paper/Academic-stress-among-university-students%3A-A-study-Ramachandiran-Dhanapal/3365061e9f874d1bf10b8c6c1e67f56ca03ae942 (accessed on 11 September 2020).
- Hodselmans, A.P.; Hemdal, E.; Lundberg, S.; Bjarnegård, A.; Hobbelen, H.; Svantesson, U. Physiotherapy students’ perceived stress, stressors, and reactions to stressors: A comparative study between Sweden and The Netherlands. Physiother. Theory Pract. 2018, 34, 293–300. [Google Scholar] [CrossRef]
- Britz, J.; Pappas, E. Sources and outlets of stress among university students: Correlations between stress and unhealthy habits. Undergrad. Res. J. Hum. Sci. 2010, 9. Available online: https://www.kon.org/urc/v9/britz.html (accessed on 19 October 2020).
- Kim, J.-H.; Brown, S.L. The associations between leisure, stress, and health behavior among university students. Am. J. Health Educ. 2018, 49, 375–383. [Google Scholar] [CrossRef]
- Ye, Z.; Yang, X.; Zeng, C.; Wang, Y.; Shen, Z.; Li, X.; Lin, D. Resilience, social support, and coping as mediators between COVID-19-related stressful experiences and acute stress disorder among college students in China. Appl. Psychol. Health Well-Being 2020, 12, 1074–1094. [Google Scholar] [CrossRef] [PubMed]
- Konstantopoulou, G.; Raikou, N. Clinical evaluation of depression in university students during quarantine due to COVID-19 pandemic. Eur. J. Public Health Stud. 2020, 3, 1–8. [Google Scholar] [CrossRef]
- Husky, M.M.; Kovess-Masfety, V.; Swendsen, J.D. Stress and anxiety among university students in France during Covid-19 mandatory confinement. Compr. Psychiatry 2020, 102, 152191. [Google Scholar] [CrossRef]
- Son, C.; Hegde, S.; Smith, A.; Wang, X.; Sasangohar, F. Effects of COVID-19 on college students’ mental health in the United States: Interview survey study. J. Med. Internet Res. 2020, 22, e21279. [Google Scholar] [CrossRef]
- Zellner, D.A.; Loaiza, S.; Gonzalez, Z.; Pita, J.; Morales, J.; Pecora, D.; Wolf, A. Food selection changes under stress. Physiol. Behav. 2006, 87, 789–793. [Google Scholar] [CrossRef]
- Zellner, D.A.; Saito, S.; Gonzalez, J. The effect of stress on men’s food selection. Appetite 2007, 49, 696–699. [Google Scholar] [CrossRef]
- Oliver, G.; Wardle, J.; Gibson, E.L. Stress and food choice: A laboratory study. Psychosom. Med. 2000, 62, 853–865. [Google Scholar] [CrossRef]
- Wallis, D.J.; Hetherington, M.M. Emotions and eating. Self-reported and experimentally induced changes in food intake under stress. Appetite 2009, 52, 355–362. [Google Scholar] [CrossRef] [PubMed]
- Keyes, K.M.; Hatzenbuehler, M.L.; Grant, B.F.; Hasin, D.S. Stress and alcohol: Epidemiologic evidence. Alcohol Res. Curr. Rev. 2012, 34, 391–400. [Google Scholar]
- CDC Alcohol & Substance Misuse | Workplace Health Strategies by Condition | Workplace Health Promotion | CDC. Available online: https://www.cdc.gov/workplacehealthpromotion/health-strategies/substance-misuse/index.html (accessed on 15 October 2020).
- Johnson, E.O.; Roth, T.; Breslau, N. The association of insomnia with anxiety disorders and depression: Exploration of the direction of risk. J. Psychiatr. Res. 2006, 40, 700–708. [Google Scholar] [CrossRef] [PubMed]
- Van Reeth, O.; Weibel, L.; Spiegel, K.; Leproult, R.; Dugovic, C.; Maccari, S. Physiology of sleep (review)—Interactions between stress and sleep: From basic research to clinical situations. Sleep Med. Rev. 2000, 4, 201–219. [Google Scholar] [CrossRef]
- Kim, E.-J.; Dimsdale, J.E. The effect of psychosocial stress on sleep: A review of polysomnographic evidence. Behav. Sleep. Med. 2007, 5, 256–278. [Google Scholar] [CrossRef] [PubMed] [Green Version]
- Brondel, L.; Romer, M.A.; Nougues, P.M.; Touyarou, P.; Davenne, D. Acute partial sleep deprivation increases food intake in healthy men. Am. J. Clin. Nutr. 2010, 91, 1550–1559. [Google Scholar] [CrossRef] [PubMed] [Green Version]
- Spaeth, A.M.; Dinges, D.F.; Goel, N. Effects of experimental sleep restriction on weight gain, caloric intake, and meal timing in healthy adults. Sleep 2013, 36, 981–990. [Google Scholar] [CrossRef] [PubMed]
- Markwald, R.R.; Melanson, E.L.; Smith, M.R.; Higgins, J.; Perreault, L.; Eckel, R.H.; Wright, K.P. Impact of insufficient sleep on total daily energy expenditure, food intake, and weight gain. Proc. Natl. Acad. Sci. USA 2013, 110, 5695–5700. [Google Scholar] [CrossRef] [PubMed] [Green Version]
- Kenney, S.R.; Paves, A.P.; Grimaldi, E.M.; LaBrie, J.W. Sleep quality and alcohol risk in college students: Examining the moderating effects of drinking motives. J. Am. Coll. Health 2014, 62, 301–308. [Google Scholar] [CrossRef] [Green Version]
- Skrove, M.; Romundstad, P.; Indredavik, M.S. Resilience, lifestyle and symptoms of anxiety and depression in adolescence: The Young-HUNT study. Soc. Psychiatry Psychiatr. Epidemiol. 2013, 48, 407–416. [Google Scholar] [CrossRef]
- Houpy, J.C.; Lee, W.W.; Woodruff, J.N.; Pincavage, A.T. Medical student resilience and stressful clinical events during clinical training. Med. Educ. Online 2017, 22, 1320187. [Google Scholar] [CrossRef] [PubMed]
- Fletcher, D.; Sarkar, M. Psychological resilience: A review and critique of definitions, concepts, and theory. Eur. Psychol. 2013, 18, 12–23. [Google Scholar] [CrossRef] [Green Version]
- Luthar, S.S.; Cicchetti, D.; Becker, B. The construct of resilience: A critical evaluation and guidelines for future work. Child. Dev. 2000, 71, 543–562. [Google Scholar] [CrossRef]
- Carver, C.S. Resilience and thriving: Issues, models, and linkages. J. Soc. Issues 1998, 54, 245–266. [Google Scholar] [CrossRef]
- Oliver, G.; Wardle, J. Perceived effects of stress on food choice. Physiol. Behav. 1999, 66, 511–515. [Google Scholar] [CrossRef]
- MacKinnon, D.P.; Fairchild, A.J.; Fritz, M.S. Mediation analysis. Annu. Rev. Psychol. 2007, 58, 593. [Google Scholar] [CrossRef]
- Hayes, A.F. Introduction to Mediation, Moderation, and Conditional Process Analysis. In A Regression-Based Approach, 2nd ed.; Guilford Publications: New York, NY, USA, 2017; ISBN 9781462534654. [Google Scholar]
- Cohen, S.; Kamarck, T.; Mermelstein, R. A global measure of perceived stress. J. Health Soc. Behav. 1983, 24, 385–396. [Google Scholar] [CrossRef]
- Smith, B.W.; Dalen, J.; Wiggins, K.; Tooley, E.; Christopher, P.; Bernard, J. The brief resilience scale: Assessing the ability to bounce back. Int. J. Behav. Med. 2008, 15, 194–200. [Google Scholar] [CrossRef]
- Paxton, A.E.; Strycker, L.A.; Toobert, D.J.; Ammerman, A.S.; Glasgow, R.E. Starting the conversation: Performance of a brief dietary assessment and intervention tool for health professionals. Am. J. Prev. Med. 2011, 40, 67–71. [Google Scholar] [CrossRef]
- Bush, K.; Kivlahan, D.R.; McDonell, M.B.; Fihn, S.D.; Bradley, K.A. The AUDIT alcohol consumption questions (AUDIT-C): An effective brief screening test for problem drinking. Arch. Intern. Med. 1998, 158, 1789–1795. [Google Scholar] [CrossRef] [Green Version]
- Aertgeerts, B.; Buntinx, F.; Bande-Knops, J.; Vanderrneulen, C.; Roelants, M.; Ansoms, S.; Fevery, J. The value of CAGE, CUGE, and AUDIT in screening for alcohol abuse and dependence among college freshmen. Alcohol. Clin. Exp. Res. 2000, 24, 53–57. [Google Scholar] [CrossRef] [PubMed]
- Davoren, M.P.; Shiely, F.; Byrne, M.; Perry, I.J. Hazardous alcohol consumption among university students in Ireland: A cross-sectional study. BMJ Open 2015, 5, e006045. [Google Scholar] [CrossRef] [PubMed] [Green Version]
- National Institute on Alcohol Abuse and Alcoholism (NIAAA). Available online: https://www.nih.gov/about-nih/what-we-do/nih-almanac/national-institute-alcohol-abuse-alcoholism-niaaa (accessed on 11 September 2020).
- AUDIT-C Frequently Asked Questions. Available online: https://www.queri.research.va.gov/tools/alcohol-misuse/alcohol-faqs.cfm#6 (accessed on 5 August 2020).
- Buysse, D.J.; Hall, M.L.; Strollo, P.J.; Kamarck, T.W.; Owens, J.; Lee, L.; Reis, S.E.; Matthews, K.A. Relationships between the Pittsburgh Sleep Quality Index (PSQI), Epworth Sleepiness Scale (ESS), and clinical/polysomnographic measures in a community sample. J. Clin. Sleep Med. 2008, 4, 563–571. [Google Scholar] [CrossRef] [PubMed] [Green Version]
- Guo, S.; Sun, W.; Liu, C.; Wu, S. Structural validity of the Pittsburgh Sleep Quality Index in Chinese undergraduate students. Front. Psychol. 2016, 7, 1–7. [Google Scholar] [CrossRef] [PubMed] [Green Version]
- Beaudreau, S.A.; Spira, A.P.; Stewart, A.; Kezirian, E.J.; Lui, L.-Y.; Ensrud, K.; Redline, S.; Ancoli-Israel, S.; Stone, K.L. Validation of the Pittsburgh Sleep Quality Index and the Epworth Sleepiness Scale in older black and white women. Sleep Med. 2012, 13, 36–42. [Google Scholar] [CrossRef] [Green Version]
- Marques, D.; Gomes, A.A.; Meiavia, A.; Salgueiro, A.; Ribeiro, C.C.; Dischler, J. Reliability and initial validation of the Pittsburgh Sleep Quality Index, European Portuguese version: A preliminary study in a sample of higher education students. Sleep Med. 2013, 14, e140. [Google Scholar] [CrossRef] [Green Version]
- Buysse, D.J.; Reynolds, C.F.; Monk, T.H.; Berman, S.R.; Kupfer, D.J. The Pittsburgh Sleep Quality Index: A new instrument for psychiatric practice and research. Psychiatry Res. 1989, 28, 193–213. [Google Scholar] [CrossRef]
- Hirshkowitz, M.; Whiton, K.; Albert, S.M.; Alessi, C.; Bruni, O.; DonCarlos, L.; Hazen, N.; Herman, J.; Katz, E.S.; Kheirandish-Gozal, L.; et al. National Sleep Foundation’s sleep time duration recommendations: Methodology and results summary. Sleep Health 2015, 1, 40–43. [Google Scholar] [CrossRef]
- Hayes, A.F. PROCESS: A Versatile Computational Tool for Observed Variable Mediation, Moderation, and Conditional Process Modeling 1. 2012. Available online: https://www.semanticscholar.org/paper/PROCESS-%3A-A-Versatile-Computational-Tool-for-%2C-%2C-1-Hayes/862dd61cccad6b39ffe890557db19a6356bbe8ca (accessed on 19 October 2020).
- Potthoff, R.F. On the Johnson-Neyman technique and some extensions thereof. Psychometrika 1964, 29, 241–256. [Google Scholar] [CrossRef]
- Adam, T.C.; Epel, E.S. Stress, eating and the reward system. Physiol. Behav. 2007, 91, 449–458. [Google Scholar] [CrossRef]
- Krause, A.J.; Simon, E.B.; Mander, B.A.; Greer, S.M.; Saletin, J.M.; Goldstein-Piekarski, A.N.; Walker, M.P. The sleep-deprived human brain. Nat. Rev. Neurosci. 2017, 18, 404–418. [Google Scholar] [CrossRef]
- Gujar, N.; Yoo, S.-S.; Hu, P.; Walker, M.P. Sleep deprivation amplifies reactivity of brain reward networks, biasing the appraisal of positive emotional experiences. J. Neurosci. 2011, 31, 4466–4474. [Google Scholar] [CrossRef] [PubMed]
- Neisewander, J.L. Sleep deprivation dysregulates brain reward circuitry: Implications for psychiatric disorders. Biol. Psychiatry 2020, 87, 938–939. [Google Scholar] [CrossRef] [PubMed]
- Telzer, E.H.; Fuligni, A.J.; Lieberman, M.D.; Galván, A. The effects of poor quality sleep on brain function and risk taking in adolescence. NeuroImage 2013, 71, 275–283. [Google Scholar] [CrossRef] [PubMed] [Green Version]
- Boozari, B.; Saneei, P.; Safavi, S.M. Association between sleep duration and sleep quality with sugar and sugar-sweetened beverages intake among university students. Sleep Breath. 2020, 1–8. [Google Scholar] [CrossRef] [PubMed]
- Zuraikat, F.M.; Makarem, N.; Liao, M.; St-Onge, M.P.; Aggarwal, B. Aggarwal Brooke Measures of poor sleep quality are associated with higher energy intake and poor diet quality in a diverse sample of women from the Go Red for women strategically focused research network. J. Am. Heart Assoc. 2020, 9, e014587. [Google Scholar] [CrossRef] [PubMed]
- Min, C.; Kim, H.J.; Park, I.S.; Park, B.; Kim, J.H.; Sim, S.; Choi, H.G. The association between sleep duration, sleep quality, and food consumption in adolescents: A cross-sectional study using the Korea Youth Risk Behavior Web-based Survey. BMJ Open 2018, 8, e022848. [Google Scholar] [CrossRef]
- Moubarac, J.-C.; Cargo, M.; Receveur, O.; Daniel, M. Psychological distress mediates the association between daytime sleepiness and consumption of sweetened products: Cross-sectional findings in a Catholic Middle-Eastern Canadian community. BMJ Open 2013, 3, e002298. [Google Scholar] [CrossRef] [Green Version]
- Hanlon, E.C.; Andrzejewski, M.E.; Harder, B.K.; Kelley, A.E.; Benca, R.M. The effect of REM sleep deprivation on motivation for food reward. Behav. Brain Res. 2005, 163, 58–69. [Google Scholar] [CrossRef]
- Greer, S.M.; Goldstein, A.N.; Walker, M.P. The impact of sleep deprivation on food desire in the human brain. Nat. Commun. 2013, 4, 2259. [Google Scholar] [CrossRef] [Green Version]
- Benedict, C.; Brooks, S.J.; O’Daly, O.G.; Almèn, M.S.; Morell, A.; Åberg, K.; Gingnell, M.; Schultes, B.; Hallschmid, M.; Broman, J.E.; et al. Acute sleep deprivation enhances the brain’s response to hedonic food stimuli: An fMRI study. J. Clin. Endocrinol. Metab. 2012, 97, E443–E447. [Google Scholar] [CrossRef] [PubMed]
- St-Onge, M.P.; Roberts, A.L.; Chen, J.; Kelleman, M.; O’Keeffe, M.; RoyChoudhury, A.; Jones, P.J. Short sleep duration increases energy intakes but does not change energy expenditure in normal-weight individuals. Am. J. Clin. Nutr 2011, 94, 410–416. [Google Scholar] [CrossRef] [PubMed] [Green Version]
- Yang, C.L.; Schnepp, J.; Tucker, R.M. Increased hunger, food cravings, food reward, and portion size selection after sleep curtailment in women without obesity. Nutrients 2019, 11, 663. [Google Scholar] [CrossRef] [PubMed] [Green Version]
- Peltzer, K.; Pengpid, S. Sleep duration and health correlates among university students in 26 countries. Psychol. Health Med. 2016, 21, 208–220. [Google Scholar] [CrossRef]
- Steptoe, A. Sleep duration and health in young adults. Arch. Intern. Med. 2006, 166, 1689. [Google Scholar] [CrossRef] [Green Version]
- Borisenkov, M.F.; Vetosheva, V.I.; Kuznetsova, Y.S.; Khodyrev, G.N.; Shikhova, A.V.; Popov, S.V.; Pecherkina, A.A.; Dorogina, O.I.; Symaniuk, E.E. Chronotype, social jetlag, and time perspective. Chronobiol. Int. 2019, 36, 1772–1781. [Google Scholar] [CrossRef]
- Jankowski, K.S. Is the shift in chronotype associated with an alteration in well-being? Biol. Rhythm Res. 2015, 46, 237–248. [Google Scholar] [CrossRef]
- Haraszti, R.Á.; Ella, K.; Gyöngyösi, N.; Roenneberg, T.; Káldi, K. Social jetlag negatively correlates with academic performance in undergraduates. Chronobiol. Int. 2014, 31, 603–612. [Google Scholar] [CrossRef]
- Kenney, S.R.; Lac, A.; LaBrie, J.W.; Hummer, J.F.; Pham, A. Mental health, sleep quality, drinking motives, and alcohol-related consequences: A path-analytic model. J. Stud. Alcohol Drugs 2013, 74, 841–851. [Google Scholar] [CrossRef] [Green Version]
- National Survey on Drug Use and Health (NSDUH-2018) | SAMHDA. Available online: https://www.datafiles.samhsa.gov/study/national-survey-drug-use-and-health-nsduh-2018-nid18757 (accessed on 9 October 2020).
- Thomas, M.; Sing, H.; Belenky, G.; Holcomb, H.; Mayberg, H.; Dannals, R.; Wagner, H.; Thorne, D.; Popp, K.; Rowland, L.; et al. Neural basis of alertness and cognitive performance impairments during sleepiness. I. Effects of 24 h of sleep deprivation on waking human regional brain activity. J. Sleep Res. 2000, 9, 335–352. [Google Scholar] [CrossRef] [Green Version]
- Linde, L.; Bergström, M. The effect of one night without sleep on problem-solving and immediate recall. Psychol. Res. 1992, 54, 127–136. [Google Scholar] [CrossRef] [PubMed]
- Nillson, K.W.; Sjöberg, R.L.; Damberg, M.; Alm, P.O.; Öhrvik, J.; Leppert, J.; Lindström, L.; Oreland, L. Role of the Serotonin Transporter Gene and Family Function in Adolescent Alcohol Consumption. Alcohol. Clin. Exp. Res. 2005, 29, 564–570. [Google Scholar] [CrossRef] [PubMed]
- Wimmer, F.; Hoffmann, R.F.; Bonato, R.A.; Moffitt, A.R. The effects of sleep deprivation on divergent thinking and attention processes. J. Sleep Res. 1992, 1, 223–230. [Google Scholar] [CrossRef]
- Vail-Smith, K.; Felts, W.M.; Becker, C. Relationship between sleep quality and health risk behaviors in undergraduate college students. Coll. Stud. J. 2009, 43, 924–930. [Google Scholar]
- Digdon, N.; Landry, K. University students’ motives for drinking alcohol are related to evening preference, poor sleep, and ways of coping with stress. Biol. Rhythm Res. 2013, 44, 1–11. [Google Scholar] [CrossRef]
- Thakkar, M.M.; Sharma, R.; Sahota, P. Alcohol disrupts sleep homeostasis. Alcohol 2015, 49, 299–310. [Google Scholar] [CrossRef] [Green Version]
- Nilsson, J.P.; Söderström, M.; Karlsson, A.U.; Lekander, M.; Akerstedt, T.; Lindroth, N.E.; Axelsson, J. Less effective executive functioning after one night’s sleep deprivation. J. Sleep Res. 2005, 14, 1–6. [Google Scholar] [CrossRef]
- Strine, T.W.; Chapman, D.P. Associations of frequent sleep insufficiency with health-related quality of life and health behaviors. Sleep Med. 2005, 6, 23–27. [Google Scholar] [CrossRef]
- Chaput, J.P.; McNeil, J.; Després, J.P.; Bouchard, C.; Tremblay, A. Short sleep duration is associated with greater alcohol consumption in adults. Appetite 2012, 59, 650–655. [Google Scholar] [CrossRef]
- Mike, T.B.; Shaw, D.S.; Forbes, E.E.; Sitnick, S.L.; Hasler, B.P. The hazards of bad sleep—Sleep duration and quality as predictors of adolescent alcohol and cannabis use. Drug Alcohol Depend. 2016, 168, 335–339. [Google Scholar] [CrossRef] [Green Version]
- Li, L.; Wang, Y.-Y.; Wang, S.-B.; Li, L.; Lu, L.; Ng, C.H.; Ungvari, G.S.; Chiu, H.F.K.; Hou, C.-L.; Jia, F.-J.; et al. Sleep duration and sleep patterns in Chinese university students: A comprehensive meta-analysis. J. Clin. Sleep Med. 2017, 13, 1153–1162. [Google Scholar] [CrossRef] [PubMed] [Green Version]
- Van der Heijden, K.B.; Vermeulen, M.C.M.; Donjacour, C.E.H.M.; Gordijn, M.C.M.; Hamburger, H.L.; Meijer, A.M.; van Rijn, K.J.; Vlak, M.; Weysen, T. Chronic sleep reduction is associated with academic achievement and study concentration in higher education students. J. Sleep Res. 2018, 27, 165–174. [Google Scholar] [CrossRef] [PubMed]
- Becker, S.P.; Jarrett, M.A.; Luebbe, A.M.; Garner, A.A.; Burns, G.L.; Kofler, M.J. Sleep in a large, multi-university sample of college students: Sleep problem prevalence, sex differences, and mental health correlates. Sleep Health 2018, 4, 174–181. [Google Scholar] [CrossRef] [PubMed]
- Bickerdike, A.; Dinneen, J.; O’Neill, C. ‘A Healthy CIT’: An investigation into student health metrics, lifestyle behaviours and the predictors of positive mental health in an Irish higher education setting. Int. J. Environ. Res. Public. Health 2019, 16, 4318. [Google Scholar] [CrossRef] [PubMed] [Green Version]
- Marelli, S.; Castelnuovo, A.; Somma, A.; Castronovo, V.; Mombelli, S.; Bottoni, D.; Leitner, C.; Fossati, A.; Ferini-Strambi, L. Impact of COVID-19 lockdown on sleep quality in university students and administration staff. J. Neurol. 2020, 1–8. [Google Scholar] [CrossRef]
- Cellini, N.; Canale, N.; Mioni, G.; Costa, S. Changes in sleep pattern, sense of time and digital media use during COVID-19 lockdown in Italy. J. Sleep Res. 2020, 29, e13074. [Google Scholar] [CrossRef]
- Sañudo Corrales, F.D.B.; Fenell, C.; Sánchez Oliver, A.J. Objectively-assessed physical activity, sedentary behavior, smartphone use, and sleep patterns pre- and during-COVID-19 quarantine in young adults from Spain. Sustainability 2020, 12, 5890. [Google Scholar] [CrossRef]
- Romero-Blanco, C.; Rodríguez-Almagro, J.; Onieva-Zafra, M.D.; Parra-Fernández, M.L.; Prado-Laguna, M.D.C.; Hernández-Martínez, A. Sleep pattern changes in nursing students during the COVID-19 lockdown. Int. J. Environ. Res. Public. Health 2020, 17, 5222. [Google Scholar] [CrossRef]
- Lemola, S.; Ledermann, T.; Friedman, E.M. Variability of sleep duration is related to subjective sleep quality and subjective well-being: An actigraphy study. PLoS ONE 2013, 8, e71292. [Google Scholar] [CrossRef] [Green Version]
- Tugade, M.M.; Fredrickson, B.L.; Barrett, L.F. Psychological resilience and positive emotional granularity: Examining the benefits of positive emotions on coping and health. J. Pers. 2004, 72, 1161–1190. [Google Scholar] [CrossRef]
- Ong, A.D.; Bergeman, C.S.; Bisconti, T.L.; Wallace, K.A. Psychological resilience, positive emotions, and successful adaptation to stress in later life. J. Pers. Soc. Psychol. 2006, 91, 730–749. [Google Scholar] [CrossRef] [PubMed] [Green Version]
- Verhoog, S.; Dopmeijer, J.M.; de Jonge, J.M.; van der Heijde, C.M.; Vonk, P.; Bovens, R.H.L.M.; de Boer, M.R.; Hoekstra, T.; Kunst, A.E.; Wiers, R.W.; et al. The use of the alcohol use disorders identification test–Consumption as an indicator of hazardous alcohol use among university students. Eur. Addict. Res. 2020, 26, 1–9. [Google Scholar] [CrossRef] [PubMed]
- Mekonen, T.; Fekadu, W.; Chane, T.; Bitew, S. Problematic alcohol use among university students. Front. Psychiatry 2017, 8, 86. [Google Scholar] [CrossRef] [PubMed] [Green Version]
- Kim, S.Y.; Ahn, S.; Lim, T.S. Predicting alcohol misuse among college students in the US and South Korea. J. Ethn. Subst. Abuse. 2015, 14, 308–322. [Google Scholar] [CrossRef]
- Jang, S.M.; Sohn, S.; Yu, M. Perceived stress, alcohol consumption, and Internet use among Korean college students: Does sensation-seeking matter? Child. Youth Serv. Rev. 2018, 88, 354–360. [Google Scholar] [CrossRef]
- Beck, K.H.; Arria, A.M.; Caldeira, K.M.; Vincent, K.B.; O’Grady, K.E.; Wish, E.D. Social context of drinking and alcohol problems among college students. Am. J. Health Behav. 2008, 32, 420–430. [Google Scholar] [CrossRef] [Green Version]
- Németh, Z.; Urbán, R.; Kuntsche, E.; San Pedro, E.M.; Roales Nieto, J.G.; Farkas, J.; Futaki, L.; Kun, B.; Mervó, B.; Oláh, A.; et al. Drinking motives among Spanish and Hungarian young adults: A cross-national study. Alcohol Alcohol 2011, 46, 261–269. [Google Scholar] [CrossRef]
- Healthy_Minds_NCHA_COVID_Survey_Report_FINAL.pdf. Available online: https://healthymindsnetwork.org/wp-content/uploads/2020/07/Healthy_Minds_NCHA_COVID_Survey_Report_FINAL.pdf (accessed on 19 October 2020).
- Prichard, J.R.; Hartmann, M.E. Follow-up to Hartmann & Prichard: Should universities invest in promoting healthy sleep? A question of academic and economic significance. Sleep Health 2019, 5, 320–325. [Google Scholar] [CrossRef]
- Center for Colegiate Mental Health (CCMH) 2017 Annual Report. Available online: https://sites.psu.edu/ccmh/files/2018/01/2017_CCMH_Report-1r3iri4.pdf (accessed on 19 October 2020).
- Ahrberg, K.; Dresler, M.; Niedermaier, S.; Steiger, A.; Genzel, L. The interaction between sleep quality and academic performance. J. Psychiatr. Res. 2012, 46, 1618–1622. [Google Scholar] [CrossRef]
- Gilbert, S.P.; Weaver, C.C. Sleep quality and academic performance in university students: A wake-up call for college psychologists. J. Coll. Stud. Psychother. 2010, 24, 295–306. [Google Scholar] [CrossRef]
- Fatima, Y.; Doi, S.A.R.; Mamun, A.A. Sleep quality and obesity in young subjects: A meta-analysis. Obes. Rev. 2016, 17, 1154–1166. [Google Scholar] [CrossRef] [PubMed]
- Stenholm, S.; Head, J.; Kivimäki, M.; Magnusson Hanson, L.L.; Pentti, J.; Rod, N.H.; Clark, A.J.; Oksanen, T.; Westerlund, H.; Vahtera, J. Sleep duration and sleep disturbances as predictors of healthy and chronic disease–free life expectancy between ages 50 and 75: A pooled analysis of three cohorts. J. Gerontol. Ser. A 2019, 74, 204–210. [Google Scholar] [CrossRef] [PubMed] [Green Version]
- Wells, M.E.; Vaughn, B.V. Poor sleep challenging the health of a nation. Neurodiagnostic. J. 2012, 52, 233–249. [Google Scholar] [CrossRef]
- Hartmann, M.E.; Prichard, J.R. Calculating the contribution of sleep problems to undergraduates’ academic success. Sleep Health 2018, 4, 463–471. [Google Scholar] [CrossRef] [PubMed]
- Levenson, J.C.; Miller, E.; Hafer, B.; Reidell, M.F.; Buysse, D.J.; Franzen, P.L. Pilot study of a sleep health promotion program for college students. Sleep Health 2016, 2, 167–174. [Google Scholar] [CrossRef] [Green Version]
- Hershner, S.; O’Brien, L.M. The impact of a randomized sleep education intervention for college students. J. Clin. Sleep Med. Jcsm Off. Publ. Am. Acad. Sleep Med. 2018, 14, 337–347. [Google Scholar] [CrossRef] [Green Version]
- Friedrich, A.; Schlarb, A.A. Let’s talk about sleep: A systematic review of psychological interventions to improve sleep in college students. J. Sleep Res. 2018, 27, 4–22. [Google Scholar] [CrossRef] [Green Version]
- Bowen, L. Assessing the effectiveness of online cognitive behavioral therapy in adults with chronic insomnia: A systematic review and meta-analysis. Lynchburg. J. Med. Sci. 2019, 33, 1. [Google Scholar]
- Peng, L.; Li, M.; Zuo, X.; Miao, Y.; Chen, L.; Yu, Y.; Liu, B.; Wang, T. Application of the Pennsylvania resilience training program on medical students. Personal. Individ. Differ. 2014, 61, 47–51. [Google Scholar] [CrossRef]
- Kunzler, A.M.; Helmreich, I.; König, J.; Chmitorz, A.; Wessa, M.; Binder, H.; Lieb, K. Psychological interventions to foster resilience in healthcare students. Cochrane Database Syst. Rev. 2020, 7, 1–340. [Google Scholar] [CrossRef]
- Zamirinejad, S.; Hojjat, S.K.; Golzari, M.; Borjali, A.; Akaberi, A. Effectiveness of resilience training versus cognitive therapy on reduction of depression in female Iranian college students. Issues Ment. Health Nurs. 2014, 35, 480–488. [Google Scholar] [CrossRef] [PubMed]
- Galante, J.; Dufour, G.; Vainre, M.; Wagner, A.P.; Stochl, J.; Benton, A.; Lathia, N.; Howarth, E.; Jones, P.B. A mindfulness-based intervention to increase resilience to stress in university students (the Mindful Student Study): A pragmatic randomised controlled trial. Lancet Public Health 2018, 3, e72–e81. [Google Scholar] [CrossRef] [Green Version]


| Sex n (%) | Undergraduate vs. Graduate n (%) | Domestic vs. International n (%) | Age (y) Mean ± SD | BMI (kg/m2) Mean ± SD |
|---|---|---|---|---|
| M = 694 (30.8) F = 1502 (66.7) Other * = 44 (2.0) UD = 14 (0.5) Total = 2254 | U = 1802 (79.9) G = 452 (20.1) | D = 1962 (87.0) I = 292 (13.0) | 22.5 ± 5.5 | 24.4 ± 5.6 |
| Location | Social Restriction Measures in Place | n (% to Total) |
|---|---|---|
| China | Mixture of online and return to in-person classes | 111 (4.9) |
| Ireland | Online classes only | 192 (8.5) |
| Malaysia | Online classes only | 91 (4.0) |
| South Korea | Mixture of online and return to in-person classes | 89 (3.9) |
| Taiwan | Mixture of online and return to in-person classes | 377 (15.0) |
| The Netherlands | Online classes only | 114 (5.1) |
| United States | Online classes only | 1278 (58.7) |
| Measures a | Mean ± SD | 1 | 2 | 3 | 4 | 5 | 6 | 7 | 8 |
|---|---|---|---|---|---|---|---|---|---|
| (1) Dietary behaviors (STC scores) | 7.8 ± 2.8 | - | 0.08 | 0.20 * | 0.18 * | 0.02 | −0.20 * | −0.04 | 0.18 * |
| (2) Alcohol misuse (AUDIT-C scores) | 3.1 ± 2.7 | - | 0.09 * | 0.14 * | −0.02 | 0.002 | −0.04 | 0.12 * | |
| (3) Perceived stress (PSS-10 scores) | 20.6 ± 6.8 | - | 0.43 * | −0.05 | −0.50 * | −0.12 * | 0.12 * | ||
| (4) Sleep quality (PSQI scores) | 6.8 ± 3.5 | - | −0.33 * | −0.28 * | 0.04 | 0.19 * | |||
| (5) Sleep duration (hours) | 7.5 ± 1.2 | - | 0.05 | −0.11 * | −0.06 | ||||
| (6) Resilience (BRS scores) | 3.2 ± 0.7 | - | 0.09 * | −0.03 | |||||
| (7) Age (years) | 22.5 ± 5.5 | - | 0.17 * | ||||||
| (8) BMI (kg/m2) | 24.4 ± 5.6 | - |
| Alcohol Misuse | Stress Levels | Sleep Quality | Sleep Duration | |
|---|---|---|---|---|
| Percentage of students for each classification † | 22.8% misuse female 32.1% misuse male 77.2% no misuse female 67.9% no misuse male | 15.0% low stress 63.2% moderate stress 21.8% high stress | 60.0% poor sleeper 40.0% good sleeper | 72.2% met sleep duration 27.8% did not meet sleep duration |
| Diet | Sleep Quality | Alcohol Use * | Sleep Duration | Perceived Stress | Resilience | ||
|---|---|---|---|---|---|---|---|
| Worse | 35.2% | 32.0% | More | 16.8% | 44.6% | 60.2% | 19.5% |
| Better | 26.6% | 15.5% | Less | 21.6% | 17.1% | 13.0% | 29.5% |
| No change | 38.2% | 52.3% | No change | 39.7% | 38.2% | 26.8% | 51.0% |
| Net effect | 8.6% worse | 16.5% worse | 4.8% better | 27.5% better | 47.2% worse | 10.0% worse |
| Variables | B | SE | t | p Value |
| Perceived stress → sleep quality | 0.35 | 0.04 | 8.42 | <0.001 |
| Sleep quality → dietary behaviors | 0.01 | 0.08 | 0.11 | 0.916 |
| Perceived stress → dietary behaviors | 0.12 | 0.04 | 3.12 | 0.002 |
| Bootstrap | Effect | SE | LL 95%CI | UL 95% CI |
| Sleep quality | 0.02 | 0.004 | 0.008 | 0.023 |
| Variables | ||||
|---|---|---|---|---|
| Moderation Path 1 | B | SE | t | pValue |
| Resilience → sleep quality | −0.65 | 0.29 | −2.21 | 0.03 |
| Perceived stress × resilience → sleep quality | −0.05 | 0.01 | −4.35 | <0.001 |
| Moderation Path 2 | B | SE | t | pValue |
| Perceived stress × resilience → dietary behaviors | −0.03 | 0.01 | −2.27 | 0.023 |
| Sleep quality × resilience → dietary behaviors | 0.02 | 0.02 | 1.01 | 0.313 |
| Conditional Indirect Effect of Resilience in Moderation Path 1 | Resilience Scores | Effect (SE) | LL 95% CI | UL 95% CI |
| 2.44 | 0.22 (0.02) | 0.19 | 0.25 | |
| 3.21 | 0.18 (0.01) | 0.16 | 0.21 | |
| 3.97 | 0.14 (0.01) | 0.12 | 0.17 | |
| Conditional Indirect Effect of Resilience Johnson-Neyman Test | Resilience Scores | Indirect Effect (SE) | LL 95% CI | UL 95% CI |
| 1.00 | 0.30 (0.03) | 0.24 | 0.36 | |
| 1.80 | 0.26 (0.02) | 0.21 | 0.30 | |
| 2.60 | 0.21 (0.02) | 0.19 | 0.24 | |
| 3.40 | 0.17 (0.01) | 0.15 | 0.20 | |
| 4.20 | 0.13 (0.02) | 0.10 | 0.16 | |
| 4.40 | 0.12 (0.02) | 0.09 | 0.16 | |
| 4.60 | 0.11 (0.02) | 0.07 | 0.15 | |
| 4.80 | 0.10 (0.02) | 0.06 | 0.14 | |
| 5.00 | 0.09 (0.02) | 0.05 | 0.14 | |
| Conditional Direct Effect of Resilience in Moderation Path 2 | Resilience Scores | Effect (SE) | LL 95% CI | UL 95% CI |
| 2.44 | 0.06 (0.01) | 0.03 | 0.09 | |
| 3.21 | 0.04 (0.01) | 0.02 | 0.06 | |
| 3.97 | 0.02 (0.01) | −0.004 | 0.05 | |
| Conditional Direct Effect of Resilience Johnson-Neyman Test | Resilience Scores | Direct Effect (SE) | LL 95% CI | UL 95% CI |
| 1.00 | 0.10 (0.03) | 0.04 | 0.15 | |
| 1.80 | 0.08 (0.02) | 0.04 | 0.12 | |
| 2.60 | 0.06 (0.01) | 0.03 | 0.08 | |
| 3.40 | 0.04 (0.01) | 0.01 | 0.06 | |
| 3.87 * | 0.02 (0.01) | 0.00 | 0.05 | |
| 4.40 | 0.01 (0.02) | −0.02 | 0.04 | |
| 4.60 | 0.01(0.02) | −0.03 | 0.04 | |
| 4.80 | 0.001 (0.02) | −0.04 | 0.04 | |
| 5.00 | −0.005 (0.02) | −0.05 | 0.04 |
| Variables | B | SE | t | pValue |
| Perceived stress → sleep duration | −0.04 | 0.02 | −2.79 | 0.005 |
| Sleep duration → dietary behaviors | 0.06 | 0.18 | 0.35 | 0.726 |
| Perceived stress → dietary behaviors | 0.12 | 0.03 | 3.59 | <0.001 |
| Bootstrap | Effect | SE | LL 95% CI | UL 95% CI |
| Sleep duration | −0.002 | 0.001 | −0.004 | 0.0002 |
| Variables | ||||
|---|---|---|---|---|
| Moderation Path 1 | B | SE | t | pValue |
| Resilience → sleep duration | −0.21 | 0.11 | −1.89 | 0.06 |
| Perceived stress × resilience → sleep duration | 0.01 | 0.005 | 1.72 | 0.09 |
| Moderation Path 2 | B | SE | t | pValue |
| Resilience → dietary behaviors | 0.01 | 0.50 | 0.03 | 0.978 |
| Perceived stress × resilience → dietary behaviors | −0.02 | 0.01 | −2.41 | 0.016 |
| Sleep duration × resilience → dietary behaviors | 0.01 | 0.06 | 0.19 | 0.851 |
| Conditional Indirect Effect of Resilience in Moderation Path 1 | Resilience Scores | Effect (SE) | LL 95% CI | UL 95% CI |
| 2.44 | −0.03 (0.01) | −0.04 | −0.01 | |
| 3.21 | −0.02 (0.01) | −0.03 | −0.01 | |
| 3.97 | −0.01 (0.01) | −0.02 | −0.002 | |
| Conditional Direct Effect of Resilience in Moderation Path 2 | Resilience Scores | Effect (SE) | LL 95% CI | UL 95% CI |
| 2.44 | 0.07 (0.01) | 0.04 | 0.09 | |
| 3.21 | 0.05 (0.01) | 0.03 | 0.07 | |
| 3.97 | 0.03 (0.01) | 0.01 | 0.05 | |
| Conditional Direct Effect of Resilience Johnson-Neyman test | Resilience Scores | Direct Effect (SE) | LL 95% CI | UL 95% CI |
| 1.00 | 0.10 (0.03) | 0.05 | 0.15 | |
| 1.80 | 0.08 (0.02) | 0.05 | 0.12 | |
| 2.60 | 0.06 (0.01) | 0.04 | 0.09 | |
| 3.40 | 0.04 (0.01) | 0.02 | 0.06 | |
| 4.16 * | 0.03 (0.01) | 0.00 | 0.05 | |
| 4.40 | 0.02 (0.01) | −0.01 | 0.05 | |
| 4.60 | 0.01(0.02) | −0.02 | 0.05 | |
| 4.80 | 0.01 (0.02) | −0.03 | 0.04 | |
| 5.00 | 0.005 (0.02) | −0.03 | 0.04 |
| Variables | B | SE | t | pValue |
| Perceived stress → sleep quality | 0.39 | 0.05 | 8.44 | <0.001 |
| Sleep quality → alcohol misuse | 0.14 | 0.08 | 1.60 | 0.109 |
| Perceived stress → alcohol misuse | −0.05 | 0.04 | −1.04 | 0.299 |
| Bootstrap | Effect | SE | LL 95% CI | UL 95% CI |
| Sleep quality | 0.02 | 0.004 | 0.009 | 0.025 |
| Variables | ||||
|---|---|---|---|---|
| Moderation Path 1 | B | SE | t | pValue |
| Resilience → sleep quality | −0.93 | 0.32 | −2.91 | 0.004 |
| Perceived stress × resilience → sleep quality | −0.06 | 0.01 | −4.55 | <0.001 |
| Moderation Path 2 | B | SE | t | pValue |
| Resilience → alcohol misuse | −0.08 | 0.28 | −0.29 | 0.771 |
| Perceived stress × resilience → alcohol misuse | 0.02 | 0.01 | 1.59 | 0.112 |
| Sleep quality × resilience → alcohol misuse | −0.01 | 0.03 | −0.56 | 0.573 |
| Conditional Indirect Effect of Resilience in Moderation Path 1 | Resilience Scores | Effect (SE) | LL 95% CI | UL 95% CI |
| 2.49 | 0.23 (0.02) | 0.20 | 0.27 | |
| 3.18 | 0.19 (0.01) | 0.16 | 0.21 | |
| 3.88 | 0.14 (0.02) | 0.12 | 0.18 | |
| Conditional Indirect Effect of Resilience Johnson-Neyman Test | Resilience Scores | Indirect Effect (SE) | LL 95% CI | UL 95% CI |
| 1.00 | 0.33(0.03) | 0.26 | 0.39 | |
| 1.80 | 0.28 (0.02) | 0.23 | 0.32 | |
| 2.60 | 0.23 (0.02) | 0.20 | 0.26 | |
| 3.40 | 0.18 (0.01) | 0.15 | 0.20 | |
| 4.20 | 0.13 (0.02) | 0.09 | 0.16 | |
| 4.40 | 0.12 (0.02) | 0.07 | 0.15 | |
| 4.60 | 0.10 (0.02) | 0.06 | 0.15 | |
| 4.80 | 0.09 (0.03) | 0.04 | 0.14 | |
| 5.00 | 0.08 (0.03) | 0.02 | 0.13 | |
| Conditional Direct Effect of resilience in moderation path 2 | Resilience Scores | Effect (SE) | LL 95% CI | UL 95% CI |
| 2.49 | 0.01 (0.02) | −0.02 | 0.04 | |
| 3.18 | 0.02 (0.01) | −0.003 | 0.04 | |
| 3.88 | 0.03 (0.02) | 0.01 | 0.06 |
| Variables | B | SE | t | pValue |
| Perceived stress → sleep duration | −0.02 | 0.02 | −1.02 | 0.310 |
| Sleep duration → alcohol misuse | −0.06 | 0.21 | −0.27 | 0.789 |
| Perceived stress → alcohol misuse | 0.001 | 0.04 | 0.03 | 0.975 |
| Bootstrap | Effect | SE | LL 95% CI | UL 95% CI |
| Sleep duration | 0.0002 | 0.0004 | −0.0006 | 0.0013 |
| Variables | ||||
|---|---|---|---|---|
| Moderation Path 1 | B | SE | t | pValue |
| Resilience → sleep duration | 0.01 | 0.12 | −1.02 | 0.310 |
| Perceived stress × resilience → sleep duration | 0.004 | 0.01 | 0.79 | 0.431 |
| Moderation Path 2 | B | SE | t | pValue |
| Resilience → alcohol misuse | −0.07 | 0.58 | −0.13 | 0.900 |
| Perceived stress × resilience → alcohol misuse | 0.01 | 0.01 | 0.95 | 0.344 |
| Sleep duration × resilience → alcohol misuse | 0.01 | 0.07 | 0.10 | 0.917 |
| Conditional Direct Effect of Resilience in Moderation Path 2 | Resilience Scores | Effect (SE) | LL 95% CI | UL 95% CI |
| 2.49 | 0.03 (0.02) | 0.001 | 0.06 | |
| 3.18 | 0.04 (0.01) | 0.02 | 0.06 | |
| 3.88 | 0.04 (0.01) | 0.03 | 0.07 |
Publisher’s Note: MDPI stays neutral with regard to jurisdictional claims in published maps and institutional affiliations. |
© 2021 by the authors. Licensee MDPI, Basel, Switzerland. This article is an open access article distributed under the terms and conditions of the Creative Commons Attribution (CC BY) license (http://creativecommons.org/licenses/by/4.0/).
Share and Cite
Du, C.; Zan, M.C.H.; Cho, M.J.; Fenton, J.I.; Hsiao, P.Y.; Hsiao, R.; Keaver, L.; Lai, C.-C.; Lee, H.; Ludy, M.-J.; et al. The Effects of Sleep Quality and Resilience on Perceived Stress, Dietary Behaviors, and Alcohol Misuse: A Mediation-Moderation Analysis of Higher Education Students from Asia, Europe, and North America during the COVID-19 Pandemic. Nutrients 2021, 13, 442. https://0-doi-org.brum.beds.ac.uk/10.3390/nu13020442
Du C, Zan MCH, Cho MJ, Fenton JI, Hsiao PY, Hsiao R, Keaver L, Lai C-C, Lee H, Ludy M-J, et al. The Effects of Sleep Quality and Resilience on Perceived Stress, Dietary Behaviors, and Alcohol Misuse: A Mediation-Moderation Analysis of Higher Education Students from Asia, Europe, and North America during the COVID-19 Pandemic. Nutrients. 2021; 13(2):442. https://0-doi-org.brum.beds.ac.uk/10.3390/nu13020442
Chicago/Turabian StyleDu, Chen, Megan Chong Hueh Zan, Min Jung Cho, Jenifer I. Fenton, Pao Ying Hsiao, Richard Hsiao, Laura Keaver, Chang-Chi Lai, HeeSoon Lee, Mary-Jon Ludy, and et al. 2021. "The Effects of Sleep Quality and Resilience on Perceived Stress, Dietary Behaviors, and Alcohol Misuse: A Mediation-Moderation Analysis of Higher Education Students from Asia, Europe, and North America during the COVID-19 Pandemic" Nutrients 13, no. 2: 442. https://0-doi-org.brum.beds.ac.uk/10.3390/nu13020442