
Inedible Food Waste Linked to Diet Quality and Food Spending in the Seattle Obesity Study SOS III

 , ,
, ,
Abstract
:1. Introduction
2. Methods
Study Design and Participants
3. Methods and Procedures
3.1. Computer-Assisted Health Behavior Survey
3.2. Dietary Intakes Data and Inedible Food Waste
3.3. Energy-Adjusted Diet Cost
3.4. Percent Energy from Ultra-Processed Foods
3.5. Diet Quality Measures
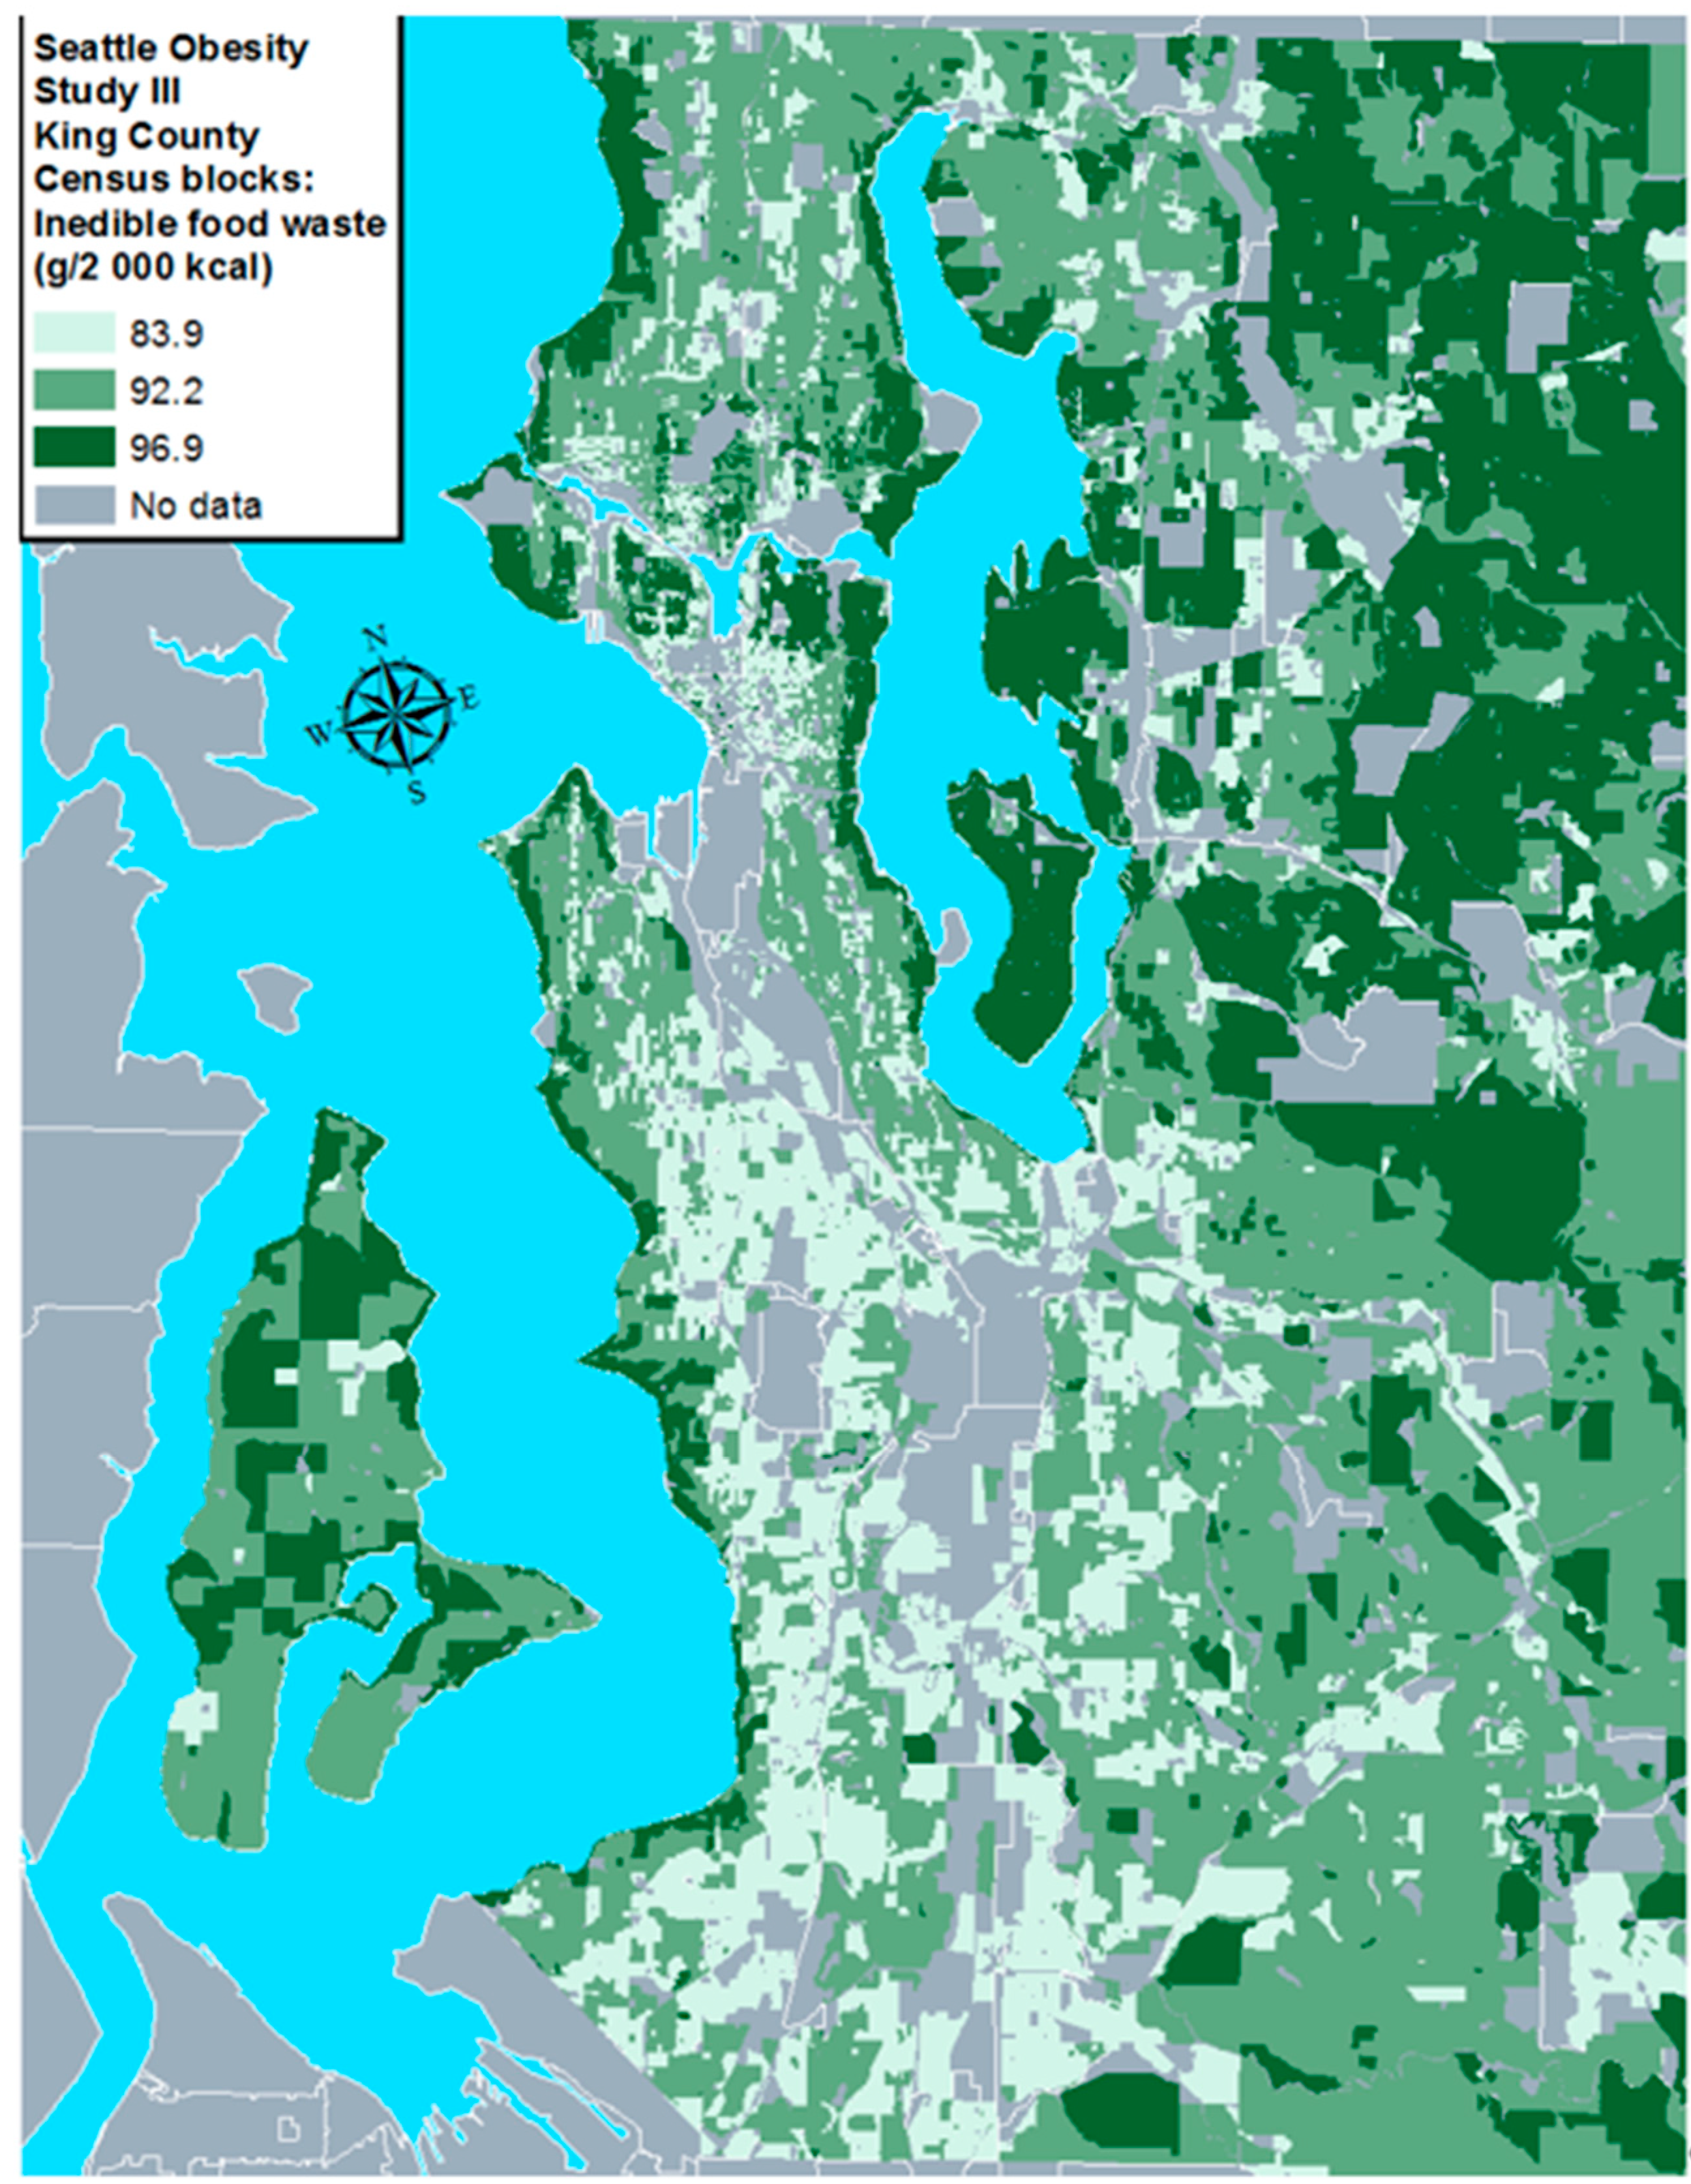
3.6. Data Visualization
3.7. Statistical Analysis
4. Results
5. Discussion
6. Conclusions
Author Contributions
Funding
Institutional Review Board Statement
Informed Consent Statement
Data Availability Statement
Conflicts of Interest
References
- Conrad, Z.; Niles, M.T.; Neher, D.A.; Roy, E.D.; Tichenor, N.E.; Jahns, L. Relationship between food waste, diet quality, and environmental sustainability. PLoS ONE 2018, 13, e0195405. [Google Scholar] [CrossRef] [PubMed]
- Conrad, Z. Daily cost of consumer food wasted, inedible, and consumed in the United States, 2001–2016. Nutr. J. 2020, 19, 35–39. [Google Scholar] [CrossRef] [PubMed]
- Spiker, M.L.; Hiza, H.A.; Siddiqi, S.M.; Neff, R. Wasted Food, Wasted Nutrients: Nutrient Loss from Wasted Food in the United States and Comparison to Gaps in Dietary Intake. J. Acad. Nutr. Diet. 2017, 117, 1031–1040.e22. [Google Scholar] [CrossRef] [PubMed] [Green Version]
- Neff, R.; Kanter, R.; Vandevijvere, S. Reducing Food Loss and Waste While Improving the Public’s Health. Health Aff. 2015, 34, 1821–1829. [Google Scholar] [CrossRef] [Green Version]
- Kummu, M.; De Moel, H.; Porkka, M.; Siebert, S.; Varis, O.; Ward, P.J. Lost food, wasted resources: Global food supply chain losses and their impacts on freshwater, cropland, and fertiliser use. Sci. Total. Environ. 2012, 438, 477–489. [Google Scholar] [CrossRef]
- Thyberg, K.L.; Tonjes, D.J. Drivers of food waste and their implications for sustainable policy development. Resour. Conserv. Recycl. 2016, 106, 110–123. [Google Scholar] [CrossRef]
- Thyberg, K.L.; Tonjes, D.J.; Gurevitch, J. Quantification of Food Waste Disposal in the United States: A Meta-Analysis. Environ. Sci. Technol. 2015, 49, 13946–13953. [Google Scholar] [CrossRef] [Green Version]
- Parfitt, J.; Barthel, M.; Macnaughton, S. Food waste within food supply chains: Quantification and potential for change to 2050. Philos. Trans. R. Soc. B: Biol. Sci. 2010, 365, 3065–3081. [Google Scholar] [CrossRef] [Green Version]
- King County Solid Waste Division. Organics Characterization. King County Waste Monitoring 2014; King County: Seattle, WA, USA, 2015. [Google Scholar]
- USDA Food Yields. Summarized by Different Stages of Preparation. Agriculture Handbook No. 102; Agricultural Research Service: Washington, DC, USA, 1975. [Google Scholar]
- Gupta, S.; Hawk, T.; Aggarwal, A.; Drewnowski, A. Characterizing Ultra-Processed Foods by Energy Density, Nutrient Density, and Cost. Front. Nutr. 2019, 6, 70. [Google Scholar] [CrossRef] [Green Version]
- Gupta, S.; Rose, C.M.; Buszkiewicz, J.; Ko, L.K.; Mou, J.; Cook, A.; Aggarwal, A.; Drewnowski, A. Characterizing Percent Energy from Ultra-Processed Foods by Participant Demographics, Diet Quality, and Diet Cost Findings from the Seattle Obesity Study SOS III. Br. J. Nutr. 2020, 1–9. [Google Scholar] [CrossRef]
- Buszkiewicz, J.; Rose, C.; Gupta, S.; Ko, L.K.; Mou, J.; Moudon, A.V.; Hurvitz, P.; Cook, A.; Aggarwal, A.; Drewnowski, A. A cross-sectional analysis of physical activity and weight misreporting in diverse populations: The Seattle Obesity Study III. Obes. Sci. Pract. 2020, 6, 615–627. [Google Scholar] [CrossRef] [PubMed]
- Rose, C.M.; Gupta, S.; Buszkiewicz, J.; Ko, L.K.; Mou, J.; Cook, A.; Moudon, A.V.; Aggarwal, A.; Drewnowski, A. Small increments in diet cost can improve compliance with the Dietary Guidelines for Americans. Soc. Sci. Med. 2020, 266, 113359. [Google Scholar] [CrossRef]
- Drewnowski, A.; Aggarwal, A.; Cook, A.J.; Stewart, O.; Moudon, A.V. Geographic disparities in Healthy Eating Index scores (HEI–2005 and 2010) by residential property values: Findings from Seattle Obesity Study (SOS). Prev. Med. 2016, 83, 46–55. [Google Scholar] [CrossRef] [Green Version]
- Monsivais, P.; McLain, J.; Drewnowski, A. The rising disparity in the price of healthful foods: 2004–2008. Food Policy 2010, 35, 514–520. [Google Scholar] [CrossRef] [Green Version]
- Aggarwal, A.; Monsivais, P.; Cook, A.J.; Drewnowski, A. Does diet cost mediate the relation between socioeconomic position and diet quality? Eur. J. Clin. Nutr. 2011, 65, 1059–1066. [Google Scholar] [CrossRef] [Green Version]
- Monteiro, C.A.; Cannon, G.; Levy, R.B.; Moubarac, J.-C.; Louzada, M.L.; Rauber, F.; Khandpur, N.; Cediel, G.; Neri, D.; Martinez-Steele, E.; et al. Ultra-processed foods: What they are and how to identify them. Public Health Nutr. 2019, 22, 936–941. [Google Scholar] [CrossRef]
- Krebs-Smith, S.M.; Pannucci, T.E.; Subar, A.F.; Kirkpatrick, S.I.; Lerman, J.L.; Tooze, J.A.; Wilson, M.M.; Reedy, J. Update of the Healthy Eating Index: HEI-2015. J. Acad. Nutr. Diet. 2018, 118, 1591–1602. [Google Scholar] [CrossRef] [Green Version]
- USDA. Healthy Eating Index (HEI). Available online: https://www.cnpp.usda.gov/healthyeatingindex (accessed on 14 November 2019).
- Drewnowski, A.; Buszkiewicz, J.; Aggarwal, A. Soda, salad, and socioeconomic status: Findings from the Seattle Obesity Study (SOS). SSM—Popul. Health 2019, 7, 100339. [Google Scholar] [CrossRef]
- Drewnowski, A.; Buszkiewicz, J.; Aggarwal, A.; Cook, A.; Moudon, A.V. A new method to visualize obesity prevalence in Seattle-King County at the census block level. Obes. Sci. Pract. 2017, 4, 14–19. [Google Scholar] [CrossRef] [Green Version]
- ESRI. ArcGIS Desktop: Release 10. Redlands, CA: Environmental Systems Research Institute; ESRI: Redlands, CA, USA, 2011. [Google Scholar]
- IBM. IBM SPSS Statistics for Windows, Version 22.0; IBM Corp.: Armonk, NY, USA, 2013. [Google Scholar]
- Carroll, N.; Wallace, A.; Jewell, K.; Darlington, G.; Ma, D.W.L.; Duncan, A.M.; Parizeau, K.; Von Massow, M.; Haines, J. Association between diet quality and food waste in Canadian families: A cross-sectional study. Nutr. J. 2020, 19, 1–8. [Google Scholar] [CrossRef]
- FCID, US Environmental Protection Agency. Food Commodity Intake Database (FCID) 2005–2010. 2010. Available online: http://fcid.foodrisk.org/# (accessed on 24 October 2019).
- LAFA, US Department of Agriculture, Economic Research Service (ERS). Loss-Adjusted Food Availability (LAFA) Data Series Documentation. 2019. Available online: https://www.ers.usda.gov/data-products/food-availability-per-capita-data-system/loss-adjusted-food-availability-documentation/ (accessed on 30 January 2021).
- HUNTER: Food Study 2020. America Gets Cooking: The Impact of COVID-19 on Americans’ Food Habits. Available online: https://www.prnewswire.com/news-releases/america-gets-cooking-301041036.html (accessed on 30 January 2021).
- USDA, Economic Research Service. Food at Home’s Share of Total Food Spending Hit a High of 66 Percent in April 2020. 2020. Available online: https://www.ers.usda.gov/data-products/chart-gallery/gallery/chart-detail/?chartId=99691 (accessed on 30 January 2021).
- WRAP. Synthesis of Household Food Waste Compositional Data 2018. 2020. Available online: https://wrap.org.uk/sites/files/wrap/Synthesis_of_Household_Food_Waste_Compositional_Data_2018_0.pdf (accessed on 30 January 2021).
- Cardiff. WRAP. The Impact of Food Waste Collections on Food Waste Arisings. 2019. Available online: https://wrap.org.uk/sites/files/wrap/Food%20waste%20collections%202020%20report.pdf (accessed on 30 January 2021).
- Jain, S.; Newman, D.; Cepeda-Márquez, R.; Zeller, K. Global Food Waste Management: An Implementation Guide for Cities. 2018. World Biogas Association. Available online: https://www.worldbiogasassociation.org/wp-content/uploads/2018/05/Global-Food-Waste-Management-Full-report-pdf.pdf (accessed on 30 January 2021).
- Streeter, V.; Platt, B. Residential Food Waste Collection Access. US BioCycle 2017, 58. Available online: https://www.biocycle.net/subscriber-exclusive-residential-food-waste-collection-access-u-s-complete-report/ (accessed on 30 January 2021).
- US Environmental Agency (EPA). Advancing Sustainable Materials Management: 2016 and 2017 Tables and Figures Assessing Trends in Material Generation, Recycling, Composting, Combustion with Energy Recovery and Landfilling in the United States. 2019. Available online: https://www.epa.gov/sites/production/files/2019-11/documents/2016_and_2017_facts_and_figures_data_tables_0.pdf (accessed on 30 January 2021).
- Flanagan, K.; Robertson, K.; Hanson, C. Reducing Food Loss and Waste: Setting a Global Action Agenda. WRI Publ. 2019. Available online: https://www.wri.org/publication/reducing-food-loss-and-waste-setting-global-action-agenda (accessed on 30 January 2021).
- Ritchie, H. Food Waste is Responsible for 6% of Global Greenhouse Gas Emissions. 2020. Our World in Data. Available online: https://ourworldindata.org/food-waste-emissions (accessed on 30 January 2021).
- Global Panel. Healthy Diets for All: A Key to Meeting the SDGs. Policy Brief No. 10; Global Panel on Agriculture and Food Systems for Nutrition: London, UK, 2017; Available online: https://www.glopan.org/wp-content/uploads/2019/06/SDGPolicyBrief.pdf (accessed on 30 January 2021).


| Variables | Total | Inedible Food Waste (Grams per Day) | Inedible Food Waste (Grams per 2000 kcal) | HEI 2015Diet Quality Score | % Energy from Ultra-Processed Foods | |||||||||
|---|---|---|---|---|---|---|---|---|---|---|---|---|---|---|
| n | % | Mean | SD | p-Value | Mean | SD | p-Value | Mean | SD | p-Value | Mean | SD | p-Value | |
| Overall | 747 | 100 | 78.7 | 42.73 | 85.5 | 48.78 | 67.1 | 9.91 | 59.6 | 10.75 | ||||
| Sex | ||||||||||||||
| Male | 135 | 18.1 | 75.0 | 43.99 | Ref. | 74.2 | 44.22 | Ref. | 66.5 | 10.33 | Ref. | 58.4 | 10.46 | Ref. |
| Female | 612 | 81.9 | 79.6 | 42.66 | 0.255 | 88 | 49.41 | 0.003 | 67.2 | 9.82 | 0.48 | 59.9 | 10.8 | 0.13 |
| Age | ||||||||||||||
| 21–40 | 283 | 37.9 | 79.1 | 44.48 | Ref. | 85.4 | 53.4 | Ref. | 66.1 | 10.13 | Ref. | 60.2 | 11.08 | Ref. |
| 41–50 | 229 | 30.7 | 76.5 | 40.10 | 0.489 | 82.2 | 41.9 | 0.442 | 66.5 | 9.75 | 0.683 | 60.5 | 9.9 | 0.719 |
| >51 | 235 | 31.5 | 80.4 | 43.17 | 0.734 | 88.9 | 49.2 | 0.4 | 68.8 | 9.62 | 0.002 | 58.2 | 11.02 | 0.039 |
| Race/ethnicity | ||||||||||||||
| Non-Hispanic White | 362 | 48.50 | 83.7 | 45.89 | Ref. | 91.80 | 52.90 | Ref. | 69.6 | 10.15 | Ref. | 57.6 | 11.04 | Ref. |
| Hispanic | 303 | 40.60 | 72.8 | 35.77 | 0.001 | 76.20 | 37.62 | 0.0001 | 64.3 | 8.93 | 0.0001 | 63.3 | 8.69 | 0.0001 |
| Other | 82 | 11.00 | 78.7 | 49.22 | 0.399 | 92.40 | 59.75 | 0.931 | 66.1 | 9.37 | 0.002 | 55.1 | 12.29 | 0.081 |
| Marital Status | ||||||||||||||
| Married | 437 | 58.5 | 82.4 | 42.66 | 0.005 | 88.70 | 46.02 | 0.04 | 67.7 | 9.65 | 0.055 | 59.4 | 10.77 | 0.422 |
| Single | 310 | 41.5 | 73.5 | 42.36 | Ref. | 81.00 | 52.16 | Ref. | 66.2 | 10.23 | Ref. | 60 | 10.73 | Ref. |
| Education | ||||||||||||||
| High school or less | 251 | 33.60 | 70.2 | 32.67 | Ref. | 72.30 | 33.77 | Ref. | 63.6 | 9.22 | Ref. | 64.1 | 8.44 | Ref. |
| Some College | 163 | 21.80 | 77.1 | 46.52 | 0.102 | 81.10 | 49.85 | 0.05 | 66.1 | 9.9 | 0.011 | 60.5 | 10.15 | 0.0001 |
| College or more | 333 | 44.60 | 86.0 | 46.20 | 0.0001 | 97.60 | 54.66 | <0.0001 | 70.2 | 9.48 | 0.0001 | 55.9 | 11.24 | 0.0001 |
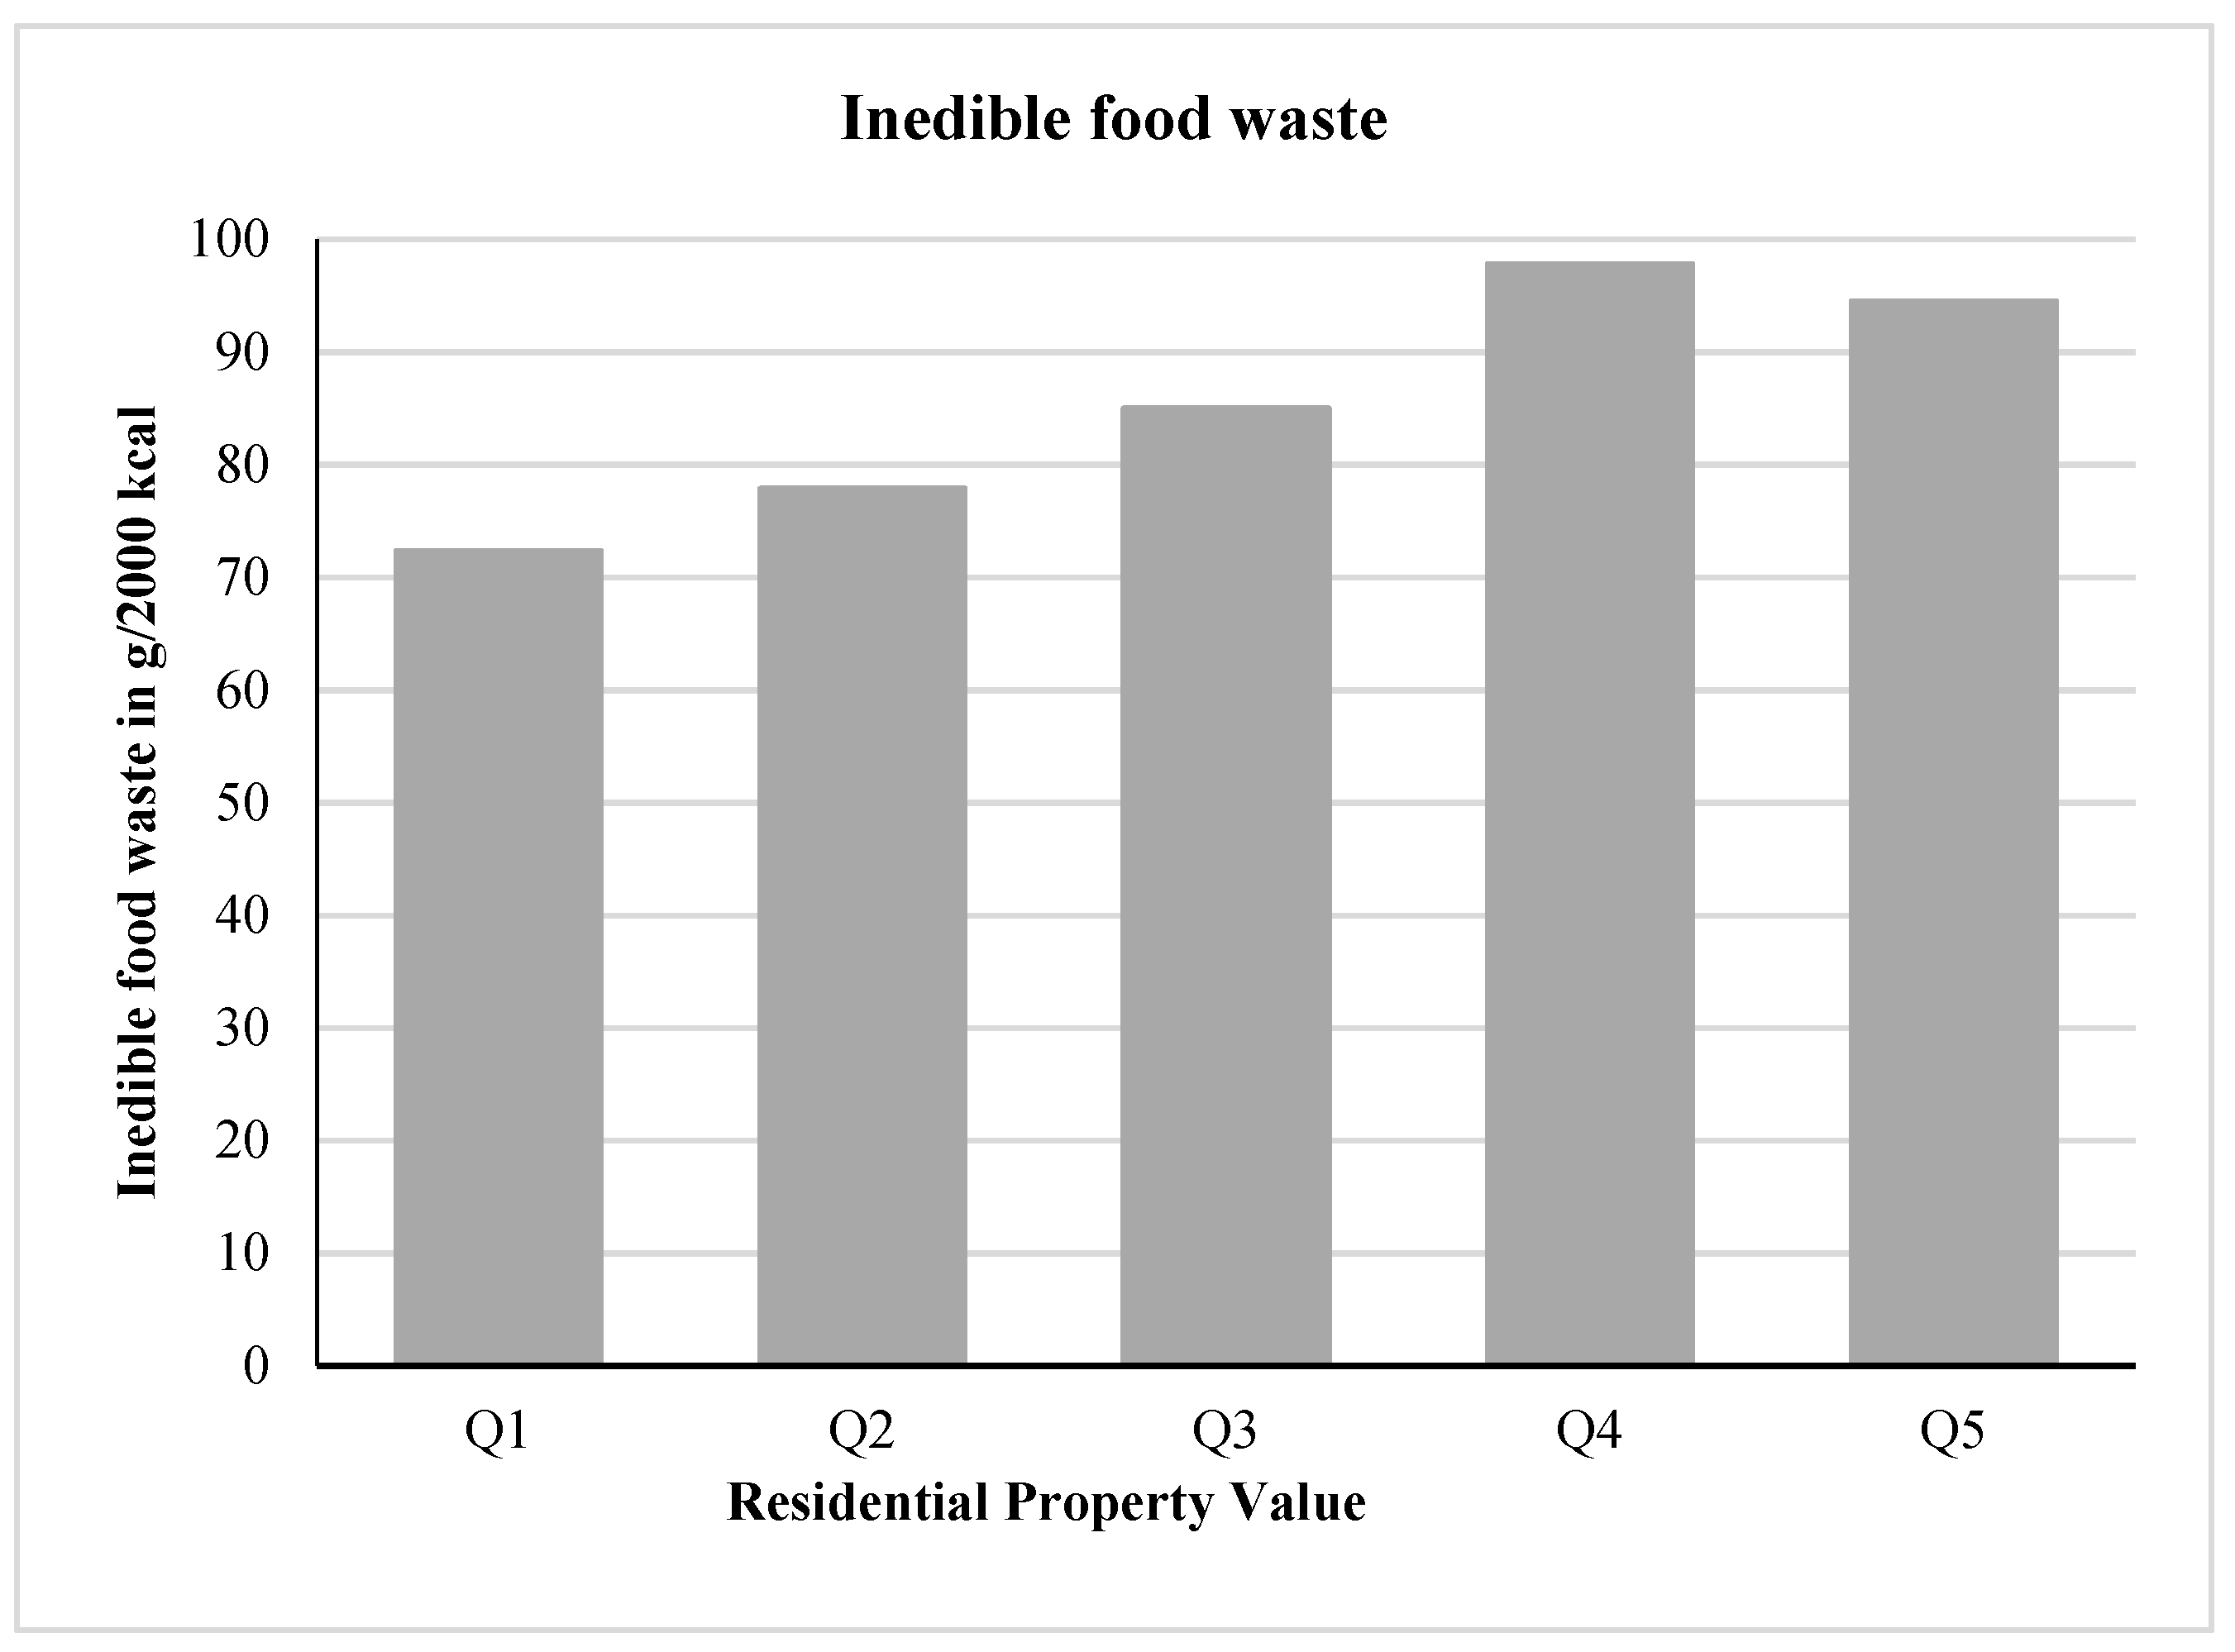
| Residential Property value | ||||||||||||||
| Tertile 1 (<$130k) | 249 | 33.30 | 71.6 | 33.73 | Ref. | 74.00 | 35.04 | Ref. | 64.3 | 9.1 | Ref. | 63.9 | 8.3 | Ref. |
| Tertile 2 ($130–293k) | 249 | 33.30 | 77.6 | 46.31 | 0.095 | 87.20 | 55.36 | 0.0001 | 67.2 | 10.16 | 0.001 | 59.1 | 11.13 | 0.0001 |
| Tertile 3 (>$293k) | 249 | 33.30 | 87.1 | 45.69 | 0.0001 | 95.30 | 51.31 | 0.0001 | 69.8 | 9.69 | 0.0001 | 55.9 | 11.07 | 0.0001 |
| Food Categories | Mean (g/day) | 95% CI |
|---|---|---|
| Total daily food waste | 78.7 | (75.6–81.8) |
| Food Groups | ||
| Dairy and eggs | 0 | |
| Meat, poultry and fish | 15.4 | (14.7–16.2) |
| Beans, nuts, and seeds | 0 | |
| Grains, cereals | 0 | |
| Vegetables | 32.8 | (31.1–34.4) |
| Fruits | 30.5 | (28.5–32.4) |
| Fats and sweets | 0 | |
| Food processing categories | ||
| Unprocessed | 76.0 | (72.9–79.1) |
| Processed | 0 | |
| Ultra-Processed | 2.6 | (2.4–2.8) |
| Culinary Ingredients | 0 |
| Variables | Total | Inedible Food Waste (Grams per 2000 kcal) | HEI 2015 | |||||
|---|---|---|---|---|---|---|---|---|
| n | % | Mean | SD | p-Value | Mean | SD | p-Value | |
| Overall | 747 | 100 | 85.5 | 48.78 | 67.1 | 9.91 | ||
| Food spending at home ($/month) | ||||||||
| ≤$100 | 273 | 36.5 | 74.5 | 40.57 | Ref. | 65.2 | 9.96 | Ref. |
| >$100–≤175 | 231 | 30.9 | 84.7 | 45.18 | 0.008 | 66.4 | 9.88 | 0.177 |
| ≥$175 | 243 | 32.5 | 98.6 | 56.86 | 0.0001 | 69.9 | 9.27 | 0.0001 |
| FFQ diet cost ($/month) | ||||||||
| ≤$252 | 249 | 33.3 | 59.2 | 24.28 | Ref. | 62.6 | 10 | Ref. |
| >$253–≤299 | 249 | 33.3 | 78.5 | 34.28 | 0.0001 | 67.1 | 9.77 | 0.0001 |
| ≥$300 | 249 | 33.3 | 118.8 | 59.47 | 0.0001 | 71.5 | 7.81 | 0.0001 |
| HEI-2015 score | ||||||||
| Tertile 1 | 249 | 33.3 | 61.2 | 32.72 | Ref. | |||
| Tertile 2 | 249 | 33.3 | 87.9 | 48.78 | 0.0001 | |||
| Tertile 3 | 249 | 33.3 | 107.5 | 51.19 | 0.0001 | |||
| Variables | Model 1 | Model 2 | ||||
|---|---|---|---|---|---|---|
| Coeff | p-Value | 95% CI | Coeff | p-Value | 95% CI | |
| Sex | ||||||
| Male | Ref. | Ref. | ||||
| Female | 12.61 | 0.002 | (4.82, 20.40) | 18.84 | 0.0001 | (9.87, 27.82) |
| Age | ||||||
| 21–40 | Ref. | Ref. | ||||
| 40–50 | −6.73 | 0.063 | (−13.84, 0.38) | −4.86 | 0.240 | (−12.97, 3.24) |
| >50 | −0.80 | 0.844 | (−8.78, 7.18) | −2.67 | 0.570 | (−11.87, 6.54) |
| Race/ethnicity | ||||||
| NonHispanic White | Ref. | Ref. | ||||
| Hispanic | −1.12 | 0.874 | (−14.88, 12.65) | 5.76 | 0.468 | (−9.80, 21.31) |
| Other | 3.02 | 0.604 | (−8.39, 14.43) | 4.39 | 0.506 | (−8.55, 17.33) |
| Education | ||||||
| High school or less | Ref. | Ref. | ||||
| Some College | 3.04 | 0.513 | (−6.07, 12.14) | 4.89 | 0.355 | (−5.46, 15.24) |
| College graduate/Grad school | 19.18 | 0.0001 | (8.68, 29.67) | 20.66 | 0.001 | (8.90, 32.42) |
| Residential Property value | ||||||
| Tertile 1 (<$128,675) | ||||||
| Tertile 2 ($128,675.20–$290,866) | 1.22 | 0.774 | (−7.12, 9.56) | 5.44 | 0.287 | (−4.57, 15.45) |
| Tertile 3 (>$290,866) | 0.46 | 0.933 | (−10.11, 11.02) | 6.22 | 0.314 | (−5.90, 18.33) |
| Food expenditure ($/month) | ||||||
| ≤$142.6 | Ref. | Ref. | ||||
| >$142.6–≤250 | −4.30 | 0.256 | (−11.73, 3.13) | |||
| ≥$250 | 11.22 | 0.042 | (0.42, 22.03) | |||
| FFQ diet cost ($/month) | ||||||
| ≤$320 | Ref. | Ref. | ||||
| >$320–≤400 | 18.44 | 0.0001 | (12.58, 24.30) | |||
| ≥$400 | 55.94 | 0.0001 | (48.26, 63.62) | |||
Publisher’s Note: MDPI stays neutral with regard to jurisdictional claims in published maps and institutional affiliations. |
© 2021 by the authors. Licensee MDPI, Basel, Switzerland. This article is an open access article distributed under the terms and conditions of the Creative Commons Attribution (CC BY) license (http://creativecommons.org/licenses/by/4.0/).
Share and Cite
Gupta, S.; Rose, C.M.; Buszkiewicz, J.; Otten, J.; Spiker, M.L.; Drewnowski, A. Inedible Food Waste Linked to Diet Quality and Food Spending in the Seattle Obesity Study SOS III. Nutrients 2021, 13, 479. https://0-doi-org.brum.beds.ac.uk/10.3390/nu13020479
Gupta S, Rose CM, Buszkiewicz J, Otten J, Spiker ML, Drewnowski A. Inedible Food Waste Linked to Diet Quality and Food Spending in the Seattle Obesity Study SOS III. Nutrients. 2021; 13(2):479. https://0-doi-org.brum.beds.ac.uk/10.3390/nu13020479
Chicago/Turabian StyleGupta, Shilpi, Chelsea M. Rose, James Buszkiewicz, Jennifer Otten, Marie L. Spiker, and Adam Drewnowski. 2021. "Inedible Food Waste Linked to Diet Quality and Food Spending in the Seattle Obesity Study SOS III" Nutrients 13, no. 2: 479. https://0-doi-org.brum.beds.ac.uk/10.3390/nu13020479