
Adherence to Food-Based Dietary Guidelines: A Systemic Review of High-Income and Low- and Middle-Income Countries

 , , and
Abstract
:1. Introduction
2. Materials and Methods
2.1. Identification of the Studies
2.2. Eligibility Criteria
2.3. Data Extraction
2.4. Data Synthesis
2.5. Quality Assessment and Risk of Bias
3. Results
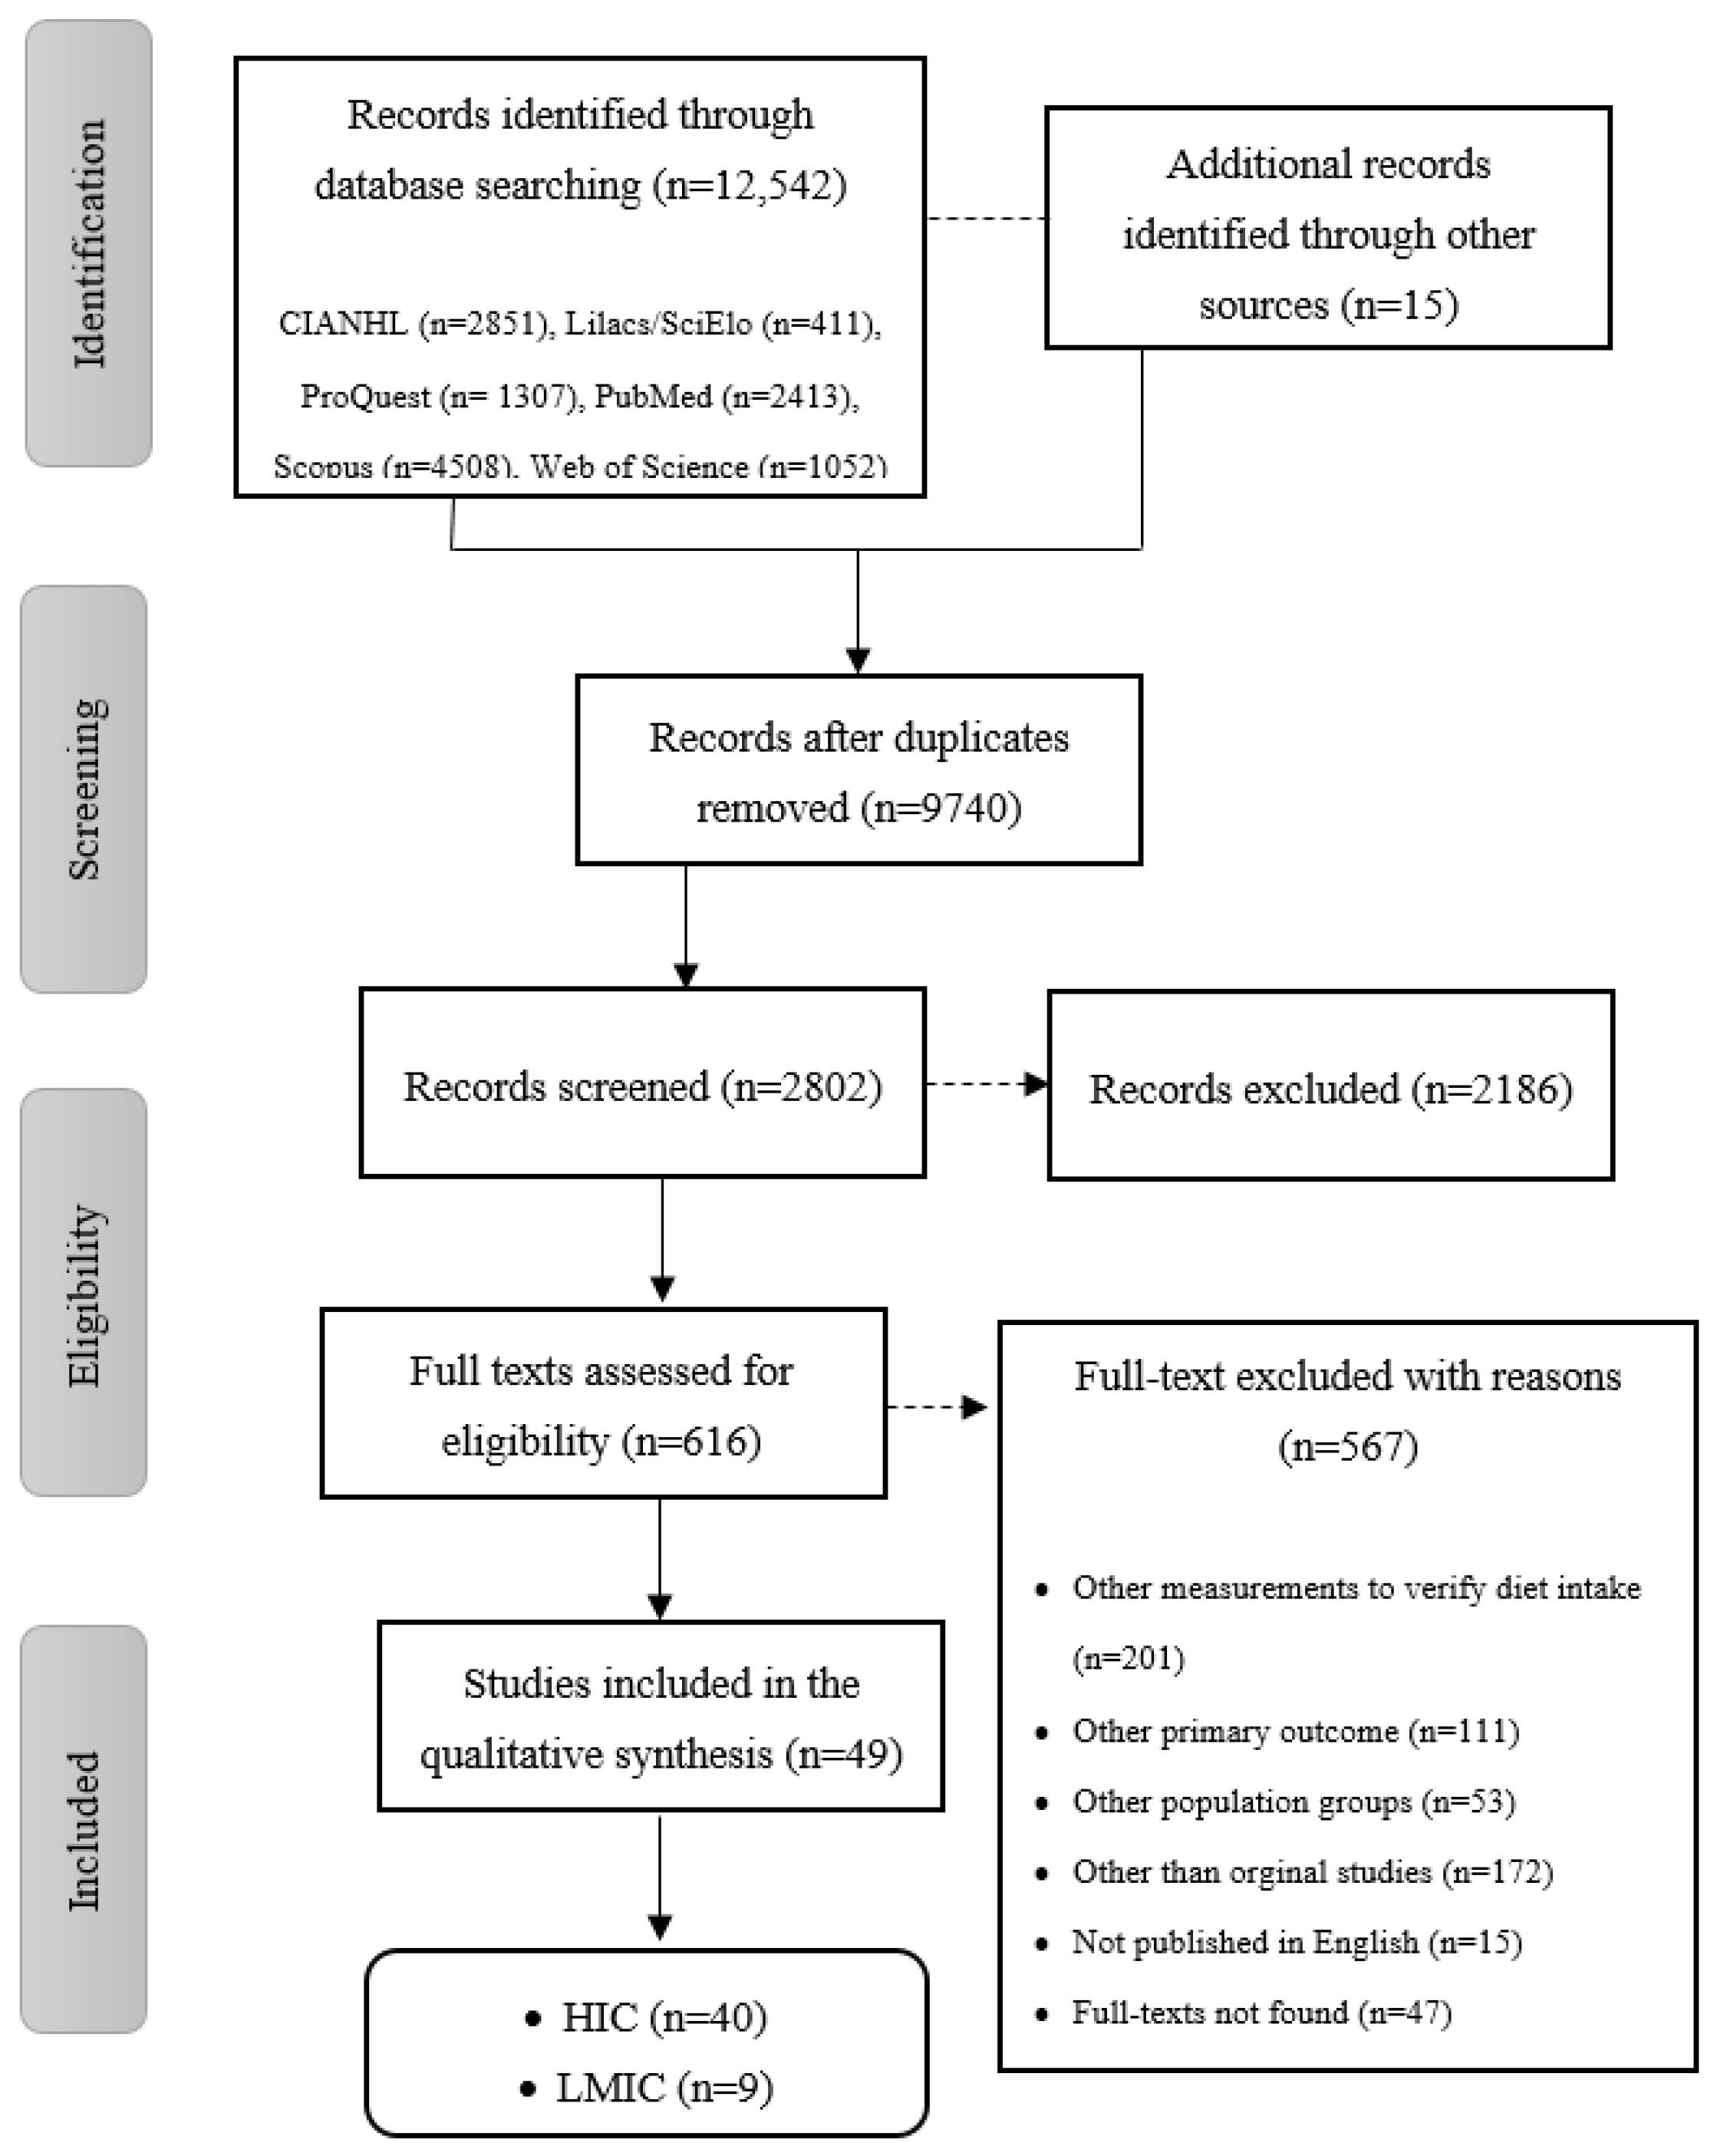
3.1. Literature Search and Screening
3.2. Study Design Characteristics of the High-Income (HIC) and Low- and Middle-Income Countries (LMIC)
3.3. Adherence to the National Food-Based Dietary Guidelines (FBDGs)
Adherence to National FBDGs in HIC and LMIC by Food Groups
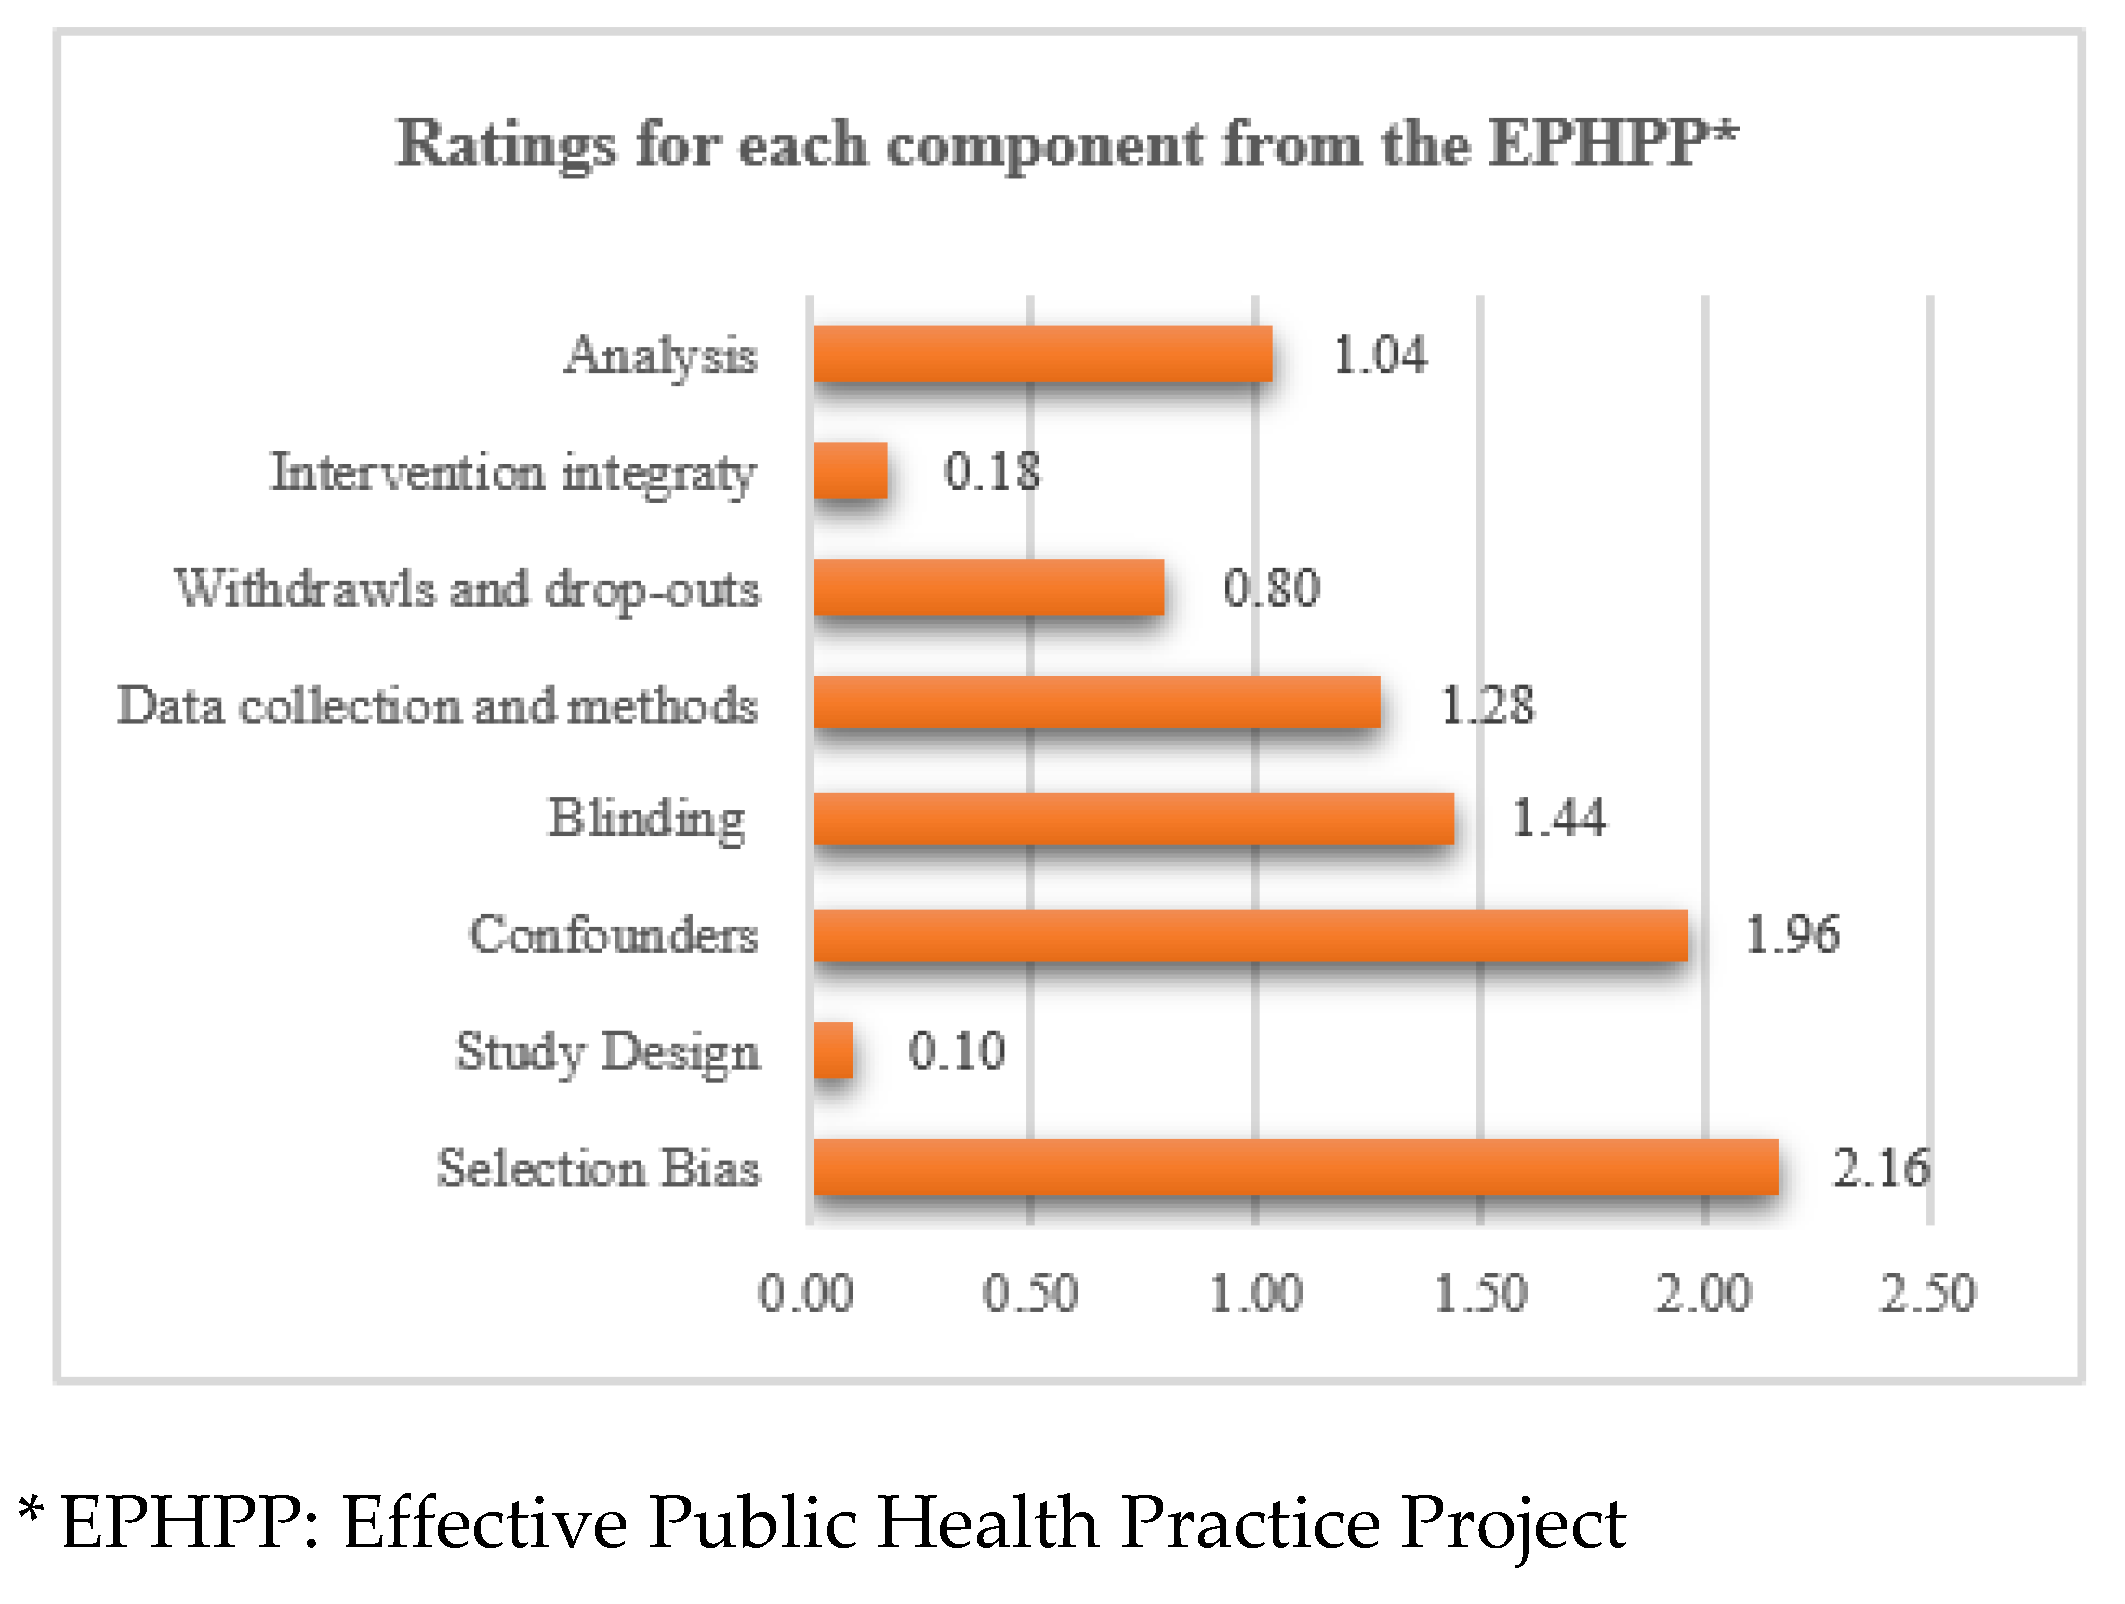
3.4. Risk of Bias of the Included Studies
4. Discussion
5. Conclusions
Author Contributions
Funding
Institutional Review Board Statement
Informed Consent Statement
Conflicts of Interest
References
- Lobstein, T.; Brinsden, H. Obesity: Missing the 2025 Global Targets; World of Obesity: London, UK, 2020. [Google Scholar]
- Grech, A.; Sui, Z.; Siu, H.Y.; Zheng, M.; Allman-Farinelli, M.; Rangan, A. Socio-Demographic Determinants of Diet Quality in Australian Adults Using the Validated Healthy Eating Index for Australian Adults (HEIFA—2013). Healthcare 2017, 5, 7. [Google Scholar] [CrossRef] [PubMed] [Green Version]
- Darmon, N.; Drewnowski, A. Does social class predict diet quality? Am. J. Clin. Nutr. 2008, 87, 1107–1117. [Google Scholar] [CrossRef] [PubMed] [Green Version]
- Leme, A.C.; Muszynski, D.; Mirotta, J.A.; Jewell, K.; Caroll, N.; Hogan, J.; Yu, J.; Fisberg, R.M.; Ma, D.W.L.; Duncan, A.M.; et al. Diet quality of Canadian pre-school children at two to five years old from the Guelph Family Health Study: Family-based study. Can. J. Diet. Pract. Res. 2020. [Google Scholar] [CrossRef]
- Mello, A.V.; Pereira, J.L.; Leme, A.C.B.; Goldbaum, M.; Cesar, C.L.G.; Fisberg, R.M. Social determinants, lifestyle and diet quality: A population-based study from the 2015 Health Survey of Sao Paulo, Brazil. Public Health Nutr. 2019, 1–12. [Google Scholar] [CrossRef] [PubMed]
- Himmelgreen, D.A.; Cantor, A.; Arias, S.; Romero Daza, N. Using a biocultural approach to examine migration/globalization, diet quality, and energy balance. Physiol. Behav. 2014, 134, 76–85. [Google Scholar] [CrossRef]
- Talukdar, D.; Seenivasan, S.; Cameron, A.J.; Sacks, G. The association between national income and adult obesity prevalence: Empirical insights into temporal patterns and moderators of the association using 40 years of data across 147 countries. PLoS ONE 2020, 15, e0232236. [Google Scholar] [CrossRef]
- McKenzie, B.L.; Santos, J.A.; Geldsetzer, P.; Davies, J.; Manne-Goehler, J.; Gurung, M.S.; Sturua, L.; Gathecha, G.; Aryal, K.K.; Tsabedze, L.; et al. Evaluation of sex differences in dietary behaviours and their relationship with cardiovascular risk factors: A cross-sectional study of nationally representative surveys in seven low- and middle-income countries. Nutr. J. 2020, 19, 3. [Google Scholar] [CrossRef] [Green Version]
- Gomez, G.; Fisberg, R.M.; Nogueira Previdelli, A.; Hermes Sales, C.; Kovalskys, I.; Fisberg, M.; Herrera-Cuenca, M.; Cortes Sanabria, L.Y.; Garcia, M.C.Y.; Pareja Torres, R.G.; et al. Diet Quality and Diet Diversity in Eight Latin American Countries: Results from the Latin American Study of Nutrition and Health (ELANS). Nutrients 2019, 11, 1605. [Google Scholar] [CrossRef] [Green Version]
- Backholer, K.; Spencer, E.; Gearon, E.; Magliano, D.J.; McNaughton, S.A.; Shaw, J.E.; Peeters, A. The association between socio-economic position and diet quality in Australian adults. Public Health Nutr. 2016, 19, 477–485. [Google Scholar] [CrossRef] [Green Version]
- World Health Organization. Preparation and Use of Food-Based Dietary Guidelines; Food and Agriculture Organization of the United Nations/World Health Organization: Geneva, Switzerland, 1996. [Google Scholar]
- Tetens, I.; Birt, C.A.; Brink, E.; Bodenbach, S.; Bugel, S.; De Henauw, S.; Gronlund, T.; Julia, C.; Konde, A.B.; Kromhout, D.; et al. Food-Based Dietary Guidelines—Development of a conceptual framework for future Food-Based Dietary Guidelines in Europe: Report of a Federation of European Nutrition Societies Task-Force Workshop in Copenhagen, 12–13 March 2018. Br. J. Nutr. 2020, 124, 1338–1344. [Google Scholar] [CrossRef]
- FAO; WHO. Food-Based Dietary Guidelines; Food Agriculture and Organization: Rome, Italy; World Health Organization: Geneva, Switzerland, 2020. [Google Scholar]
- Mozaffarian, D.; Rosenberg, I.; Uauy, R. History of modern nutrition science-implications for current research, dietary guidelines, and food policy. BMJ 2018, 361. [Google Scholar] [CrossRef] [PubMed] [Green Version]
- FAO/UNU. Influencing Food Environments for Healthy Diets; Food Agriculture Organization of United Nations: Rome, Italy, 2006. [Google Scholar]
- Herforth, A.; Arimond, M.; Alvarez-Sanchez, C.; Coates, J.; Christianson, K.; Muehlhoff, E. A Global Review of Food-Based Dietary Guidelines. Adv. Nutr. 2019, 10, 590–605. [Google Scholar] [CrossRef] [PubMed] [Green Version]
- Micha, R.; Khatibzadeh, S.; Shi, P.; Fahimi, S.; Lim, S.; Andrews, K.; Engell, R.; Powles, J.; Ezzati, E.; Mozaffarian, D.; et al. Global, regional, and national consumption levels of dietary fats and oils in 1990 and 2010: A systematic analysis including 266 country-specific nutrition surveys. BMJ 2014, 348, g2272. [Google Scholar] [CrossRef] [PubMed] [Green Version]
- Rippin, H.L.; Hutchinson, J.; Greenwood, D.C.; Jewell, J.; Breda, J.J.; Martin, A.; Rippin, D.M.; Schindler, K.; Rust, P.; Fagt, S.; et al. Inequalities in education and national income are associated with poorer diet: Pooled analysis of individual participant data across 12 European countries. PLoS ONE 2020, 15, e0232447. [Google Scholar] [CrossRef]
- Booth, A.; Clarke, M.; Dooley, G.; Ghersi, D.; Moher, D.; Petticrew, M.; Stewart, L. The nuts and bolts of PROSPERO: An international prospective register of systematic reviews. Syst. Rev. 2012, 1, 2. [Google Scholar] [CrossRef] [Green Version]
- Moher, D.; Liberati, A.; Tetzlaff, J.; Altman, D.G.; The, P.G. Preferred Reporting Items for Systematic Reviews and Meta-Analyses: The PRISMA Statement. PLoS Med. 2009, 6, e1000097. [Google Scholar] [CrossRef] [Green Version]
- World Health Organization. Nutrition for Older Persons: Ageing and Nutrition: A Growing Global Challenge; World Health Organization: Geneva, Switzerland, 2020. [Google Scholar]
- Ogata, B.N.; Hayes, D. Position of the Academy of Nutrition and Dietetics: Nutrition guidance for healthy children ages 2 to 11 years. J. Acad. Nutr. Diet 2014, 114, 1257–1276. [Google Scholar] [CrossRef]
- Yang, L.; Bovet, P.; Ma, C.; Zhao, M.; Liang, Y.; Xi, B. Prevalence of underweight and overweight among young adolescents aged 12–15 years in 58 low-income and middle-income countries. Pediatric Obes. 2019, 14, e12468. [Google Scholar] [CrossRef]
- Ford, N.D.; Patel, S.A.; Narayan, K.M. Obesity in Low- and Middle-Income Countries: Burden, Drivers, and Emerging Challenges. Annu. Rev. Public Health 2017, 38, 145–164. [Google Scholar] [CrossRef] [Green Version]
- Armijo-Olivo, S.; Stiles, C.R.; Hagen, N.A.; Biondo, P.D.; Cummings, G.G. Assessment of study quality for systematic reviews: A comparison of the Cochrane Collaboration Risk of Bias Tool and the Effective Public Health Practice Project Quality Assessment Tool: Methodological research. J. Eval. Clin. Pract. 2012, 18, 12–18. [Google Scholar] [CrossRef]
- Thomas, B.H.; Ciliska, D.; Dobbins, M.; Micucci, S. A process for systematically reviewing the literature: Providing the research evidence for public health nursing interventions. Worldviews Evid. Based Nurs. 2004, 1, 176–184. [Google Scholar] [CrossRef]
- Schroeter, C.; Corder, T.; Brookes, B.; Reller, V. An incentive-based health program using MyPlate: A pilot study analyzing college students’ dietary intake behavior. J. Am. Coll. Health 2019. [Google Scholar] [CrossRef] [PubMed]
- Ewers, B.; Marott, J.L.; Schnohr, P.; Nordestgaard, B.G.; Marckmann, P. Non-adherence to established dietary guidelines associated with increased mortality: The Copenhagen General Population Study. Eur. J. Prev. Cardiol. 2020. [Google Scholar] [CrossRef] [PubMed]
- Schuh, D.S.; Guessous, I.; Gaspoz, J.M.; Theler, J.M.; Marques-Vidal, P. Twenty-four-year trends and determinants of change in compliance with Swiss dietary guidelines. Eur. J. Clin. Nutr. 2019, 73, 859–868. [Google Scholar] [CrossRef] [PubMed]
- Díaz-Méndez, C.; García-Espejo, I. Social Inequalities in Following Official Guidelines on Healthy Diet During the Period of Economic Crisis in Spain. Int. J. Health Serv. 2019, 49, 582–605. [Google Scholar] [CrossRef] [PubMed]
- Rossiter, M.D.; Evers, S.E.; Pender, A.C. Adolescents’ diets do not comply with 2007 Canada’s food guide recommendations. Appetite 2012, 59, 668–672. [Google Scholar] [CrossRef] [PubMed]
- Yen, W.-J.J.; Lewis, N.M. MyPyramid-omega-3 fatty acid nutrition education intervention may improve food groups and omega-3 fatty acid consumption in university middle-aged women. Nutr. Res. 2013, 33, 103–108. [Google Scholar] [CrossRef] [PubMed]
- Kristjansdottir, A.G.; Johannsson, E.; Thorsdottir, I. Effects of a school-based intervention on adherence of 7–9-year-olds to food-based dietary guidelines and intake of nutrients. Public Health Nutr. 2010, 13, 1151–1161. [Google Scholar] [CrossRef]
- Gambera, C.P.J.; Schneeman, B.O.; Davis, P.A. Use of the Food Guide Pyramid and US Dietary Guidelines to Improve Dietary Intake and Reduce Cardiovascular Risk in Active-Duty Air Force Members. J. Am. Diet. Assoc. 1995, 95, 1268–1273. [Google Scholar] [CrossRef]
- Schwartz, J.L.; Vernarelli, J.A. Assessing the Public’s Comprehension of Dietary Guidelines: Use of MyPyramid or MyPlate Is Associated with Healthier Diets among US Adults. J. Acad. Nutr. Diet 2019, 119, 482–489. [Google Scholar] [CrossRef]
- Harrison, S.; Brassard, D.; Lemieux, S.; Lamarche, B. Consumption and Sources of Saturated Fatty Acids According to the 2019 Canada Food Guide: Data from the 2015 Canadian Community Health Survey. Nutrients 2019, 11, 1964. [Google Scholar] [CrossRef] [Green Version]
- de Mestral, C.; Khalatbari-Soltani, S.; Stringhini, S.; Marques-Vidal, P. Perceived barriers to healthy eating and adherence to dietary guidelines: Nationwide study. Clin. Nutr. 2019. [Google Scholar] [CrossRef] [PubMed]
- Bel, S.; De Ridder, K.A.A.; Lebacq, T.; Ost, C.; Teppers, E.; Cuypers, K.; Tafforeau, J. Habitual food consumption of the Belgian population in 2014-2015 and adherence to food-based dietary guidelines. Arch. Public Health 2019, 77. [Google Scholar] [CrossRef] [PubMed] [Green Version]
- Al Thani, M.; Al Thani, A.A.; Al-Chetachi, W.; Al Malki, B.; Khalifa, S.A.H.; Bakri, A.H.; Hwalla, N.; Naja, F.; Nasreddine, L. Adherence to the Qatar dietary guidelines: A cross-sectional study of the gaps, determinants and association with cardiometabolic risk amongst adults. BMC Public Health 2018, 18. [Google Scholar] [CrossRef] [Green Version]
- Chatelan, A.; Beer-Borst, S.; Randriamiharisoa, A.; Pasquier, J.; Blanco, J.M.; Siegenthaler, S.; Paccaud, F.; Slimani, N.; Nicolas, G.; Camenzind-Frey, E.; et al. Major Differences in Diet across Three Linguistic Regions of Switzerland: Results from the First National Nutrition Survey menuCH. Nutrients 2017, 9, 1163. [Google Scholar] [CrossRef] [PubMed]
- Batis, C.; Aburto, T.C.; Sánchez-Pimienta, T.G.; Pedraza, L.S.; Rivera, J.A. Adherence to Dietary Recommendations for Food Group Intakes Is Low in the Mexican Population. J. Nutr. 2016, 146, 1897S–1906S. [Google Scholar] [CrossRef] [PubMed] [Green Version]
- Verly Junior, E.; de Carvalho, A.M.; Fisberg, R.M.; Marchioni, D.M.L. Adherence to the food guide for the Brazilian population. Revista Saude Publica 2013, 47, 1021–1027. [Google Scholar] [CrossRef]
- de Abreu, D.; Guessous, I.; Vaucher, J.; Preisig, M.; Waeber, G.; Vollenweider, P.; Marques-Vidal, P. Low compliance with dietary recommendations for food intake among adults. Clin. Nutr. 2013, 32, 783–788. [Google Scholar] [CrossRef]
- Black, J.L.; Billette, J.M. Do Canadians meet Canada’s food guide’s recommendations for fruits and vegetables? Appl. Physiol. Nutr. Metab. 2013, 38, 234–242. [Google Scholar] [CrossRef] [Green Version]
- Park, S.; Na, W.; Kim, M.; Kim, E.; Sohn, C. Correlation between Intake of Dietary Fiber and Adherence to the Korean National Dietary Guidelines in Adolescents from Jeonju. Prev. Nutr. Food Sci. 2012, 17, 254–260. [Google Scholar] [CrossRef] [Green Version]
- Kirkpatrick, S.I.; Dodd, K.W.; Reedy, J.; Krebs-Smith, S.M. Income and race/ethnicity are associated with adherence to food-based dietary guidance among US adults and children. J. Acad. Nutr. Diet 2012, 112, 624–635.e626. [Google Scholar] [CrossRef] [Green Version]
- Serra-Majem, L.; Ribas-Barba, L.; Salvador, G.; Serra, J.; Castell, C.; Cabezas, C.; Plasencia, A. Compliance with dietary guidelines in the Catalan population: Basis for a nutrition policy at the regional level (the PAAS strategy). Public Health Nutr. 2007, 10, 1406–1414. [Google Scholar] [CrossRef] [PubMed] [Green Version]
- Tande, D.L.; Hotchkiss, L.; Cotugna, N. The associations between blood lipids and the Food Guide Pyramid: Findings from the Third National Health and Nutrition Examination Survey. Prev. Med. 2004, 38, 452–457. [Google Scholar] [CrossRef] [PubMed]
- Munoz, K.A.; Krebs-Smith, S.M.; Ballard-Barbash, R.; Cleveland, L.E. Food intakes of US children and adolescents compared with recommendations. Pediatrics 1997, 100, 323–329. [Google Scholar] [CrossRef] [PubMed]
- Cleveland, L.E.; Cook, D.A.; Krebs-Smith, S.M.; Friday, J. Method for assessing food intakes in terms of servings based on food guidance. Am. J. Clin. Nutr. 1997, 65, 1254S–1263S. [Google Scholar] [CrossRef] [PubMed]
- Louzada, M.; Ricardo, C.Z.; Steele, E.M.; Levy, R.B.; Cannon, G.; Monteiro, C.A. The share of ultra-processed foods determines the overall nutritional quality of diets in Brazil. Public Health Nutr. 2018, 21, 94–102. [Google Scholar] [CrossRef] [Green Version]
- El Ansari, W.; Samara, A. Adherence to recommended dietary guidelines and the relationships with the importance of eating healthy in Egyptian university students. Int. J. Prev. Med. 2018, 9, 73. [Google Scholar] [CrossRef]
- Sousa, A.G.; da Costa, T.H.M. Assessment of Nutrient and Food Group Intakes across Sex, Physical Activity, and Body Mass Index in an Urban Brazilian Population. Nutrients 2018, 10, 1714. [Google Scholar] [CrossRef] [Green Version]
- Steele, E.M.; Rauber, F.; Costa, C.D.S.; Leite, M.A.; Gabe, K.T.; Louzada, M.; Levy, R.B.; Monteiro, C.A. Dietary changes in the NutriNet Brasil cohort during the covid-19 pandemic. Rev Saude Publica 2020, 54, 91. [Google Scholar] [CrossRef]
- Tian, X.; Huang, Y.; Wang, H. Deviation of Chinese Adults’ Diet from the Chinese Food Pagoda 2016 and Its Association with Adiposity. Nutrients 2017, 9, 995. [Google Scholar] [CrossRef]
- Koo, H.C.; Poh, B.K.; Lee, S.T.; Chong, K.H.; Bragt, M.C.; Abd Talib, R.; Group, S.M.S. Are Malaysian Children Achieving Dietary Guideline Recommendations? Asia Pac. J. Public Health 2016, 28, 8S–20S. [Google Scholar] [CrossRef]
- Jayawardena, R.; Byrne, N.M.; Soares, M.J.; Katulanda, P.; Hills, A.P. Food consumption of Sri Lankan adults: An appraisal of serving characteristics. Public Health Nutr. 2013, 16, 653–658. [Google Scholar] [CrossRef] [PubMed] [Green Version]
- Zhang, C.X.; Chen, Y.M.; Chen, W.Q.; Su, Y.X.; Wang, C.L.; Wu, J.N. Food group intake among adolescents in Guangzhou city compared with the Chinese dietary guidelines. Asia Pac. J. Clin. Nutr. 2012, 21, 450–456. [Google Scholar]
- Jun, S.; Thuppal, S.V.; Maulding, M.K.; Eicher-Miller, H.A.; Savaiano, D.A.; Bailey, R.L. Poor Dietary Guidelines Compliance among Low-Income Women Eligible for Supplemental Nutrition Assistance Program-Education (SNAP-Ed). Nutrients 2018, 10, 327. [Google Scholar] [CrossRef] [PubMed] [Green Version]
- McDaniel, J.C.; Belury, M.A. Are young adults following the dietary guidelines for Americans? Nurse Pract. 2012, 37, 1–9. [Google Scholar] [CrossRef]
- Winham, D.M.; Florian, T.F. Hispanic women in EFNEP have low adherence with dietary guidelines regardless of acculturation level. J. Hunger Environ. Nutr. 2010, 5, 498–509. [Google Scholar] [CrossRef]
- Krebs-Smith, S.M.; Guenther, P.M.; Subar, A.F.; Kirkpatrick, S.I.; Dodd, K.W. Americans do not meet federal dietary recommendations. J. Nutr. 2010, 140, 1832–1838. [Google Scholar] [CrossRef]
- Kranz, S.; Mitchell, D.C.; Smiciklas-Wright, H.; Huang, S.H.; Kumanyika, S.K.; Stettler, N. Consumption of recommended food groups among children from medically underserved communities. J. Am. Diet Assoc. 2009, 109, 702–707. [Google Scholar] [CrossRef] [Green Version]
- Pullen, C.; Noble Walker, S. Midlife and older rural women’s adherence to U.S. Dietary Guidelines across stages of change in healthy eating. Public Health Nurs. 2002, 19, 170–178. [Google Scholar] [CrossRef]
- Anding, J.D.; Suminski, R.R.; Boss, L. Dietary Intake, Body Mass Index, Exercise, and Alcohol: Are College Women Following the Dietary Guidelines for Americans. J. Am. Coll. Health 2001, 49, 167. [Google Scholar] [CrossRef] [PubMed]
- Brady, L.M.; Lindquist, C.H.; Herd, S.L.; Goran, M.I. Comparison of children’s dietary intake patterns with US dietary guidelines. Br. J. Nutr. 2000, 84, 361–367. [Google Scholar] [CrossRef] [PubMed]
- Brassard, D.; Laramee, C.; Corneau, L.; Begin, C.; Belanger, M.; Bouchard, L.; Couillard, C.; Desroches, S.; Houle, J.; Langlois, M.F.; et al. Poor Adherence to Dietary Guidelines Among French-Speaking Adults in the Province of Quebec, Canada: The PREDISE Study. Can. J. Cardiol. 2018, 34, 1665–1673. [Google Scholar] [CrossRef] [Green Version]
- Allen, J.P.; Taylor, J.G.; Rozwadowski, M.M.; Boyko, J.A.; Blackburn, D.F. Adherence to Canada’s Food Guide among pharmacy students. Can. Pharm. J. 2011, 144, 79–84. [Google Scholar] [CrossRef]
- St. John, M.; Durant, M.; Campagna, P.D.; Rehman, L.A.; Thompson, A.M.; Wadsworth, L.A.; Murphy, R.J.L. Overweight Nova Scotia children and youth: The roles of household income and adherence to Canada’s food guide to health eating. Can. J. Public Health 2008, 99, 301–306. [Google Scholar] [CrossRef] [PubMed]
- Irwin, C.; Desbrow, B.; Khalesi, S.; McCartney, D. Challenges following a personalised diet adhering to dietary guidelines in a sample of Australian university students. Nutr. Health 2019, 25, 185–194. [Google Scholar] [CrossRef]
- Mishra, G.D.; Schoenaker, D.A.; Mihrshahi, S.; Dobson, A.J. How do women’s diets compare with the new Australian dietary guidelines? Public Health Nutr. 2015, 18, 218–225. [Google Scholar] [CrossRef] [PubMed] [Green Version]
- Schumacher, T.L.; Dewar, D.L.; Lubans, D.R.; Morgan, P.J.; Watson, J.; Guest, M.; Burrows, T.L.; Callister, R.; Collins, C.E. Dietary patterns of adolescent girls attending schools in low-income communities highlight low consumption of core foods. Nutr. Diet. 2014, 71, 127–134. [Google Scholar] [CrossRef]
- Vandevijvere, S.; De Vriese, S.; Huybrechts, I.; Moreau, M.; Temme, E.; De Henauw, S.; De Backer, G.; Kornitzer, M.; Leveque, A.; Van Oyen, H. The gap between food-based dietary guidelines and usual food consumption in Belgium, 2004. Public Health Nutr. 2009, 12, 423–431. [Google Scholar] [CrossRef] [PubMed] [Green Version]
- Stroebele-Benschop, N.; Dieze, A.; Hilzendegen, C. Students’ adherence to dietary recommendations and their food consumption habits. Nutr. Health 2018, 24, 75–81. [Google Scholar] [CrossRef] [PubMed]
- Niclasen, B.; Schnohr, C.W. Greenlandic schoolchildren’s compliance with national dietary guidelines. Public Health Nutr. 2010, 13, 1162–1169. [Google Scholar] [CrossRef] [Green Version]
- Molina, V. Guías Alimentarias en América Latina: Informe de la consulta técnica regional de las Guías Alimentarias. Venez. Nutr. 2008, 21, 31–41. [Google Scholar]
- Chinese Nutrition Society. Food-Based Dietary Guidelines—ChinaCh; Ministry of Health: Beijing, China, 2016.
- Global Nutrition Policy Review 2016–2017: Country Progress in Creating Enabling Policy Environments for Promoting Healthy Diets and Nutrition; World Health Organization: Geneva, Switzerland, 2018.
- Ruel-Bergeron, J.C.; Stevens, G.A.; Sugimoto, J.D.; Roos, F.F.; Ezzati, M.; Black, R.E.; Kraemer, K. Global Update and Trends of Hidden Hunger, 1995-2011: The Hidden Hunger Index. PLoS ONE 2015, 10, e0143497. [Google Scholar] [CrossRef]
- Amoroso, L. The Second International Conference on Nutrition: Implications for Hidden Hunger. World Rev. Nutr. Diet 2016, 115, 142–152. [Google Scholar] [CrossRef]
- Ribeiro, P.V.M.; Andrade, P.A.; Hermsdorff, H.H.M.; Dos Santos, C.A.; Cotta, R.M.M.; Estanislau, J.; Campos, A.A.O.; Rosa, C.O.B. Dietary non-nutrients in the prevention of non-communicable diseases: Potentially related mechanisms. Nutrition 2019, 66, 22–28. [Google Scholar] [CrossRef]
- Arnoldussen, I.A.; Zerbi, V.; Wiesmann, M.; Noordman, R.H.; Bolijn, S.; Mutsaers, M.P.; Dederen, P.J.; Kleemann, R.; Kooistra, T.; van Tol, E.A.; et al. Early intake of long-chain polyunsaturated fatty acids preserves brain structure and function in diet-induced obesity. J. Nutr. Biochem. 2016, 30, 177–188. [Google Scholar] [CrossRef] [PubMed]
- Nicklas, T.A.; O’Neil, C.E. Development of the SoFAS (solid fats and added sugars) concept: The 2010 Dietary Guidelines for Americans. Adv. Nutr. 2015, 6, 368S–375S. [Google Scholar] [CrossRef] [PubMed] [Green Version]
- Watson, W.L.; Kury, A.; Wellard, L.; Hughes, C.; Dunford, E.; Chapman, K. Variations in serving sizes of Australian snack foods and confectionery. Appetite 2016, 96, 32–37. [Google Scholar] [CrossRef] [PubMed]
- Teo, P.S.; van Dam, R.M.; Whitton, C.; Tan, L.W.L.; Forde, C.G. Consumption of Foods With Higher Energy Intake Rates is Associated With Greater Energy Intake, Adiposity, and Cardiovascular Risk Factors in Adults. J. Nutr. 2020. [Google Scholar] [CrossRef]
- Mozaffarian, D.; Hao, T.; Rimm, E.B.; Willett, W.C.; Hu, F.B. Changes in diet and lifestyle and long-term weight gain in women and men. N. Engl. J. Med. 2011, 364, 2392–2404. [Google Scholar] [CrossRef] [Green Version]
- Leme, A.C.; Baranowski, T.; Thompson, D.; Philippi, S.; O’Neil, C.E.; Fulgoni, V.L., 3rd; Nicklas, T.A. Food Sources of Shortfall Nutrients Among US Adolescents: National Health and Nutrition Examination Survey (NHANES) 2011–2014. Fam. Community Health 2020, 43, 59–73. [Google Scholar] [CrossRef]
- Leme, A.C.; Baranowski, T.; Thompson, D.; Philippi, S.; O’Neil, C.; Fulgoni, V.; Nicklas, T. Top food sources of percentage of energy, nutrients to limit and total gram amount consumed among US adolescents: National Health and Nutrition Examination Survey 2011–2014. Public Health Nutr. 2019, 22, 661–671. [Google Scholar] [CrossRef] [PubMed]
- Duncanson, K.; Shrewsbury, V.; Burrows, T.; Chai, L.K.; Ashton, L.; Taylor, R.; Gow, M.; Ho, M.; Ells, L.; Stewart, L.; et al. Impact of weight management nutrition interventions on dietary outcomes in children and adolescents with overweight or obesity: A systematic review with meta-analysis. J. Hum. Nutr. Diet. 2020. [Google Scholar] [CrossRef]
- Perez-Cueto, F.J.A. An Umbrella Review of Systematic Reviews on Food Choice and Nutrition Published between 2017 and-2019. Nutrients 2019, 11, 2398. [Google Scholar] [CrossRef] [PubMed] [Green Version]
- Riebl, S.K.; Estabrooks, P.A.; Dunsmore, J.C.; Savla, J.; Frisard, M.I.; Dietrich, A.M.; Peng, Y.; Zhang, X.; Davy, B.M. A systematic literature review and meta-analysis: The Theory of Planned Behavior’s application to understand and predict nutrition-related behaviors in youth. Eat. Behav. 2015, 18, 160–178. [Google Scholar] [CrossRef] [PubMed]
- Srbely, V.; Janjua, I.; Buchholz, A.C.; Newton, G. Interventions Aimed at Increasing Dairy and/or Calcium Consumption of Preschool-Aged Children: A Systematic Literature Review. Nutrients 2019, 11, 714. [Google Scholar] [CrossRef] [Green Version]


| Reference | Study Design | Country | N and Sex (% Female) | Age | Race/Ethnicity | Dietary Measurement | Dietary Guideline |
|---|---|---|---|---|---|---|---|
| High-Income countries | |||||||
| Ewers et al., 2020 [28] | Longitudinal (2003–2015) | Denmark | 100,191 45.2% female | 20–30 y–40–100 y 58.0 ± 13.1 | NR | FFQ | Danish Food Based Dietary Guidelines |
| Schwartz and Vernarelli 2019 [35] | Cross-sectional | USA | 3194 | ≥18 yo | NR | 1× 24hR | Dietary Guidelines for Americans/MyPlate or MyPyramid |
| Schuh et al., 2019 [29] | Longitudinal (1993–2016) | Switzerland | M = 689 50.5% female | 35–74: 51.9 yo ± 11 yo | Non-Swiss: 31.4% | FFQ | Swiss Dietary Guidelines |
| Schroeter et al., 2019 [27] | Case-study | USA | 57 | 19.94 ± 1.20 | NR | 1× 24hR | Dietary Guidelines for Americans/MyPlate |
| Irwin et al., 2019 [70] | Cross-sectional | Australia | 115 67.8% female | M = 22 ± 5 y | NR | Records | Australian Dietary Guidelines |
| Harrison et al., 2019 [36] | Cross-sectional | Canada | 50.2% female | M = 45.0 ± 0.3 y | NR | 1× 24hR | 2019 Canada Food Guide |
| Dıaz-Méndez and Garcıa-Espejo 2019 [30] | Longitudinal (2006–2011–12) | Spain | M = 25,2425 | ≥16 yo | NR | FFQ | Guide to Healthy Eating/Spanish Society for Community Nutrition |
| Mestral et al. 2019 [37] | Cross-Sectional | Switzerland | 15450 53.0% female | 48.8 ± 17.4 y | NR | FFQ | Swiss Dietary Guidelines |
| Bel et al. 2019 [38] | Cross-Sectional | Belgium | 3146 | 3–64 y: stratified by age | NR | 1× 24hR + FFQ | Flemish Active Food Triangle |
| Schwartz and Vernarelli et al. 2018 [35] | Cross-sectional | USA | 3194 | 18–50+ y | NR | 1× 24hR | Dietary Guidelines for Americans/MyPlate or MyPyramid |
| Jun et al., 2018 [59] | Cross-sectional | USA | 3142 100% female | 19–70 y | Non-Hispanic, White: 51.8% Non-Hispanic, Black: 19.3% Hispanic: 22.2% | 1× 24hR | Dietary Guidelines for Americans/MyPlate |
| Jones et al. 2018 | Cross-sectional | UK | 2045 56.5% female | ≥18 y | NR | 3d food record | UK Government Scientific Advisory Committee on Nutrition |
| Brassard et al. 2018 [67] | Cross-sectional | Canada | 1147 50.2% female | 18–65 y | Caucasian: 94.3% African-American: 2.4% Hispanic: 1.7% Other: 1.6% | 3× 24hR | 2007 Canada Food Guide |
| Al Thani et al., 2018 [39] | Cross-sectional | Qatar | 1109 48.6% female | 18–64 y | NR | FFQ | Qatar Dietary Guidelines |
| Stroebele-Benschop et al. 2018 [74] | Cross-sectional | German | 103 75.7% female | 18–30: 24.3 ± 3.1 y | NR | FFQ | German Nutrition Society |
| Chatelan et al., 2017 [40] | Cross-sectional | Switzerland | 2086 54.7% female | 18–75: 46.8 ± 15.8 y | NR | 2× 24hR | Swiss Dietary Guidelines |
| Mishra et al., 2015 [71] | Cross-sectional | Australia | 16227 100% female | 18–75: 43.5 ± 1.5 y | NR | FFQ | Australian Guide to Healthy Eating |
| Schumacher et al., 2014 [72] | Cross-sectional | Australia | 332 100% female | 13.7: 13.4–13.9 y | Australian: 86% (Aboriginal and Torres Strait Islander: 11%) European: 10% Asian: 1% Other: 3% | FFQ | Australian Guide to Healthy Eating |
| Yen and Lewis 2013 [32] | Randomized controlled trial | USA | 85:41 intervention vs. 44 control 100% female | 53.8 ± 6.6 y | Control vs. Intervention White: 95.5 vs. 100% African-American: 2.3% Hispanic: 2.3% | FFQ | Dietary Guidelines for Americans/MyPlate |
| Abreu et al., 2013 [43] | Cross-sectional | Switzerland | 4371 53.8% female | 35–75: 57.6 ± 10.5 y | Switzerland: 65.1% | FFQ | Swiss Dietary Guidelines |
| Black and Billette 2013 [44] | Cross-sectional | Canada | 33,850 43.2% female | 2–51+ y | French-British Canadian: 57% Other: 43.1% | 2× 24hR | 2007 Canada Food Guide |
| Rossiter et al., 2012 [31] | Longitudinal (2002 and 2005) | Canada | 247 46.4% female | 14–16 y | NR | FFQ | 2007 Canada Food Guide |
| Park et al., 2012 [45] | Cross-sectional | South Korea | 394 53.8% female | 13.96 ± 0.44 y | NR | 1× 24hR | Korean National Dietary Guidelines |
| McDaniel and Belury, 2012 [60] | Cross-sectional | USA | 60 50.0% female | 25.5 ± 6.3 y | Non-Hispanic, White: 78.3% Non-Hispanic, Black: 5.0% Asian: 11.7% Indian: 5.0% | FFQ | Dietary Guidelines for Americans, MyPyramid |
| Kirkpatrick et al., 2012 [46] | Cross-sectional | USA | 16,338 adults and children | Non-Hispanic, White: 41.1% Non-Hispanic, Black: 25.8% Mexican-American: 25.3% | 1× 24hR | Dietary Guidelines for Americans, MyPyramid | |
| Allen et al., 2011 [68] | Cross-sectional | Canada | 291 71.7% female | 20–35+ y | NR | Food record | 2007 Canada Dietary Guide |
| Winham and Florian 2010 [61] | Cross-sectional | USA | 171 100% female | 18–60: 34.4 ± 9.1 y | Hispanic: 76.7% Bicultural or English dominant: 23.4% | FFQ | Dietary Guidelines for Americans, MyPyramid |
| Niclasen and Schnor 2010 [75] | Cross-sectional | Greenland | 2462 | 11–17 y | NR | FFQ | Greenlandic Board of Nutrition |
| Kristjansdottir et al., 2010 [33] | Randomized controlled trial | Iceland | 106: 58 intervention and 48 control | 3–9 y | NR | 3d food records | Food-based Dietary Guidelines set for Icelandic population |
| Kreb-smith et al., 2010 [62] | Cross-sectional | USA | 16338 | 2–71+ y (stratified by age group and sex) | NR | 2× 24hR | Dietary Guidelines for Americans, MyPyramid |
| Vandevijvere et al., 2009 [73] | Cross-sectional | Belgium | 3168 43.4% female | ≥15 y (stratified by age) | NR | 2× 24hR + FFQ | Flemish Active Food Triangle |
| Kranz et al., 2009 [63] | Cross-sectional | USA | 214 45.8% female | 2–12 y (stratified age) | Non-Hispanic, White: 47.7% Non-Hispanic, Black: 43.5% Non-Hispanic, Asian: 18.7% Other: 10.3% Hispanic: 14.0% | 3× 24hR | Dietary Guidelines for Americans, MyPyramid |
| John et al., 2008 [69] | Cross-sectional | Canada | 1410 | Grade 7 and 11 students | NR | 1× 24hR + FFQ | 2007 Canada Food Guide |
| Serra-Majem et al., 2007 [47] | Cross-sectional | Spain | 2160 53.9% female | NR | NR | 2× 24hR + FFQ | Guide to Healthy Eating/Spanish Society for Community Nutrition |
| Tande et al., 2004 [48] | Cross-sectional | USA | 9111 51.4% female | 20–59: 37.4 ± 0.2 y | Non-Hispanic, White: 75% Non-Hispanic, Black: 10.4% Mexican-American: 5.9% Others: 8.5% | 1× 24hR | Dietary Guidelines for Americans, Food Pyramid |
| Pullen and Walker, 2002 [64] | Cross-sectional | USA | 371 100% female | 34–86: 62 y | White: 92.6% Black: 0.5% Hispanic: 2.2% Asian: 3.3% Native American: 0.8% Other: 0.5% | FFQ | Dietary Guidelines for Americans, Food Pyramid |
| Anding et al., 2001 [65] | Cross-sectional | USA | 103 100% female | 17–42: 21.6 ± 4.6 y | Black: 23% White: 32% Asian: 20% Hispanic: 23% | 3d food records | Dietary Guidelines for Americans, Food Pyramid |
| Brady et al., 2000 [66] | Cross-sectional | USA | 109 56.9% female | 7–14:10.2 ± 1.7 y | NR | 1× 24hR | Dietary Guidelines for Americans, Food Pyramid |
| Munõz et al., 1997 [49] | Cross-sectional | USA | 3307 50.2% female | 2–19: stratified by age | White, Non-Hispanic: 67.9% Black, Non-Hispanic: 16.6% Hispanic: 11.9% | 2× 24hR | Dietary Guidelines for Americans, Food Pyramid |
| Cleveland et al., 1997 [50] | Cross-sectional | USA | 8181 58.7% female | 20–60+: stratified by age | White, Non-Hispanic:77.1% Black, Non-Hispanic: 11.8% Hispanic: 8.3% Others: 2.8% | 1× 24hR + 2 food records | Dietary Guidelines for Americans, Food Pyramid |
| Gambera et al., 1995 [34] | Randomized- trial | USA | 32 37.5% female | 33.3 ± 6 y | NR | 3d food records | Dietary Guidelines for Americans, Food Pyramid |
| Low- and middle-income countries | |||||||
| Steele et al., 2020 [54] | Cross-sectional | Brazil | 10,116 78.0% female | 18–60+ y: stratified by age | NR | FFQ | Dietary Guideline for the Brazilian Population 2014 |
| Ansari and Samara 2018 [52] | Cross-sectional | Egypt | 2422 53.8% female | 18.9 ± 1.4 y | NR | FFQ | WHO dietary guidelines for Eastern Mediterranean region |
| Sousa and Costa 2018 [53] | Cross-sectional | Brazil | 506 57.0% female | 20–50+ y: stratified by age | NR | 2× 24hR | Brazilian Dietary Guideline 2006/Food Pyramid |
| Louzada et al., 2018 [51] | Cross-sectional | Brazil | 32,898 | ≥19 y | NR | 2× 24hR | Dietary Guideline for the Brazilian Population 2014 |
| Tian et al., 2017 [55] | Cross-sectional | China | 14,452 51.9% female | 20–59: 42.8 ± 10.3 y | NR | 3× 24hR | Chinese Food Pagoda |
| Batis et al.., 2016 [41] | Cross-sectional | Mexico | 7983 50.6% female | 5–20+ y: stratified by age | NR | 1× 24hR | Mexican Dietary Guidelines |
| Chin Koo et al., 2016 [56] | Cross-sectional | Malaysia | 1773 48.6% female | 7–12: stratified by age | Malay: 59.2% Chinese: 19.5% Indian: 6.7% Others: 14.7% | FFQ | Malaysian Dietary Guidelines |
| Verly-Jr et al. 2013 [42] | Cross-sectional | Brazil | 1661 56.5% female | 37.7 ± 29.9 y | NR | 2× 24hR | Dietary Guidelines for Brazilian population/Pyramid |
| Jayawardena et al., 2013 [57] | Cross-sectional | Sri Lanka | 490 65.5% female | 48.3 ± 15.6 y | Sinhalese: 75.6% Muslim: 5.9% Sri Lankan Tamil: 9.5% Indian Tamil: 9% | 2× 24hR | Food-based Dietary Guidelines for Sri Lanka and Dietary Guidelines for Brazilian population/Pyramid |
| Zhang et al., 2012 [58] | Cross-sectional | China | 2204 53.8% female | 12–17: 15.1 ± 1.9 y | NR | FFQ | Chinese Food Pagoda |
| Reference | Dietary Guidelines | Pictorial Image | Food Groups | Include Physical Activity Messages | Summary Results |
|---|---|---|---|---|---|
| High-income countries | |||||
| Ewers et al., 2020 [28] | Danish Food Based Dietary Guidelines | No image Key messages | Fruits and vegetables Fish Whole Grains Lean meats and lean cold meats Low-fat dairy products Saturated fat sources Sodium sources Sugar Water | Yes | Only 10% of the participants were identified as very high adherence; 17.3% high adherence; 54.4% intermediate adherence; 8.3% low adherence; and 9.9% very low-adherence. Based on table categorization of meeting the guideline proposed by the authors. |
| Schwartz and Vernarelli 2019 [35] | Dietary Guidelines for Americans | Plate and Pyramid | Fruits Vegetables Grains Dairy Protein Foods | No | Following MyPlate and MyPyramid showed better adherence to the recommendations than those who did not follow. More whole grains (1.1 vs. 0.8 servings), and vegetables (1.5 vs. 1.4 servings) Less refined grains (6 vs. 6.6 servings) and added sugar (18.6 vs. 20.5 tbs) sources |
| Schroeter et al., 2019 [27] | Dietary Guidelines for Americans | Plate and Pyramid | Fruits Vegetables Grains Dairy Protein Foods | No | Increased consumption of food groups after participating in education groups Fruit and vegetables and whole grains |
| Schuh et al., 2019 [29] | Swiss Dietary Guidelines | Pyramid | Beverages Vegetables and Fruits Grains, potatoes and pulses Dairy products, meat, eggs, fish and tofu Oils, fats, and nuts Sweets, salty snacks, alcohol | Yes | Participants are not meeting the guidelines five year after issuing the guideline, regardless of socio-demographic characteristics. Meeting at least three recommendations 1993: 26.1% 2006: 24.9% |
| Irwin et al., 2019 [70] | Australian Dietary Guidelines | Plate | Grains (mostly whole grains) Vegetables and legumes/beans Lean meats, and poultry, fish, eggs, tofu, nuts and seeds, and legumes/beans Milk, yogurt, cheese and/or alternatives mostly reduced fat Fruit Use small amounts of oils and fats Only sometimes and small amounts: sugar sweetened beverages, salty snacks and sweets. | No | Participants are not meeting the guidelines for the majority of the food groups Lean meats, and alternatives were the only group that students were meeting the recommendations Meeting the recommendations (female vs. male): Fruit: 0.7 vs. 1.3 servings/day Vegetables: 2.7 vs. 3.2 Meat and Alternatives: 3.0 vs. 2.2 Dairy and Alternatives: 1.3 Bread, cereals, grains: 4.3 vs. 3.3 Discretionary: 1.3 vs. 2.0 Fats and oils: 1.7 vs. 1.0 |
| Harrison et al., 2019 [36] | 2019 Canada Food Guide | Plate | Vegetables and Fruits Protein foods Whole grains Water | No | Greater consumption of saturated fats from all the food groups of the Canada Food Guide Protein Foods (milk and alternatives; and meats and alternatives) contributed 47.8% in total for saturated fats. “All other foods” were main contributors: fruit juices, refined grains, and salty snacks. |
| Diaz-Mendez and García-Espejo 2019 [30] | Guide to Healthy Eating–Spanish Society for Community Nutrition | Pyramid | Whole grains Fruits Vegetables and legumes Oils (especially olive oils) Lean meats, poultry, fish, eggs Beans and nuts Milk and dairy Water | Yes | Percent of participants meeting the guidelines: Fruits: 67.3% Vegetables: 43.7% Meat: 52.3% Breads: 86.6% Percent of participants not meeting the guidelines: Eggs: 59.3% Fish: 46.4% Pasta-rice-potatoes: 47.3% Sweets: 36.5% |
| Mestral et al., 2019 [37] | Swiss Dietary Guidelines | Pyramid | Beverages Vegetables and Fruits Grains, potatoes and pulses Dairy products, meat, eggs, fish and tofu Oils, fats, and nuts Sweets, salty snacks, alcohol | Yes | Less than 40% of the participants adhere to all of the guidelines Percent of participants meeting the guidelines: Fruits: 38.8% Vegetables: 20.5% Dairy: 19.4% Fish: 22.5% Meat: 9.1% Liquids (beverages): 39.4% |
| Bel et al., 2019 [38] | Flemish Active Food Triangle | Triangle | Cereals and Potatoes Vegetables Fruits Meat, fish, eggs, and meat alternatives Dairy and calcium-enriched products Oils and fatty products Sugary products Unsweetened beverages (water and tea) | Yes | Between years the participants adherence to guidelines deteriorated over the time for most groups Change in percent of participants meeting the guidelines: Water and sugar-free drinks: △+7% Bread and cereals: △−15% Potato, rice, and pasta: △+2% Vegetable: △−1% Fruit (including juices): △−3% Fruit (excluding juices): △−1% Dairy products and calcium-enriched products: △−1% Cheese: △+4% Meat, eggs, fish, and substitutes: △−2% Spreadable and cooking fat: △−4% |
| Schwartz and Vernarelli, 2018 [35] | Dietary Guidelines for Americans | MyPlate | Fruits Vegetables Grains Dairy Protein Foods | No | Participants who follow a MyPlate plan were able to meet the food groups requirements for the following groups: Dark green and orange vegetables Refined grains Whole grains Total meat Milk and dairy Sodium sources |
| Jun et al., 2018 [59] | Dietary Guidelines for Americans | MyPlate | Fruits Vegetables Grains Dairy Protein Foods | No | A small percentage of participants met the dietary guidelines: Fruits: 21.3% Vegetables: 11.4% Whole grains: 4.3% |
| Brassard et al., 2018 [67] | 2007 Canada’s Food Guide | Rainbow | Vegetables and fruits Grain products Milk and alternatives Meat and alternatives | No | Participants were consuming less than the recommendations for fruits and vegetables, and grain-products. Milk and alternatives; and Meat and alternatives are in line with the recommendations. |
| Stroebele-Benschop et al., 2018 [74] | German Dietary Guidelines | Circle | Cereals and potatoes Vegetables Fruits Milk and dairy products Meat, sausages, fish, and eggs Fats and oils | No | Participants were not meeting the recommendations for most of the food groups. Percentage of participants that met the recommendations: Vegetables: 12.9% Fruit: 37.6% Whole grain: 50.5% Milk and milk products: 45.5% Meat and meat products: 95.0% Fish: 15.8% Eggs: 80.2% Oil: 90.1% Fat: 89.1% Water and unsweetened beverages: 76.2% |
| Chatelan et al., 2017 [40] | Swiss Dietary Guidelines | Pyramid | Beverages Vegetables and Fruits Grains, potatoes and pulses Dairy products, meat, eggs, fish and tofu Oils, fats, and nuts Sweets, salty snacks, alcohol | Yes | Less than 1% follow all the food groups. Percentage of participants that met the recommendations: Fruit and vegetables: 18.0% Non-caloric beverages: 75.0% |
| Mishra et al., 2015 [71] | Australian Dietary Guidelines | Plate | Grains (mostly whole grains) Vegetables and legumes/beans Lean meats, and poultry, fish, eggs, tofu, nuts and seeds, and legumes/beans Milk, yogurt, cheese and/or alternatives mostly reduced fat Fruit Use small amounts of oils and fats Only sometimes and small amounts: sugar sweetened beverages, salty snacks and sweets. | No | Younger age participants were not meeting the recommendations for all the food groups. Middle-age participants were not meeting the recommendations for cereals, vegetables, and meat and alternatives. |
| Schumacher et al., 2014 [72] | Australian Dietary Guidelines | Plate | Grains (mostly whole grains) Vegetables and legumes/beans Lean meats, and poultry, fish, eggs, tofu, nuts and seeds, and legumes/beans Milk, yogurt, cheese and/or alternatives mostly reduced fat Fruit Use small amounts of oils and fats Only sometimes and small amounts: sugar sweetened beverages, salty snacks and sweets. | No | Participants were meeting the recommendations for the guideline for the majority of the groups. Fruit: 23.8% Vegetables: 28.6% Dairy: 15.7% Breads and Cereals: 5.7% The only exception was for the meat and substitutes group, where 69.3% were meeting them. |
| Yen and Lewis 2013 [32] | Dietary Guidelines for Americans | MyPlate | Fruits Vegetables Grains Dairy Protein Foods | No | After participating in an educational program, participants did not improve their intake for the groups: grains, vegetables, and meat and alternatives. They improved their intake for fruit, dairy, and oil. |
| De Abreu et al. 2013 [43] | Swiss Dietary Guidelines | Pyramid | Beverages Vegetables and Fruits Grains, potatoes and pulses Dairy products, meat, eggs, fish and tofu Oils, fats, and nuts Sweets, salty snacks, alcohol | Yes | Only 23% of the sample were meeting at least 3 recommendations. Fruits: 39.4% Vegetables: 7.1% Dairy: 8.4% Majority were meeting the recommendations for meat and fish. Meat: 61.3% Fish: 66.4% |
| Black and Billette, 2013 [44] | 2007 Canada’s Food Guide | Rainbow | Vegetables and fruits Grain products Milk and alternatives Meat and alternatives | No | Only 26.3% of participants met all of the recommendations. Dark green: 12% Orange fruit: 8% Potatoes: 10% Other: 43% |
| Rossiter et al., 2012 [31] | 2007 Canada’s Food Guide | Rainbow | Vegetables and fruits Grain products Milk and alternatives Meat and alternatives | No | Participants were consuming below the recommendations for fruits and vegetables, and grains. Milk and dairy were consumed in the recommendation range. Meat and alternatives were consumed above the recommendations. |
| Park et al., 2012 [45] | Korean National Dietary Guidelines | Wheels | Fruits Vegetables Meat, fish, eggs, and beans Milk Grains | Yes | Overall adherence was 3.23 (1–5 Likert scale) for meeting the recommendations. |
| Kirpatrick et al., 2012 [46] | Dietary Guidelines for Americans | MyPlate | Fruits Vegetables Grains Dairy Protein Foods | No | Over 50% of adults met the recommendations for total grains, meats, and beans; less then 20% of adults met the recommendations for other groups |
| Mc Daniel and Belury 2012 [60] | Dietary Guidelines for Americans | MyPlate | Fruits Vegetables Grains Dairy Protein Foods | No | Participants’ intakes of fruit and vegetables were below the recommendations. Meat and beans; and Milk and dairy were within the recommendations. Grains were above the recommendations Oils were below the recommendations. |
| Allen et al., 2011 [68] | 2007 Canada’s Food Guide | Rainbow | Vegetables and fruits Grain products Milk and alternatives Meat and alternatives | No | Less than 48% of the sample were meeting the recommendations for all groups (with females having a better adherence then males) Male vs. Female Vegetables and fruits: 9.5% vs. 17.9% Milk and alternatives: 16.2% vs. 22.2% Grain products: 16.2% vs. 38.2% |
| Winham and Florian, 2011 [61] | Dietary Guidelines for Americans | Pyramid | Fruits Vegetables Grains Milk Meat | Yes | Less than 30% of Hispanics adhere to the guidelines 7% of bi-racial group adhere to the guidelines. |
| Niclasen and Schnor, 2011 [75] | Greenlandic (similar to the Danish guidelines) | No image | Fruits Vegetables Traditional foods Whole grains Fat Sugar Water | Yes | Students meeting the guidelines varied from 14% to 87% depending on the groups. Diet variety: 87.0% Marine animals: 31.6% Local terrestrial animals and birds: 37.1% Fish: 31.8% Fruit: 14.8% Vegetables: 38.9% Potatoes: 79.7% Candies: 14.7% Soft-drinks: 18.6% Pre-cooked dinner: 83.4% |
| Kristjansdottir et al., 2010 [33] | Food-based dietary Guidelines set for Icelandic Population | Circle/Plate | Fruits and vegetables Cereals and cereal products Dairy products Animal source foods and nuts Oils and visible fats Water | Yes | After the intervention there was an improvement on the food groups intake, however, the participants from both intervention and control groups were still not meeting the recommendations. |
| Krebs-Smith et al., 2010 [62] | Dietary Guidelines for Americans | Pyramid | Fruits Vegetables Grains Milk Meat | Yes | Majority of the population did not meet the recommendations for all the food groups, with exception for total grains, and meat and beans. |
| Vandevijvere et al., 2009 [73] | Flemish Active Food Triangle | Triangle | Cereals and Potatoes Vegetables Fruits Meat, fish, eggs, and meat alternatives Dairy and calcium-enriched products Oils and fatty products Sugary products Unsweetened beverages (water and tea) | Yes | Population was consuming below the recommendations for liquids, grains, vegetables, fruits, and milk and soya products. Population was consuming above the recommendations for meats/fish/eggs/legumes/nuts/substitutes |
| Kranz et al., 2009 [63] | Dietary Guidelines for Americans | Pyramid | Fruits Vegetables Grains Milk Meat | Yes | Younger children presented a higher adherence to the guidelines than older children. Older children have less than 40% adherence for fruit and vegetables. |
| St. John et al., 2009 [69] | 2007 Canada’s Food Guide | Rainbow | Vegetables and fruits Grain products Milk and alternatives Meat and alternatives | No | Fruit and vegetables are the groups for which the children have the lowest adherence. Milk and dairy; and meat and alternatives have been less adherent to some specific subgroups: normal weight and overweight. |
| Serra-Majem et al., 2008 [47] | Guide to Healthy Eating–Spanish Society for Community Nutrition | Pyramid | Whole grains Fruits Vegetables and legumes Oils (especially olive oils) Lean meats, poultry, fish, eggs Beans and nuts Milk and dairy Water | Yes | Majority of the population were not meeting the recommendations for fruits (72.7%), vegetables (57.6%), and beans (58.1%). Majority of the population exceeded recommendation for intake of fatty meats and sausages (56.1%). Intake for bake goods was 20.2%, soft-drinks 21.8%, and fats 23.6%, and sugars 33.5%. |
| Tande et al., 2004 [48] | 1992 Dietary Guidelines for Americans | Pyramid | Bread, Cereal, Rice, Pasta Fruit Vegetable Meat, Poultry, Fish, Dry Beans, Eggs, and Nuts Milk, Yogurt, Cheese Fats and oils Sweets | No | Participants were not meeting the recommendations for all the groups, consuming fewer than the recommended. Serving/1000 kcal Dairy: 0.95 Fruit: 0.70 Vegetables: 1.55 Grain: 3.19 Meat: 1.06 |
| Pullen and Walker, 2002 [64] | 1992 Dietary Guidelines for Americans | Pyramid | Bread, Cereal, Rice, Pasta Fruit Vegetable Meat, Poultry, Fish, Dry Beans, Eggs, and Nuts Milk, Yogurt, Cheese Fats and oils Sweets | No | Women are not adhering the recommendations for the pyramid groups, with exception for fruits that have adherence of 65.4%. Meat: 38.6% Dairy: 48.1% Vegetables: 22.3% Grain products: 3.8% |
| Anding et al., 2001 [65] | 1992 Dietary Guidelines for Americans | Pyramid | Bread, Cereal, Rice, Pasta Fruit Vegetable Meat, Poultry, Fish, Dry Beans, Eggs, and Nuts Milk, Yogurt, Cheese Fats and oils Sweets | No | Less than 43% of the participants followed at least one recommendation from the guideline. Fruits, vegetables, and milk were consumed less than the recommendations. More than 60% of the participants exceeded the recommendations for fats, sugar and sodium. |
| Brady et al., 2000 [66] | 1992 Dietary Guidelines for Americans | Pyramid | Bread, Cereal, Rice, Pasta Fruit Vegetable Meat, Poultry, Fish, Dry Beans, Eggs, and Nuts Milk, Yogurt, Cheese Fats and oils Sweets | No | Participants from both sexes and ethnicities were consuming less than the recommendations for fruits and dairy. Participants also exceeded the recommendations for sugar and discretionary foods. |
| Muñoz et al., 1997 [49] | 1992 Dietary Guidelines for Americans | Pyramid | Bread, Cereal, Rice, Pasta Fruit Vegetable Meat, Poultry, Fish, Dry Beans, Eggs, and Nuts Milk, Yogurt, Cheese Fats and oils Sweets | No | Participants were not meeting (consuming less) the recommendations for fruit, vegetables, and grains. Dairy and meat intake met the recommendations. |
| Cleveland et al., 1997 [50] | 1992 Dietary Guidelines for Americans | Pyramid | Bread, Cereal, Rice, Pasta Fruit Vegetable Meat, Poultry, Fish, Dry Beans, Eggs, and Nuts Milk, Yogurt, Cheese Fats and oils Sweets | No | Participants were not meeting the recommendations (consuming less) for grains, dairy and fruits. Vegetables and meats were within the recommendations. |
| Gambera et al., 1995 [34] | 1992 Dietary Guidelines for Americans | Pyramid | Bread, Cereal, Rice, Pasta Fruit Vegetable Meat, Poultry, Fish, Dry Beans, Eggs, and Nuts Milk, Yogurt, Cheese Fats and oils Sweets | No | After intervention participants increased their intake for milk, vegetables, fruits, and grains, and decrease intake of meats. |
| Low- and middle-income countries | |||||
| Steele et al., 2020 [54] | Dietary Guidelines for the Brazilian population 2014 | No | Unprocessed or minimally processed foods Processed culinary ingredients Processed foods Ultra-processed foods | No | Slight increase in consumption of unprocessed/minimally processed foods after coronavirus disease 2019 (COVID-19) pandemic. Consumption of ultra-processed foods remains the same after COVID-19. |
| Sousa and Costa, 2018 [53] | Dietary Guidelines for the Brazilian population 2006 | Pyramid | Rice, bread, pasta, potato, cassava Fruits Vegetables Beans and nuts Milk, cheese, and yogurt Sugar and sweets Oils and fats | No | Participants were not meeting the guidelines for most of the food groups: Grains: 95.8% Vegetables: 74.1% Fruits: 49.4% Meat: 97.2% Beans: 93.5% Dairy products: 87.5% Fats and oils: 99.6% Sugars: 58.3% |
| Ansari and Samara 2018 [52] | WHO Dietary Guidelines for the Eastern Mediterranean region | Plate | Bread, cereals, potatoes, and rice Milk and dairy products Foods containing fat Foods/drinks containing sugar Meat, poultry, fish, dried beans, and eggs Fruit and vegetables | Yes | Participants had an adherence for most of the food groups below 45%, exception for cereal/cereal products that had an adherence of 71.8%. Sweets: 43.5% Cakes/Cookies: 44.2% Snacks: 33.0% Fast food/canned foods: 41.1% Lemonade/soft-drinks: 43.7% Fruits and vegetables: 33.4% Dairy products: 19.1% Meat/sausage products: 16.5% Fish/seafood: 32.1% |
| Louzada et al., 2018 [51] | Dietary Guidelines for the Brazilian population 2014 | No | Unprocessed or minimally processed foods Processed culinary ingredients Processed foods Ultra-processed foods | No | Consumption of unprocessed/minimally processed foods was higher than the other groups: Prevalence of intake: Minimally or unprocessed foods: 58.1% Processed culinary ingredients: 10.9% Processed foods: 10.6% Ultra-processed foods: 20.4% |
| Tian et al., 2017 [55] | Chinese Food Pagoda | Pagoda | Water Cereals and tubers Vegetables and fruits Meat and Poultry; Aquatic products; Eggs Milk and dairy products; soybeans and nuts; Salt and Oils | Yes | Participants were consuming oils and fats above the recommendations, while fruits, eggs, aquatic products, and milk were below recommendations. Vegetables were the only group that meet the recommendations. |
| Batis et al., 2016 [41] | Mexican Dietary Guidelines | Plate | Fruit and vegetables Cereals Beans and animal protein sources | No | Low proportion adheres to the recommendations. Legumes: 1–4% Seafood: 4–8% Fruit and vegetables: 7–16% Dairy: 9–23% Sugar-sweetened beverages: 10–22% High saturated fat and added sugar products: 14–42% Processed meat: 7–23% |
| Chin Koo et al., 2016 [56] | Malaysian Dietary Guidelines | Pyramid | Rice, cereals, noodles, and tubers Vegetables and fruits Animal source of foods and legumes Fats, sugar and salt | No | Average consumption of the guidelines was below 40% for most of the food groups, with exception for “meat/poultry” with 84.8% Cereals/grains: 40.1% Fruits: 13.4% Vegetables: 9.5% Fish: 24.7% Legumes: 8.9% Milk/Dairy products: 5.5% |
| Verly Jr. et al., 2013 [42] | Dietary Guidelines for the Brazilian population 2006 | Pyramid | Rice, bread, pasta, potato, cassava Fruits Vegetables Beans and nuts Milk, cheese, and yogurt Sugar and sweets Oils and fats | No | Participants were not meeting the recommendations for grains, fruits, vegetables, meat, oils, and sugars food groups. Participants were meeting the recommendations for milk and dairy, and beans/nuts groups. |
| Jayawardena et al., 2013 [57] | Food-Based Dietary Guidelines for Sri Lanka | Pyramid | Rice, bread, other cereals, and yams Fruits Vegetables Milk and/or Milk products Fish, pulses, meat, and eggs Nuts, oils, and seeds | No | Participants were exceeding the recommendations for grains, meats and pulses, and added sugars sources. Below recommendations for fruits, vegetables, and dairy. |
| Zang et al., 2012 [58] | Chinese Food Pagoda | Pagoda | Water Cereals and tubers Vegetables and fruits Meat and Poultry; Aquatic products; Eggs Milk and dairy products; soybeans and nuts; Salt and Oils | Yes | Majority of the participants were not meeting the recommendations for the following groups: Only 6.1%, 1.6% and 3.6% consumed the minimum recommendations for cereals, fruits, and vegetables. Participants consuming more than maximum recommendations for meats (65.4%). Dairy (67.4%), eggs (63.9%), and fish and shrimps (81.8%) were consumed less than the minimum recommendations. |
Publisher’s Note: MDPI stays neutral with regard to jurisdictional claims in published maps and institutional affiliations. |
© 2021 by the authors. Licensee MDPI, Basel, Switzerland. This article is an open access article distributed under the terms and conditions of the Creative Commons Attribution (CC BY) license (http://creativecommons.org/licenses/by/4.0/).
Share and Cite
Leme, A.C.B.; Hou, S.; Fisberg, R.M.; Fisberg, M.; Haines, J. Adherence to Food-Based Dietary Guidelines: A Systemic Review of High-Income and Low- and Middle-Income Countries. Nutrients 2021, 13, 1038. https://0-doi-org.brum.beds.ac.uk/10.3390/nu13031038
Leme ACB, Hou S, Fisberg RM, Fisberg M, Haines J. Adherence to Food-Based Dietary Guidelines: A Systemic Review of High-Income and Low- and Middle-Income Countries. Nutrients. 2021; 13(3):1038. https://0-doi-org.brum.beds.ac.uk/10.3390/nu13031038
Chicago/Turabian StyleLeme, Ana Carolina B., Sophia Hou, Regina Mara Fisberg, Mauro Fisberg, and Jess Haines. 2021. "Adherence to Food-Based Dietary Guidelines: A Systemic Review of High-Income and Low- and Middle-Income Countries" Nutrients 13, no. 3: 1038. https://0-doi-org.brum.beds.ac.uk/10.3390/nu13031038