
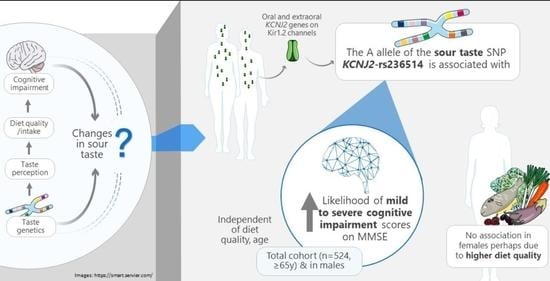
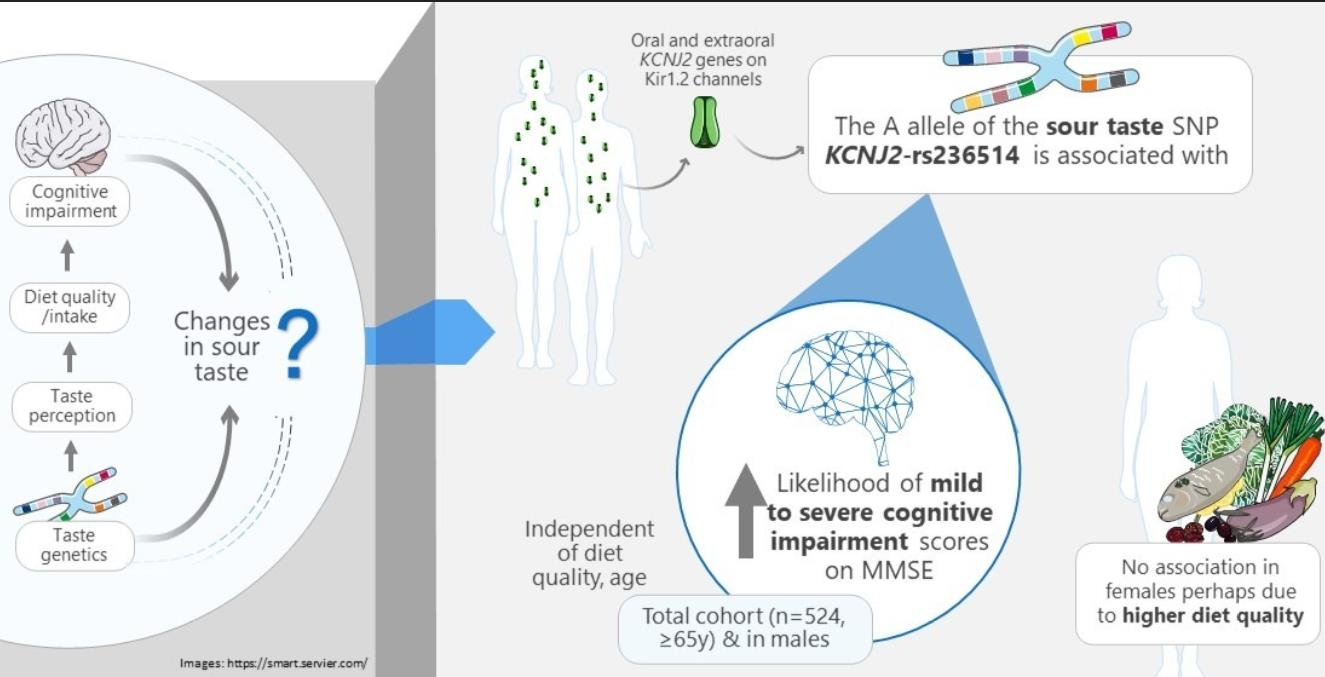
Association between Sour Taste SNP KCNJ2-rs236514, Diet Quality and Mild Cognitive Impairment in an Elderly Cohort

 , , , , , and
Abstract
:
1. Introduction
2. Materials and Methods
2.1. Subjects
2.2. Demographics and Anthropometrics
2.3. Genotyping
2.4. Cognitive Assessment
2.5. Diet Quality Indices
2.6. Statistical Analysis
3. Results
3.1. Participant Characteristics
3.2. Genotype Distributions
3.3. MMSE Distributions
3.4. Relationships between Presence of the KCNJ2-rs236514 Variant (A) Allele and Confounding Variables
3.5. Relationships between MMSE Scores and Confounding Variables
3.6. Relationships between KCNJ2-rs236514 and MCI (MMSE)
3.7. Relationships between KCNJ2-rs236514 and MMSE Scores Indicative of MCI, Adjusting for the Diet Quality Indices
4. Discussion
5. Conclusions
Author Contributions
Funding
Institutional Review Board Statement
Informed Consent Statement
Data Availability Statement
Acknowledgments
Conflicts of Interest
References
- National Centre for Social and Economic Modelling. Economic Cost of Dementia in Australia 2016–2056; Institute for Governance and Policy Analysis, University of Canberra: Canberra, Australia, 2017. [Google Scholar]
- World Health Organisation. Dementia. Available online: https://www.who.int/news-room/fact-sheets/detail/dementia (accessed on 23 January 2020).
- Mitchell, A.J.; Kemp, S.; Benito-León, J.; Reuber, M. The influence of cognitive impairment on health-related quality of life in neurological disease. Acta Neuropsychiatr. 2010, 22, 2–13. [Google Scholar] [CrossRef]
- Hussenoeder, F.S.; Conrad, I.; Roehr, S.; Fuchs, A.; Pentzek, M.; Bickel, H.; Moesch, E.; Weyerer, S.; Werle, J.; Wiese, B.; et al. Mild cognitive impairment and quality of life in the oldest old: A closer look. Qual. Life Res. 2020, 29, 1675–1683. [Google Scholar] [CrossRef] [Green Version]
- Caracciolo, B.; Gatz, M.; Xu, W.; Marengoni, A.; Pedersen, N.L.; Fratiglioni, L. Relationship of subjective cognitive impairment and cognitive impairment no dementia to chronic disease and multimorbidity in a nation-wide twin study. J. Alzheimer’s Dis. 2013, 36, 275–284. [Google Scholar] [CrossRef] [PubMed] [Green Version]
- Chen, X.; Maguire, B.; Brodaty, H.; O’Leary, F. Dietary patterns and cognitive health in older adults: A systematic review. J. Alzheimer’s Dis. 2019, 67, 583–619. [Google Scholar] [CrossRef]
- Jiang, X.; Huang, J.; Song, D.; Deng, R.; Wei, J.; Zhang, Z. Increased consumption of fruit and vegetables is related to a reduced risk of cognitive impairment and dementia: Meta-analysis. Front. Aging Neurosci. 2017, 9, 18. [Google Scholar] [CrossRef] [Green Version]
- Solfrizzi, V.; Custodero, C.; Lozupone, M.; Imbimbo, B.P.; Valiani, V.; Agosti, P.; Schilardi, A.; D’Introno, A.; La Montagna, M.; Calvani, M.; et al. Relationships of dietary patterns, foods, and micro- and macronutrients with Alzheimer’s disease and late-life cognitive disorders: A systematic review. J. Alzheimer’s Dis. 2017, 59, 815–849. [Google Scholar] [CrossRef] [Green Version]
- Van den Brink, A.C.; Brouwer-Brolsma, E.M.; Berendsen, A.A.M.; Van Den Rest, O. The mediterranean, dietary approaches to stop hypertension (DASH), and mediterranean-DASH intervention for neurodegenerative delay (MIND) diets are associated with less cognitive decline and a lower risk of Alzheimer’s disease—A review. Adv. Nutr. 2019, 10, 1040–1065. [Google Scholar] [CrossRef]
- Chamoun, E.; Carroll, N.A.; Duizer, L.M.; Qi, W.; Feng, Z.; Darlington, G.; Duncan, A.M.; Haines, J.; Ma, D. The relationship between single nucleotide polymorphisms in taste receptor genes, taste function and dietary intake in preschool-aged children and adults in the Guelph family health study. Nutrients 2018, 10, 990. [Google Scholar] [CrossRef] [Green Version]
- Shen, Y.; Kennedy, O.B.; Methven, L. Exploring the effects of genotypical and phenotypical variations in bitter taste sensitivity on perception, liking and intake of brassica vegetables in the UK. Food Qual. Prefer. 2016, 50, 71–81. [Google Scholar] [CrossRef]
- Taruno, A.; Nomura, K.; Kusakizako, T.; Ma, Z.; Nureki, O.; Foskett, J.K. Taste transduction and channel synapses in taste buds. Pflügers Archiv. Eur. J. Physiol. 2021, 473, 3–13. [Google Scholar] [CrossRef]
- Román, G.; Jackson, R.; Gadhia, R.; Román, A.; Reis, J. Mediterranean diet: The role of long-chain ω-3 fatty acids in fish; polyphenols in fruits, vegetables, cereals, coffee, tea, cacao and wine; probiotics and vitamins in prevention of stroke, age-related cognitive decline, and Alzheimer disease. Rev. Neurol. 2019, 175, 724–741. [Google Scholar] [CrossRef]
- Sakai, M.; Kazui, H.; Shigenobu, K.; Komori, K.; Ikeda, M.; Nishikawa, T. Gustatory dysfunction as an early symptom of se-mantic dementia. Dement. Geriatr. Cognit. Dis. Extra 2017, 7, 395–405. [Google Scholar] [CrossRef] [Green Version]
- Kouzuki, M.; Ichikawa, J.; Shirasagi, D.; Katsube, F.; Kobashi, Y.; Matsumoto, H.; Chao, H.; Yoshida, S.; Urakami, K. Detection and recognition thresholds for five basic tastes in patients with mild cognitive impairment and Alzheimer’s disease dementia. BMC Neurol. 2020, 20, 1–11. [Google Scholar] [CrossRef] [Green Version]
- Sakai, M.; Ikeda, M.; Kazui, H.; Shigenobu, K.; Nishikawa, T. Decline of gustatory sensitivity with the progression of Alzheimer’s disease. Int. Psychogeriatr. 2016, 28, 511–517. [Google Scholar] [CrossRef]
- Ogawa, T.; Irikawa, N.; Yanagisawa, D.; Shiino, A.; Tooyama, I.; Shimizu, T. Taste detection and recognition thresholds in Japanese patients with Alzheimer-type dementia. Auris Nasus Larynx 2017, 44, 168–173. [Google Scholar] [CrossRef]
- Lang, C.; Leuschner, T.; Ulrich, K.; Stößel, C.; Heckmann, J.; Hummel, T. Taste in dementing diseases and Parkinsonism. J. Neurol. Sci. 2006, 248, 177–184. [Google Scholar] [CrossRef]
- Wise, P.M.; Hansen, J.L.; Reed, D.R.; Breslin, P.A.S. Twin study of the heritability of recognition thresholds for sour and salty taste. Chem. Senses 2007, 32, 749–754. [Google Scholar] [CrossRef] [PubMed] [Green Version]
- Törnwall, O.; Silventoinen, K.; Keskitalo-Vuokko, K.; Perola, M.; Kaprio, J.; Tuorila, H. Genetic contribution to sour taste preference. Appetite 2012, 58, 687–694. [Google Scholar] [CrossRef] [PubMed]
- Beckett, E.L.; Martin, C.; Yates, Z.; Veysey, M.; Duesing, K.; Lucock, M. Bitter taste genetics—the relationship to tasting, liking, consumption and health. Food Funct. 2014, 5, 3040–3054. [Google Scholar] [CrossRef] [PubMed]
- Diószegi, J.; Llanaj, E.; Ádány, R. Genetic background of taste perception, taste preferences, and its nutritional implications: A systematic review. Front. Genet. 2019, 10. [Google Scholar] [CrossRef] [Green Version]
- Hibino, H.; Inanobe, A.; Furutani, K.; Murakami, S.; Findlay, I.; Kurachi, Y. Inwardly rectifying potassium channels: Their structure, function, and physiological roles. Physiol. Rev. 2010, 90, 291–366. [Google Scholar] [CrossRef] [Green Version]
- Ye, W.; Chang, R.B.; Bushman, J.D.; Tu, Y.-H.; Mulhall, E.M.; Wilson, C.E.; Cooper, A.J.; Chick, W.S.; Hill-Eubanks, D.C.; Nelson, M.T.; et al. The K+ channel KIR2.1 functions in tandem with proton influx to mediate sour taste transduction. Proc. Natl. Acad. Sci. USA 2016, 113, E229–E238. [Google Scholar] [CrossRef] [Green Version]
- Chamoun, E.; Mutch, D.M.; Allen-Vercoe, E.; Buchholz, A.C.; Duncan, A.M.; Spriet, L.L.; Haines, J.; Ma, D.W.L. A review of the associations between single nucleotide polymorphisms in taste receptors, eating behaviors, and health. Crit. Rev. Food Sci. Nutr. 2018, 58, 194–207. [Google Scholar] [CrossRef] [Green Version]
- Ferraris, C.; Turner, A.; Kaur, K.; Piper, J.; Veysey, M.; Lucock, M.; Beckett, E.L. Salt taste genotype, dietary habits and biomarkers of health: No associations in an elderly cohort. Nutrients 2020, 12, 1056. [Google Scholar] [CrossRef] [Green Version]
- Abbott, K.A.; Veysey, M.; Lucock, M.; Niblett, S.; King, K.; Burrows, T.; Garg, M.L. Sex-dependent association between erythrocyte n-3 PUFA and type 2 diabetes in older overweight people. Br. J. Nutr. 2016, 115, 1379–1386. [Google Scholar] [CrossRef] [Green Version]
- Beckett, E.L.; Duesing, K.; Martin, C.; Jones, P.; Furst, J.; King, K.; Niblett, S.; Yates, Z.; Veysey, M.; Lucock, M. Relationship between methylation status of vitamin D-related genes, vitamin D levels, and methyl-donor biochemistry. J. Nutr. Intermed. Metab. 2016, 6, 8–15. [Google Scholar] [CrossRef] [Green Version]
- Marfell-Jones, M.; Norton, K.; Carter, L.; Olds, T. International Standards for Anthropometric Assessment; International Society for the Advancement of Kinanthropometry: Adelaide, Australia, 2001. [Google Scholar]
- Beckett, E.L.; Martin, C.; Boyd, L.; Porter, T.; King, K.; Niblett, S.; Yates, Z.; Veysey, M.; Lucock, M. Reduced plasma homocysteine levels in elderly Australians following mandatory folic acid fortification—A comparison of two cross-sectional cohorts. J. Nutr. Intermed. Metab. 2017, 8, 14–20. [Google Scholar] [CrossRef]
- QIAGEN. QIAamp® DNA Mini and Blood Mini Handbook, 3rd ed.; QIAGEN: Hilden, Germany, 2012. [Google Scholar]
- Baek, M.J.; Kim, K.; Park, Y.H.; Kim, S. The validity and reliability of the mini-mental state examination-2 for detecting mild cognitive impairment and Alzheimer’s disease in a Korean population. PLoS ONE 2016, 11, e0163792. [Google Scholar] [CrossRef]
- Bossers, W.J.; Van Der Woude, L.H.; Boersma, F.; Scherder, E.J.; Van Heuvelen, M.J. Recommended measures for the assessment of cognitive and physical performance in older patients with dementia: A systematic review. Dement. Geriatr. Cogn. Disord. Extra 2012, 2, 589–609. [Google Scholar] [CrossRef]
- Arevalo-Rodriguez, I.; Smailagic, N.; Roqué I Figuls, M.; Ciapponi, A.; Sanchez-Perez, E.; Giannakou, A.; Pedraza, O.L.; Bonfill Cosp, X.; Cullum, S. Mini-Mental State Examination (MMSE) for the detection of Alzheimer’s disease and other dementias in people with mild cognitive impairment (MCI). Cochrane Database Syst. Rev. 2015, CD010783. [Google Scholar] [CrossRef]
- Buchhave, P.; Stomrud, E.; Warkentin, S.; Blennow, K.; Minthon, L.; Hansson, O. Cube copying test in combination with rCBF or CSF A[beta]42 predicts development of Alzheimer’s disease. Dement. Geriat. Cognit. Dis. 2008, 25, 544–552. [Google Scholar] [CrossRef]
- O’Caoimh, R.; Gao, Y.; Svendovski, A.; Gallagher, P.; Eustace, J.; Molloy, D.W. Comparing approaches to optimize cut-off scores for short cognitive screening instruments in mild cognitive impairment and dementia. J. Alzheimer’s Dis. 2017, 57, 123–133. [Google Scholar] [CrossRef] [Green Version]
- Palmqvist, S.; Hertze, J.; Minthon, L.; Wattmo, C.; Zetterberg, H.; Blennow, K.; Londos, E.; Hansson, O. Comparison of brief cognitive tests and CSF biomarkers in predicting Alzheimer’s disease in mild cognitive impairment: Six-year follow-up study. PLoS ONE 2012, 7, e38639. [Google Scholar] [CrossRef] [Green Version]
- Pozueta, A.; Rodríguez-Rodríguez, E.; Vazquez-Higuera, J.L.; Mateo, I.; Sánchez-Juan, P.; González-Perez, S.; Berciano, J.; Combarros, O. Detection of early Alzheimer’s disease in MCI patients by the combination of MMSE and an episodic memory test. BMC Neurol. 2011, 11, 78. [Google Scholar] [CrossRef] [Green Version]
- Xu, G.; Meyer, J.S.; Thornby, J.; Chowdhury, M.; Quach, M. Screening for mild cognitive impairment (MCI) utilizing combined mini-mental-cognitive capacity examinations for identifying dementia prodromes. Int. J. Geriatr. Psychiatry 2002, 17, 1027–1033. [Google Scholar] [CrossRef] [PubMed]
- Dufficy, L.; Naumovski, N.; Ng, X.; Blades, B.; Yates, Z.; Travers, C.; Lewis, P.; Sturm, J.; Veysey, M.; Roach, P.D.; et al. G80A reduced folate carrier SNP influences the absorption and cellular translocation of dietary folate and its association with blood pressure in an elderly population. Life Sci. 2006, 79, 957–966. [Google Scholar] [CrossRef] [PubMed]
- Xyris Software. Foodworks. Available online: https://xyris.com.au (accessed on 13 January 2021).
- National Health & Medical Research Council. The Australian Dietary Guidelines. Available online: https://www.eatforhealth.gov.au/guidelines (accessed on 13 January 2021).
- National Health and Medical Research Council. Australian Guide to Healthy Eating. Available online: https://www.eatforhealth.gov.au/guidelines/australian-guide-healthy-eating (accessed on 13 January 2021).
- Australian Institute of Health and Welfare. Towards National Indicators for Food and Nutrition: An AIHW View—Reporting Against the Dietary Guidelines for Australian Adults. Available online: https://www.aihw.gov.au/reports/food-nutrition/towards-national-indicators-food-nutrition/contents/table-of-contents (accessed on 13 January 2021).
- McNaughton, S.A.; Ball, K.; Crawford, D.; Mishra, G.D. An index of diet and eating patterns is a valid measure of diet quality in an Australian population. J. Nutr. 2008, 138, 86–93. [Google Scholar] [CrossRef] [PubMed] [Green Version]
- Collins, C.E.; Burrows, T.L.; Rollo, M.E.; Boggess, M.M.; Watson, J.F.; Guest, M.; Duncanson, K.; Pezdirc, K.; Hutchesson, M.J. The comparative validity and reproducibility of a Diet Quality Index for adults: The Australian recommended food score. Nutrents 2015, 7, 785–798. [Google Scholar] [CrossRef] [PubMed] [Green Version]
- Australian Institute of Health and Welfare. Australian Diet Quality Index Project; Australian Institute of Health and Welfare: Canberra, Australia, 2007.
- Puputti, S.; Aisala, H.; Hoppu, U.; Sandell, M. Factors explaining individual differences in taste sensitivity and taste modality recognition among Finnish adults. J. Sens. Stud. 2019, 34. [Google Scholar] [CrossRef] [Green Version]
- Fischer, M.E.; Cruickshanks, K.J.; Schubert, C.R.; Pinto, A.; Klein, B.E.K.; Klein, R.; Nieto, F.J.; Pankow, J.S.; Huang, G.-H.; Snyder, D.J. Taste intensity in the Beaver Dam Offspring Study. Laryngoscope 2013, 123, 1399–1404. [Google Scholar] [CrossRef] [Green Version]
- Barragán, R.; Coltell, O.; Portolés, O.; Asensio, E.M.; Sorlí, J.V.; Ortega-Azorín, C.; González, J.I.; Sáiz, C.; Fernández-Carrión, R.; Ordovas, J.M.; et al. Bitter, sweet, salty, sour and umami taste perception decreases with age: Sex-specific analysis, modulation by genetic variants and taste-preference associations in 18 to 80 year-old subjects. Nutrients 2018, 10, 1539. [Google Scholar] [CrossRef] [Green Version]
- Schwerk, J.; Savan, R. Translating the Untranslated Region. J. Immunol. 2015, 195, 2963–2971. [Google Scholar] [CrossRef] [Green Version]
- Steri, M.; Idda, M.L.; Whalen, M.B.; Orrú, V. Genetic variants in mRNA untranslated regions. Wiley Interdiscip. Rev. RNA 2018, 9, e1474. [Google Scholar] [CrossRef]
- National Center for Biotechnology Information National Library of Medicine. Database of Single Nucleotide Polymorphisms (dbSNP). Available online: https://0-www-ncbi-nlm-nih-gov.brum.beds.ac.uk/snp/ (accessed on 28 January 2021).
- Ansoleaga, B.; Garcia-Esparcia, P.; Llorens, F.; Moreno, J.; Aso, E.; Ferrer, I. Dysregulation of brain olfactory and taste receptors in AD, PSP and CJD, and AD-related model. Neuroscience 2013, 248, 369–382. [Google Scholar] [CrossRef]
- Ansoleaga, B.; Garcia-Esparcia, P.; Pinacho, R.; Haro, J.M.; Ramos, B.; Ferrer, I. Decrease in olfactory and taste receptor expression in the dorsolateral prefrontal cortex in chronic schizophrenia. J. Psychiatr. Res. 2015, 60, 109–116. [Google Scholar] [CrossRef]
- Garcia-Esparcia, P.; Schlüter, A.; Carmona, M.; Moreno, J.; Ansoleaga, B.; Torrejón-Escribano, B.; Gustincich, S.; Pujol, A.; Ferrer, I. Functional genomics reveals dysregulation of cortical olfactory receptors in parkinson disease: Novel putative chemoreceptors in the human brain. J. Neuropathol. Exp. Neurol. 2013, 72, 524–539. [Google Scholar] [CrossRef] [Green Version]
- Huang, Y.A.; Pereira, E.; Roper, S.D. Acid stimulation (sour taste) elicits GABA and serotonin release from mouse taste cells. PLoS ONE 2011, 6, e25471. [Google Scholar] [CrossRef] [Green Version]
- Porges, E.C.; Woods, A.J.; Edden, R.A.; Puts, N.A.; Harris, A.D.; Chen, H.; Garcia, A.M.; Seider, T.R.; Lamb, D.G.; Williamson, J.B.; et al. Frontal gamma-aminobutyric acid concentrations are associated with cognitive performance in older adults. Biol. Psychiatry: Cogn. Neurosci. Neuroimaging 2017, 2, 38–44. [Google Scholar] [CrossRef] [Green Version]
- Huang, D.; Liu, D.; Yin, J.; Qian, T.; Shrestha, S.; Ni, H. Glutamate-glutamine and GABA in brain of normal aged and patients with cognitive impairment. Eur. Radiol. 2016, 27, 2698–2705. [Google Scholar] [CrossRef]
- Borodovitsyna, O.; Flamini, M.; Chandler, D. Noradrenergic modulation of cognition in health and disease. Neural Plast. 2017, 2017, 1–14. [Google Scholar] [CrossRef] [PubMed] [Green Version]
- Cowen, P.; Sherwood, A.C. The role of serotonin in cognitive function: Evidence from recent studies and implications for understanding depression. J. Psychopharmacol. 2013, 27, 575–583. [Google Scholar] [CrossRef] [PubMed]
- Mendelsohn, D.; Riedel, W.J.; Sambeth, A. Effects of acute tryptophan depletion on memory, attention and executive functions: A systematic review. Neurosci. Biobehav. Rev. 2009, 33, 926–952. [Google Scholar] [CrossRef] [PubMed]
- Švob Štrac, D.; Pivac, N.; Mück-Šeler, D. The serotonergic system and cognitive function. Transl. Neurosci. 2016, 7, 35–49. [Google Scholar] [CrossRef] [PubMed] [Green Version]
- GTExPortal. Gene Expression for KCNJ2. Available online: https://gtexportal.org/home/gene/KCNJ2 (accessed on 24 January 2021).
- Uhlén, M.; Fagerberg, L.; Hallström, B.M.; Lindskog, C.; Oksvold, P.; Mardinoglu, A.; Sivertsson, Å.; Kampf, C.; Sjöstedt, E.; Asplund, A.; et al. Proteomics. Tissue-based map of the human proteome. Science 2015, 347, 1260419. [Google Scholar] [CrossRef] [PubMed]
- Shi, F.; Liu, B.; Zhou, Y.; Yu, C.; Jiang, T. Hippocampal volume and asymmetry in mild cognitive impairment and Alzheimer’s disease: Meta-analyses of MRI studies. Hippocampus 2009, 19, 1055–1064. [Google Scholar] [CrossRef] [PubMed]
- Poulin, S.P.; Dautoff, R.; Morris, J.C.; Barrett, L.F.; Dickerson, B.C. Amygdala atrophy is prominent in early Alzheimer’s disease and relates to symptom severity. Psychiatry Res. Neuroimaging 2011, 194, 7–13. [Google Scholar] [CrossRef] [Green Version]
- Ledig, C.; Schuh, A.; Guerrero, R.; Heckemann, R.A.; Rueckert, D. Structural brain imaging in Alzheimer’s disease and mild cognitive impairment: Biomarker analysis and shared morphometry database. Sci. Rep. 2018, 8, 1–16. [Google Scholar] [CrossRef] [Green Version]
- Leisman, G.; Braun-Benjamin, O.; Melillo, R. Cognitive-motor interactions of the basal ganglia in development. Front. Syst. Neurosci. 2014, 8, 16. [Google Scholar] [CrossRef] [PubMed] [Green Version]

| Variable | Total | Females | Males | p | ||||||
|---|---|---|---|---|---|---|---|---|---|---|
| Mean (SD) | Min | Max | Mean (SD) | Min | Max | Mean (SD) | Min | Max | ||
| Age (years) | 77.6 (±6.7) | 65.0 | 94.0 | 77.7 (±6.7) | 65 | 94 | 77.4 (±6.8) | 65 | 93 | 0.6 |
| BMI (kg/m2) | 28.6 (±4.8) | 17.1 | 46.3 | 28.6 (±5.0) | 17.6 | 46.3 | 28.6 (±4.5) | 17.1 | 45.4 | 0.9 |
| DGI | 96.8 (±15.9) | 30.9 | 132.6 | 99.0 (±16.3) | 30.9 | 132.6 | 94.2 (±15.0) | 51.8 | 130.4 | 0.0005 |
| ARFS | 29.0 (±8.0) | 6.0 | 50.0 | 29.9 (±8.1) | 6 | 50 | 27.8 (±7.7) | 10 | 49 | 0.003 |
| Aust-HEI | 30.3 (±9.5) | 4.9 | 50.8 | 32.0 (±9.1) | 6.4 | 50.8 | 28.3 (±9.7) | 4.9 | 46.5 | <0.0001 |
| Variable | Total | Females | Males | p |
|---|---|---|---|---|
| n (%) | n (%) | n (%) | ||
| Sex | ||||
| Males | 239 (45.6) | |||
| Females | 285 (54.4) | |||
| Income | <0.0001 | |||
| ≤AUD $20,000 per year | 161 (31.5) | 127 (46.2) | 34 (14.4) | |
| >AUD $20,000 per year | 350 (68.5) | 148 (53.8) | 202 (85.6) | |
| Education | 0.0001 | |||
| ≤Trade qualification | 171 (32.7) | 113 (39.8) | 58 (24.3) | |
| TAFE or higher | 352 (67.3) | 171 (60.2) | 181 (75.7) | |
| Smoking | <0.0001 | |||
| History of smoking | 259 (49.4) | 100 (35.1) | 159 (66.5) | |
| Never smoked | 265 (50.6) | 185 (64.9) | 80 (33.5) |
| Genotype | Total | Females | Males | p |
|---|---|---|---|---|
| n (%) | n (%) | n (%) | ||
| KCNJ2-A allele present | 425 (81.1) | 236 (82.8) | 189 (79.0) | 0.3 |
| KCNJ2-A allele absent | 99 (18.9) | 49 (17.2) | 50 (20.9) |
| MMSE | Total | Female | Male | p |
|---|---|---|---|---|
| n (%) | n (%) | n (%) | ||
| MCI (≤26) | 92 (17.6) | 47 (16.5) | 45 (18.8) | 0.5 |
| Normal cognition (>27) | 432 (82.4) | 238 (83.5) | 194 (81.2) |
| Variable | Total | Females | Males | ||||||
|---|---|---|---|---|---|---|---|---|---|
| LSM (95% CoI) | p | LSM (95% CoI) | p | LSM (95% CoI) | p | ||||
| A Allele Present | A Allele Absent | A Allele Present | A Allele Absent | A Allele Present | A Allele Absent | ||||
| Age (years) | 77.8 (77.2–78.5) | 76.5 (75.1–77.8) | 0.07 | 78.1 (77.2–78.9) | 75.9 (73.2–78.9) | 0.04 | 77.5 (76.5–78.5) | 77.0 (75.1–78.9) | 0.7 |
| BMI (kg/m2) | 28.7 (28.2–29.2) | 28.0 (27.0–28.9) | 0.2 | 28.4 (27.7–29.1) | 29.1 (27.6–30.5) | 0.4 | 29.0 (28.4–28.1) | 26.8 (25.6–28.1) | 0.002 |
| DGI | 97.2 (95.7–98.7) | 94.9 (91.8–98.0) | 0.2 | 99.7 (93.1–102.3) | 97.7 (93.2–101.3) | 0.5 | 94.7 (92.5–96.8) | 92.2 (88.0–96.4) | 0.3 |
| ARFS | 28.9 (28.1–29.7) | 29.1 (27.5–30.7) | 0.9 | 29.5 (28.5–30.5) | 31.9 (29.7–34.2) | 0.06 | 28.2 (24.2–28.4) | 26.3 (24.2–28.4) | 0.1 |
| Aust-HEI | 30.5 (29.6–31.4) | 29.5 (27.7–31.4) | 0.4 | 32.0 (30.8–33.2) | 32.2 (29.6–34.7) | 0.9 | 28.7 (27.3–30.0) | 27.0 (24.3–29.7) | 0.3 |
| Variable | Total | Females | Males | ||||||
|---|---|---|---|---|---|---|---|---|---|
| MMSE LSM (95% CoI) | p | MMSE LSM (95% CoI) | p | MMSE LSM (95% CoI) | p | ||||
| ≤26 | >27 | ≤26 | >27 | ≤26 | >27 | ||||
| Age (years) | 78.4 (77.0–79.8) | 77.4 (76.7–78.0) | 0.2 | 80.1 (78.1–82.0) | 77.2 (76.4–78.1) | 0.009 | 76.7 (74.7–78.8) | 77.6 (76.6–78.5) | 0.5 |
| BMI (kg/m2) | 28.7 (27.6–29.7) | 28.5 (28.1–29.0) | 0.8 | 28.4 (26.8–30.0) | 28.6 (27.9–29.2) | 0.8 | 28.9 (27.5–30.3) | 28.5 (27.8–29.1) | 0.6 |
| DGI | 94.7 (91.4–98.1) | 97.2 (95.7–98.7) | 0.2 | 97.3 (92.5–102.1) | 99.3 (97.2–101.3) | 0.5 | 92.1 (87.5–96.6) | 94.6 (92.5–96.7) | 0.3 |
| ARFS | 26.6 (24.9–28.2) | 29.4 (28.7–30.2) | 0.002 | 29.0 (26.6–31.4) | 30.1 (29.1–31.1) | 0.4 | 24.1 (21.8–26.3) | 28.6 (27.6–29.7) | 0.0004 |
| Aust-HEI | 29.4 (27.4–31.4) | 30.5 (29.6–31.4) | 0.3 | 32.6 (30.0–35.2) | 31.9 (30.8–33.1) | 0.7 | 26.1 (23.2–29.0) | 28.8 (27.4–30.2) | 0.1 |
| Variable | Total | Females | Males | ||||||
|---|---|---|---|---|---|---|---|---|---|
| MMSE LSM (95% CoI) | p | MMSE LSM (95% CoI) | p | MMSE LSM (95% CoI) | p | ||||
| ≤26 | >27 | ≤26 | >27 | ≤26 | >27 | ||||
| Sex | 0.8 (0.5–1.2) | 1.3 (0.8–2.0) | 0.3 | ||||||
| Income | 0.8 (0.5–1.3) | 1.3 (0.8–2.1) | 0.3 | 0.8 (0.4–1.4) | 1.3 (0.7–2.4) | 0.4 | 1.0 (0.4–2.4) | 1.0 (0.4–2.6) | 0.9 |
| Education | 0.6 (0.4–0.9) | 1.6 (1.0–2.6) | 0.04 | 0.5 (0.3–0.9) | 2.2 (1.2–4.1) | 0.02 | 0.8 (0.4–1.7) | 1.3 (0.6–2.7) | 0.5 |
| Smoking | 0.7 (0.5–1.1) | 1.4 (0.9–2.2) | 0.1 | 1.0 (0.5–1.9) | 1.0 (0.5–1.9) | 1.0 | 0.5 (0.2–1.0) | 1.0 (1.0–4.2) | 0.05 |
| Unadjusted | Model 1 | Model 2 | ||||
|---|---|---|---|---|---|---|
| x2 (p) | OR (95% CoI) | x2 (p) | OR (95% CoI) | x2 (p) | OR (95% CoI) | |
| MMSE ≤26 | 4.3 (0.03) | 2.0 (1.0–4.0) | 4.1 (0.04) | 2.0 (1.0–4.0) | 2.8 (0.09) | 1.8 (1.0–3.7) |
| Females | Males | |||||||||||
|---|---|---|---|---|---|---|---|---|---|---|---|---|
| Unadjusted | Model 1 | Model 2 | Unadjusted | Model 1 | Model 2 | |||||||
| x2 (p) | OR (95% CoI) | x2 (p) | OR (95% CoI) | x2 (p) | OR (95% CoI) | x2 (p) | OR (95% CoI) | x2 (p) | OR (95% CoI) | x2 (p) | OR (95% CoI) | |
| MMSE ≤26 | 0.6 (0.4) | 1.4 (0.6–3.6) | 0.2 (0.7) | 1.2 (0.5–3.1) | 0.1 (0.7) | 1.2 (0.5–3.1) | 5.0 (0.02) | 3.0 (1.0–8.8) | 5.1 (0.02) | 3.0 (1.0–8.9) | 3.4 (0.06) | 2.7 (0.9–8.2) |
| Model 1 | Model 2 | Model 3 | ||||
|---|---|---|---|---|---|---|
| x2 (p) | OR (95% CoI) | x2 (p) | OR (95% CoI) | x2 (p) | OR (95% CoI) | |
| MMSE ≤26 | 4.3 (0.04) | 2.0 (1.0–4.0) | 4.5 (0.03) | 2.0 (1.0–4.1) | 4.5 (0.03) | 2.0 (1.0–4.1) |
| Females | Males | |||||||||||
|---|---|---|---|---|---|---|---|---|---|---|---|---|
| Model 1 | Model 2 | Model 3 | Model 1 | Model 2 | Model 3 | |||||||
| x2 (p) | OR (95% CoI) | x2 (p) | OR (95% CoI) | x2 (p) | OR (95% CoI) | x2 (p) | OR (95% CoI) | x2 (p) | OR (95% CoI) | x2 (p) | OR (95% CoI) | |
| MMSE ≤26 | 0.5 (0.5) | 1.4 (0.6–3.5) | 0.5 (0.5) | 1.4 (0.5–3.5) | 0.6 (0.4) | 1.4 (0.6–3.6) | 5.0 (0.02) | 3.0 (1.0–9.0) | 7.4 (0.007) | 3.9 (1.3–12.0) | 5.6 (0.02) | 3.2 (1.1–9.6) |
Publisher’s Note: MDPI stays neutral with regard to jurisdictional claims in published maps and institutional affiliations. |
© 2021 by the authors. Licensee MDPI, Basel, Switzerland. This article is an open access article distributed under the terms and conditions of the Creative Commons Attribution (CC BY) license (http://creativecommons.org/licenses/by/4.0/).
Share and Cite
Ferraris, C.; Turner, A.; Scarlett, C.; Veysey, M.; Lucock, M.; Bucher, T.; Beckett, E.L. Association between Sour Taste SNP KCNJ2-rs236514, Diet Quality and Mild Cognitive Impairment in an Elderly Cohort. Nutrients 2021, 13, 719. https://0-doi-org.brum.beds.ac.uk/10.3390/nu13030719
Ferraris C, Turner A, Scarlett C, Veysey M, Lucock M, Bucher T, Beckett EL. Association between Sour Taste SNP KCNJ2-rs236514, Diet Quality and Mild Cognitive Impairment in an Elderly Cohort. Nutrients. 2021; 13(3):719. https://0-doi-org.brum.beds.ac.uk/10.3390/nu13030719
Chicago/Turabian StyleFerraris, Celeste, Alexandria Turner, Christopher Scarlett, Martin Veysey, Mark Lucock, Tamara Bucher, and Emma L. Beckett. 2021. "Association between Sour Taste SNP KCNJ2-rs236514, Diet Quality and Mild Cognitive Impairment in an Elderly Cohort" Nutrients 13, no. 3: 719. https://0-doi-org.brum.beds.ac.uk/10.3390/nu13030719