
Oat Polar Lipids Improve Cardiometabolic-Related Markers after Breakfast and a Subsequent Standardized Lunch: A Randomized Crossover Study in Healthy Young Adults

 ,
,  , ,
, ,
Abstract
:1. Introduction
2. Materials and Methods
2.1. Study Subjects
2.2. Study Design and Procedure
2.3. Test Meals
2.4. Standardized Lunch
2.5. Physiological Test Parameters
2.6. Statistical Analysis
3. Results
3.1. Postprandial Glucose and Insulin Responses after Consuming the Test Meals at Breakfast and Following the Standardized Lunch
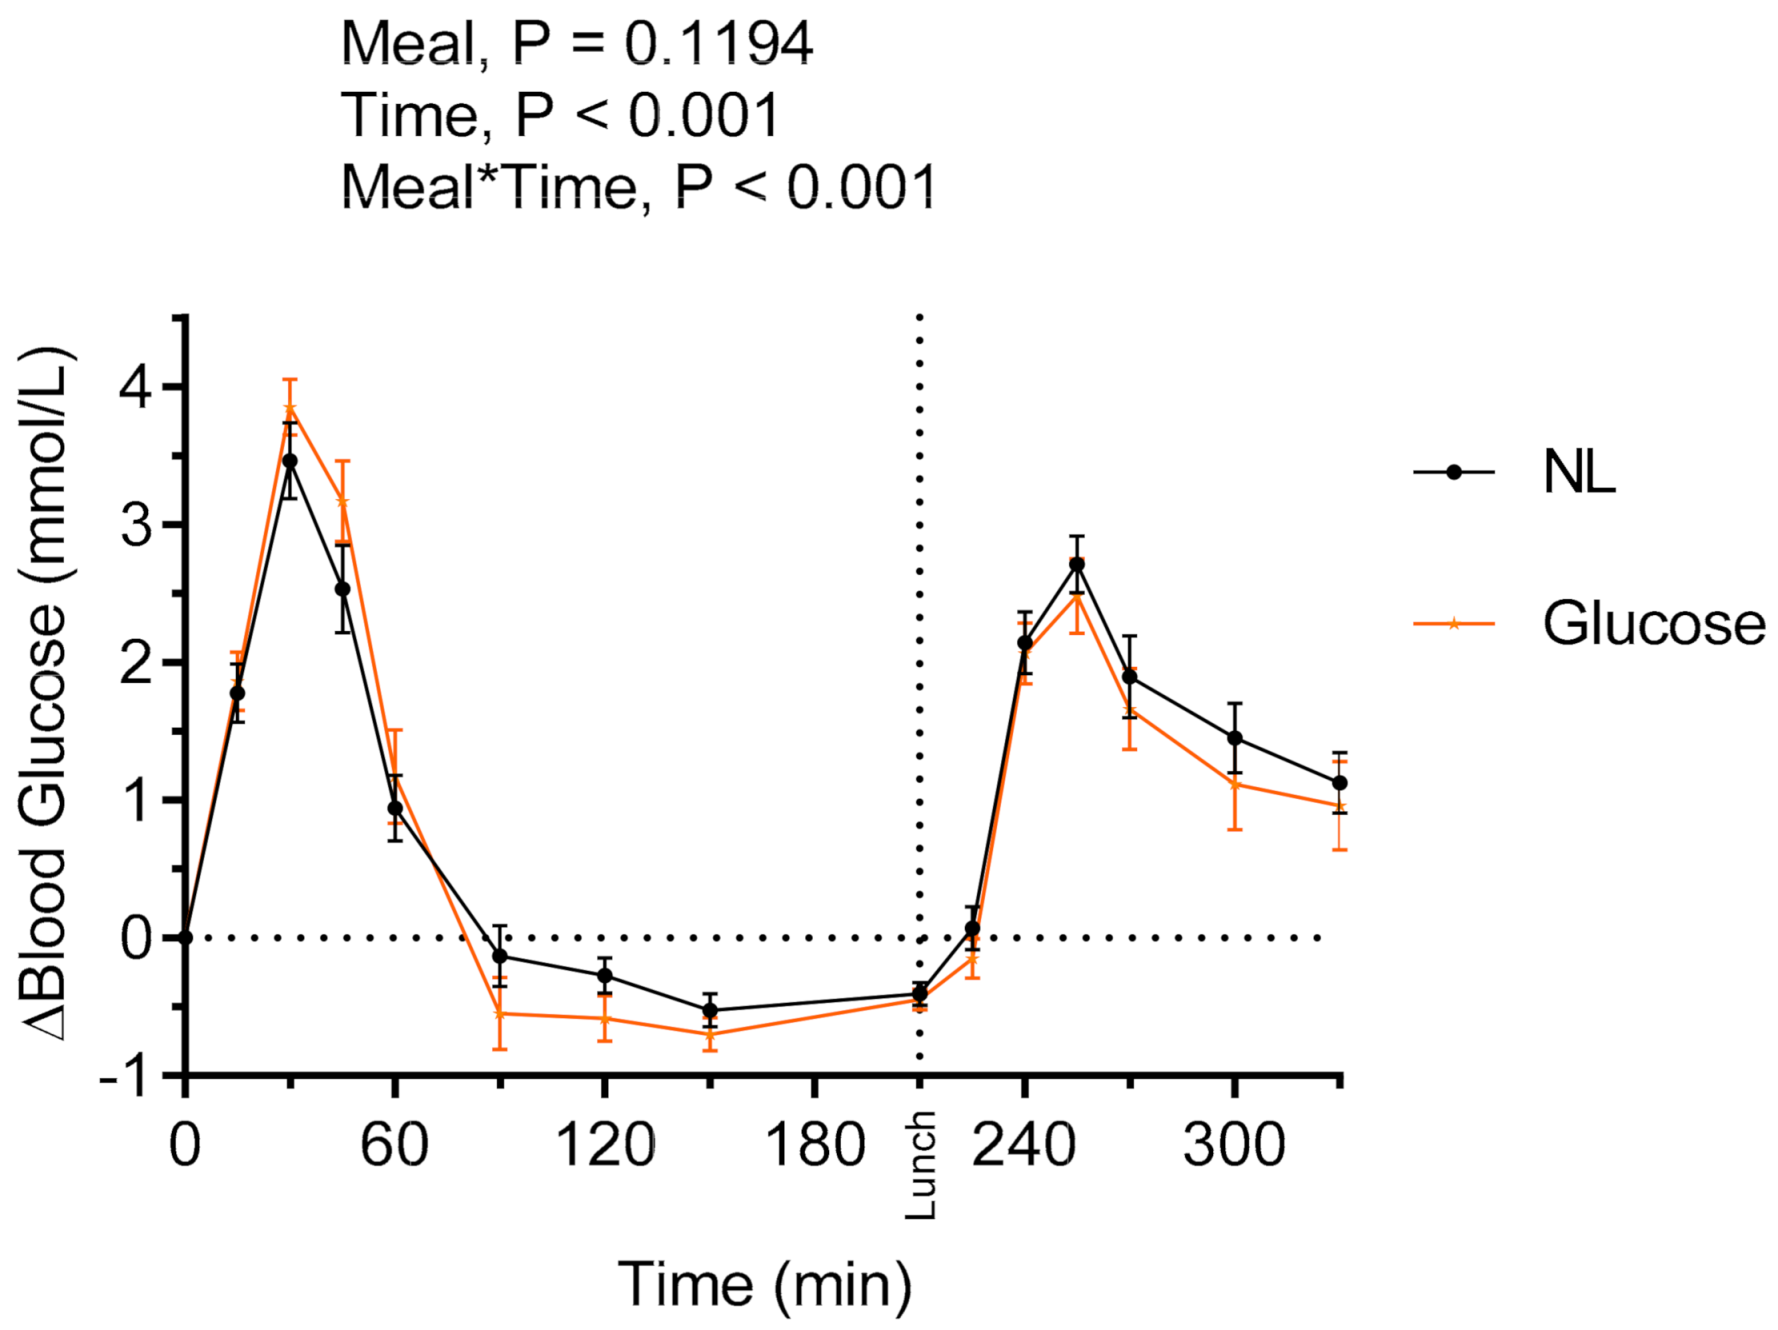
3.1.1. Evaluation of Acute Postprandial Glycemic Properties of the NL
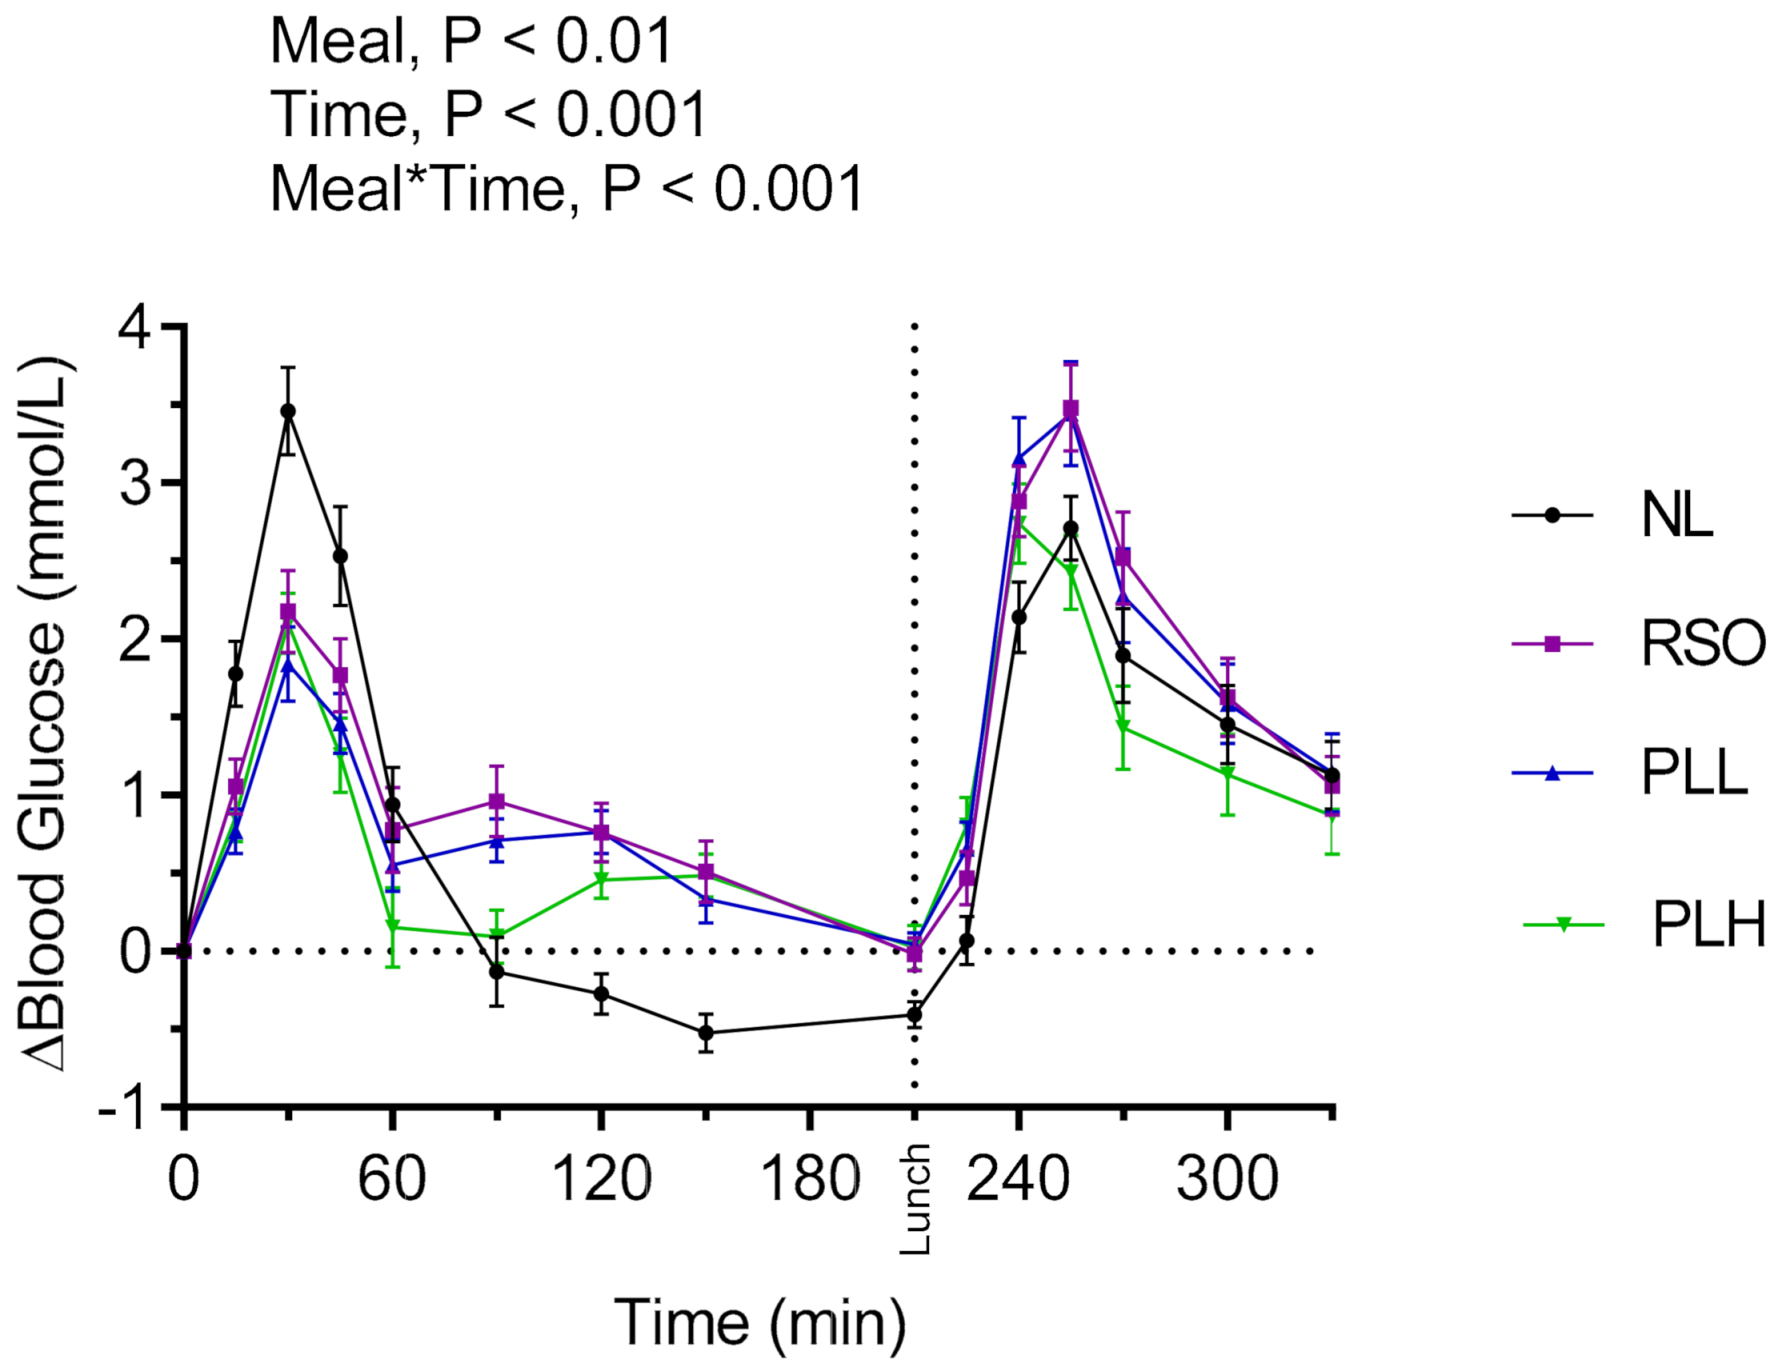
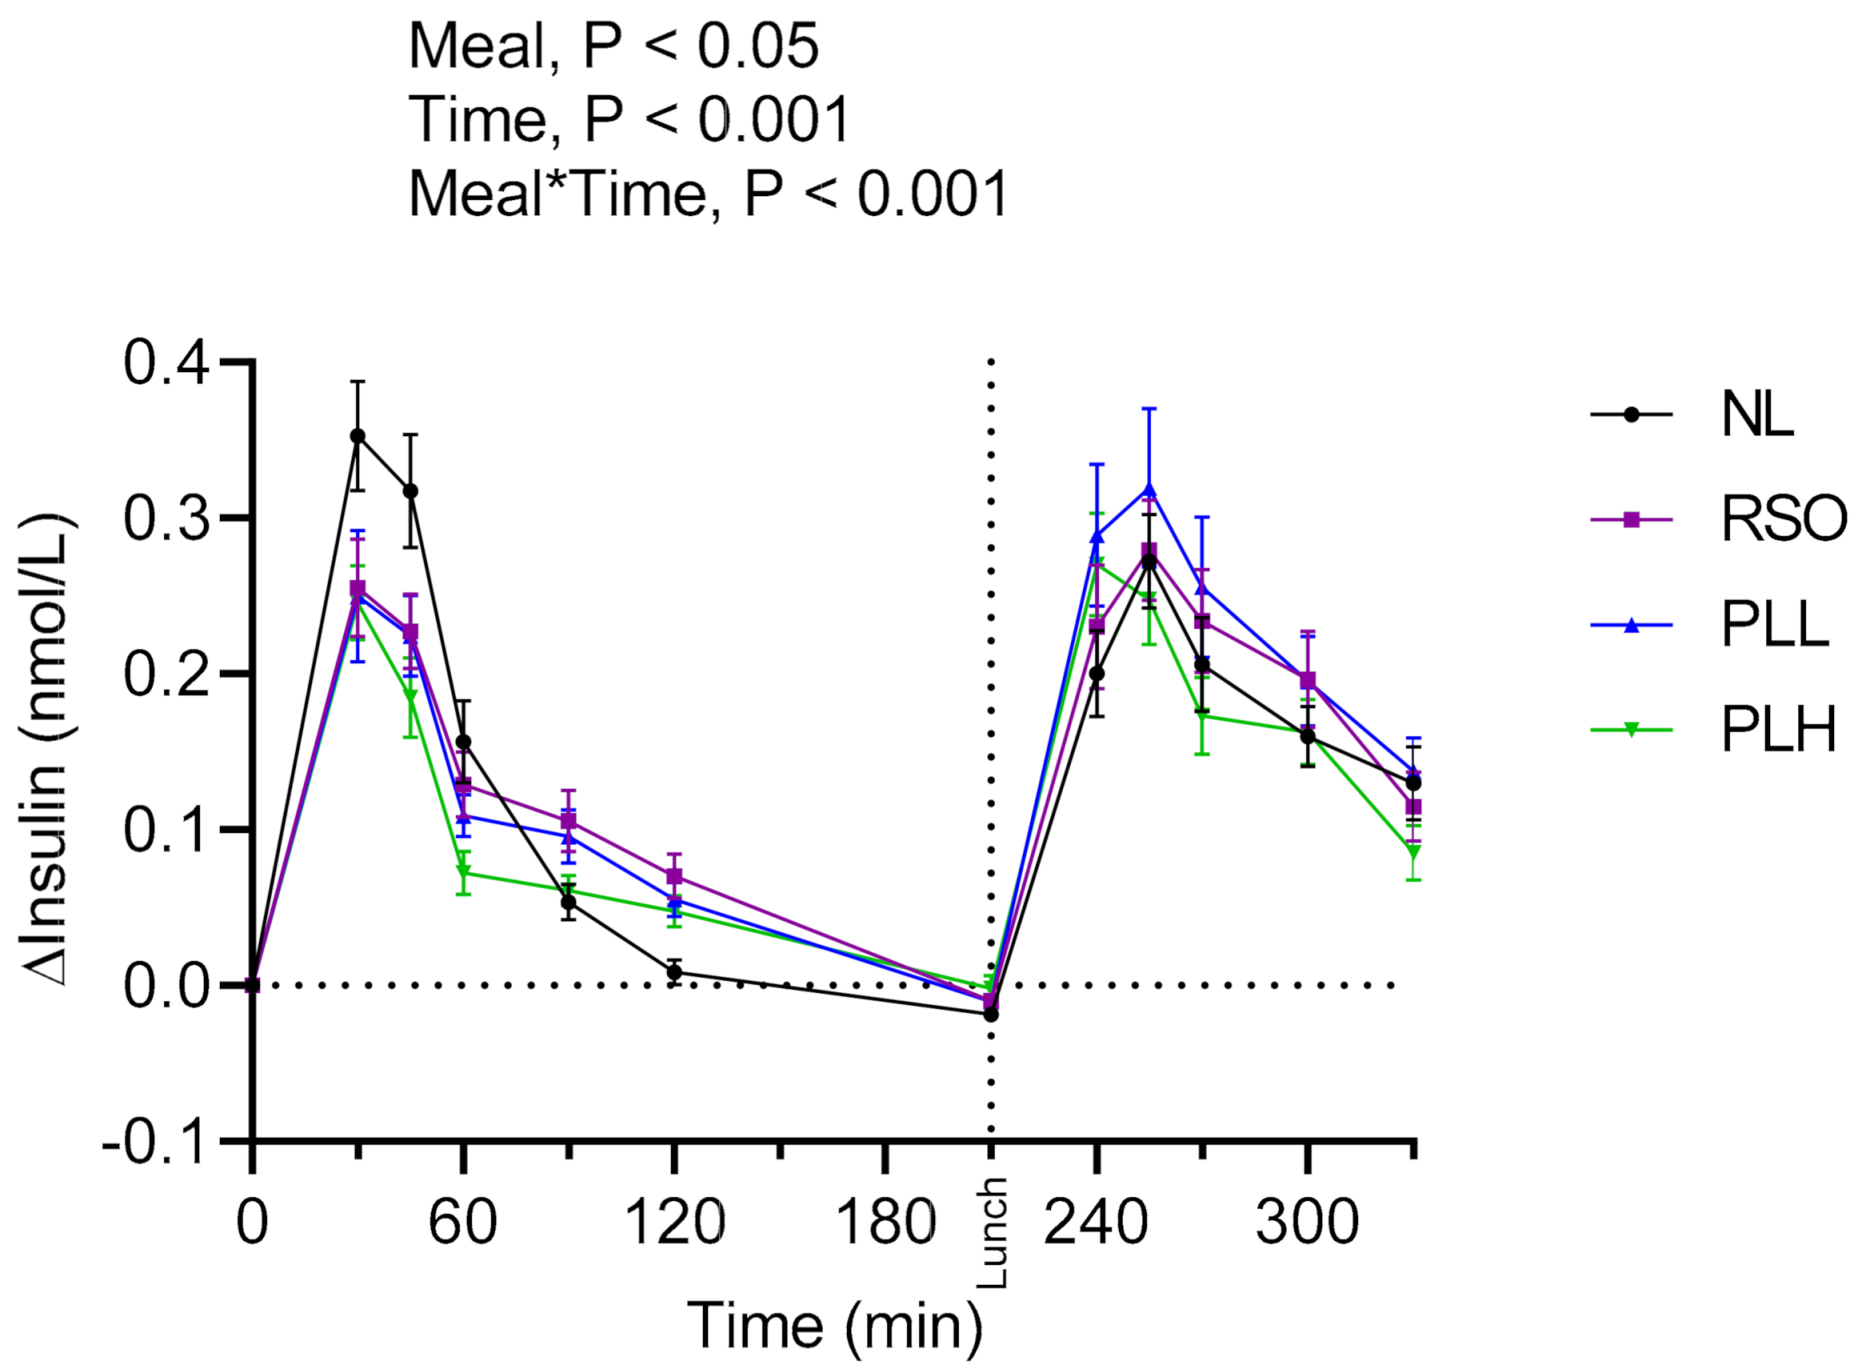
3.1.2. Evaluation of the Lipid-Supplemented Oat Preparations with Respect to Postprandial (Breakfast) and Second Meal (Lunch) Glucose and Insulin Responses
3.2. Triglycerides
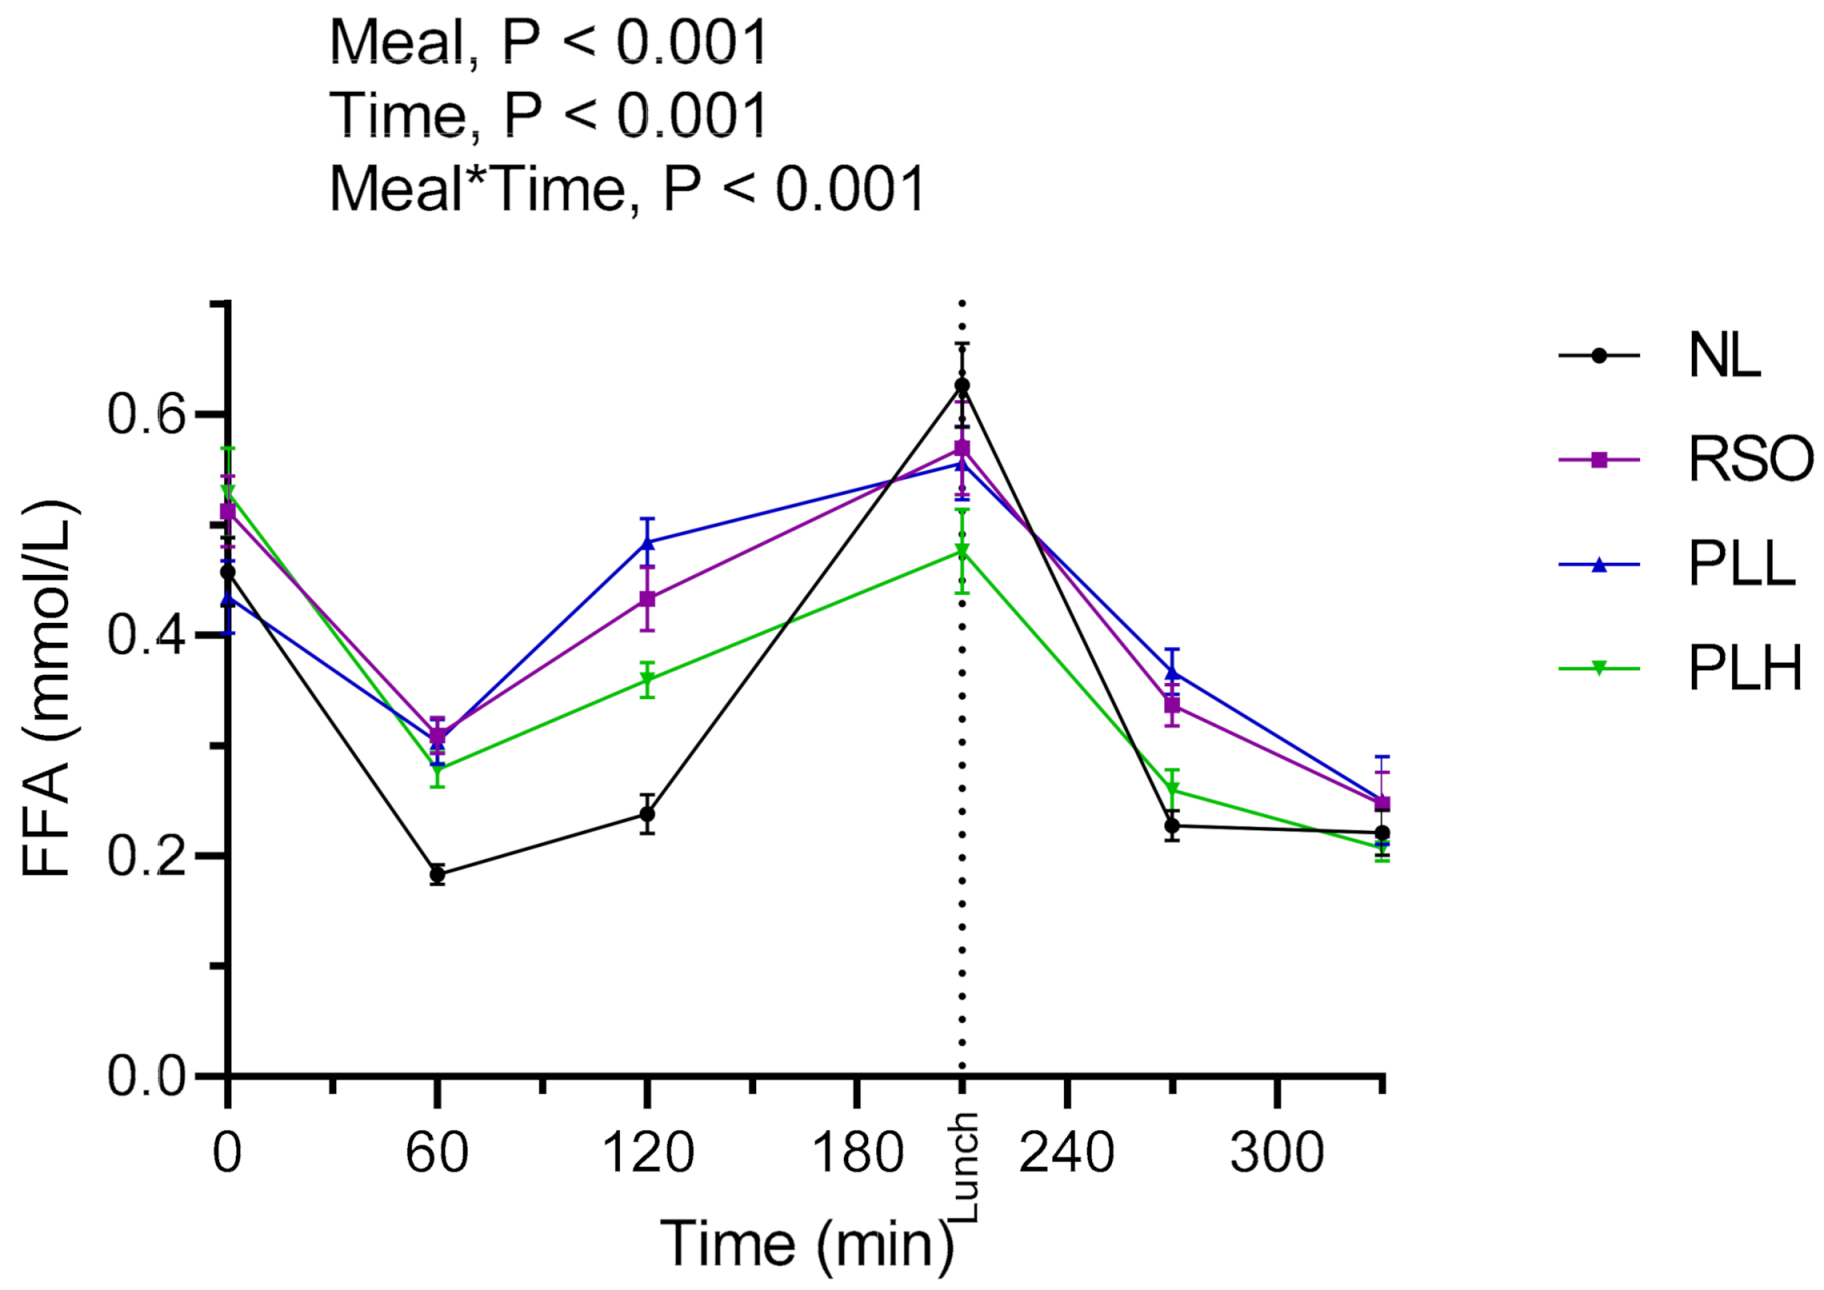
3.3. Free Fatty Acids
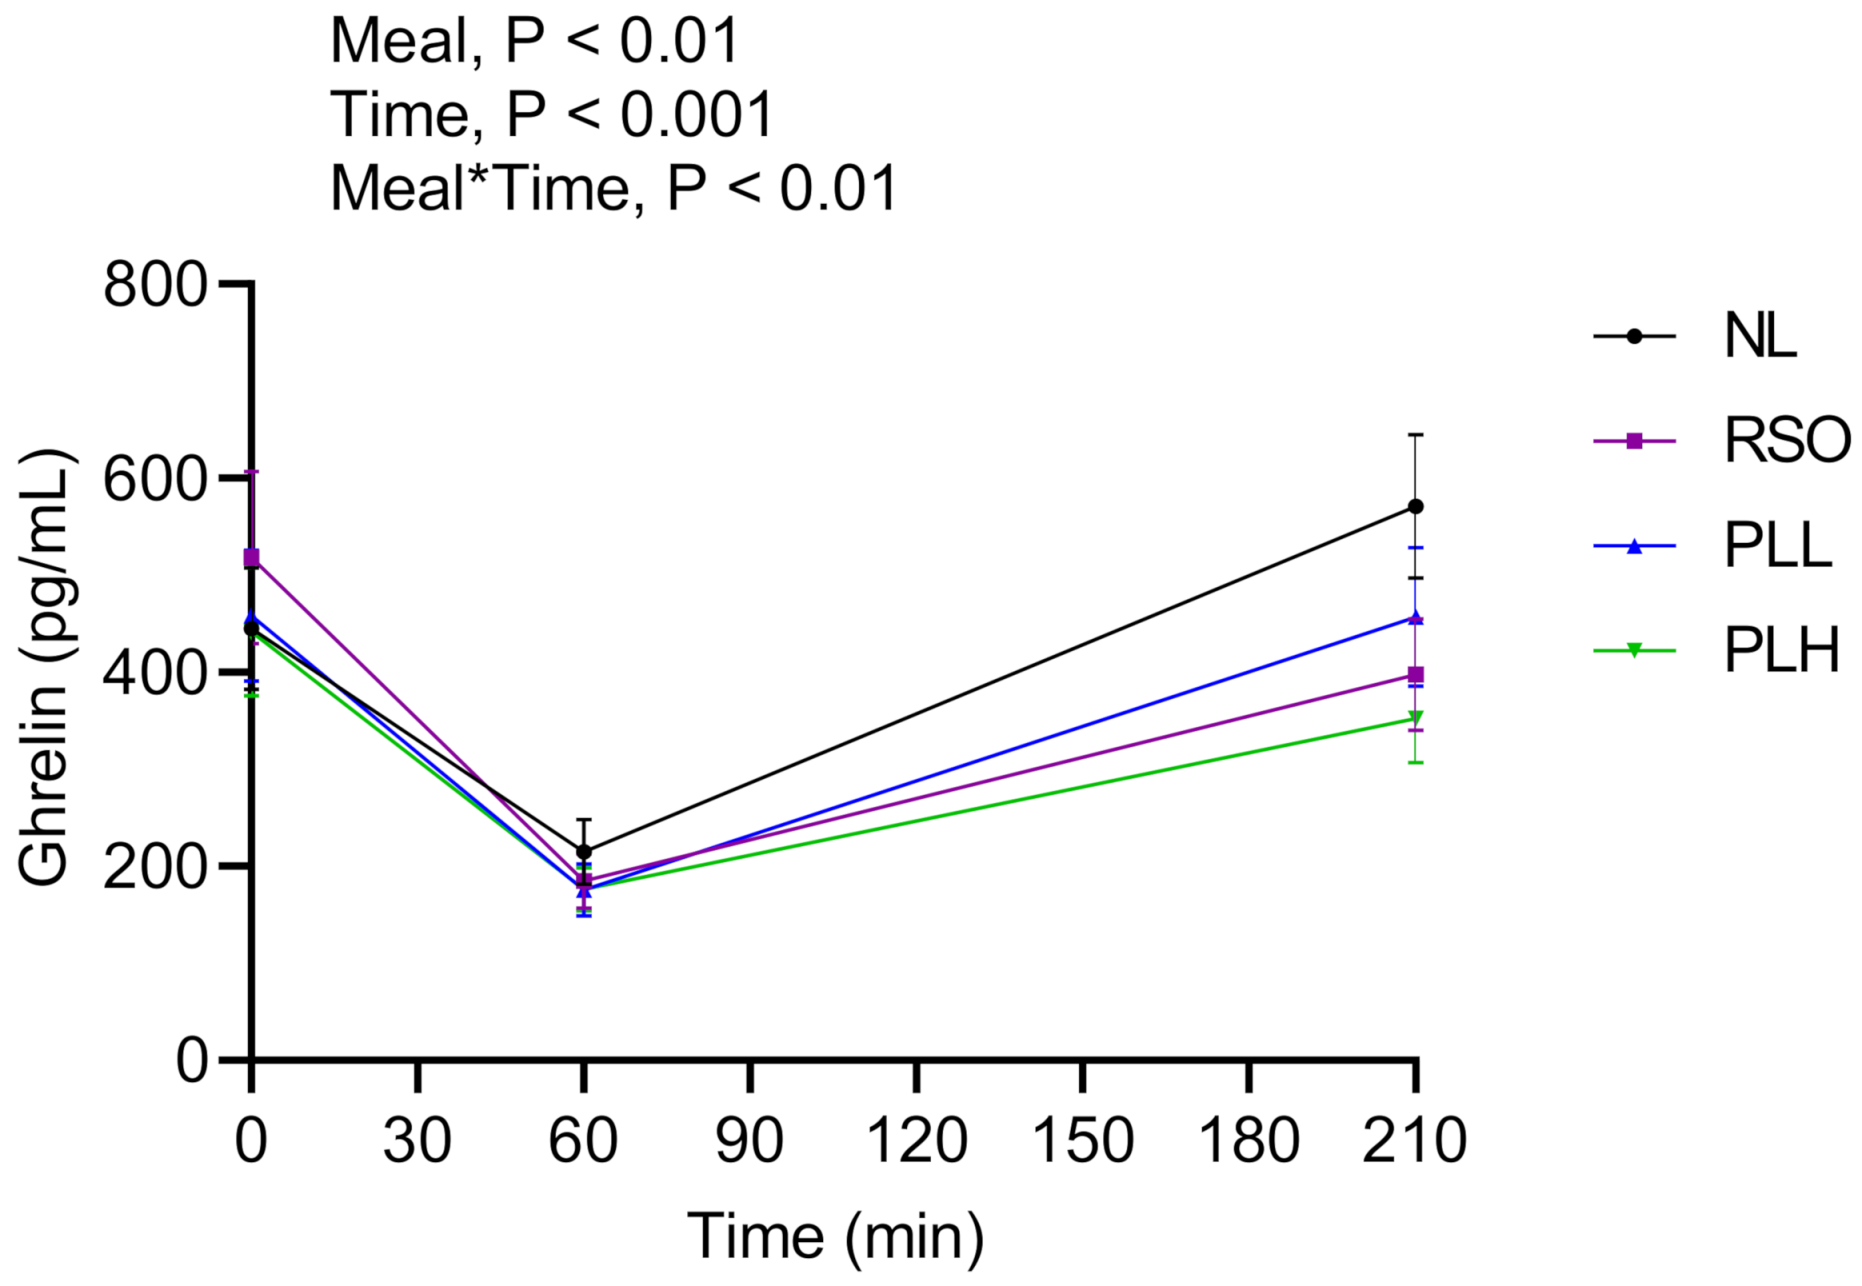
3.4. Ghrelin
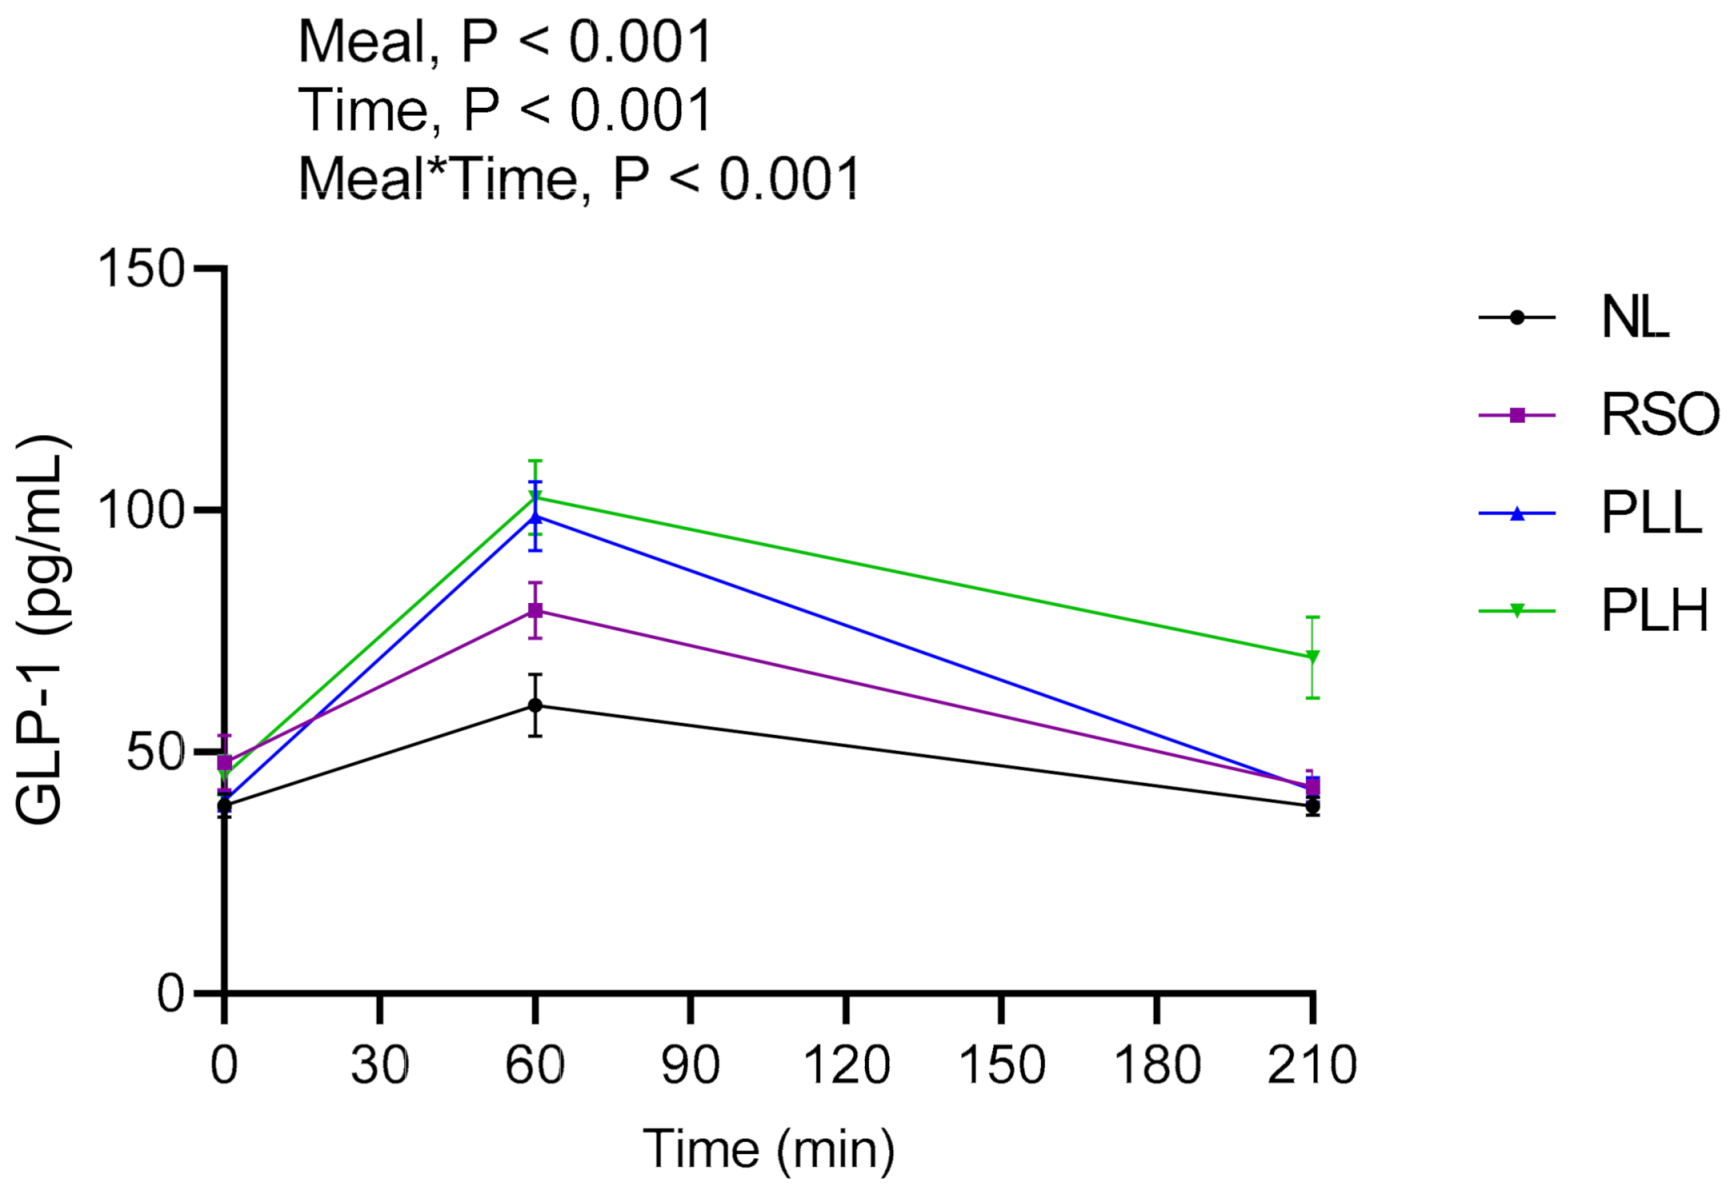
3.5. GLP-1
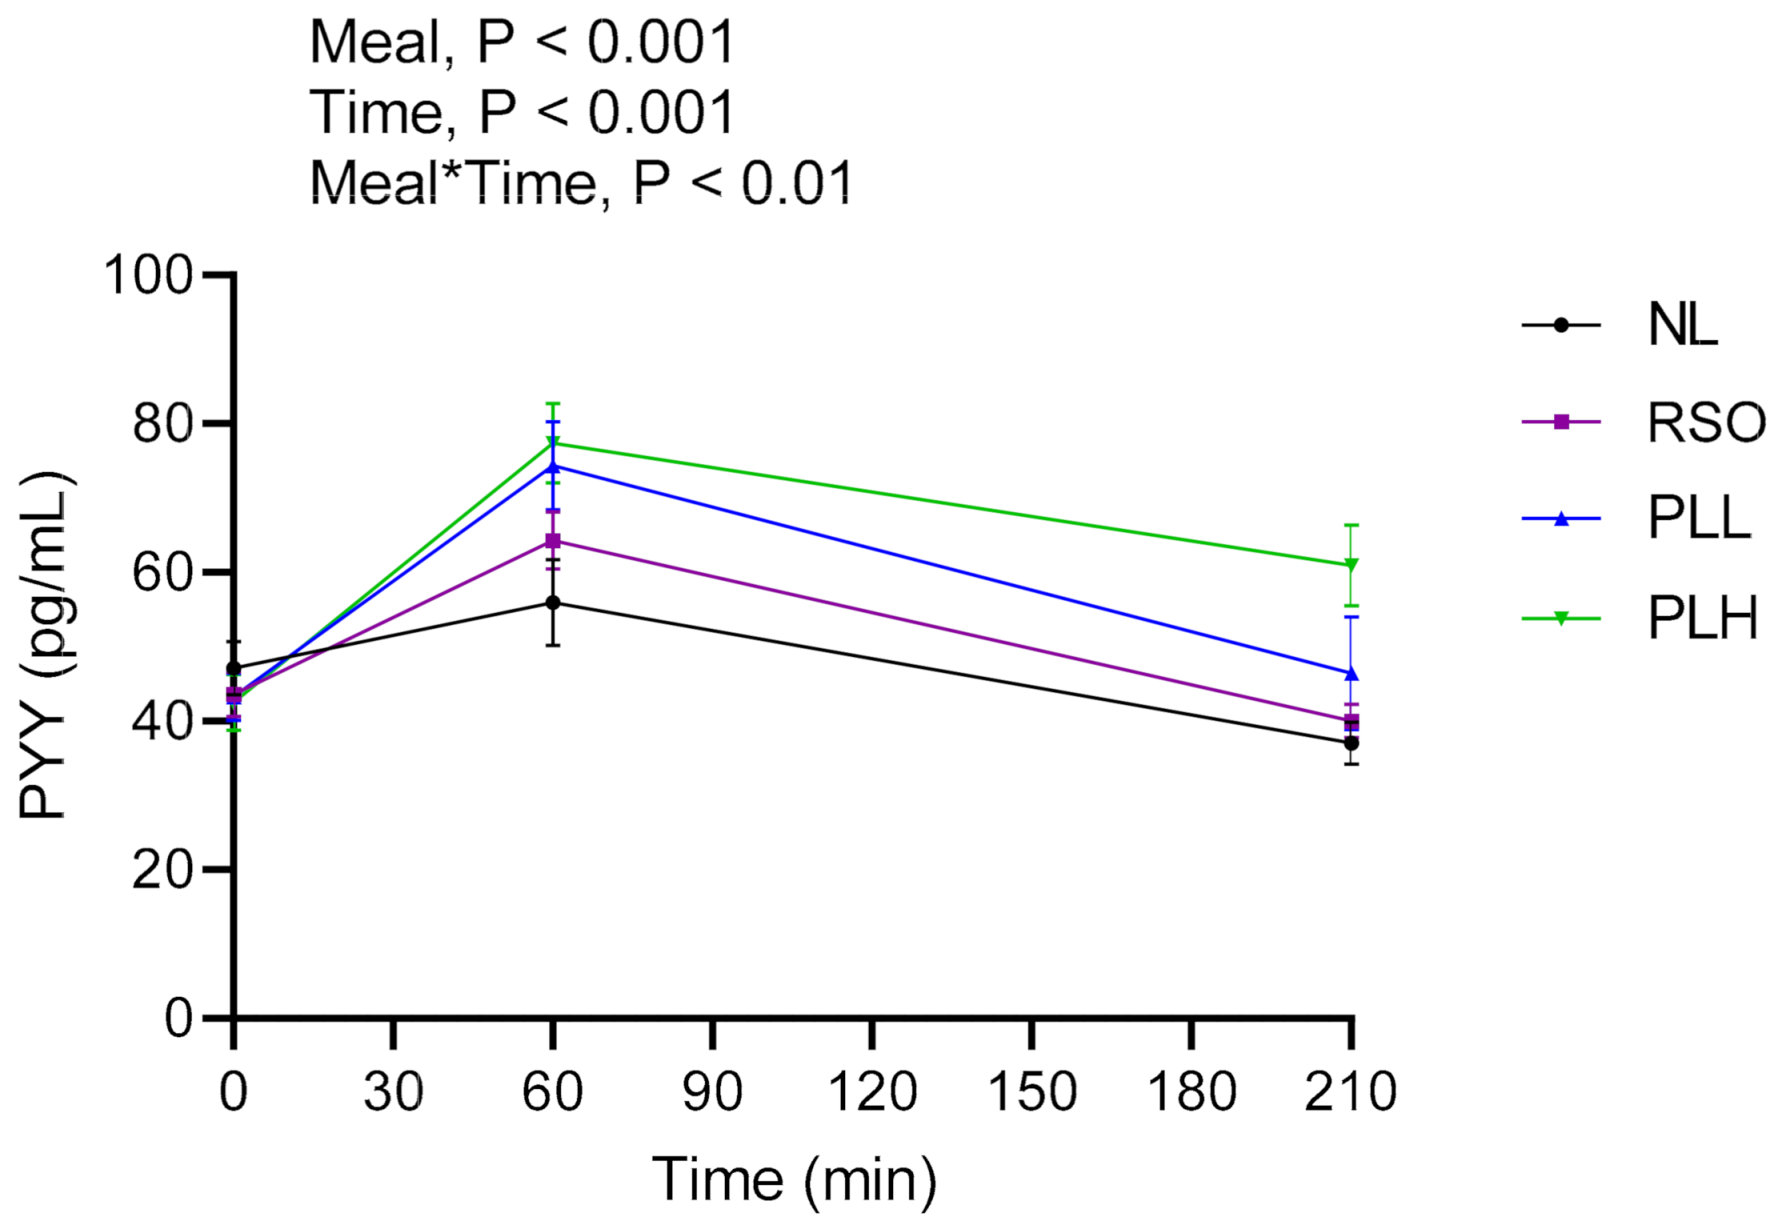
3.6. PYY
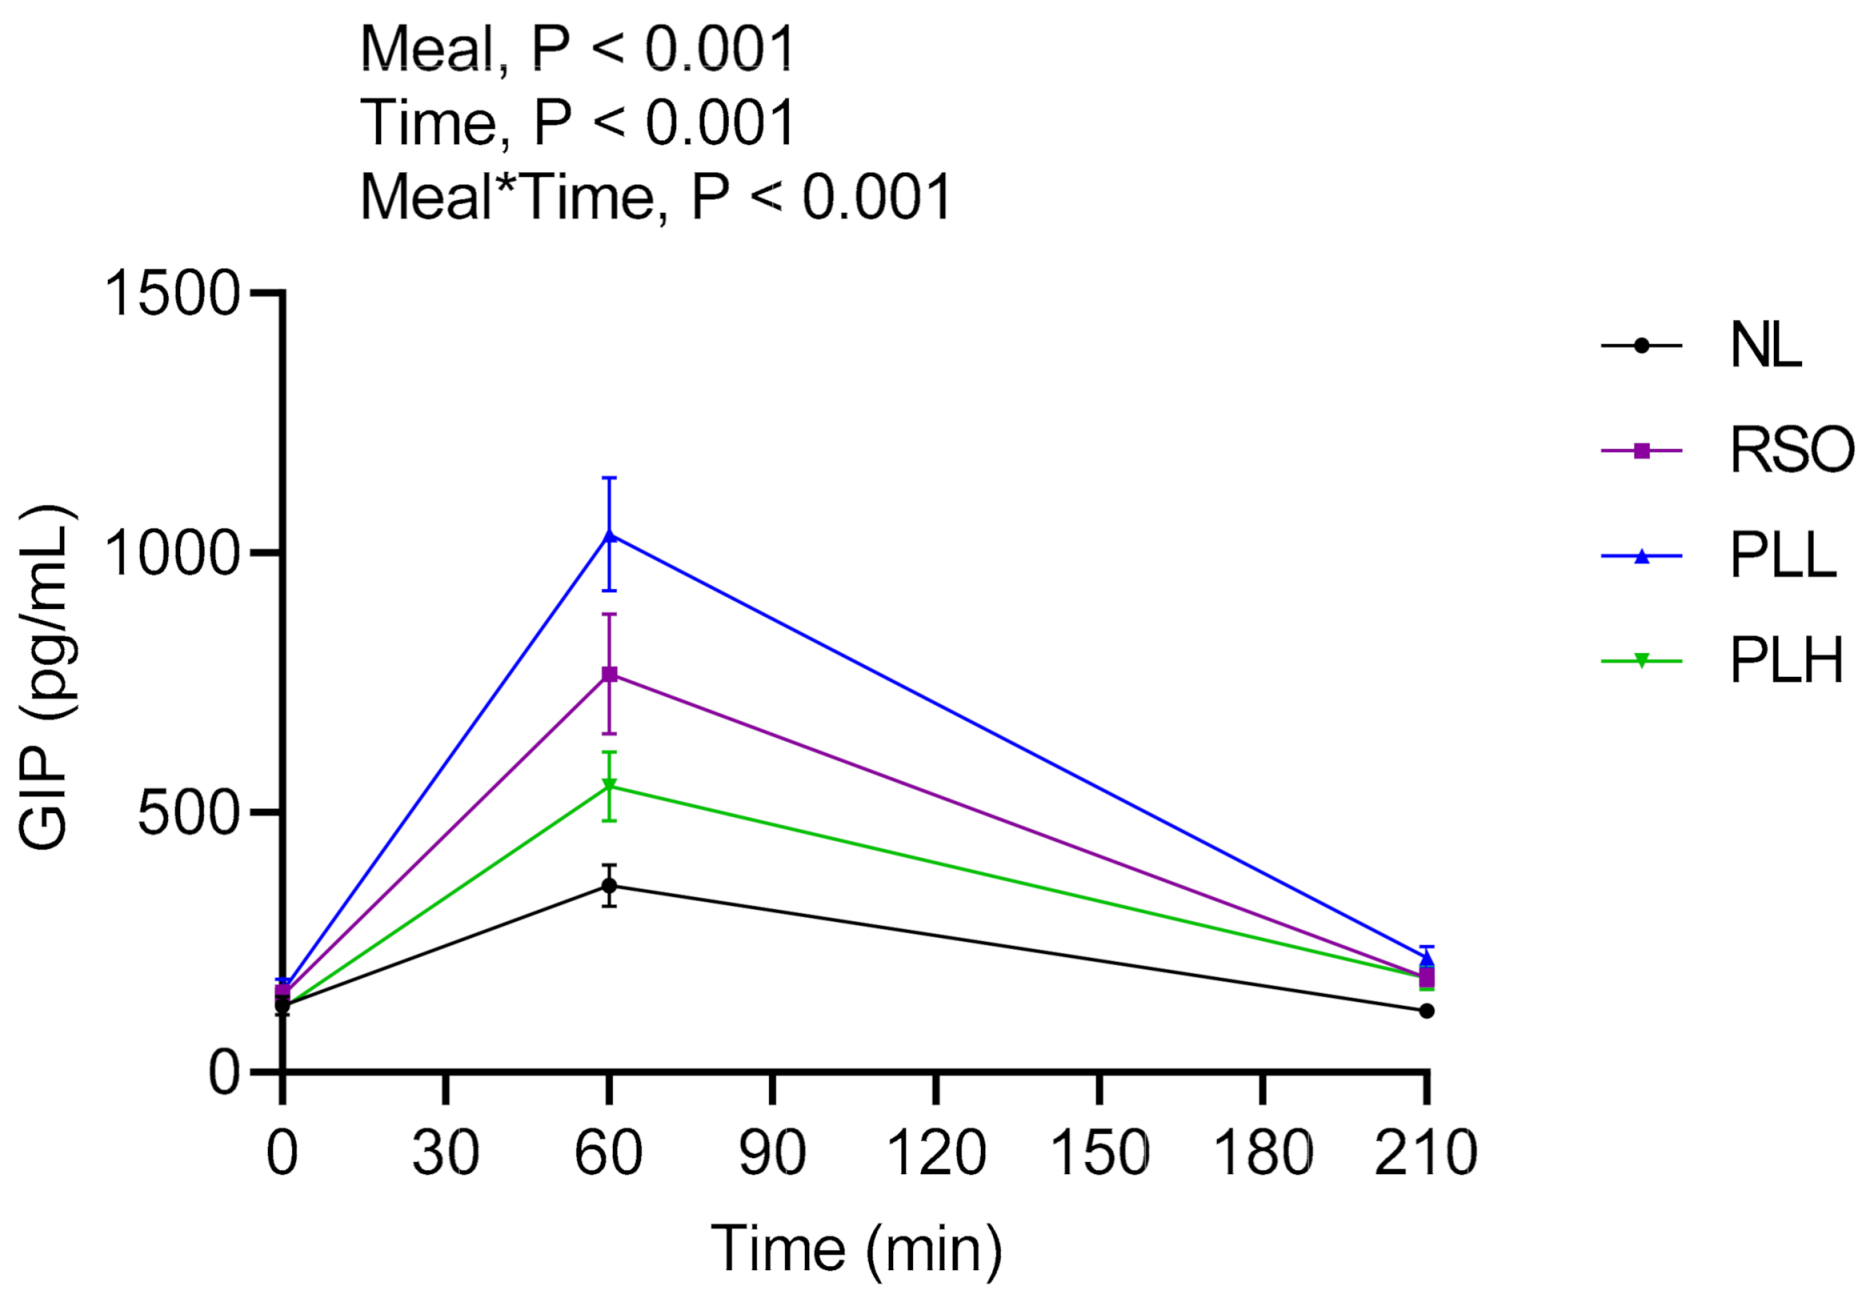
3.7. GIP
3.8. Subjective Appetite Ratings
4. Discussion
Supplementary Materials
Author Contributions
Funding
Institutional Review Board Statement
Informed Consent Statement
Data Availability Statement
Acknowledgments
Conflicts of Interest
References
- Saeedi, P.; Petersohn, I.; Salpea, P.; Malanda, B.; Karuranga, S.; Unwin, N.; Colagiuri, S.; Guariguata, L.; Motala, A.A.; Ogurtsova, K.; et al. Global and regional diabetes prevalence estimates for 2019 and projections for 2030 and 2045: Results from the International Diabetes Federation Diabetes Atlas, 9th edition. Diabetes Res. Clin. Pract. 2019, 157, 107843. [Google Scholar] [CrossRef] [Green Version]
- Jane, M.; McKay, J.; Pal, S. Effects of daily consumption of psyllium, oat bran and polyGlycopleX on obesity-related disease risk factors: A critical review. Nutrition 2019, 57, 84–91. [Google Scholar] [CrossRef]
- Maki, K.C.; Beiseigel, J.M.; Jonnalagadda, S.S.; Gugger, C.K.; Reeves, M.S.; Farmer, M.V.; Kaden, V.N.; Rains, T.M. Whole-grain ready-to-eat oat cereal, as part of a dietary program for weight loss, reduces low-density lipoprotein cholesterol in adults with overweight and obesity more than a dietary program including low-fiber control foods. J. Am. Diet. Assoc. 2010, 110, 205–214. [Google Scholar] [CrossRef] [PubMed]
- Lina, G.; Li-Tao, T.; Liya, L.; Kui, Z.; Ju, Q.; Sumei, Z. The cholesterol-lowering effects of oat varieties based on their difference in the composition of proteins and lipids. Lipids Health Dis. 2014, 13, 13–30. [Google Scholar] [CrossRef] [Green Version]
- Menon, R.; Gonzalez, T.; Ferruzzi, M.; Jackson, E.; Winderl, D.; Watson, J. Oats-From Farm to Fork. Adv. Food Nutr. Res. 2016, 77. [Google Scholar] [CrossRef]
- Meydani, M. Potential health benefits of avenanthramides of oats. Nutr. Rev. 2009, 67, 731–735. [Google Scholar] [CrossRef]
- Sang, S.; Chu, Y. Whole grain oats, more than just a fiber: Role of unique phytochemicals. Mol. Nutr. Food Res. 2017, 61. [Google Scholar] [CrossRef] [PubMed]
- Joyce, S.A.; Kamil, A.; Fleige, L.; Gahan, C.G.M. The Cholesterol-Lowering Effect of Oats and Oat Beta Glucan: Modes of Action and Potential Role of Bile Acids and the Microbiome. Front. Nutr. 2019, 6, 171. [Google Scholar] [CrossRef]
- Wu, J.R.; Leu, H.B.; Yin, W.H.; Tseng, W.K.; Wu, Y.W.; Lin, T.H.; Yeh, H.I.; Chang, K.C.; Wang, J.H.; Wu, C.C.; et al. The benefit of secondary prevention with oat fiber in reducing future cardiovascular event among CAD patients after coronary intervention. Sci. Rep. 2019, 9, 3091. [Google Scholar] [CrossRef]
- EFSA Panel on Dietetic Products Nutrition and Allergies. Scientific Opinion on the substantiation of a health claim related to oat beta glucan and lowering blood cholesterol and reduced risk of (coronary) heart disease pursuant to Article 14 of Regulation (EC) No 1924/2006. EFSA J. 2010, 8, 1885. [Google Scholar] [CrossRef]
- EFSA Panel on Dietetic Products Nutrition and Allergies. Scientific Opinion on the substantiation of health claims related to beta-glucans from oats and barley and maintenance of normal blood LDL-cholesterol concentrations (ID 1236, 1299), increase in satiety leading to a reduction in energy intake (ID 851, 852), reduction of post-prandial glycaemic responses (ID 821, 824), and “digestive function” (ID 850) pursuant to Article 13(1) of Regulation (EC) No 1924/2006. EFSA J. 2011, 9, 2207. [Google Scholar] [CrossRef] [Green Version]
- Doehlert, D.C.; Moreau, R.A.; Welti, R.; Roth, M.R.; McMullen, M.S. Polar Lipids from Oat Kernels. Cereal Chem. 2010, 87, 467–474. [Google Scholar] [CrossRef] [Green Version]
- Hamberg, M.; Liepinsh, E.; Otting, G.; Griffiths, W. Isolation and structure of a new galactolipid from oat seeds. Lipids 1998, 33, 355–363. [Google Scholar] [CrossRef] [PubMed]
- Leonova, S. Department of Plant Breeding, Swedish University of Agricultural Sciences: Alnarp, Sweden, 2013.Lantbruksuniversitet stitutionen för, v. In Lipids in Seeds of Oat (Avena spp.), a Potential Oil Crop: Content, Quality, Metabolism, and Possibilities for Improvement; Department of Plant Breeding, Swedish University of Agricultural Sciences: Alnarp, Sweden, 2013. [Google Scholar]
- Moreau, R.A.; Doehlert, D.C.; Welti, R.; Isaac, G.; Roth, M.; Tamura, P.; Nuñez, A. The identification of mono-, di-, tri-, and tetragalactosyl-diacylglycerols and their natural estolides in oat kernels. Lipids 2008, 43, 533–548. [Google Scholar] [CrossRef] [Green Version]
- Wren, A.M.; Bloom, S.R. Gut hormones and appetite control. Gastroenterology 2007, 132, 2116–2130. [Google Scholar] [CrossRef] [PubMed]
- Blaychfeld-Magnazi, M.; Reshef, N.; Zornitzki, T.; Madar, Z.; Knobler, H. The effect of a low-carbohydrate high-fat diet and ethnicity on daily glucose profile in type 2 diabetes determined by continuous glucose monitoring. Eur. J. Nutr. 2020, 59, 1929–1936. [Google Scholar] [CrossRef]
- Yuan, Q.; Ramprasath, V.R.; Harding, S.V.; Rideout, T.C.; Chan, Y.M.; Jones, P.J. Diacylglycerol oil reduces body fat but does not alter energy or lipid metabolism in overweight, hypertriglyceridemic women. J. Nutr. 2010, 140, 1122–1126. [Google Scholar] [CrossRef] [Green Version]
- Ohlsson, L.; Rosenquist, A.; Rehfeld, J.F.; Härröd, M. Postprandial effects on plasma lipids and satiety hormones from intake of liposomes made from fractionated oat oil: Two randomized crossover studies. Food Nutr. Res. 2014, 58. [Google Scholar] [CrossRef] [Green Version]
- Sosulski, F.; Zadernowski, R.; Babuchowski, K. Composition of polar lipids in rapeseed. J. Am. Oil Chem. Soc. 1981, 58, 561–564. [Google Scholar] [CrossRef]
- Lordan, R.; Nasopoulou, C.; Tsoupras, A.; Zabetakis, I. The Anti-inflammatory Properties of Food Polar Lipids. In Bioactive Molecules in Food; Mérillon, J.-M., Ramawat, K.G., Eds.; Springer International Publishing: Cham, The Netherlands, 2018; pp. 1–34. [Google Scholar] [CrossRef]
- Carré, P.; Pouzet, A. Rapeseed market, worldwide and in Europe. OCL 2014, 21, D102. [Google Scholar] [CrossRef]
- Christensen, L.P. Galactolipids as potential health promoting compounds in vegetable foods. Recent Pat. Food Nutr. Agric. 2009, 1, 50–58. [Google Scholar] [CrossRef] [PubMed] [Green Version]
- Cohn, J.S.; Kamili, A.; Wat, E.; Chung, R.W.S.; Tandy, S. Dietary Phospholipids and Intestinal Cholesterol Absorption. Nutrients 2010, 2, 116–127. [Google Scholar] [CrossRef] [PubMed] [Green Version]
- Hou, C.-C.; Chen, Y.-P.; Wu, J.-H.; Huang, C.-C.; Wang, S.-Y.; Yang, N.-S.; Shyur, L.-F. A galactolipid possesses novel cancer chemopreventive effects by suppressing inflammatory mediators and mouse B16 melanoma. Cancer Res. 2007, 67, 6907–6915. [Google Scholar] [CrossRef] [Green Version]
- Sugawara, T.; Miyazawa, T. Beneficial effect of dietary wheat glycolipids on cecum short-chain fatty acid and secondary bile acid profiles in mice. J. Nutr. Sci. Vitaminol. 2001, 47, 299–305. [Google Scholar] [CrossRef] [PubMed]
- Ulivi, V.; Lenti, M.; Gentili, C.; Marcolongo, G.; Cancedda, R.; Cancedda, F.D. Anti-inflammatory activity of monogalactosyldiacylglycerol in human articular cartilage in vitro: Activation of an anti-inflammatory cyclooxygenase-2 (COX-2) pathway. Arthritis Res. Ther. 2011, 13, R92. [Google Scholar] [CrossRef] [Green Version]
- Weiland, A.; Bub, A.; Barth, S.W.; Schrezenmeir, J.; Pfeuffer, M. Effects of dietary milk- and soya-phospholipids on lipid-parameters and other risk indicators for cardiovascular diseases in overweight or obese men—Two double-blind, randomised, controlled, clinical trials. J. Nutr. Sci. 2016, 5, e21. [Google Scholar] [CrossRef] [PubMed] [Green Version]
- Zheng, L.; Fleith, M.; Giuffrida, F.; O’Neill, B.V.; Schneider, N. Dietary Polar Lipids and Cognitive Development: A Narrative Review. Adv. Nutr. 2019, 10, 1163–1176. [Google Scholar] [CrossRef] [PubMed]
- Livesey, G.; Taylor, R.; Livesey, H.F.; Buyken, A.E.; Jenkins, D.J.A.; Augustin, L.S.A.; Sievenpiper, J.L.; Barclay, A.W.; Liu, S.; Wolever, T.M.S.; et al. Dietary Glycemic Index and Load and the Risk of Type 2 Diabetes: A Systematic Review and Updated Meta-Analyses of Prospective Cohort Studies. Nutrients 2019, 11, 1280. [Google Scholar] [CrossRef] [PubMed] [Green Version]
- Hedayatnia, M.; Asadi, Z.; Zare-Feyzabadi, R.; Yaghooti-Khorasani, M.; Ghazizadeh, H.; Ghaffarian-Zirak, R.; Nosrati-Tirkani, A.; Mohammadi-Bajgiran, M.; Rohban, M.; Sadabadi, F.; et al. Dyslipidemia and cardiovascular disease risk among the MASHAD study population. Lipids Health Dis. 2020, 19, 42. [Google Scholar] [CrossRef] [Green Version]
- Miller, M.; Stone Neil, J.; Ballantyne, C.; Bittner, V.; Michael, H.C.; Henry, N.G.; Anne, C.G.; William, J.H.; Marc, S.J.; Penny, M.K.-E.; et al. Triglycerides and Cardiovascular Disease. Circulation 2011, 123, 2292–2333. [Google Scholar] [CrossRef] [Green Version]
- Wattanakul, J.; Sahaka, M.; Amara, S.; Mansor, S.; Gontero, B.; Carrière, F.; Gray, D. In vitro digestion of galactolipids from chloroplast-rich fraction (CRF) of postharvest, pea vine field residue (haulm) and spinach leaves. Food Funct. 2019, 10, 7806–7817. [Google Scholar] [CrossRef] [PubMed]
- Yilmaz, J.L.; Adlercreutz, P.; Tullberg, C. Polar Lipids Reduce in vitro Duodenal Lipolysis Rate of Oat Oil and Liquid Oat Base Products. Eur. J. Lipid Sci. Technol. 2021, 123, 2000317. [Google Scholar] [CrossRef]
- Seino, Y.; Fukushima, M.; Yabe, D. GIP and GLP-1, the two incretin hormones: Similarities and differences. J. Diabetes Investig. 2010, 1, 8–23. [Google Scholar] [CrossRef] [Green Version]
- Belfort, R.; Mandarino, L.; Kashyap, S.; Wirfel, K.; Pratipanawatr, T.; Berria, R.; Defronzo, R.A.; Cusi, K. Dose-response effect of elevated plasma free fatty acid on insulin signaling. Diabetes 2005, 54, 1640–1648. [Google Scholar] [CrossRef] [Green Version]
- Nilsson, A.C.; Ostman, E.M.; Holst, J.J.; Björck, I.M.E. Including Indigestible Carbohydrates in the Evening Meal of Healthy Subjects Improves Glucose Tolerance, Lowers Inflammatory Markers, and Increases Satiety after a Subsequent Standardized Breakfast. J. Nutr. 2008, 138, 732–739. [Google Scholar] [CrossRef] [PubMed] [Green Version]
- Yanai, H.; Yoshida, H.; Tomono, Y.; Hirowatari, Y.; Kurosawa, H.; Matsumoto, A.; Tada, N. Effects of diacylglycerol on glucose, lipid metabolism, and plasma serotonin levels in lean Japanese. Obesity 2008, 16, 47–51. [Google Scholar] [CrossRef]
- Megson, I.L.; Whitfield, P.D.; Zabetakis, I. Lipids and cardiovascular disease: Where does dietary intervention sit alongside statin therapy? Food Funct. 2016, 7, 2603–2614. [Google Scholar] [CrossRef] [PubMed]
- Roche, H.M.; Gibney, M.J. Postprandial triacylglycerolaemia—Nutritional implications. Prog. Lipid Res. 1995, 34, 249–266. [Google Scholar] [CrossRef]


| PLL | PLH | RSO | NL | Glucose | |
|---|---|---|---|---|---|
| Available Carbohydrates (g) | 42 | 42 | 42 | 42 | 42 |
| Free glucose (g) | 1.75 | 1.75 | 1.75 | 1.75 | 42 |
| Fat (g) | 33 | 33 | 33 | 3 | 0 |
| Polar lipids (g) 2 | 1 | 12 | 1 | <0.5 | 0 |
| Protein (g) | 6.5 | 6.5 | 6.5 | 6.5 | 0 |
| Dietary fiber (g) | 5 | 5 | 5 | 5 | 0 |
| beta-glucans (g) | 2.5 | 2.5 | 2.5 | 2.5 | 0 |
| Energy (Kcal) | 491 | 491 | 491 | 221 | 168 |
| Meatballs | Bread | |
|---|---|---|
| Carbohydrate (g) | 8 | 47.0 |
| Fat (g) | 15 | 3.5 |
| Protein (g) | 13 | 8.5 |
| Test Variables | NL | RSO | PLL | PLH | |||
|---|---|---|---|---|---|---|---|
| %∆ 2 | %∆ 2 | %∆ 2 | |||||
| Glucose | |||||||
| Fasting blood glucose (mmol/L) | 4.91 ± 0.11 a | 4.85 ± 0.10 a | −1.22 | 4.96 ± 0.09 a | 1.01 | 4.99 ± 0.09 a | 1.62 |
| Blood glucose prior to std. lunch (at 210 min) (mmol/L) | 4.4 ± 0.11 a | 4.8 ± 0.12 a | 8.07 | 4.9 ± 0.08 a | 11.65 | 5.0 ± 0.12 a | 12.78 |
| Blood glucose iAUC = 0–120 min (mmol*min/L) | 149 ± 16.3 a | 136 ± 16.4 ab | −8.45 | 106 ± 11 bc | −28.30 | 85 ± 12.9 c | −42.58 |
| Blood glucose iAUC = 210–330 min (mmol*min/L) | 231.8 ± 19.1 a | 232.1 ± 23.3 a | 0.12 | 223.3 ± 21.1 a | −3.66 | 166.4 ± 19.6 b | −28.21 |
| Blood glucose iAUC = 0–330 min (mmol*min/L) | 335.5 ± 34.6 ab | 413.5 ± 39.5 a | 23.24 | 371.3 ± 36.9 ab | 10.67 | 293.9 ± 42.9 b | −12.39 |
| Insulin | |||||||
| Fasting blood insulin (nmol/L) | 0.041 ± 0.004 a | 0.039 ± 0.004 a | −4.87 | 0.04 ± 0.003 a | −2.43 | 0.04 ± 0.003 a | −2.43 |
| Blood insulin prior to std. lunch (at 210 min) (nmol/L) | 0.023 ± 0.002 a | 0.030 ± 0.002 a | 30.43 | 0.03 ± 0.002 a | 30.43 | 0.041 ± 0.007 a | 78.26 |
| Insulin iAUC = 0–120 (nmol*min/L) | 18.1 ± 1.85 a | 16.3 ± 1.8 ab | −9.94 | 15.16 ± 1.73 bc | −16.24 | 12.51 ± 1.24 c | −30.88 |
| Insulin iAUC = 210–330 (nmol*min/L) | 19.74 ± 2.32 a | 22.16 ± 2.97 a | 12.66 | 24.83 ± 3.51 a | 25.78 | 19.86 ± 2.22 a | 0.60 |
| Insulin iAUC = 0–330 (nmol*min/L) | 38.44 ± 4.04 ab | 41.59 ± 4.72 ab | 8.19 | 42.39 ± 5.14 a | 10.27 | 34.95 ± 3.56 b | −9.07 |
| Test variables | NL | RSO | PLL | PLH | |||
|---|---|---|---|---|---|---|---|
| %∆ 2 | %∆ 2 | %∆ 2 | |||||
| Triglycerides (TG) | |||||||
| Fasting TG (mmol/L) | 0.70 ± 0.04 a | 0.66 ± 0.05 a | −5.71 | 0.71 ± 0.05 a | 1.428 | 0.66 ± 0.04 a | −5.714 |
| TG = AUC 0–210 min (mmol*min/L) | 157.2 ± 10.5 a | 203.2 ± 20.6 b | 29.26 | 221.8 ± 19.5 b | 41.09 | 187.4 ± 13.9 ab | 19.21 |
| TG at 330 min (mmol/L) | 0.89 ± 0.05 a | 0.70 ± 0.05 b | −20.64 | 0.77 ± 0.07 ab | −12.93 | 0.75 ± 0.05 ab | −15.38 |
| Free Fatty Acid | |||||||
| Fasting FFA (mmol/L) | 0.45 ± 0.03 a | 0.51 ± 0.03 a | 13.33 | 0.43 ± 0.03 a | −4.44 | 0.52 ± 0.04 a | 15.55 |
| FFA = AUC 0–210 min (mmol*min/L) | 70.7 ± 2.83 a | 91.94 ± 3.34 b | 30.04 | 92.51 ± 3.93 b | 30.84 | 80.92 ± 2.9 c | 14.45 |
| FFA = AUC 210–330 min (mmol*min/L) | 39.05 ± 1.86 ab | 44.65 ± 2.19 a | 14.34 | 46.15 ± 2.72 a | 18.18 | 36.04 ± 1.85 b | −7.70 |
| Test Variables | NL | RSO | PLL | PLH | |||
|---|---|---|---|---|---|---|---|
| %∆ 2 | %∆ 2 | %∆ 2 | |||||
| Fasting plasma Ghrelin (pg/mL) 3 | 444.8 ± 63.1 a | 518.4 ± 89 a | 16.54 | 458.4 ± 67.2 a | 3.05 | 441.6 ± 65.8 a | −0.719 |
| Ghrelin AUC = 0–210 (pg*min/mL) 3 | 78,698 ± 10,536 a | 64,764 ± 9599 b | −17.70 | 66,503 ± 9950 ab | −15.49 | 58,184 ± 7246 b | −26.06 |
| Plasma Ghrelin at 330 min (pg/mL) 3 | 255.8 ± 41 a | 251.7 ± 38 a | −1.60 | 226.5 ± 36 a | −11.45 | 232.4 ± 22 a | −9.14 |
| Fasting plasma GLP-1 (pg/mL) 3 | 38.95 ± 2.37 a | 47.86 ± 5.63 a | 22.87 | 39.99 ± 2.12 a | 2.67 | 45.18 ± 4.06 a | 15.99 |
| GLP-1 AUC = 0–210 (pg*min/mL) 3 | 10,345 ± 726 a | 12,973 ± 668 ab | 25.40 | 14,731 ± 825 bc | 42.397 | 17,357 ± 1050 c | 67.78 |
| Plasma GLP-1 at 330 min (pg/mL) 3 | 52.9 ± 4.14 a | 56.71 ± 4.75 a | 7.20 | 59.93 ± 6 a | 13.28 | 79.83 ± 6.55 b | 50.90 |
| Fasting plasma PYY (pg/mL) 3 | 47.1 ± 3.57 a | 43.65 ± 3.04 a | −7.32 | 43.3 ± 3.21 a | −8.06 | 42.55 ± 3.72 a | −9.66 |
| PYY AUC = 0–210 (pg*min/mL) 3 | 10,066 ± 802 a | 11,068 ± 597 ab | 9.95 | 12,594 ± 1187 bc | 25.11 | 13,972 ± 893 c | 38.80 |
| Plasma PYY at 330 min (pg/mL) 3 | 43.6 ± 2.08 a | 44.48 ± 3.52 a | 2.01 | 45.06 ± 3.12 a | 3.34 | 58.33 ± 4.09 b | 33.78 |
| Fasting plasma GIP (pg/mL) 4 | 134.1 ± 18 a | 154 ± 17.4 a | 14.83 | 160.8 ± 25.3 a | 19.91 | 119.4 ± 11.5 a | −10.96 |
| GIP AUC = 0–210 (pg*min/mL) 4 | 51,723 ± 4651 a | 98,274 ± 13,425 bc | 90.00 | 133,403 ± 13,243 c | 157.91 | 77,645 ± 8641 ab | 50.11 |
| Plasma GIP at 330 min (pg/mL) 4 | 354.2 ± 125 a | 338.8 ± 139 a | −4.34 | 349.7 ± 178 a | −1.27 | 363.8 ± 175 a | 2.71 |
Publisher’s Note: MDPI stays neutral with regard to jurisdictional claims in published maps and institutional affiliations. |
© 2021 by the authors. Licensee MDPI, Basel, Switzerland. This article is an open access article distributed under the terms and conditions of the Creative Commons Attribution (CC BY) license (http://creativecommons.org/licenses/by/4.0/).
Share and Cite
Hossain, M.M.; Tovar, J.; Cloetens, L.; Florido, M.T.S.; Petersson, K.; Prothon, F.; Nilsson, A. Oat Polar Lipids Improve Cardiometabolic-Related Markers after Breakfast and a Subsequent Standardized Lunch: A Randomized Crossover Study in Healthy Young Adults. Nutrients 2021, 13, 988. https://0-doi-org.brum.beds.ac.uk/10.3390/nu13030988
Hossain MM, Tovar J, Cloetens L, Florido MTS, Petersson K, Prothon F, Nilsson A. Oat Polar Lipids Improve Cardiometabolic-Related Markers after Breakfast and a Subsequent Standardized Lunch: A Randomized Crossover Study in Healthy Young Adults. Nutrients. 2021; 13(3):988. https://0-doi-org.brum.beds.ac.uk/10.3390/nu13030988
Chicago/Turabian StyleHossain, Mohammad Mukul, Juscelino Tovar, Lieselotte Cloetens, Maria T. Soria Florido, Karin Petersson, Frederic Prothon, and Anne Nilsson. 2021. "Oat Polar Lipids Improve Cardiometabolic-Related Markers after Breakfast and a Subsequent Standardized Lunch: A Randomized Crossover Study in Healthy Young Adults" Nutrients 13, no. 3: 988. https://0-doi-org.brum.beds.ac.uk/10.3390/nu13030988