Correction: Shrapnel, W.S.; Butcher, B.E. Sales of Sugar-Sweetened Beverages in Australia: A Trend Analysis from 1997 to 2018. Nutrients 2020, 12, 1016


| Beverage Category | Per Capita Volume Sales 1997 (L/Person) | Per Capita Volume Sales 2009 (L/Person) | Per Capita Volume Sales 2018 (L/Person) | Volume Share 1997 (%) * | Volume Share 2018 (%) * | Percentage Change per Capita Volume Sales 2009–2018 (%) | Annual Growth Rate 2009–2018 (%) | Percentage Change per Capita Volume Sales 1997–2018 (%) | Annual Growth Rate 1997–2018 (%) |
|---|---|---|---|---|---|---|---|---|---|
| All water-based beverages * | |||||||||
| Total | 130.86 | 129.61 | 149.42 | 100.00 | 100.00 | 0.67 | 1.53 | 14.18 | 0.64 |
| SSB | 83.16 | 74.40 | 61.04 | 63.54 | 40.85 | −0.82 | −1.80 | −26.59 | −1.21 |
| Non-SSB | 47.71 | 55.21 | 88.38 | 36.45 | 59.15 | 3.27 | 6.01 | 85.26 | 3.88 |
| Carbonated soft drinks | |||||||||
| Total | 98.54 | 91.62 | 70.58 | 75.30 | 47.24 | −0.79 | −2.30 | −28.37 | −1.29 |
| SSB | 75.78 | 62.51 | 44.62 | 57.91 | 29.86 | −1.69 | −2.86 | −41.13 | −1.87 |
| Non-SSB | 22.76 | 29.12 | 25.97 | 17.39 | 17.37 | 2.21 | −1.08 | 14.08 | 0.64 |
| Energy drinks | |||||||||
| Total | 0.14 | 3.56 | 6.36 | 0.11 | 1.33 | 81.39 | 7.86 | 4374.72 | 198.85 |
| SSB | 0.14 | 3.30 | 5.44 | 0.11 | 1.16 | 73.61 | 6.50 | 3728.39 | 169.47 |
| Non-SSB | 0.00 | 0.26 | 0.92 | 0.00 | 0.17 | NC | 25.07 | NC | NC |
| Sports drinks | |||||||||
| Total | 1.48 | 2.79 | 3.97 | 1.13 | 2.66 | 7.29 | 4.24 | 168.25 | 7.65 |
| SSB | 1.48 | 2.70 | 3.78 | 1.13 | 2.53 | 7.18 | 4.03 | 156.05 | 7.09 |
| Non-SSB | 0.00 | 0.09 | 0.19 | 0.00 | 0.13 | 61.48 | 10.57 | 6478.99 | 294.50 |
| Iced tea | |||||||||
| Total | 0.15 | 1.30 | 1.99 | 0.16 | 1.26 | 44.84 | 5.30 | 1217.43 | 55.34 |
| SSB | 0.15 | 1.15 | 1.73 | 0.16 | 0.78 | 39.36 | 5.09 | 1043.63 | 47.44 |
| Non-SSB | 0.00 | 0.16 | 0.26 | 0 | 0.56 | NC | 6.88 | NC | NC |
| Mineral waters | |||||||||
| Total | 5.00 | 4.49 † | 9.02 † | 3.82 | 6.03 † | −0.58 | 10.08 | 80.47 | 3.66 |
| SSB | 2.17 | 1.49 | 1.88 | 1.66 | 1.26 | −2.27 | 2.61 | −13.47 | −0.61 |
| Non-SSB | 2.82 | 0.80 | 1.17 | 2.61 | 2.01 | −6.02 | 4.51 | −58.65 | −2.67 |
| Mixers | |||||||||
| Total | 7.97 | 7.24 | 8.36 | 6.09 | 5.59 | −0.07 | 1.55 | 4.89 | 0.22 |
| SSB | 3.41 | 2.48 | 3.01 | 2.61 | 2.01 | 9.14 | 2.11 | −11.88 | −0.54 |
| Non-SSB | 4.55 | 4.75 | 5.35 | 3.48 | 3.58 | −6.98 | 1.25 | 17.47 | 0.79 |
| Unflavoured pure waters | |||||||||
| Total | 11.81 | 20.02 | 53.88 | 9.02 | 36.06 | 4.32 | 16.91 | 356.33 | 16.20 |
| Still | 5.76 | 17.83 | 47.91 | 4.41 | 32.57 | 14.32 | 16.88 | 732.37 | 33.29 |
| Sparkling | - | 2.19 | 5.97 | - | 3.99 | NC | 17.21 | NC | NC |
| Flavoured Milks | |||||||||
| Total | - | 6.06 | 9.48 | - | - | 56.42 | 5.64 | NC | NC |
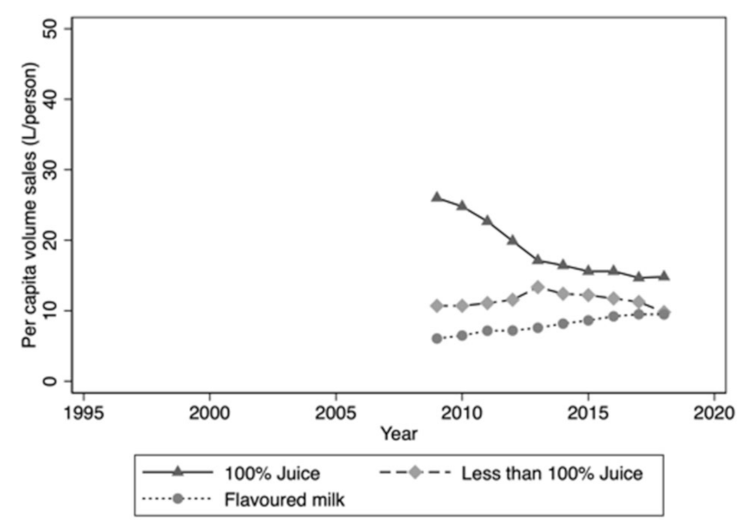
| Juice | |||||||||
| Total | - | 362.59 | 230.75 | - | - | −36.36 | −3.64 | NC | NC |
| 100% Juice | - | 257.21 | 133.83 | - | - | −47.97 | −4.80 | NC | NC |
| Less than 100% Juice | - | 105.38 | 96.93 | - | - | −8.03 | −0.80 | NC | NC |
| Kombucha | |||||||||
| Total | - | 0.00 | 0.47 | - | - | NC | NC | NC | NC |
| Beverage Category | Per Capita Volume Sales 1997 (L/Person) | Per Capita Volume Sales 2009 (L/Person) | Per Capita Volume Sales 2018 (L/Person) | Volume Share 1997 (%) * | Volume Share 2018 (%) * | Percentage Change per Capita Volume Sales 2009–2018 (%) | Annual Growth Rate 2009–2018 (%) | Percentage Change per Capita Volume Sales 1997–2018 (%) | Annual Growth Rate 1997–2018 (%) |
|---|---|---|---|---|---|---|---|---|---|
| All water-based beverages * | |||||||||
| Total | 130.86 | 129.61 | 149.42 | 100.00 | 100.00 | 0.67 | 1.53 | 14.18 | 0.64 |
| SSB | 83.16 | 74.40 | 61.04 | 63.54 | 40.85 | −0.82 | −1.80 | −26.59 | −1.21 |
| Non-SSB | 47.71 | 55.21 | 88.38 | 36.45 | 59.15 | 3.27 | 6.01 | 85.26 | 3.88 |
| Carbonated soft drinks | |||||||||
| Total | 98.54 | 91.62 | 70.58 | 75.30 | 47.24 | −0.79 | −2.30 | −28.37 | −1.29 |
| SSB | 75.78 | 62.51 | 44.62 | 57.91 | 29.86 | −1.69 | −2.86 | −41.13 | −1.87 |
| Non-SSB | 22.76 | 29.12 | 25.97 | 17.39 | 17.37 | 2.21 | −1.08 | 14.08 | 0.64 |
| Energy drinks | |||||||||
| Total | 0.14 | 3.56 | 6.36 | 0.11 | 1.33 | 81.39 | 7.86 | 4374.72 | 198.85 |
| SSB | 0.14 | 3.30 | 5.44 | 0.11 | 1.16 | 73.61 | 6.50 | 3728.39 | 169.47 |
| Non-SSB | 0.00 | 0.26 | 0.92 | 0.00 | 0.17 | NC | 25.07 | NC | NC |
| Sports drinks | |||||||||
| Total | 1.48 | 2.79 | 3.97 | 1.13 | 2.66 | 7.29 | 4.24 | 168.25 | 7.65 |
| SSB | 1.48 | 2.70 | 3.78 | 1.13 | 2.53 | 7.18 | 4.03 | 156.05 | 7.09 |
| Non-SSB | 0.00 | 0.09 | 0.19 | 0.00 | 0.13 | 61.48 | 10.57 | 6478.99 | 294.50 |
| Iced tea | |||||||||
| Total | 0.15 | 1.30 | 1.99 | 0.16 | 1.26 | 44.84 | 5.30 | 1217.43 | 55.34 |
| SSB | 0.15 | 1.15 | 1.73 | 0.16 | 0.78 | 39.36 | 5.09 | 1043.63 | 47.44 |
| Non-SSB | 0.00 | 0.16 | 0.26 | 0 | 0.56 | NC | 6.88 | NC | NC |
| Mineral waters | |||||||||
| Total | 5.00 | 4.49† | 9.02† | 3.82 | 6.03† | −0.58 | 10.08 | 80.47 | 3.66 |
| SSB | 2.17 | 1.49 | 1.88 | 1.66 | 1.26 | −2.27 | 2.61 | −13.47 | −0.61 |
| Non-SSB | 2.82 | 0.80 | 1.17 | 2.61 | 2.01 | −6.02 | 4.51 | −58.65 | −2.67 |
| Mixers | |||||||||
| Total | 7.97 | 7.24 | 8.36 | 6.09 | 5.59 | −0.07 | 1.55 | 4.89 | 0.22 |
| SSB | 3.41 | 2.48 | 3.01 | 2.61 | 2.01 | 9.14 | 2.11 | −11.88 | −0.54 |
| Non-SSB | 4.55 | 4.75 | 5.35 | 3.48 | 3.58 | −6.98 | 1.25 | 17.47 | 0.79 |
| Unflavoured pure waters | |||||||||
| Total | 11.81 | 20.02 | 53.88 | 9.02 | 36.06 | 4.32 | 16.91 | 356.33 | 16.20 |
| Still | 5.76 | 17.83 | 47.91 | 4.41 | 32.57 | 14.32 | 16.88 | 732.37 | 33.29 |
| Sparkling | - | 2.19 | 5.97 | - | 3.99 | NC | 17.21 | NC | NC |
| Flavoured Milks | |||||||||
| Total | - | 6.06 | 9.48 | - | - | 56.42 | 5.64 | NC | NC |
| Juice | |||||||||
| Total | - | 36.70 | 24.62 | - | - | −32.92 | −3.29 | NC | NC |
| 100% Juice | - | 26.0 | 18.82 | - | - | −43.02 | −4.30 | NC | NC |
| Less than 100% Juice | - | 10.69 | 9.80 | - | - | −8.34 | −0.83 | NC | NC |
| Kombucha | |||||||||
| Total | - | 0.00 | 0.47 | - | - | NC | NC | NC | NC |


Funding
Institutional Review Board Statement
Informed Consent Statement
Data Availability Statement
Conflicts of Interest
Reference
- Shrapnel, W.S.; Butcher, B.E. Sales of Sugar-Sweetened Beverages in Australia: A Trend Analysis from 1997 to 2018. Nutrients 2020, 12, 1016. [Google Scholar] [CrossRef] [PubMed] [Green Version]
Publisher’s Note: MDPI stays neutral with regard to jurisdictional claims in published maps and institutional affiliations. |
© 2021 by the authors. Licensee MDPI, Basel, Switzerland. This article is an open access article distributed under the terms and conditions of the Creative Commons Attribution (CC BY) license (https://creativecommons.org/licenses/by/4.0/).
Share and Cite
Shrapnel, W.S.; Butcher, B.E. Correction: Shrapnel, W.S.; Butcher, B.E. Sales of Sugar-Sweetened Beverages in Australia: A Trend Analysis from 1997 to 2018. Nutrients 2020, 12, 1016. Nutrients 2021, 13, 1356. https://0-doi-org.brum.beds.ac.uk/10.3390/nu13041356
Shrapnel WS, Butcher BE. Correction: Shrapnel, W.S.; Butcher, B.E. Sales of Sugar-Sweetened Beverages in Australia: A Trend Analysis from 1997 to 2018. Nutrients 2020, 12, 1016. Nutrients. 2021; 13(4):1356. https://0-doi-org.brum.beds.ac.uk/10.3390/nu13041356
Chicago/Turabian StyleShrapnel, William S., and Belinda E. Butcher. 2021. "Correction: Shrapnel, W.S.; Butcher, B.E. Sales of Sugar-Sweetened Beverages in Australia: A Trend Analysis from 1997 to 2018. Nutrients 2020, 12, 1016" Nutrients 13, no. 4: 1356. https://0-doi-org.brum.beds.ac.uk/10.3390/nu13041356